Embed Size (px)
Citation preview
Oregon Department of Fish and Wildlife
Big Game Statistics: Deer
10
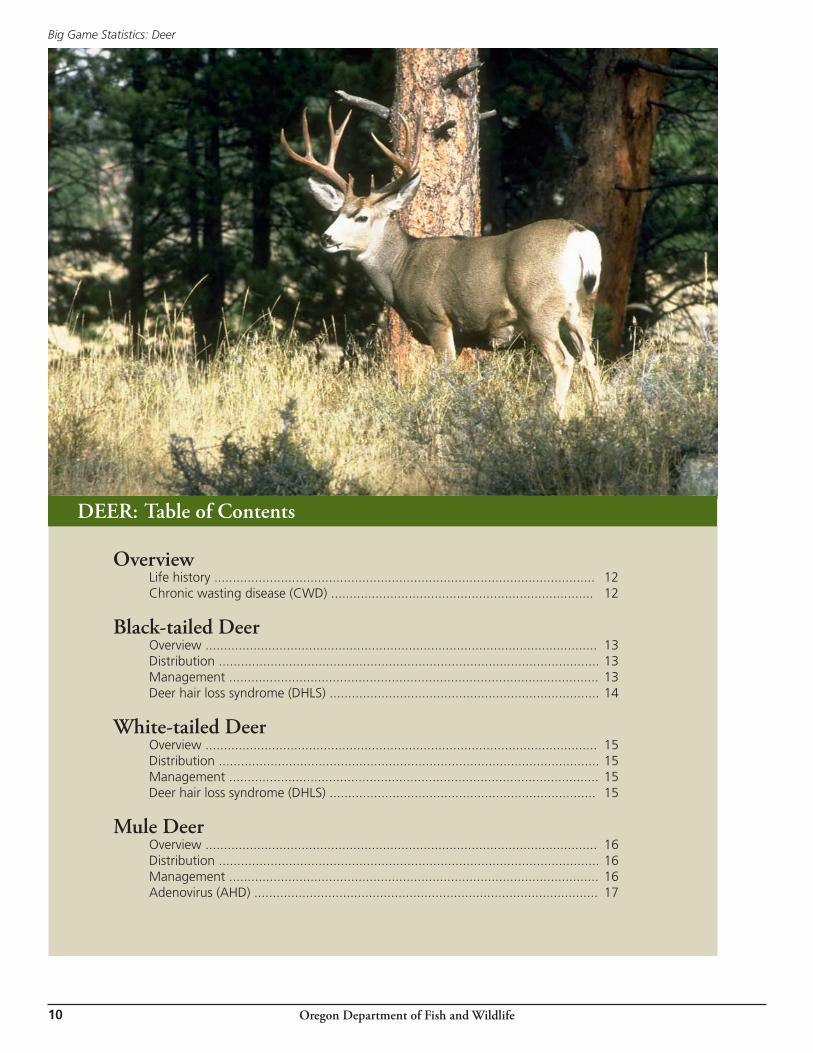
DEER: Table of Contents
OverviewLife history ....................................................................................................... 12Chronic wasting disease (CWD) ....................................................................... 12
Black-tailed DeerOverview .......................................................................................................... 13Distribution ....................................................................................................... 13Management .................................................................................................... 13Deer hair loss syndrome (DHLS) ......................................................................... 14
White-tailed DeerOverview .......................................................................................................... 15Distribution ....................................................................................................... 15Management .................................................................................................... 15Deer hair loss syndrome (DHLS) ........................................................................ 15
Mule DeerOverview .......................................................................................................... 16Distribution ....................................................................................................... 16Management ..................................................................................................... 16Adenovirus (AHD) ............................................................................................. 17
Oregon Department of Fish and Wildlife
Big Game Statistics: Deer
11
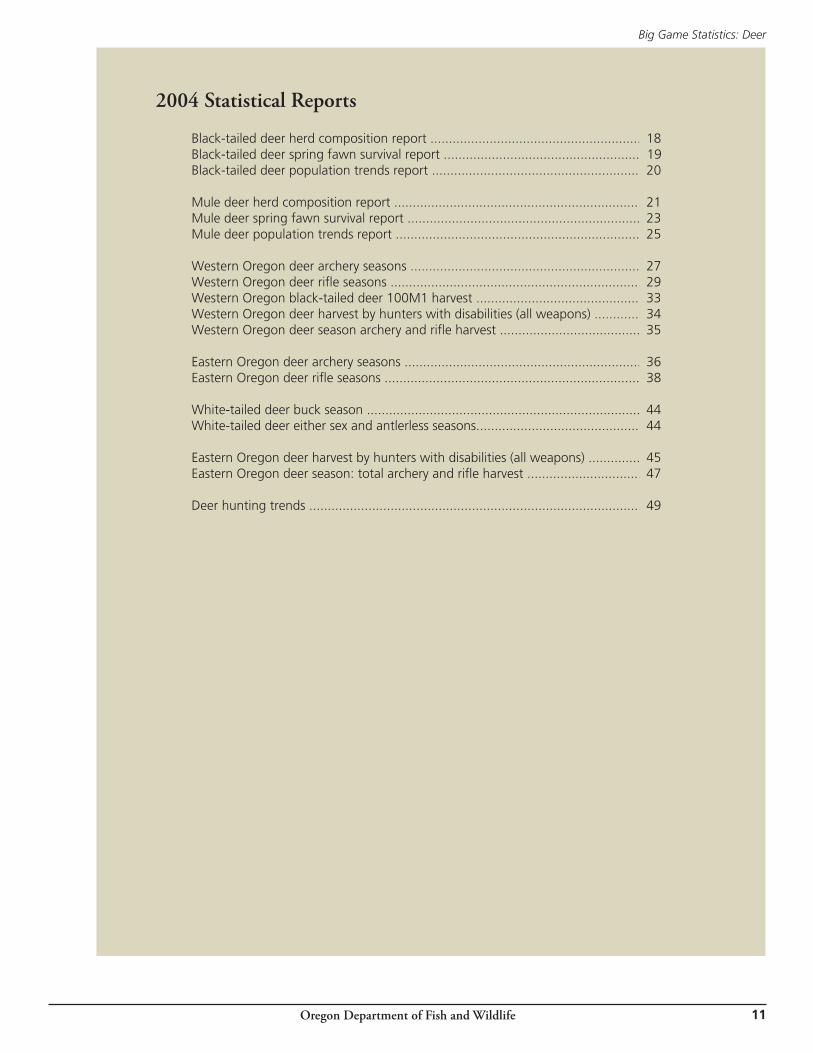
2004 Statistical Reports
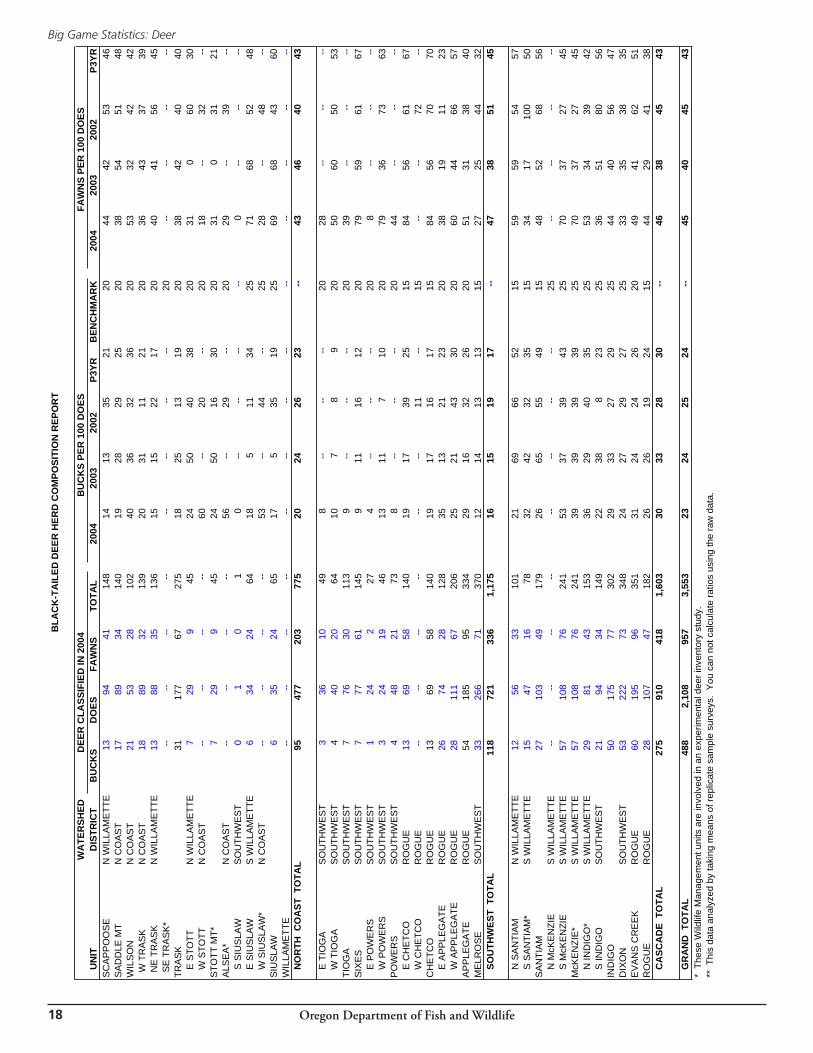
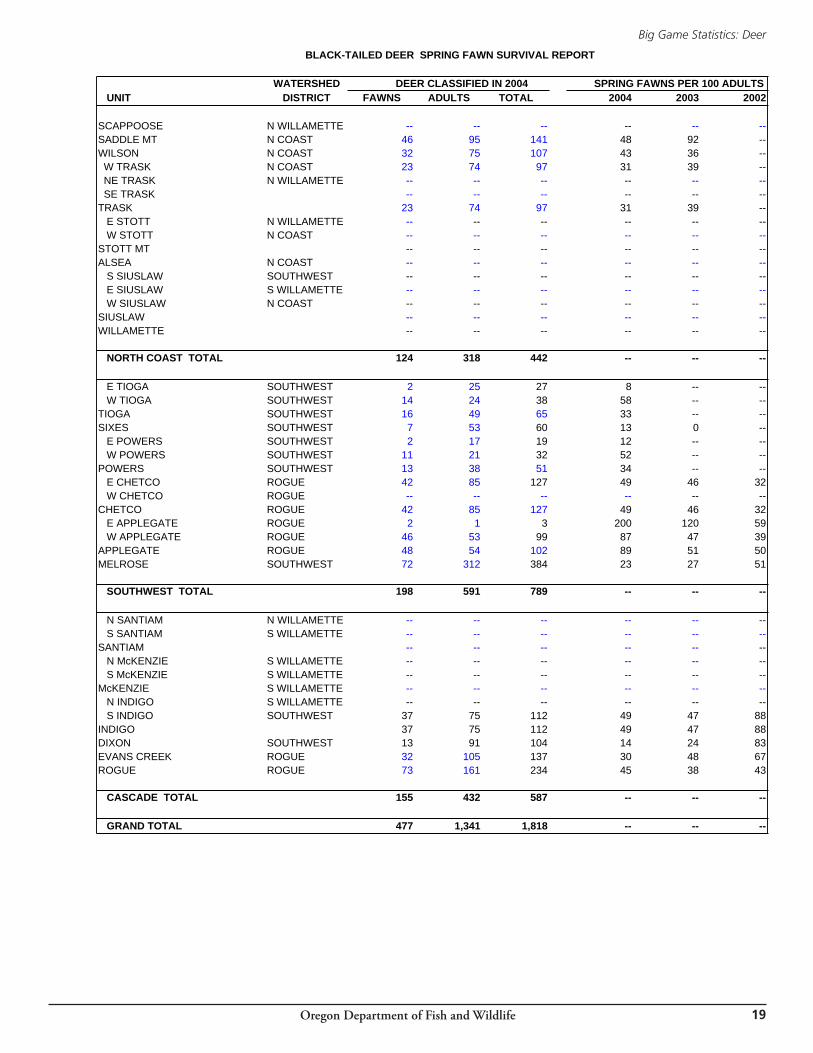
Black-tailed deer herd composition report .......................................................... 18Black-tailed deer spring fawn survival report ...................................................... 19Black-tailed deer population trends report ......................................................... 20
Mule deer herd composition report ................................................................... 21Mule deer spring fawn survival report ............................................................... 23Mule deer population trends report .................................................................. 25
Western Oregon deer archery seasons .............................................................. 27Western Oregon deer rifle seasons .................................................................... 29Western Oregon black-tailed deer 100M1 harvest ............................................ 33Western Oregon deer harvest by hunters with disabilities (all weapons) ............. 34Western Oregon deer season archery and rifle harvest ...................................... 35
Eastern Oregon deer archery seasons ................................................................ 36Eastern Oregon deer rifle seasons ...................................................................... 38
White-tailed deer buck season .......................................................................... 44White-tailed deer either sex and antlerless seasons.............................................. 44
Eastern Oregon deer harvest by hunters with disabilities (all weapons) .............. 45Eastern Oregon deer season: total archery and rifle harvest ............................... 47
Deer hunting trends .......................................................................................... 49
Oregon Department of Fish and Wildlife
Big Game Statistics: Deer
1�
Overview
Life History
The basic life histories of Oregon’s deer species (Columbia black-tailed deer, Columbia
and Northwest (Idaho) white-tailed deer, and mule deer) are all very similar. The rut, or
breeding season, extends from late October through early December. Fawns are born
about 7 months later, usually in late May through mid-June. Adult does typically pro-
duce twins each year in good habitat. Fawns are spotted with white; the spotted pelage
usually is molted by September. Fawns are left alone for long periods during the early
weeks of life to avoid drawing the attention of predators. Fawn survival to breeding age
largely determines the growth or decline of deer populations. Major factors contribut-
ing to mortality include nutrition, weather, habitat quality, predation, and accidents,
among others. Females typically live longer than bucks even in unhunted populations.
Does can live to 15 years or more; bucks seldom live more than 9 years. Male mortality
rates are higher because of stress and fighting during the rut, and, of course, hunting.
Competition with other males to breed expends high levels of energy that results in loss
of body fat, so bucks enter winter in poorer condition than does.
Deer both graze and browse. Forbs and browse (stems and leaves of woody plants) are
favored forage during the growing season. Grasses are consumed during some seasons.
In many areas, the availability of forage is strongly associated with logging or fire, which
create favorable forage conditions.
Chronic Wasting Disease (CWD)
Chronic Wasting Disease (CWD) is a transmissible spongiform encephalopathy (TSE)
affecting members of the deer family. CWD has not been detected in any Oregon
samples obtained since testing began in 1996. However, because a large number of
samples is required to statistically know whether CWD is present or absent in wild
populations, the department continues to test for CWD from hunter harvested deer
and elk. Field staff also opportunistically sample animals dying from other causes such
as road kill. Since 2002, the department has attempted to collect a minimum 1,000
samples each year from deer and elk distributed throughout the state. Regulations are
in place to help prevent CWD from being brought to Oregon from animals harvested in
CWD states (see regulations).
Oregon Department of Fish and Wildlife3406 Cherry Ave NE
Salem, OR 97303
www.dfw.state.or.us
Dee
r
Oregon Department of Fish and Wildlife
Big Game Statistics: Deer
1�
Black-tailed Deer
Columbian black-tailed deer (Odocoileus hemionus
columbianus) make their home in the timber and
heavy brush of western Oregon. The population level
is largely dependent on habitat quality and quantity.
In western Oregon black-tailed deer are typically
found in brushy areas at the edges of forests and
chaparral thickets, not in dense forests. Recently dis-
turbed habitats such as clearcuts or burns, with their
characteristic grasses, forbs, and shrubs, are condu-
cive to healthy deer populations.
Blacktails are usually smaller and darker than mule
deer. The most distinguishing feature is the tail.
Although not as long or wide as that of the white-
tail, it is much larger than that of the mule deer. The
underside of the tail is covered with white hair while
the top portion is black or brownish. Antler points of
the bucks usually branch in pairs and the brow tine or
eye guard is of medium length, if present.
Distribution
Columbian black-tailed deer primarily inhabit that
portion of the state west of the Cascade summit.
These deer are frequently found in groups led by an
older female. They concentrate their daily activities
around dawn and dusk. The home range of non-mi-
gratory deer may be less than 100 acres, but can be
as large as 600 acres in less favorable habitat.
Most blacktails that summer in the high Cascades
winter at lower elevations on the west slope. Some
wintering occurs east of the Cascade crest, especially
in the Mt. Hood, Metolius, and Klamath Lake areas.
Both the larger bucks and highest deer populations
are found in burned and logged areas where food
supplies are abundant. Areas that provide openings
next to older stands of trees make food and cover
easily accessible to deer.
Management
Winter loss of black-tailed deer is generally far less
than for mule deer. Typically, snow does not remain
on the valley floors for extended periods, nor does
it form a crust on the surface as can happen on the
east side of the Cascades. If winter losses do occur,
herds can recover and increase quickly where forage
is abundant. Generally, hunting has less effect on
black-tail populations than on mule deer due to the
dense vegetation that provides excellent hiding and
escape cover.
Deer damage to forest plantations and agriculture
crops adjacent to timbered areas can require hunts
to reduce localized or unit-wide populations. Travel
management areas partially funded by ODFW on pri-
vate timberlands are helping to keep some areas open
to public hunting by providing road closures and law
enforcement.
Annual inventory consists of driving specific measured
routes, shining spotlights into timber and clearcut
units, and counting and classifying deer. These routes
provide a measure of trends over time. Routes must
be altered periodically as clearcuts mature and others
are created nearby. Buck and fawn ratios are record-
ed to provide information on buck escapement and
fawn recruitment. Formal Management Objectives
(MOs) have not been set for blacktails. Population
information is compared to “benchmarks” for indi-
vidual units. Benchmarks are management guidelines
similar to MOs but have not been adopted by the
Oregon Department of Fish and Wildlife3406 Cherry Ave NE
Salem, OR 97303
www.dfw.state.or.us
Dee
r
Oregon Department of Fish and Wildlife
Big Game Statistics: Deer
1�
Commission. The Department will begin working on a
Black-tailed Deer Management Plan in 2005, MOs will
be developed during the planning process.
Deer Hair Loss Syndrome (DHLS)
Deer Hair Loss Syndrome (DHLS) is a condition af-
fecting both black-tailed and Columbian white-tailed
deer. First described in Western Washington in 1996,
DHLS has now moved southward through western
Oregon to northern California. The condition produc-
es hair discoloration, hair loss, weight loss, diarrhea,
and lethargy. The syndrome can ultimately result in
the death of some animals, primarily from exposure.
Deer with DHLS have abnormally heavy infestations
of lice, which have been identified as an exotic spe-
cies. Fawns are impacted more than adults resulting
in poor recruitment and low survival in some areas.
Surveys using standardized methods are conducted
in the spring to assess the prevalence of DHLS. DHLS
prevalence varies considerably by management unit
but the proportion of deer with DHLS appears highest
in the Stott Mountain, Alsea, and Siuslaw units.
The Oregon Department of Fish and Wildlife con-
tinues to support and monitor research activities
focusing on DHLS. Research on DHLS was initiated in
2003 through a cooperative effort with Oregon State
University, USDA-APHIS-VS, and the Department. The
2-year study ending in June 2005 will evaluate trans-
mission potential between black-tailed deer and mule
deer, and describe the progression of the syndrome
within individual deer. The study facility is located
at ODFW’s E.E. Wilson Wildlife Area. In addition to
contributing funds for the project, the department
also provided volunteers and employees to assist with
the study.
Oregon Department of Fish and Wildlife
Big Game Statistics: Deer
1�
White-tailed Deer
The most distinguishing feature of white-tailed deer is
the tail. Whitetails have long, wide tails that can easily
be seen, especially when they raise their tails when
startled. White-tailed deer antlers differ from mule
and black-tailed deer in that there is one main beam
with points coming off. Mule and black-tailed deer
have antlers that fork on the main beam.
Distribution
Two subspecies of white-tailed deer occur in Oregon.
Populations of the Columbian white-tailed deer (O.
virginianus leucurus) are found in the Umpqua River
Basin near Roseburg, on a series of Columbia River is-
lands in Oregon and Washington, and on the Oregon
and Washington mainlands along the lower Columbia
River.
The other whitetail in Oregon is often called the
Northwest (Idaho) whitetail (O. v. ochrourus). High-
est densities of this subspecies occur in northeastern
Oregon, particularly in Union, Wallowa, and Umatilla
counties.
Management
Columbia white-tailed deer were listed as a federally
endangered species in 1968, and listed by Oregon
in 1987. The Columbia River population is still listed
under the federal Endangered Species Act (ESA).
However, the Roseburg population was de-listed by
Oregon in 1995 and by the U.S. Fish and Wildlife
Service in 2003. The current Roseburg population
estimate is about 6,400. For the first time in almost
40 years, there will be a hunting season for Colum-
bian white-tailed deer during the fall of 2005. There
will be a controlled hunt in the Roseburg area with
twenty tags authorized. In addition, landowner pref-
erence tags will be available to landowners with more
than 40 acres within the hunt area.
Populations of the Northwest (Idaho) whitetail are
thriving in areas with suitable habitat: typically heavy
shrub patches and thick riparian vegetation. Although
expanding to the south and west, their preference
for heavy cover has limited their distribution. A few
hunts are designed specifically to harvest whitetails
and these can provide some unique and exciting op-
portunities.
Deer Hair Loss Syndrome (DHLS)
Columbian white-tailed deer are susceptible to DHLS.
A discussion of DHLS is included in the black-tailed
deer section.
Oregon Department of Fish and Wildlife
Big Game Statistics: Deer
1�
Mule Deer
Rocky Mountain mule deer (Odocoileus hemionus
hemionus) are native to eastern Oregon. The mule
deer is the larger member of the genus in Oregon.
Explorers in the early 1800s reported a scarcity of big
game, but 20 years later gold miners found abundant
deer herds. This century has seen similar fluctuations.
Scientific studies of the 1930s reported that between
1926 and 1933 Oregon’s mule deer population
ranged from 39,000 to 75,000 animals. The esti-
mated population in 2004 was 247,350, which was
29 percent below the revised statewide management
objective of 347,400 mule deer adopted June 2005.
Mule deer populations have been generally declining
throughout western North America during the last
several years.
Distribution
Mule deer occupy a wide range of habitat types;
some live in desert shrub, steppe, some in woodlands,
and some in conifer forests. In general, however,
mule deer occupy the more open, rugged areas.
Although mule deer commonly are considered to be
“browsers”, they consume a wide variety of plant
materials and in some seasons graze extensively.
During summer, deer are scattered over much of east-
ern Oregon. Winter weather forces deer to migrate to
lower elevations. In winter, the critical period of life
for the mule deer, new growth of twigs of shrubs and
trees is browsed, especially that of species high in fat
content. Sagebrush, bitterbrush, rabbit-brush, juniper,
and mountain-mahogany, are among those typically
browsed.
In the most productive winter ranges of central and
southeastern Oregon, favorite shrubs such as bit-
terbrush and mountain mahogany stand above the
snow, in typical years, providing food and shelter. The
sagebrush plateau areas of Lake, Harney, and Mal-
heur counties support lower densities of deer. Some
ranges in northeastern Oregon lack suitable shrub
habitat critical in severe winters.
Management
Mule deer surveys are normally conducted twice an-
nually. Herd composition counts are conducted dur-
ing November and December and again along with
spring trend counts during March and April. Deer are
classified as bucks, does, and fawns to calculate ratios
of bucks, fawns, and does in each management unit.
Buck ratios measure post-hunting season survival
of bucks and indicate numbers and age classes of
bucks available for breeding. Post-season buck ratios
are compared to the buck ratio MO for each unit to
determine if the objective is being met.
In order to measure effects of weather, predation,
poaching, and hunting seasons on deer herds, it is
necessary to conduct periodic population inventories.
Trend counts are conducted during March and April
and are used to measure overwinter survival of popu-
lations. They are made along the same routes or areas
each year and are traveled by vehicle, horseback, air-
craft, or on foot. All observed deer are counted, and
the number is compared to the previous year’s infor-
mation to determine if populations have increased or
decreased. Deer are capable of increasing or decreas-
ing very quickly depending on the circumstances.
The fall fawn ratio is used to determine numbers of
fawns present in populations before winter. During
spring counts, deer are classified as adults or fawns
Oregon Department of Fish and Wildlife
Big Game Statistics: Deer
1�
and a ratio of fawns per 100 adults is calculated.
Spring fawn ratios are compared to fall herd composi-
tion to estimate the number of fawns entering the
population (recruitment), a critical factor in measuring
mule deer productivity.
All of the information collected is used to simulate
yearly gains and losses through computer modeling.
Mule deer tag numbers are adjusted annually and
allocated by controlled hunt only. Total population
management objectives (MOs) for each unit were set
in 2005 by Commission action and are considered
maximums. MOs are scheduled to be reviewed every
5 years and may be adjusted up or down to meet
changing conditions. In addition, post-season MOs
were set for buck ratios. There are 3 strategies used
to determine tag numbers based on buck ratios:
Units that are managed to provide maximum hunter recreation, and generally have historical-ly high recruitment and herd productivity, have a minimum buck ratio MO of 12 bucks per 100 does post-season. About 60% of the buck harvest in these units will be yearling bucks. Fifteen of 50 management units or subunits fall in this category.
To provide a better chance of bagging an older age-class buck under somewhat less crowded conditions, 27 units are managed for minimum post-season buck ratio of 15 bucks per 100 does. Fewer tags are available in these units, but harvest will typically include 40 to 60% bucks 2.5 years or older.
Quality hunting experiences under uncrowded condi-
tions are possible in the 8 units with buck ratio MOs
of 25 bucks per 100 does. Hunting conditions will
generally be uncrowded, and most harvest should
be mature bucks. More information on mule deer
management can be found in Oregon’s Mule Deer
Management Plan, which is on the Department’s
website.
▪
▪
Adenovirus (AHD)
Adenovirus (AHD) is one of three viral hemorrhagic
diseases known to affect deer. Deer have tested posi-
tive for the disease based on serum antibody titers in
23 Oregon big game units throughout the state since
2003. In May 2002, the department confirmed AHD
was causing an “all age and sex” mule deer die-off
in and around Crooked River Ranch in the Metolius
unit. Additional monitoring and testing indicated the
disease had spread as far south as Sun River in the
Upper Deschutes unit and into the eastern portion
of the Grizzly unit. The department estimated that
approximately 500 mule deer died prior to Nov.–Dec.
2002 when the main outbreak subsided.
Deer exposure to AHD continues to cause mortality
in the affected area. Unfortunately, there is little that
can be done to prevent or cure the disease. In an
increased effort to monitor the disease, the Depart-
ment is continuing with surveillance and instituted
special carcass disposal restrictions. Any animal show-
ing symptoms of the disease is collected for testing
and disposed of within the outbreak area to insure
no further spread. Although many variables may be
interacting to cause the observed decline, AHD likely
has been a major factor. The department will con-
tinue to monitor health of mule deer in this area.
Oregon Department of Fish and Wildlife
Big Game Statistics: Deer
1�
WA
TER
SHED
D
EER
CLA
SSIF
IED
IN 2
004
B
UC
KS
PER
100
DO
ESFA
WN
S PE
R 1
00 D
OES
U
NIT
DIS
TRIC
TB
UC
KS
DO
ESFA
WN
S T
OTA
L20
0420
0320
02P3
YRB
ENC
HM
AR
K20
0420
0320
02P3
YRS
CA
PP
OO
SE
N W
ILLA
ME
TTE
1394
4114
814
1335
2120
4442
5346
SA
DD
LE M
TN
CO
AS
T17
8934
140
1928
2925
2038
5451
48W
ILS
ON
N C
OA
ST
2153
2810
240
3632
3620
5332
4242
W T
RA
SK
N C
OA
ST
1889
3213
920
3111
2120
3643
3739
NE
TR
AS
KN
WIL
LAM
ETT
E13
8835
136
1515
2217
2040
4156
45 S
E T
RA
SK
*--
----
----
----
--20
----
----
TRA
SK
3117
767
275
1825
1319
2038
4240
40
E S
TOTT
N W
ILLA
ME
TTE
729
945
2450
4038
2031
060
30
W S
TOTT
N C
OA
ST
----
----
60--
20--
2018
--32
--S
TOTT
MT*
729
945
2450
1630
2031
031
21A
LSE
A*
N C
OA
ST
----
----
56--
29--
2029
--39
--
S S
IUS
LAW
SO
UTH
WE
ST
01
01
0--
----
--0
----
--
E S
IUS
LAW
S W
ILLA
ME
TTE
634
2464
185
1134
2571
6852
48
W S
IUS
LAW
*N
CO
AS
T--
----
--53
--44
--25
28--
48--
SIU
SLA
W6
3524
6517
535
1925
6968
4360
WIL
LAM
ETT
E--
----
----
----
----
----
----
N
OR
TH C
OA
ST T
OTA
L95
477
203
775
2024
2623
--43
4640
43
E
TIO
GA
SO
UTH
WE
ST
336
1049
8--
----
2028
----
--
W T
IOG
AS
OU
THW
ES
T4
4020
6410
78
920
5060
5053
TIO
GA
SO
UTH
WE
ST
776
3011
39
----
--20
39--
----
SIX
ES
SO
UTH
WE
ST
777
6114
59
1116
1220
7959
6167
E
PO
WE
RS
SO
UTH
WE
ST
124
227
4--
----
208
----
--
W P
OW
ER
SS
OU
THW
ES
T3
2419
4613
117
1020
7936
7363
PO
WE
RS
SO
UTH
WE
ST
448
2173
8--
----
2044
----
--
E C
HE
TCO
RO
GU
E13
6958
140
1917
3925
1584
5661
67
W C
HE
TCO
RO
GU
E--
----
----
--11
--15
----
72--
CH
ETC
OR
OG
UE
1369
5814
019
1716
1715
8456
7070
E
AP
PLE
GA
TER
OG
UE
2674
2812
835
1321
2320
3819
1123
W
AP
PLE
GA
TER
OG
UE
2811
167
206
2521
4330
2060
4466
57A
PP
LEG
ATE
RO
GU
E54
185
9533
429
1632
2620
5131
3840
ME
LRO
SE
SO
UTH
WE
ST
3326
671
370
1214
1313
1527
2544
32
SOU
THW
EST
TO
TAL
118
721
336
1,17
516
1519
17--
4738
5145
N
SA
NTI
AM
N W
ILLA
ME
TTE
1256
3310
121
6966
5215
5959
5457
S
SA
NTI
AM
*S
WIL
LAM
ETT
E15
4716
7832
4232
3515
3417
100
50S
AN
TIA
M27
103
4917
926
6555
4915
4852
6856
N
McK
EN
ZIE
S W
ILLA
ME
TTE
----
----
----
----
25--
----
--
S M
cKE
NZI
ES
WIL
LAM
ETT
E57
108
7624
153
3739
4325
7037
2745
McK
EN
ZIE
*S
WIL
LAM
ETT
E57
108
7624
139
3939
3925
7037
2745
N
IND
IGO
*S
WIL
LAM
ETT
E29
8143
153
3629
4035
2553
3439
42
S IN
DIG
OS
OU
THW
ES
T21
9434
149
2238
823
2536
5180
56IN
DIG
O50
175
7730
229
3327
2925
4440
5647
DIX
ON
SO
UTH
WE
ST
5322
273
348
2427
2927
2533
3538
35E
VA
NS
CR
EE
KR
OG
UE
6019
596
351
3124
2426
2049
4162
51R
OG
UE
RO
GU
E28
107
4718
226
2619
2415
4429
4138
C
ASC
AD
E T
OTA
L27
591
041
81,
603
3033
2830
--46
3845
43
G
RA
ND
TO
TAL
488
2,10
895
73,
553
2324
2524
--45
4045
43*
The
se W
ildlif
e M
anag
emen
t uni
ts a
re in
volv
ed in
an
expe
rimen
tal d
eer i
nven
tory
stu
dy.
** T
his
data
ana
lyze
d by
taki
ng m
eans
of r
eplic
ate
sam
ple
surv
eys.
You
can
not
cal
cula
te ra
tios
usin
g th
e ra
w d
ata.
BLA
CK
-TA
ILED
DEE
R H
ERD
CO
MPO
SITI
ON
REP
OR
T
Oregon Department of Fish and Wildlife
Big Game Statistics: Deer
1�
BLACK-TAILED DEER SPRING FAWN SURVIVAL REPORT
WATERSHED DEER CLASSIFIED IN 2004 SPRING FAWNS PER 100 ADULTS UNIT DISTRICT FAWNS ADULTS TOTAL 2004 2003 2002
SCAPPOOSE N WILLAMETTE -- -- -- -- -- --SADDLE MT N COAST 46 95 141 48 92 --WILSON N COAST 32 75 107 43 36 -- W TRASK N COAST 23 74 97 31 39 -- NE TRASK N WILLAMETTE -- -- -- -- -- -- SE TRASK -- -- -- -- -- --TRASK 23 74 97 31 39 -- E STOTT N WILLAMETTE -- -- -- -- -- -- W STOTT N COAST -- -- -- -- -- --STOTT MT -- -- -- -- -- --ALSEA N COAST -- -- -- -- -- -- S SIUSLAW SOUTHWEST -- -- -- -- -- -- E SIUSLAW S WILLAMETTE -- -- -- -- -- -- W SIUSLAW N COAST -- -- -- -- -- --SIUSLAW -- -- -- -- -- --WILLAMETTE -- -- -- -- -- --
NORTH COAST TOTAL 124 318 442 -- -- --
E TIOGA SOUTHWEST 2 25 27 8 -- -- W TIOGA SOUTHWEST 14 24 38 58 -- --TIOGA SOUTHWEST 16 49 65 33 -- --SIXES SOUTHWEST 7 53 60 13 0 -- E POWERS SOUTHWEST 2 17 19 12 -- -- W POWERS SOUTHWEST 11 21 32 52 -- --POWERS SOUTHWEST 13 38 51 34 -- -- E CHETCO ROGUE 42 85 127 49 46 32 W CHETCO ROGUE -- -- -- -- -- --CHETCO ROGUE 42 85 127 49 46 32 E APPLEGATE ROGUE 2 1 3 200 120 59 W APPLEGATE ROGUE 46 53 99 87 47 39APPLEGATE ROGUE 48 54 102 89 51 50MELROSE SOUTHWEST 72 312 384 23 27 51
SOUTHWEST TOTAL 198 591 789 -- -- --
N SANTIAM N WILLAMETTE -- -- -- -- -- -- S SANTIAM S WILLAMETTE -- -- -- -- -- --SANTIAM -- -- -- -- -- -- N McKENZIE S WILLAMETTE -- -- -- -- -- -- S McKENZIE S WILLAMETTE -- -- -- -- -- --McKENZIE S WILLAMETTE -- -- -- -- -- -- N INDIGO S WILLAMETTE -- -- -- -- -- -- S INDIGO SOUTHWEST 37 75 112 49 47 88INDIGO 37 75 112 49 47 88DIXON SOUTHWEST 13 91 104 14 24 83EVANS CREEK ROGUE 32 105 137 30 48 67ROGUE ROGUE 73 161 234 45 38 43
CASCADE TOTAL 155 432 587 -- -- --
GRAND TOTAL 477 1,341 1,818 -- -- --
Oregon Department of Fish and Wildlife
Big Game Statistics: Deer
�0
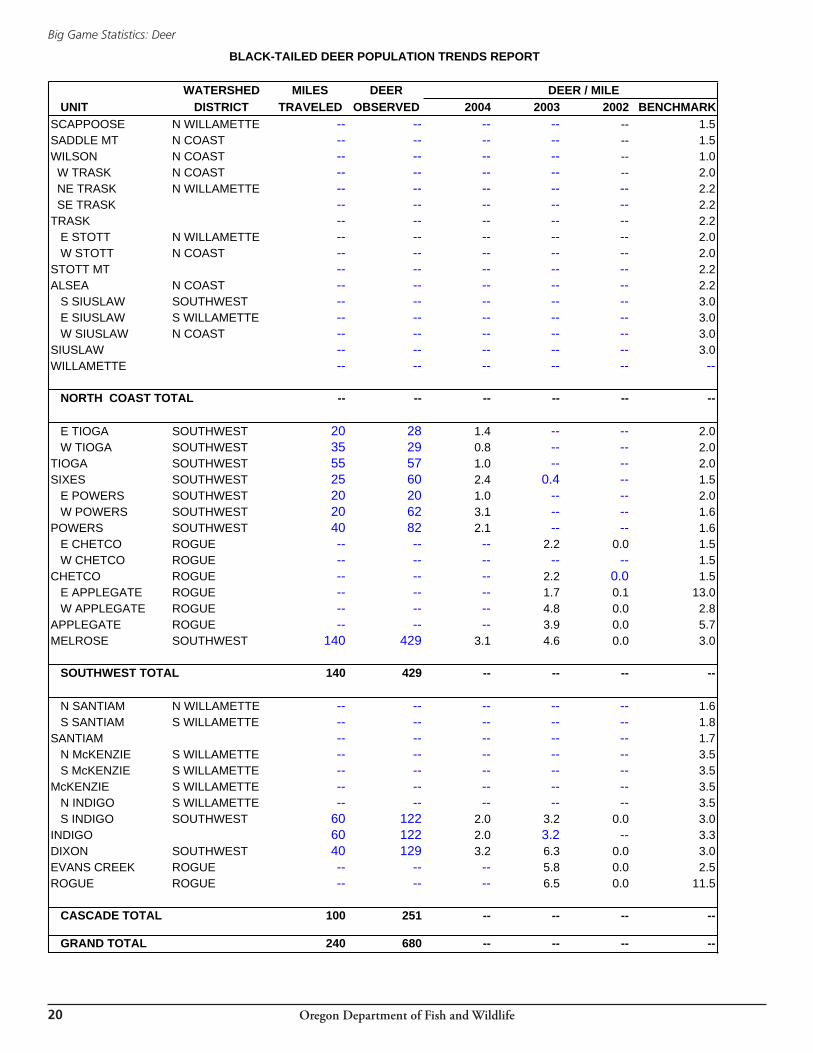
WATERSHED MILES DEER DEER / MILE UNIT DISTRICT TRAVELED OBSERVED 2004 2003 2002 BENCHMARKSCAPPOOSE N WILLAMETTE -- -- -- -- -- 1.5SADDLE MT N COAST -- -- -- -- -- 1.5WILSON N COAST -- -- -- -- -- 1.0 W TRASK N COAST -- -- -- -- -- 2.0 NE TRASK N WILLAMETTE -- -- -- -- -- 2.2 SE TRASK -- -- -- -- -- 2.2TRASK -- -- -- -- -- 2.2 E STOTT N WILLAMETTE -- -- -- -- -- 2.0 W STOTT N COAST -- -- -- -- -- 2.0STOTT MT -- -- -- -- -- 2.2ALSEA N COAST -- -- -- -- -- 2.2 S SIUSLAW SOUTHWEST -- -- -- -- -- 3.0 E SIUSLAW S WILLAMETTE -- -- -- -- -- 3.0 W SIUSLAW N COAST -- -- -- -- -- 3.0SIUSLAW -- -- -- -- -- 3.0WILLAMETTE -- -- -- -- -- --
NORTH COAST TOTAL -- -- -- -- -- --
E TIOGA SOUTHWEST 20 28 1.4 -- -- 2.0 W TIOGA SOUTHWEST 35 29 0.8 -- -- 2.0TIOGA SOUTHWEST 55 57 1.0 -- -- 2.0SIXES SOUTHWEST 25 60 2.4 0.4 -- 1.5 E POWERS SOUTHWEST 20 20 1.0 -- -- 2.0 W POWERS SOUTHWEST 20 62 3.1 -- -- 1.6POWERS SOUTHWEST 40 82 2.1 -- -- 1.6 E CHETCO ROGUE -- -- -- 2.2 0.0 1.5 W CHETCO ROGUE -- -- -- -- -- 1.5CHETCO ROGUE -- -- -- 2.2 0.0 1.5 E APPLEGATE ROGUE -- -- -- 1.7 0.1 13.0 W APPLEGATE ROGUE -- -- -- 4.8 0.0 2.8APPLEGATE ROGUE -- -- -- 3.9 0.0 5.7MELROSE SOUTHWEST 140 429 3.1 4.6 0.0 3.0
SOUTHWEST TOTAL 140 429 -- -- -- --
N SANTIAM N WILLAMETTE -- -- -- -- -- 1.6 S SANTIAM S WILLAMETTE -- -- -- -- -- 1.8SANTIAM -- -- -- -- -- 1.7 N McKENZIE S WILLAMETTE -- -- -- -- -- 3.5 S McKENZIE S WILLAMETTE -- -- -- -- -- 3.5McKENZIE S WILLAMETTE -- -- -- -- -- 3.5 N INDIGO S WILLAMETTE -- -- -- -- -- 3.5 S INDIGO SOUTHWEST 60 122 2.0 3.2 0.0 3.0INDIGO 60 122 2.0 3.2 -- 3.3DIXON SOUTHWEST 40 129 3.2 6.3 0.0 3.0EVANS CREEK ROGUE -- -- -- 5.8 0.0 2.5ROGUE ROGUE -- -- -- 6.5 0.0 11.5
CASCADE TOTAL 100 251 -- -- -- --
GRAND TOTAL 240 680 -- -- -- --
BLACK-TAILED DEER POPULATION TRENDS REPORT
Oregon Department of Fish and Wildlife
Big Game Statistics: Deer
�1
WA
TER
SHED
D
EER
CLA
SSIF
IED
IN 2
004
B
UC
KS
PER
100
DO
ES
FA
WN
S PE
R 1
00 D
OES
U
NIT
DIS
TRIC
TB
UC
KS
DO
ESFA
WN
STO
TAL
2004
2003
2002
P3YR
MO
2004
2003
2002
P3YR
MIN
AM
GR
AN
DE
RO
ND
E54
257
140
451
2129
2224
2554
5763
58IM
NA
HA
GR
AN
DE
RO
ND
E28
284
162
474
1019
2618
1557
4754
53C
ATH
ER
INE
CR
GR
AN
DE
RO
ND
E58
429
182
669
1417
2719
1542
3968
50K
EA
TIN
GG
RA
ND
E R
ON
DE
4336
016
156
412
8--
--15
4542
----
PIN
E C
RG
RA
ND
E R
ON
DE
2921
193
333
148
----
1544
46--
--LO
OK
OU
T M
TG
RA
ND
E R
ON
DE
4738
218
361
212
11--
--15
4860
----
W
ALL
OW
A Z
ON
E25
91,
923
921
3,10
313
1625
----
4848
63--
SN
AK
E R
IVE
RG
RA
ND
E R
ON
DE
4423
815
143
318
1522
1925
6343
4651
CH
ES
NIM
NU
SG
RA
ND
E R
ON
DE
3022
014
139
114
1616
1512
6454
6661
E
SLE
D S
PR
ING
SG
RA
ND
E R
ON
DE
4748
834
888
310
1515
13--
7167
6869
W
SLE
D S
PR
ING
SG
RA
ND
E R
ON
DE
02
24
012
128
--10
047
8076
SLE
D S
PR
ING
SG
RA
ND
E R
ON
DE
4749
035
088
710
1414
1212
7159
7368
WE
NA
HA
GR
AN
DE
RO
ND
E25
279
188
492
912
1813
1267
6132
53W
ALL
A W
ALL
AJO
HN
DA
Y24
286
128
438
811
910
1545
4547
46
E M
T E
MIL
YG
RA
ND
E R
ON
DE
2611
760
203
2218
1719
--51
5152
51
W M
T E
MIL
YJO
HN
DA
Y20
176
9228
811
1015
12--
5250
5954
MT
EM
ILY
4629
315
249
116
1215
1415
5250
5753
W
ENA
HA
-SN
AK
E ZO
NE
216
1,80
61,
110
3,13
212
1315
13--
6153
5857
STA
RK
EY
GR
AN
DE
RO
ND
E20
328
135
483
69
1610
1541
7960
60
N U
KIA
HJO
HN
DA
Y26
282
101
409
912
1512
--36
5868
54
S U
KIA
HJO
HN
DA
Y8
148
9224
85
1513
11--
6270
5964
UK
IAH
JOH
N D
AY
3443
019
365
78
1314
1215
4561
6657
SU
MP
TER
GR
AN
DE
RO
ND
E70
400
161
631
188
*--
--15
40*
50*
----
DE
SO
LATI
ON
JOH
N D
AY
1693
5216
117
2612
1815
5654
5354
S
HE
PP
NE
RJO
HN
DA
Y--
----
----
----
----
----
----
W
HE
PP
NE
RJO
HN
DA
Y51
510
229
790
1016
912
--45
4337
42H
EP
PN
ER
JOH
N D
AY
5151
022
979
010
169
1212
4543
3742
FOS
SIL
JOH
N D
AY
3629
111
544
212
1010
1112
4042
3539
CO
LUM
BIA
BA
SIN
JOH
N D
AY
1221
599
326
612
99
1246
3747
43
U
MA
TILL
A-W
HIT
MA
N Z
ON
E23
92,
267
984
3,49
011
1311
11--
4346
4645
NO
RTH
SID
EJO
HN
DA
Y54
471
264
789
1117
1715
1556
5654
55M
UR
DE
RE
RS
CR
JOH
N D
AY
2018
114
234
311
1611
1315
7885
5472
E
BE
ULA
HM
ALH
EU
R32
147
7425
322
2420
22--
5060
4552
W
BE
ULA
HM
ALH
EU
R36
244
127
407
1516
1013
--52
5462
56B
EU
LAH
MA
LHE
UR
6839
120
166
017
1915
1712
5157
5354
E
MA
LHE
UR
RIV
ER
MA
LHE
UR
1911
148
178
1718
915
1243
4257
47
W M
ALH
EU
R R
IVE
RM
ALH
EU
R27
369
179
575
712
1813
1249
5874
60M
ALH
EU
R R
IVE
RM
ALH
EU
R46
480
227
753
1014
1513
1247
5370
57S
ILV
IES
MA
LHE
UR
3325
111
940
313
812
1112
4748
8058
OC
HO
CO
DE
SC
HU
TES
9563
135
21,
078
1512
1213
1256
5454
55G
RIZ
ZLY
DE
SC
HU
TES
6038
822
767
515
1414
1412
5952
4351
MA
UR
YD
ES
CH
UTE
S40
328
169
537
1213
1814
1252
5660
56
O
CH
OC
O-M
ALH
EUR
ZO
NE
416
3,12
11,
701
5,23
813
1414
14--
5556
5555
N
OR
THEA
ST A
REA
TO
TAL
1,13
09,
117
4,71
614
,963
1214
1413
--52
5153
52
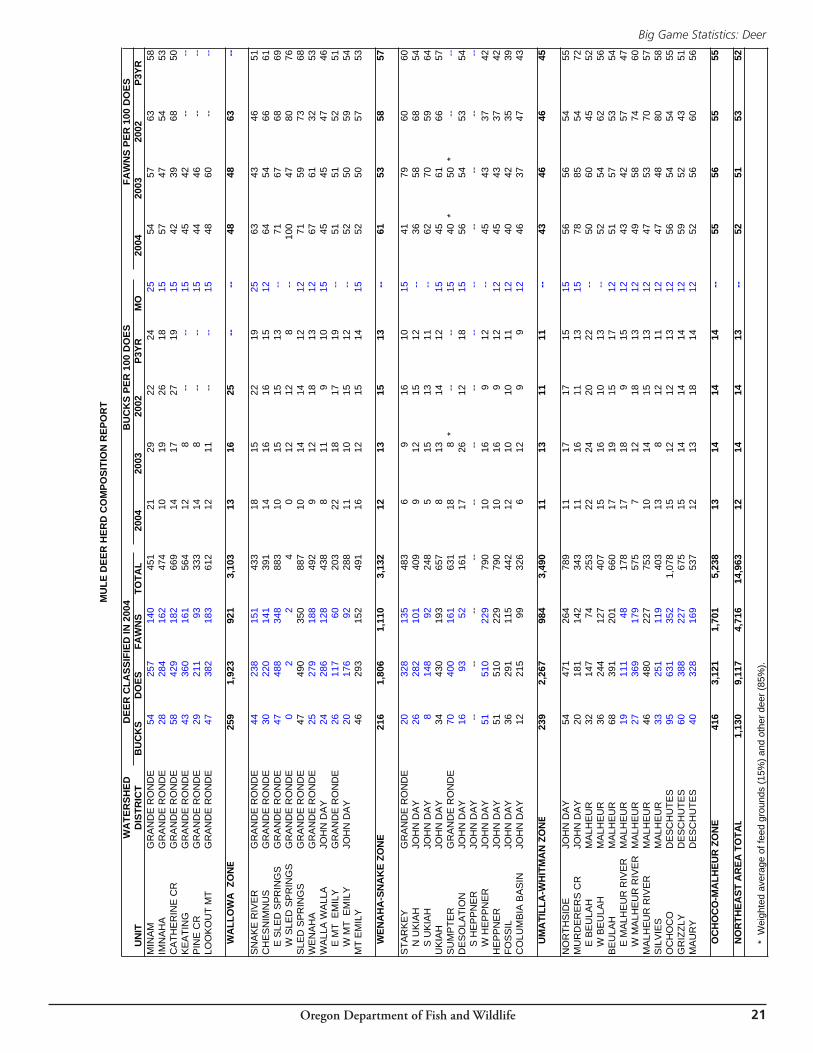
*
Wei
ghte
d av
erag
e of
feed
gro
unds
(15%
) and
oth
er d
eer (
85%
).
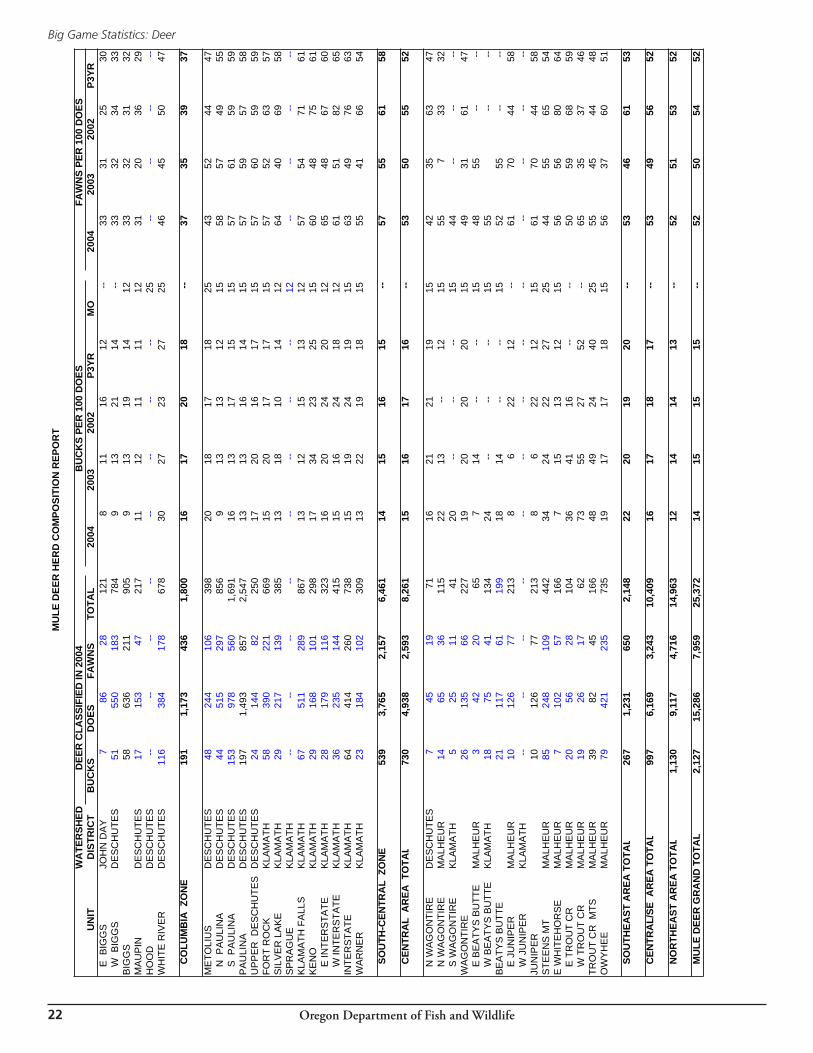
MU
LE D
EER
HER
D C
OM
POSI
TIO
N R
EPO
RT
Oregon Department of Fish and Wildlife
Big Game Statistics: Deer
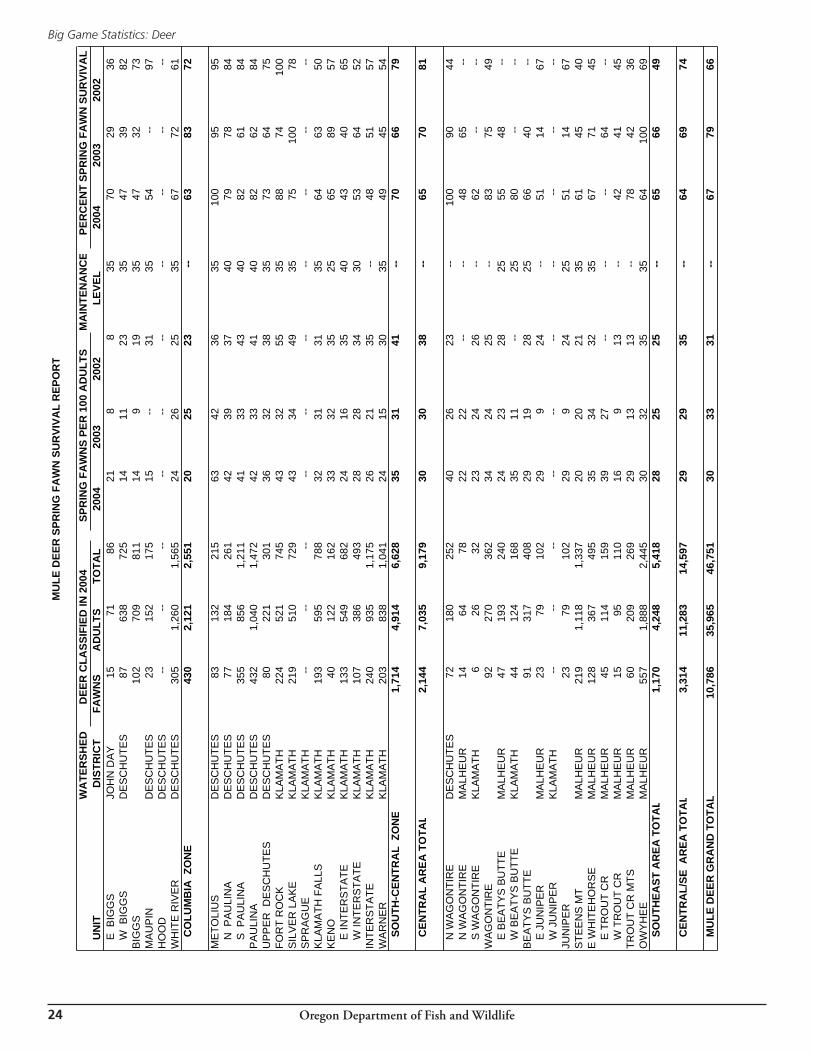
��
MU
LE D
EER
HER
D C
OM
POSI
TIO
N R
EPO
RT
WA
TER
SHE D
DEE
R C
LASS
IFIE
D IN
200
4
B
UC
KS
PER
100
DO
ES F
AW
NS
PER
100
DO
ES
UN
ITD
ISTR
ICT
BU
CK
SD
OES
FAW
NS
TOTA
L20
0420
0320
02P3
YRM
O20
0420
0320
02P3
YR
E B
IGG
SJO
HN
DA
Y7
8628
121
811
1612
--33
3125
30
W B
IGG
SD
ES
CH
UTE
S51
550
183
784
913
2114
--33
3234
33B
IGG
S58
636
211
905
913
1914
1233
3231
32M
AU
PIN
DE
SC
HU
TES
1715
347
217
1112
1111
1231
2036
29H
OO
DD
ES
CH
UTE
S--
----
----
----
--25
----
----
WH
ITE
RIV
ER
DE
SC
HU
TES
116
384
178
678
3027
2327
2546
4550
47
C
OLU
MB
IA Z
ON
E19
11,
173
436
1,80
0
1617
2018
--
3735
3937
ME
TOLI
US
DE
SC
HU
TES
4824
410
639
820
1817
1825
4352
4447
N
PA
ULI
NA
DE
SC
HU
TES
4451
529
785
69
1313
1215
5857
4955
S
PA
ULI
NA
DE
SC
HU
TES
153
978
560
1,69
116
1317
1515
5761
5959
PA
ULI
NA
DE
SC
HU
TES
197
1,49
385
72,
547
1313
1614
1557
5957
58U
PP
ER
DE
SC
HU
TES
DE
SC
HU
TES
2414
482
250
1720
1617
1557
6059
59FO
RT
RO
CK
KLA
MA
TH58
390
221
669
1520
1717
1557
5263
57S
ILV
ER
LA
KE
KLA
MA
TH29
217
139
385
1318
1014
1264
4069
58S
PR
AG
UE
KLA
MA
TH--
----
----
----
--12
----
----
KLA
MA
TH F
ALL
SK
LAM
ATH
6751
128
986
713
1215
1312
5754
7161
KE
NO
KLA
MA
TH29
168
101
298
1734
2325
1560
4875
61
E IN
TER
STA
TEK
LAM
ATH
2817
911
632
316
2024
2012
6548
6760
W
INTE
RS
TATE
KLA
MA
TH36
235
144
415
1516
2418
1261
5182
65IN
TER
STA
TEK
LAM
ATH
6441
426
073
815
1924
1915
6349
7663
WA
RN
ER
KLA
MA
TH23
184
102
309
1322
1918
1555
4166
54
S
OU
TH-C
ENTR
AL
ZO
NE
539
3,76
52,
157
6,46
114
1516
15--
5755
6158
C
ENTR
AL
AR
EA T
OTA
L73
04,
938
2,59
38,
261
1516
1716
--53
5055
52
N
WA
GO
NTI
RE
DE
SC
HU
TES
745
1971
1621
2119
1542
3563
47
N W
AG
ON
TIR
EM
ALH
EU
R14
6536
115
2213
--12
1555
733
32
S W
AG
ON
TIR
EK
LAM
ATH
525
1141
20--
----
1544
----
--W
AG
ON
TIR
E26
135
6622
719
2020
2015
4931
6147
E
BE
ATY
S B
UTT
EM
ALH
EU
R3
4220
657
14--
--15
4855
----
W
BE
ATY
S B
UTT
EK
LAM
ATH
1875
4113
424
----
--15
55--
--B
EA
TYS
BU
TTE
2111
761
199
1814
----
1552
55--
--
E J
UN
IPE
RM
ALH
EU
R10
126
7721
38
622
12--
6170
4458
W
JU
NIP
ER
KLA
MA
TH--
----
----
----
----
----
----
JUN
IPE
R10
126
7721
38
622
1215
6170
4458
STE
EN
S M
TM
ALH
EU
R85
248
109
442
3424
2227
2544
5565
54E
WH
ITE
HO
RS
EM
ALH
EU
R7
102
5716
67
1513
1215
5656
8064
E
TR
OU
T C
RM
ALH
EU
R20
5628
104
3641
16--
--50
5968
59
W T
RO
UT
CR
MA
LHE
UR
1926
1762
7355
2752
--65
3537
46TR
OU
T C
R M
TSM
ALH
EU
R39
8245
166
4849
2440
2555
4544
48O
WY
HE
EM
ALH
EU
R79
421
235
735
1917
1718
1556
3760
51
S
OU
THEA
ST A
REA
TO
TAL
267
1,23
165
02,
148
2220
1920
--53
4661
53
C
ENTR
AL/
SE A
REA
TO
TAL
997
6,16
93,
243
10,4
0916
1718
17--
5349
5652
N
OR
THEA
ST A
REA
TO
TAL
1,13
09,
117
4,71
614
,963
1214
1413
--52
5153
52
M
ULE
DEE
R G
RA
ND
TO
TAL
2,12
715
,286
7,95
925
,372
1415
1515
--52
5054
52
Oregon Department of Fish and Wildlife
Big Game Statistics: Deer
��
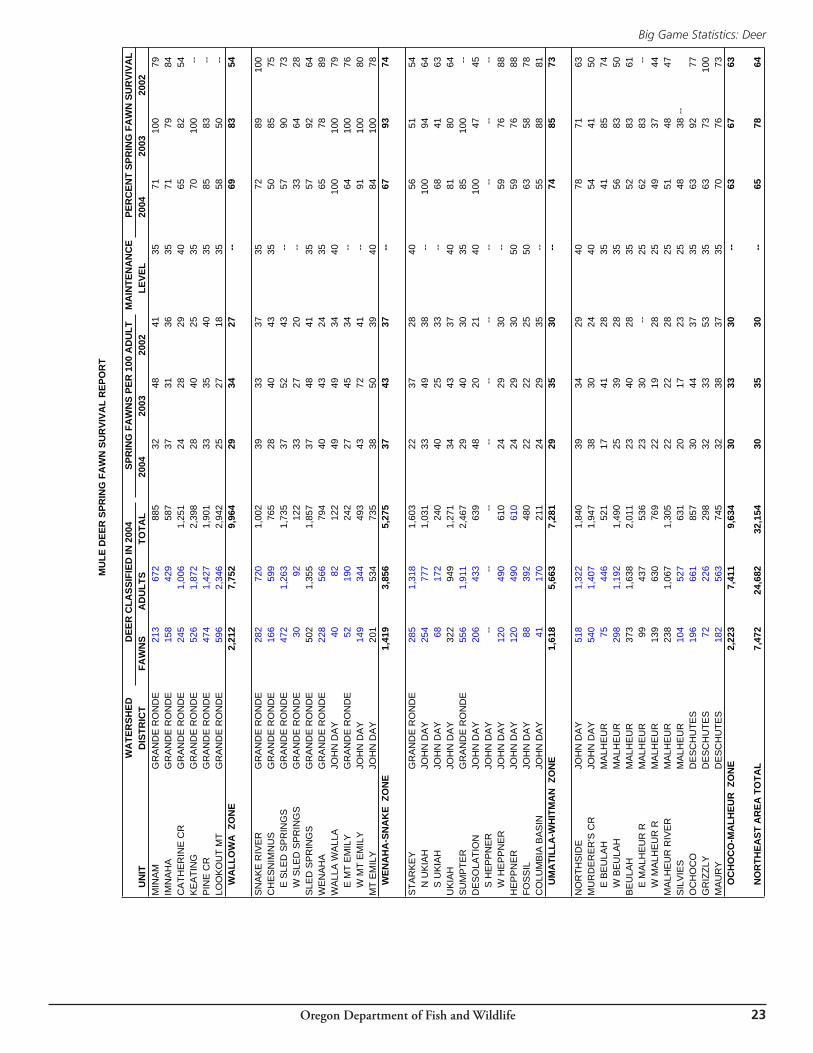
MU
LE D
EER
SPR
ING
FA
WN
SU
RVI
VAL
REP
OR
T
WA
TER
SHED
D
EER
CLA
SSIF
IED
IN 2
004
S
PRIN
G F
AW
NS
PER
100
AD
ULT
M
AIN
TEN
AN
CE
PER
CEN
T SP
RIN
G F
AW
N S
UR
VIVA
L
UN
ITD
ISTR
ICT
FA
WN
S A
DU
LTS
TO
TAL
2004
2003
2002
LEVE
L20
0420
0320
02M
INA
MG
RA
ND
E R
ON
DE
213
672
885
3248
4135
7110
079
IMN
AH
AG
RA
ND
E R
ON
DE
158
429
587
3731
3635
7179
84C
ATH
ER
INE
CR
GR
AN
DE
RO
ND
E24
51,
006
1,25
124
2829
4065
8254
KE
ATI
NG
GR
AN
DE
RO
ND
E52
61,
872
2,39
828
4025
3570
100
--P
INE
CR
GR
AN
DE
RO
ND
E47
41,
427
1,90
133
3540
3585
83--
LOO
KO
UT
MT
GR
AN
DE
RO
ND
E59
62,
346
2,94
225
2718
3558
50--
W
ALL
OW
A Z
ON
E2,
212
7,75
29,
964
2934
27--
6983
54
SN
AK
E R
IVE
RG
RA
ND
E R
ON
DE
282
720
1,00
239
3337
3572
8910
0C
HE
SN
IMN
US
GR
AN
DE
RO
ND
E16
659
976
528
4043
3550
8575
E
SLE
D S
PR
ING
SG
RA
ND
E R
ON
DE
472
1,26
31,
735
3752
43--
5790
73
W S
LED
SP
RIN
GS
GR
AN
DE
RO
ND
E30
9212
233
2720
--33
6428
SLE
D S
PR
ING
SG
RA
ND
E R
ON
DE
502
1,35
51,
857
3748
4135
5792
64W
EN
AH
AG
RA
ND
E R
ON
DE
228
566
794
4043
2435
6578
89W
ALL
A W
ALL
AJO
HN
DA
Y40
8212
249
4934
4010
010
079
E
MT
EM
ILY
GR
AN
DE
RO
ND
E52
190
242
2745
34--
6410
076
W
MT
EM
ILY
JOH
N D
AY
149
344
493
4372
41--
9110
080
MT
EM
ILY
JOH
N D
AY
201
534
735
3850
3940
8410
078
W
ENA
HA
-SN
AK
E Z
ON
E1,
419
3,85
65,
275
3743
37--
6793
74
STA
RK
EY
GR
AN
DE
RO
ND
E28
51,
318
1,60
322
3728
4056
5154
N
UK
IAH
JOH
N D
AY
254
777
1,03
133
4938
--10
094
64
S U
KIA
HJO
HN
DA
Y68
172
240
4025
33--
6841
63U
KIA
HJO
HN
DA
Y32
294
91,
271
3443
3740
8180
64S
UM
PTE
RG
RA
ND
E R
ON
DE
556
1,91
12,
467
2940
3035
8510
0--
DE
SO
LATI
ON
JOH
N D
AY
206
433
639
4820
2140
100
4745
S
HE
PP
NE
RJO
HN
DA
Y--
----
----
----
----
--
W H
EP
PN
ER
JOH
N D
AY
120
490
610
2429
30--
5976
88H
EP
PN
ER
JOH
N D
AY
120
490
610
2429
3050
5976
88FO
SS
ILJO
HN
DA
Y88
392
480
2222
2550
6358
78C
OLU
MB
IA B
AS
INJO
HN
DA
Y41
170
211
2429
35--
5588
81
UM
ATI
LLA
-WH
ITM
AN
ZO
NE
1,61
85,
663
7,28
129
3530
--74
8573
NO
RTH
SID
EJO
HN
DA
Y51
81,
322
1,84
039
3429
4078
7163
MU
RD
ER
ER
'S C
RJO
HN
DA
Y54
01,
407
1,94
738
3024
4054
4150
E
BE
ULA
HM
ALH
EU
R75
446
521
1741
2835
4185
74
W B
EU
LAH
MA
LHE
UR
298
1,19
21,
490
2539
2835
5683
50B
EU
LAH
MA
LHE
UR
373
1,63
82,
011
2340
2835
5283
61
E M
ALH
EU
R R
MA
LHE
UR
9943
753
623
30--
2562
83--
W
MA
LHE
UR
RM
ALH
EU
R13
963
076
922
1928
2549
3744
MA
LHE
UR
RIV
ER
MA
LHE
UR
238
1,06
71,
305
2222
2825
5148
47S
ILV
IES
MA
LHE
UR
104
527
631
2017
2325
4838
--O
CH
OC
OD
ES
CH
UTE
S19
666
185
730
4437
3563
9277
GR
IZZL
YD
ES
CH
UTE
S72
226
298
3233
5335
6373
100
MA
UR
YD
ES
CH
UTE
S18
256
374
532
3837
3570
7673
O
CH
OC
O-M
ALH
EUR
ZO
NE
2,22
37,
411
9,63
430
3330
--63
6763
N
OR
THEA
ST A
REA
TO
TAL
7,47
224
,682
32,1
5430
3530
--65
7864
Oregon Department of Fish and Wildlife
Big Game Statistics: Deer
��
MU
LE D
EER
SPR
ING
FA
WN
SU
RVI
VAL
REP
OR
T
WA
TER
SHED
D
EER
CLA
SSIF
IED
IN 2
004
SPR
ING
FA
WN
S PE
R 1
00 A
DU
LTS
MA
INTE
NA
NC
E
PER
CEN
T SP
RIN
G F
AW
N S
UR
VIVA
L
UN
ITD
ISTR
ICT
FA
WN
S A
DU
LTS
TO
TAL
2004
2003
2002
L
EVEL
2004
2003
2002
E
BIG
GS
JOH
N D
AY
1571
8621
88
3570
2936
W
BIG
GS
DE
SC
HU
TES
8763
872
514
1123
3547
3982
BIG
GS
102
709
811
149
1935
4732
73M
AU
PIN
DE
SC
HU
TES
2315
217
515
--31
3554
--97
HO
OD
DE
SC
HU
TES
----
----
----
----
----
WH
ITE
RIV
ER
DE
SC
HU
TES
305
1,26
01,
565
2426
2535
6772
61
CO
LUM
BIA
ZO
NE
430
2,12
12,
551
2025
23--
6383
72
ME
TOLI
US
DE
SC
HU
TES
8313
221
563
4236
3510
095
95
N P
AU
LIN
AD
ES
CH
UTE
S77
184
261
4239
3740
7978
84
S P
AU
LIN
AD
ES
CH
UTE
S35
585
61,
211
4133
4340
8261
84P
AU
LIN
AD
ES
CH
UTE
S43
21,
040
1,47
242
3341
4082
6284
UP
PE
R D
ES
CH
UTE
SD
ES
CH
UTE
S80
221
301
3632
3835
7364
75FO
RT
RO
CK
KLA
MA
TH22
452
174
543
3255
3588
7410
0S
ILV
ER
LA
KE
KLA
MA
TH21
951
072
943
3449
3575
100
78S
PR
AG
UE
KLA
MA
TH--
----
----
----
----
--K
LAM
ATH
FA
LLS
KLA
MA
TH19
359
578
832
3131
3564
6350
KE
NO
KLA
MA
TH40
122
162
3332
3525
6589
57
E IN
TER
STA
TEK
LAM
ATH
133
549
682
2416
3540
4340
65
W IN
TER
STA
TEK
LAM
ATH
107
386
493
2828
3430
5364
52IN
TER
STA
TEK
LAM
ATH
240
935
1,17
526
2135
--48
5157
WA
RN
ER
KLA
MA
TH20
383
81,
041
2415
3035
4945
54
SO
UTH
-CEN
TRA
L Z
ON
E1,
714
4,91
46,
628
3531
41--
7066
79
C
ENTR
AL
AR
EA T
OTA
L2,
144
7,03
59,
179
3030
38--
6570
81
N
WA
GO
NTI
RE
DE
SC
HU
TES
7218
025
240
2623
--10
090
44
N W
AG
ON
TIR
EM
ALH
EU
R14
6478
2222
----
4865
--
S W
AG
ON
TIR
EK
LAM
ATH
626
3223
2426
--62
----
WA
GO
NTI
RE
9227
036
234
2425
--83
7549
E
BE
ATY
S B
UTT
EM
ALH
EU
R47
193
240
2423
2825
5548
--
W B
EA
TYS
BU
TTE
KLA
MA
TH44
124
168
3511
--25
80--
--B
EA
TYS
BU
TTE
9131
740
829
1928
2566
40--
E
JU
NIP
ER
MA
LHE
UR
2379
102
299
24--
5114
67
W J
UN
IPE
RK
LAM
ATH
----
----
----
----
----
JUN
IPE
R23
7910
229
924
2551
1467
STE
EN
S M
TM
ALH
EU
R21
91,
118
1,33
720
2021
3561
4540
E W
HIT
EH
OR
SE
MA
LHE
UR
128
367
495
3534
3235
6771
45
E T
RO
UT
CR
MA
LHE
UR
4511
415
939
27--
----
64--
W
TR
OU
T C
RM
ALH
EU
R15
9511
016
913
--42
4145
TRO
UT
CR
MTS
MA
LHE
UR
6020
926
929
1313
--78
4236
OW
YH
EE
MA
LHE
UR
557
1,88
82,
445
3032
3535
6410
069
S
OU
THEA
ST A
REA
TO
TAL
1,17
04,
248
5,41
828
2525
--65
6649
C
ENTR
AL/
SE A
REA
TO
TAL
3,31
411
,283
14,5
9729
2935
--64
6974
7,47
224
,682
32,1
54
MU
LE D
EER
GR
AN
D T
OTA
L10
,786
35,9
6546
,751
3033
31--
6779
66
Oregon Department of Fish and Wildlife
Big Game Statistics: Deer
��
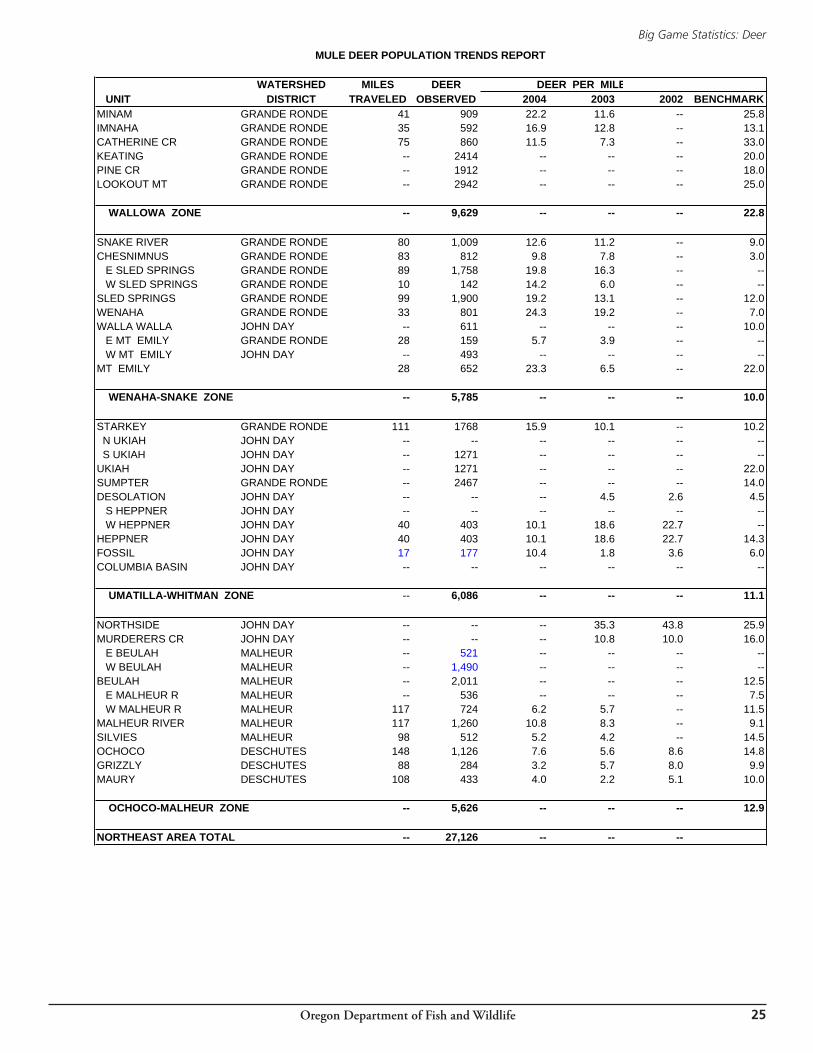
WATERSHED MILES DEER DEER PER MILE UNIT DISTRICT TRAVELED OBSERVED 2004 2003 2002 BENCHMARKMINAM GRANDE RONDE 41 909 22.2 11.6 -- 25.8IMNAHA GRANDE RONDE 35 592 16.9 12.8 -- 13.1CATHERINE CR GRANDE RONDE 75 860 11.5 7.3 -- 33.0KEATING GRANDE RONDE -- 2414 -- -- -- 20.0PINE CR GRANDE RONDE -- 1912 -- -- -- 18.0LOOKOUT MT GRANDE RONDE -- 2942 -- -- -- 25.0
WALLOWA ZONE -- 9,629 -- -- -- 22.8
SNAKE RIVER GRANDE RONDE 80 1,009 12.6 11.2 -- 9.0CHESNIMNUS GRANDE RONDE 83 812 9.8 7.8 -- 3.0 E SLED SPRINGS GRANDE RONDE 89 1,758 19.8 16.3 -- -- W SLED SPRINGS GRANDE RONDE 10 142 14.2 6.0 -- --SLED SPRINGS GRANDE RONDE 99 1,900 19.2 13.1 -- 12.0WENAHA GRANDE RONDE 33 801 24.3 19.2 -- 7.0WALLA WALLA JOHN DAY -- 611 -- -- -- 10.0 E MT EMILY GRANDE RONDE 28 159 5.7 3.9 -- -- W MT EMILY JOHN DAY -- 493 -- -- -- --MT EMILY 28 652 23.3 6.5 -- 22.0
WENAHA-SNAKE ZONE -- 5,785 -- -- -- 10.0
STARKEY GRANDE RONDE 111 1768 15.9 10.1 -- 10.2 N UKIAH JOHN DAY -- -- -- -- -- -- S UKIAH JOHN DAY -- 1271 -- -- -- --UKIAH JOHN DAY -- 1271 -- -- -- 22.0SUMPTER GRANDE RONDE -- 2467 -- -- -- 14.0DESOLATION JOHN DAY -- -- -- 4.5 2.6 4.5 S HEPPNER JOHN DAY -- -- -- -- -- -- W HEPPNER JOHN DAY 40 403 10.1 18.6 22.7 --HEPPNER JOHN DAY 40 403 10.1 18.6 22.7 14.3FOSSIL JOHN DAY 17 177 10.4 1.8 3.6 6.0COLUMBIA BASIN JOHN DAY -- -- -- -- -- --
UMATILLA-WHITMAN ZONE -- 6,086 -- -- -- 11.1
NORTHSIDE JOHN DAY -- -- -- 35.3 43.8 25.9MURDERERS CR JOHN DAY -- -- -- 10.8 10.0 16.0 E BEULAH MALHEUR -- 521 -- -- -- -- W BEULAH MALHEUR -- 1,490 -- -- -- --BEULAH MALHEUR -- 2,011 -- -- -- 12.5 E MALHEUR R MALHEUR -- 536 -- -- -- 7.5 W MALHEUR R MALHEUR 117 724 6.2 5.7 -- 11.5MALHEUR RIVER MALHEUR 117 1,260 10.8 8.3 -- 9.1SILVIES MALHEUR 98 512 5.2 4.2 -- 14.5OCHOCO DESCHUTES 148 1,126 7.6 5.6 8.6 14.8GRIZZLY DESCHUTES 88 284 3.2 5.7 8.0 9.9MAURY DESCHUTES 108 433 4.0 2.2 5.1 10.0
OCHOCO-MALHEUR ZONE -- 5,626 -- -- -- 12.9
NORTHEAST AREA TOTAL -- 27,126 -- -- --
MULE DEER POPULATION TRENDS REPORT
Oregon Department of Fish and Wildlife
Big Game Statistics: Deer
��
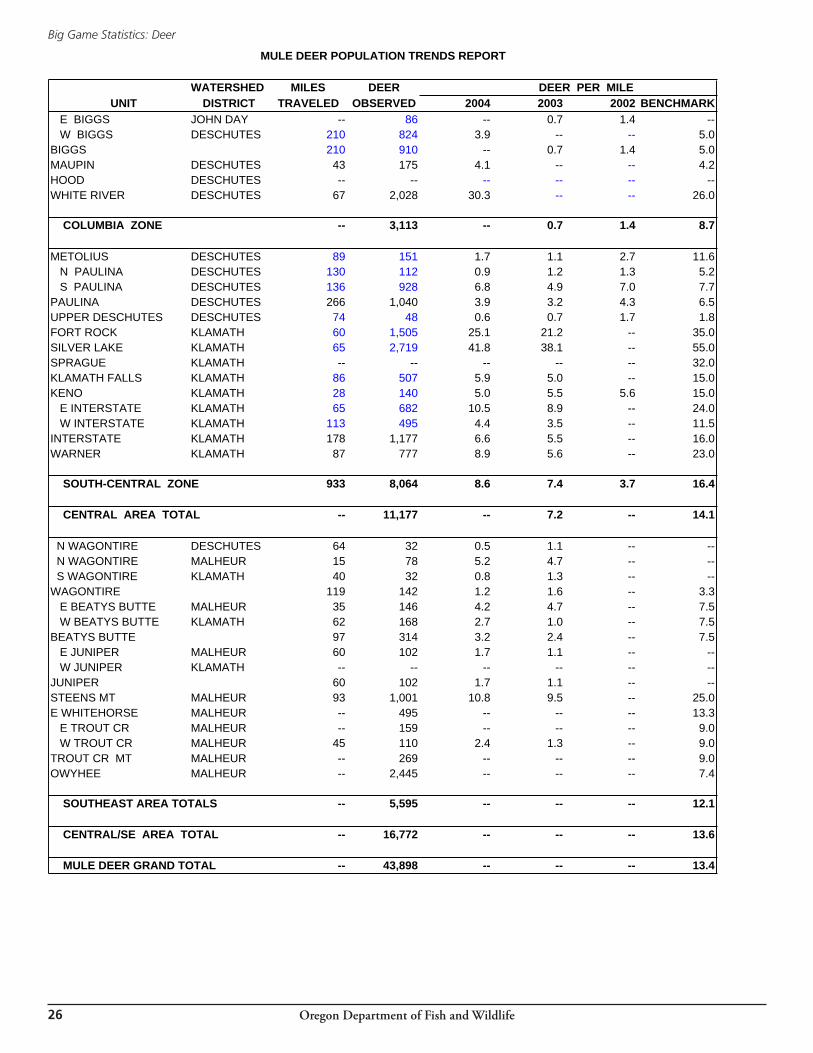
WATERSHED MILES DEER DEER PER MILE UNIT DISTRICT TRAVELED OBSERVED 2004 2003 2002 BENCHMARK
E BIGGS JOHN DAY -- 86 -- 0.7 1.4 -- W BIGGS DESCHUTES 210 824 3.9 -- -- 5.0BIGGS 210 910 -- 0.7 1.4 5.0MAUPIN DESCHUTES 43 175 4.1 -- -- 4.2HOOD DESCHUTES -- -- -- -- -- --WHITE RIVER DESCHUTES 67 2,028 30.3 -- -- 26.0
COLUMBIA ZONE -- 3,113 -- 0.7 1.4 8.7
METOLIUS DESCHUTES 89 151 1.7 1.1 2.7 11.6 N PAULINA DESCHUTES 130 112 0.9 1.2 1.3 5.2 S PAULINA DESCHUTES 136 928 6.8 4.9 7.0 7.7PAULINA DESCHUTES 266 1,040 3.9 3.2 4.3 6.5UPPER DESCHUTES DESCHUTES 74 48 0.6 0.7 1.7 1.8FORT ROCK KLAMATH 60 1,505 25.1 21.2 -- 35.0SILVER LAKE KLAMATH 65 2,719 41.8 38.1 -- 55.0SPRAGUE KLAMATH -- -- -- -- -- 32.0KLAMATH FALLS KLAMATH 86 507 5.9 5.0 -- 15.0KENO KLAMATH 28 140 5.0 5.5 5.6 15.0 E INTERSTATE KLAMATH 65 682 10.5 8.9 -- 24.0 W INTERSTATE KLAMATH 113 495 4.4 3.5 -- 11.5INTERSTATE KLAMATH 178 1,177 6.6 5.5 -- 16.0WARNER KLAMATH 87 777 8.9 5.6 -- 23.0
SOUTH-CENTRAL ZONE 933 8,064 8.6 7.4 3.7 16.4
CENTRAL AREA TOTAL -- 11,177 -- 7.2 -- 14.1
N WAGONTIRE DESCHUTES 64 32 0.5 1.1 -- -- N WAGONTIRE MALHEUR 15 78 5.2 4.7 -- -- S WAGONTIRE KLAMATH 40 32 0.8 1.3 -- --WAGONTIRE 119 142 1.2 1.6 -- 3.3 E BEATYS BUTTE MALHEUR 35 146 4.2 4.7 -- 7.5 W BEATYS BUTTE KLAMATH 62 168 2.7 1.0 -- 7.5BEATYS BUTTE 97 314 3.2 2.4 -- 7.5 E JUNIPER MALHEUR 60 102 1.7 1.1 -- -- W JUNIPER KLAMATH -- -- -- -- -- --JUNIPER 60 102 1.7 1.1 -- --STEENS MT MALHEUR 93 1,001 10.8 9.5 -- 25.0E WHITEHORSE MALHEUR -- 495 -- -- -- 13.3 E TROUT CR MALHEUR -- 159 -- -- -- 9.0 W TROUT CR MALHEUR 45 110 2.4 1.3 -- 9.0TROUT CR MT MALHEUR -- 269 -- -- -- 9.0OWYHEE MALHEUR -- 2,445 -- -- -- 7.4
SOUTHEAST AREA TOTALS -- 5,595 -- -- -- 12.1
CENTRAL/SE AREA TOTAL -- 16,772 -- -- -- 13.6-- 27,126
MULE DEER GRAND TOTAL -- 43,898 -- -- -- 13.4
MULE DEER POPULATION TRENDS REPORT
Oregon Department of Fish and Wildlife
Big Game Statistics: Deer
��
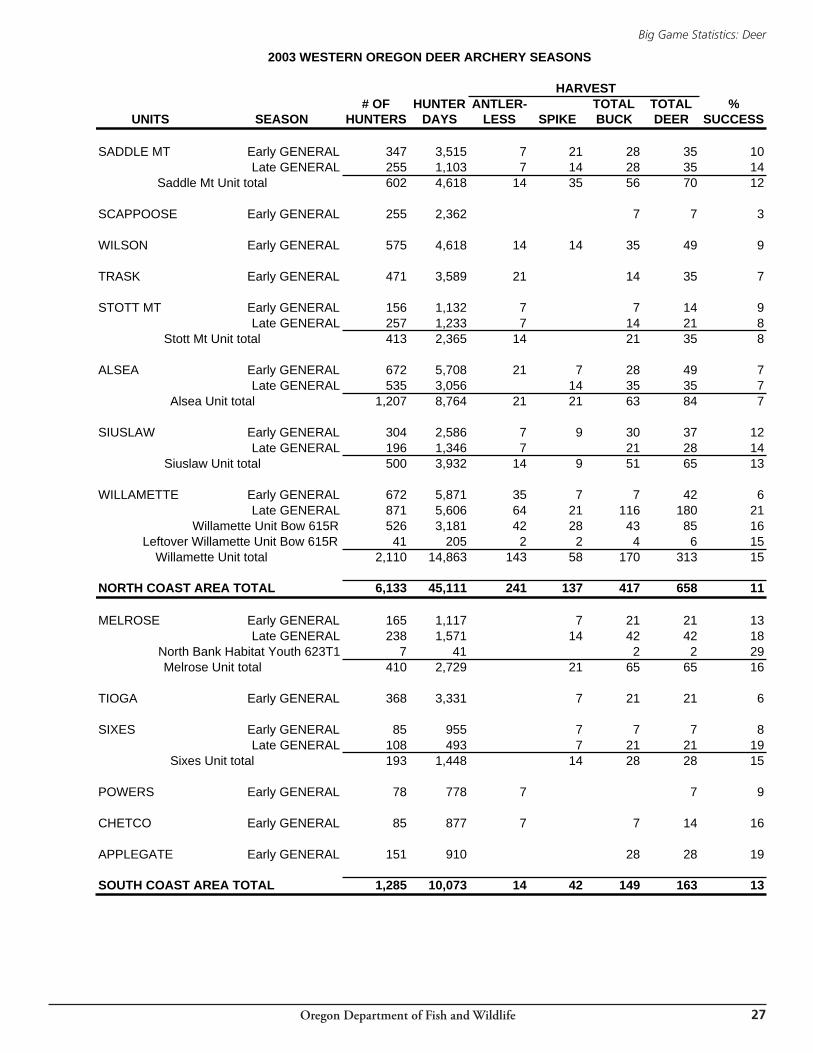
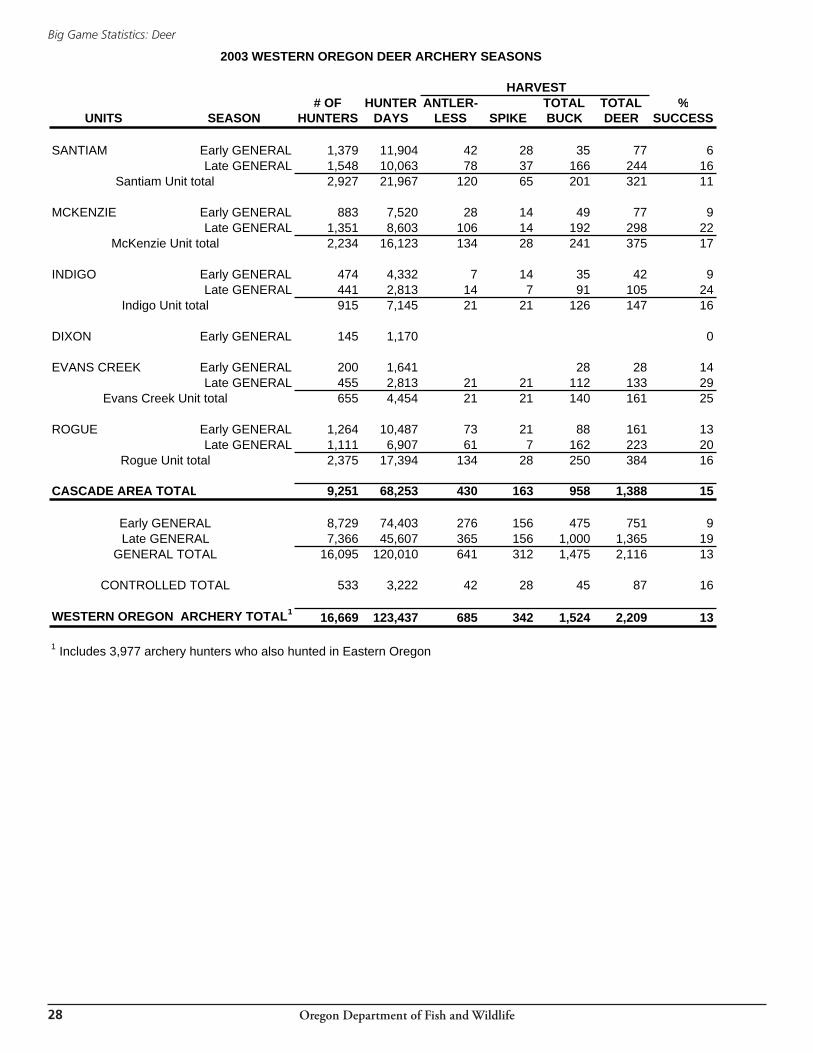
2003 WESTERN OREGON DEER ARCHERY SEASONS
HARVEST# OF HUNTER ANTLER- TOTAL TOTAL %
UNITS SEASON HUNTERS DAYS LESS SPIKE BUCK DEER SUCCESS
SADDLE MT Early GENERAL 347 3,515 7 21 28 35 10Late GENERAL 255 1,103 7 14 28 35 14
Saddle Mt Unit total 602 4,618 14 35 56 70 12
SCAPPOOSE Early GENERAL 255 2,362 7 7 3
WILSON Early GENERAL 575 4,618 14 14 35 49 9
TRASK Early GENERAL 471 3,589 21 14 35 7
STOTT MT Early GENERAL 156 1,132 7 7 14 9Late GENERAL 257 1,233 7 14 21 8
Stott Mt Unit total 413 2,365 14 21 35 8
ALSEA Early GENERAL 672 5,708 21 7 28 49 7Late GENERAL 535 3,056 14 35 35 7
Alsea Unit total 1,207 8,764 21 21 63 84 7
SIUSLAW Early GENERAL 304 2,586 7 9 30 37 12Late GENERAL 196 1,346 7 21 28 14
Siuslaw Unit total 500 3,932 14 9 51 65 13
WILLAMETTE Early GENERAL 672 5,871 35 7 7 42 6Late GENERAL 871 5,606 64 21 116 180 21
Willamette Unit Bow 615R 526 3,181 42 28 43 85 16Leftover Willamette Unit Bow 615R 41 205 2 2 4 6 15
Willamette Unit total 2,110 14,863 143 58 170 313 15
NORTH COAST AREA TOTAL 6,133 45,111 241 137 417 658 11
MELROSE Early GENERAL 165 1,117 7 21 21 13Late GENERAL 238 1,571 14 42 42 18
North Bank Habitat Youth 623T1 7 41 2 2 29Melrose Unit total 410 2,729 21 65 65 16
TIOGA Early GENERAL 368 3,331 7 21 21 6
SIXES Early GENERAL 85 955 7 7 7 8Late GENERAL 108 493 7 21 21 19
Sixes Unit total 193 1,448 14 28 28 15
POWERS Early GENERAL 78 778 7 7 9
CHETCO Early GENERAL 85 877 7 7 14 16
APPLEGATE Early GENERAL 151 910 28 28 19
SOUTH COAST AREA TOTAL 1,285 10,073 14 42 149 163 13
Oregon Department of Fish and Wildlife
Big Game Statistics: Deer
��
2003 WESTERN OREGON DEER ARCHERY SEASONS
HARVEST# OF HUNTER ANTLER- TOTAL TOTAL %
UNITS SEASON HUNTERS DAYS LESS SPIKE BUCK DEER SUCCESS
SANTIAM Early GENERAL 1,379 11,904 42 28 35 77 6Late GENERAL 1,548 10,063 78 37 166 244 16
Santiam Unit total 2,927 21,967 120 65 201 321 11
MCKENZIE Early GENERAL 883 7,520 28 14 49 77 9Late GENERAL 1,351 8,603 106 14 192 298 22
McKenzie Unit total 2,234 16,123 134 28 241 375 17
INDIGO Early GENERAL 474 4,332 7 14 35 42 9Late GENERAL 441 2,813 14 7 91 105 24
Indigo Unit total 915 7,145 21 21 126 147 16
DIXON Early GENERAL 145 1,170 0
EVANS CREEK Early GENERAL 200 1,641 28 28 14Late GENERAL 455 2,813 21 21 112 133 29
Evans Creek Unit total 655 4,454 21 21 140 161 25
ROGUE Early GENERAL 1,264 10,487 73 21 88 161 13Late GENERAL 1,111 6,907 61 7 162 223 20
Rogue Unit total 2,375 17,394 134 28 250 384 16
CASCADE AREA TOTAL 9,251 68,253 430 163 958 1,388 15
Early GENERAL 8,729 74,403 276 156 475 751 9Late GENERAL 7,366 45,607 365 156 1,000 1,365 19
GENERAL TOTAL 16,095 120,010 641 312 1,475 2,116 13
CONTROLLED TOTAL 533 3,222 42 28 45 87 16
WESTERN OREGON ARCHERY TOTAL1 16,669 123,437 685 342 1,524 2,209 13
1 Includes 3,977 archery hunters who also hunted in Eastern Oregon
Oregon Department of Fish and Wildlife
Big Game Statistics: Deer
��
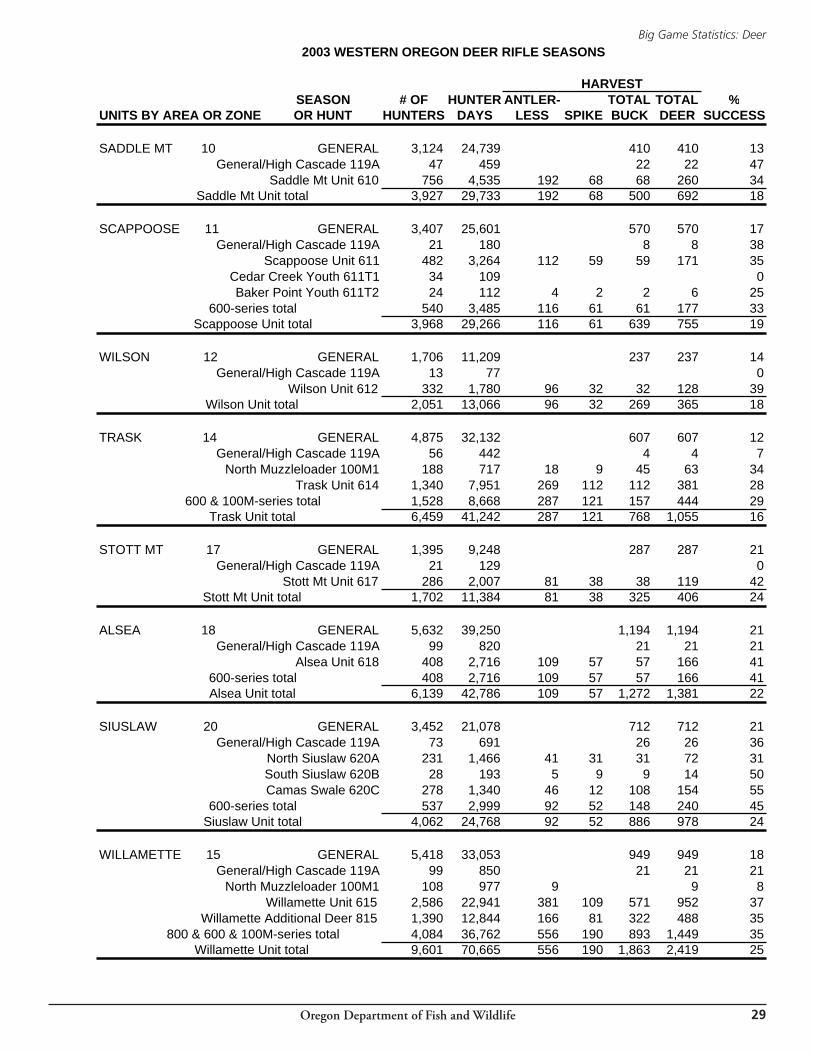
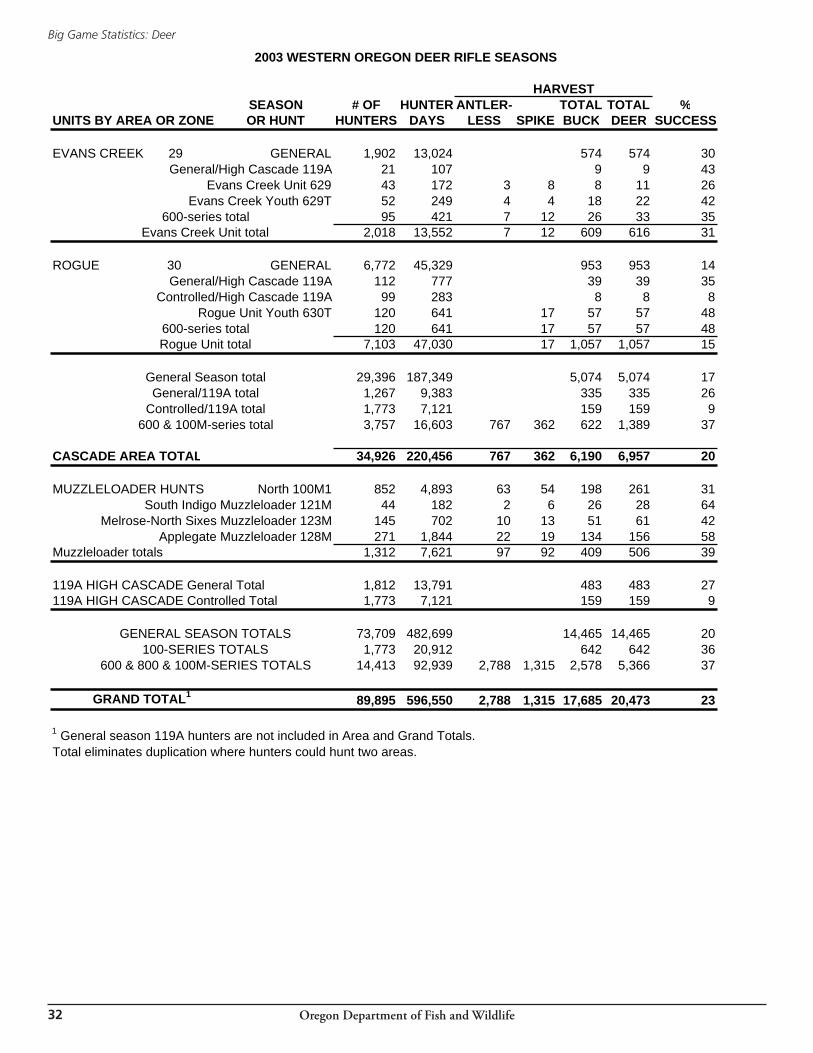
2003 WESTERN OREGON DEER RIFLE SEASONS
HARVESTSEASON # OF HUNTER ANTLER- TOTAL TOTAL %
UNITS BY AREA OR ZONE OR HUNT HUNTERS DAYS LESS SPIKE BUCK DEER SUCCESS
SADDLE MT 10 GENERAL 3,124 24,739 410 410 13General/High Cascade 119A 47 459 22 22 47
Saddle Mt Unit 610 756 4,535 192 68 68 260 34Saddle Mt Unit total 3,927 29,733 192 68 500 692 18
SCAPPOOSE 11 GENERAL 3,407 25,601 570 570 17General/High Cascade 119A 21 180 8 8 38
Scappoose Unit 611 482 3,264 112 59 59 171 35Cedar Creek Youth 611T1 34 109 0Baker Point Youth 611T2 24 112 4 2 2 6 25
600-series total 540 3,485 116 61 61 177 33Scappoose Unit total 3,968 29,266 116 61 639 755 19
WILSON 12 GENERAL 1,706 11,209 237 237 14General/High Cascade 119A 13 77 0
Wilson Unit 612 332 1,780 96 32 32 128 39Wilson Unit total 2,051 13,066 96 32 269 365 18
TRASK 14 GENERAL 4,875 32,132 607 607 12General/High Cascade 119A 56 442 4 4 7
North Muzzleloader 100M1 188 717 18 9 45 63 34Trask Unit 614 1,340 7,951 269 112 112 381 28
600 & 100M-series total 1,528 8,668 287 121 157 444 29Trask Unit total 6,459 41,242 287 121 768 1,055 16
STOTT MT 17 GENERAL 1,395 9,248 287 287 21General/High Cascade 119A 21 129 0
Stott Mt Unit 617 286 2,007 81 38 38 119 42Stott Mt Unit total 1,702 11,384 81 38 325 406 24
ALSEA 18 GENERAL 5,632 39,250 1,194 1,194 21General/High Cascade 119A 99 820 21 21 21
Alsea Unit 618 408 2,716 109 57 57 166 41600-series total 408 2,716 109 57 57 166 41Alsea Unit total 6,139 42,786 109 57 1,272 1,381 22
SIUSLAW 20 GENERAL 3,452 21,078 712 712 21General/High Cascade 119A 73 691 26 26 36
North Siuslaw 620A 231 1,466 41 31 31 72 31South Siuslaw 620B 28 193 5 9 9 14 50Camas Swale 620C 278 1,340 46 12 108 154 55
600-series total 537 2,999 92 52 148 240 45Siuslaw Unit total 4,062 24,768 92 52 886 978 24
WILLAMETTE 15 GENERAL 5,418 33,053 949 949 18General/High Cascade 119A 99 850 21 21 21
North Muzzleloader 100M1 108 977 9 9 8Willamette Unit 615 2,586 22,941 381 109 571 952 37
Willamette Additional Deer 815 1,390 12,844 166 81 322 488 35800 & 600 & 100M-series total 4,084 36,762 556 190 893 1,449 35
Willamette Unit total 9,601 70,665 556 190 1,863 2,419 25
Oregon Department of Fish and Wildlife
Big Game Statistics: Deer
�0
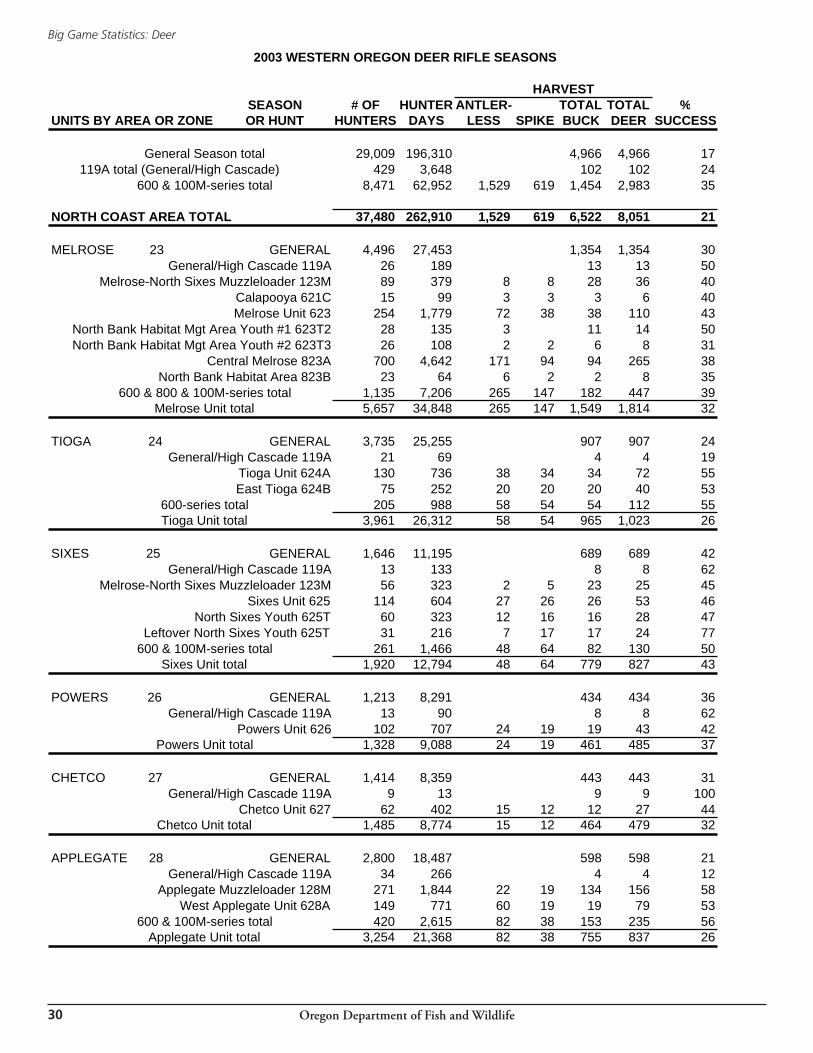
2003 WESTERN OREGON DEER RIFLE SEASONS
HARVESTSEASON # OF HUNTER ANTLER- TOTAL TOTAL %
UNITS BY AREA OR ZONE OR HUNT HUNTERS DAYS LESS SPIKE BUCK DEER SUCCESS
General Season total 29,009 196,310 4,966 4,966 17 119A total (General/High Cascade) 429 3,648 102 102 24
600 & 100M-series total 8,471 62,952 1,529 619 1,454 2,983 35
NORTH COAST AREA TOTAL 37,480 262,910 1,529 619 6,522 8,051 21
MELROSE 23 GENERAL 4,496 27,453 1,354 1,354 30General/High Cascade 119A 26 189 13 13 50
Melrose-North Sixes Muzzleloader 123M 89 379 8 8 28 36 40Calapooya 621C 15 99 3 3 3 6 40Melrose Unit 623 254 1,779 72 38 38 110 43
North Bank Habitat Mgt Area Youth #1 623T2 28 135 3 11 14 50North Bank Habitat Mgt Area Youth #2 623T3 26 108 2 2 6 8 31
Central Melrose 823A 700 4,642 171 94 94 265 38North Bank Habitat Area 823B 23 64 6 2 2 8 35
600 & 800 & 100M-series total 1,135 7,206 265 147 182 447 39Melrose Unit total 5,657 34,848 265 147 1,549 1,814 32
TIOGA 24 GENERAL 3,735 25,255 907 907 24General/High Cascade 119A 21 69 4 4 19
Tioga Unit 624A 130 736 38 34 34 72 55East Tioga 624B 75 252 20 20 20 40 53
600-series total 205 988 58 54 54 112 55Tioga Unit total 3,961 26,312 58 54 965 1,023 26
SIXES 25 GENERAL 1,646 11,195 689 689 42General/High Cascade 119A 13 133 8 8 62
Melrose-North Sixes Muzzleloader 123M 56 323 2 5 23 25 45Sixes Unit 625 114 604 27 26 26 53 46
North Sixes Youth 625T 60 323 12 16 16 28 47Leftover North Sixes Youth 625T 31 216 7 17 17 24 77
600 & 100M-series total 261 1,466 48 64 82 130 50Sixes Unit total 1,920 12,794 48 64 779 827 43
POWERS 26 GENERAL 1,213 8,291 434 434 36General/High Cascade 119A 13 90 8 8 62
Powers Unit 626 102 707 24 19 19 43 42Powers Unit total 1,328 9,088 24 19 461 485 37
CHETCO 27 GENERAL 1,414 8,359 443 443 31General/High Cascade 119A 9 13 9 9 100
Chetco Unit 627 62 402 15 12 12 27 44Chetco Unit total 1,485 8,774 15 12 464 479 32
APPLEGATE 28 GENERAL 2,800 18,487 598 598 21General/High Cascade 119A 34 266 4 4 12
Applegate Muzzleloader 128M 271 1,844 22 19 134 156 58West Applegate Unit 628A 149 771 60 19 19 79 53
600 & 100M-series total 420 2,615 82 38 153 235 56Applegate Unit total 3,254 21,368 82 38 755 837 26
Oregon Department of Fish and Wildlife
Big Game Statistics: Deer
�1
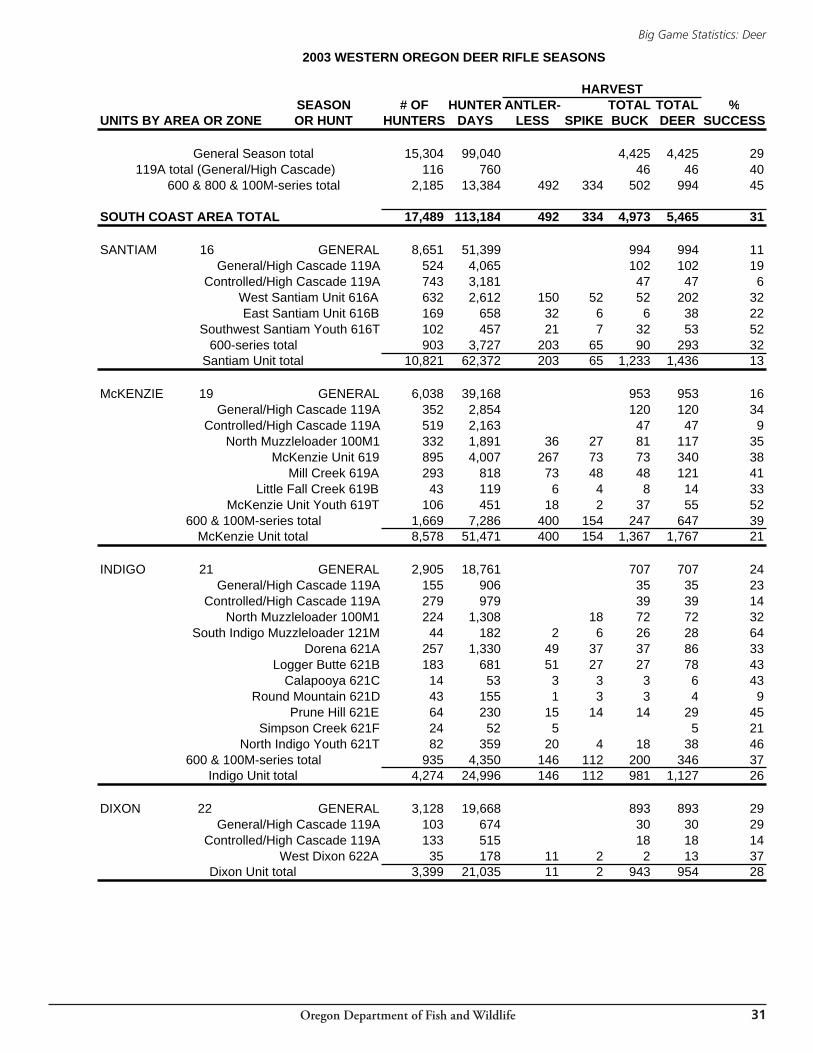
2003 WESTERN OREGON DEER RIFLE SEASONS
HARVESTSEASON # OF HUNTER ANTLER- TOTAL TOTAL %
UNITS BY AREA OR ZONE OR HUNT HUNTERS DAYS LESS SPIKE BUCK DEER SUCCESS
General Season total 15,304 99,040 4,425 4,425 29 119A total (General/High Cascade) 116 760 46 46 40
600 & 800 & 100M-series total 2,185 13,384 492 334 502 994 45
SOUTH COAST AREA TOTAL 17,489 113,184 492 334 4,973 5,465 31
SANTIAM 16 GENERAL 8,651 51,399 994 994 11General/High Cascade 119A 524 4,065 102 102 19
Controlled/High Cascade 119A 743 3,181 47 47 6West Santiam Unit 616A 632 2,612 150 52 52 202 32East Santiam Unit 616B 169 658 32 6 6 38 22
Southwest Santiam Youth 616T 102 457 21 7 32 53 52600-series total 903 3,727 203 65 90 293 32
Santiam Unit total 10,821 62,372 203 65 1,233 1,436 13
McKENZIE 19 GENERAL 6,038 39,168 953 953 16General/High Cascade 119A 352 2,854 120 120 34
Controlled/High Cascade 119A 519 2,163 47 47 9North Muzzleloader 100M1 332 1,891 36 27 81 117 35
McKenzie Unit 619 895 4,007 267 73 73 340 38Mill Creek 619A 293 818 73 48 48 121 41
Little Fall Creek 619B 43 119 6 4 8 14 33McKenzie Unit Youth 619T 106 451 18 2 37 55 52
600 & 100M-series total 1,669 7,286 400 154 247 647 39McKenzie Unit total 8,578 51,471 400 154 1,367 1,767 21
INDIGO 21 GENERAL 2,905 18,761 707 707 24General/High Cascade 119A 155 906 35 35 23
Controlled/High Cascade 119A 279 979 39 39 14North Muzzleloader 100M1 224 1,308 18 72 72 32
South Indigo Muzzleloader 121M 44 182 2 6 26 28 64Dorena 621A 257 1,330 49 37 37 86 33
Logger Butte 621B 183 681 51 27 27 78 43Calapooya 621C 14 53 3 3 3 6 43
Round Mountain 621D 43 155 1 3 3 4 9Prune Hill 621E 64 230 15 14 14 29 45
Simpson Creek 621F 24 52 5 5 21North Indigo Youth 621T 82 359 20 4 18 38 46
600 & 100M-series total 935 4,350 146 112 200 346 37Indigo Unit total 4,274 24,996 146 112 981 1,127 26
DIXON 22 GENERAL 3,128 19,668 893 893 29General/High Cascade 119A 103 674 30 30 29
Controlled/High Cascade 119A 133 515 18 18 14West Dixon 622A 35 178 11 2 2 13 37
Dixon Unit total 3,399 21,035 11 2 943 954 28
Oregon Department of Fish and Wildlife
Big Game Statistics: Deer
��
2003 WESTERN OREGON DEER RIFLE SEASONS
HARVESTSEASON # OF HUNTER ANTLER- TOTAL TOTAL %
UNITS BY AREA OR ZONE OR HUNT HUNTERS DAYS LESS SPIKE BUCK DEER SUCCESS
EVANS CREEK 29 GENERAL 1,902 13,024 574 574 30General/High Cascade 119A 21 107 9 9 43
Evans Creek Unit 629 43 172 3 8 8 11 26Evans Creek Youth 629T 52 249 4 4 18 22 42
600-series total 95 421 7 12 26 33 35Evans Creek Unit total 2,018 13,552 7 12 609 616 31
ROGUE 30 GENERAL 6,772 45,329 953 953 14General/High Cascade 119A 112 777 39 39 35
Controlled/High Cascade 119A 99 283 8 8 8Rogue Unit Youth 630T 120 641 17 57 57 48
600-series total 120 641 17 57 57 48Rogue Unit total 7,103 47,030 17 1,057 1,057 15
General Season total 29,396 187,349 5,074 5,074 17General/119A total 1,267 9,383 335 335 26
Controlled/119A total 1,773 7,121 159 159 9600 & 100M-series total 3,757 16,603 767 362 622 1,389 37
CASCADE AREA TOTAL 34,926 220,456 767 362 6,190 6,957 20
MUZZLELOADER HUNTS North 100M1 852 4,893 63 54 198 261 31South Indigo Muzzleloader 121M 44 182 2 6 26 28 64
Melrose-North Sixes Muzzleloader 123M 145 702 10 13 51 61 42Applegate Muzzleloader 128M 271 1,844 22 19 134 156 58
Muzzleloader totals 1,312 7,621 97 92 409 506 39
119A HIGH CASCADE General Total 1,812 13,791 483 483 27119A HIGH CASCADE Controlled Total 1,773 7,121 159 159 9
GENERAL SEASON TOTALS 73,709 482,699 14,465 14,465 20100-SERIES TOTALS 1,773 20,912 642 642 36
600 & 800 & 100M-SERIES TOTALS 14,413 92,939 2,788 1,315 2,578 5,366 37
GRAND TOTAL1 89,895 596,550 2,788 1,315 17,685 20,473 23
1 General season 119A hunters are not included in Area and Grand Totals.Total eliminates duplication where hunters could hunt two areas.
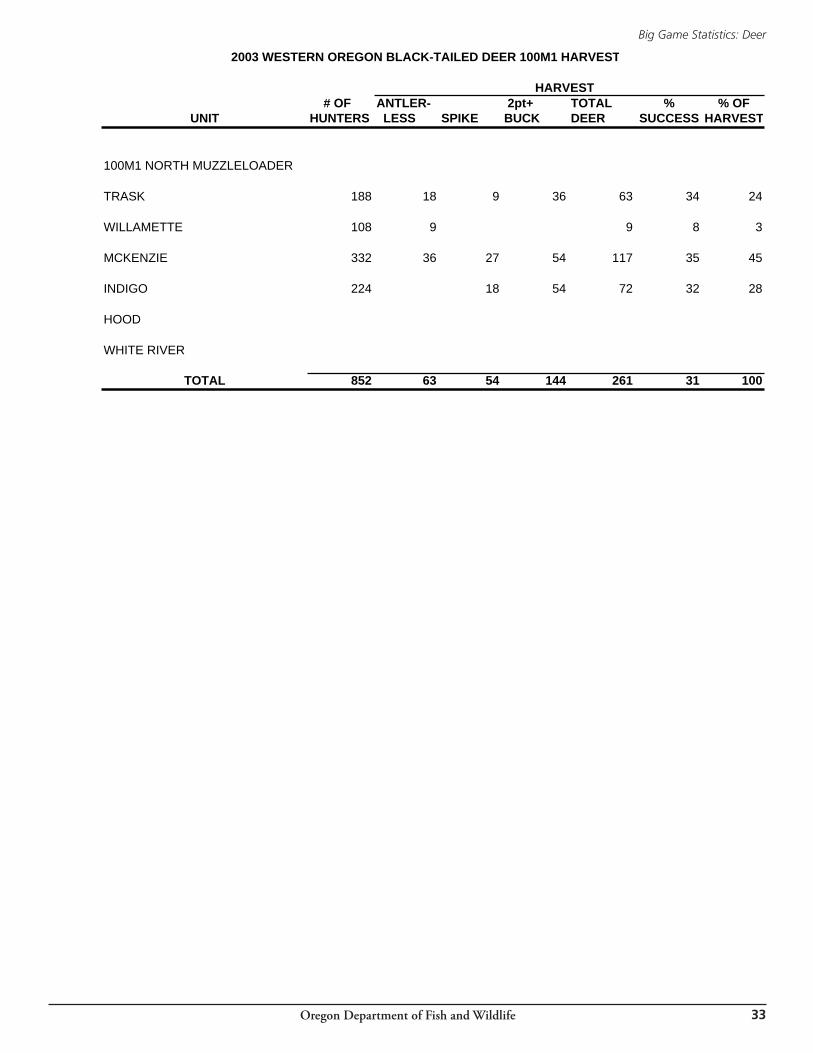
Oregon Department of Fish and Wildlife
Big Game Statistics: Deer
��
2003 WESTERN OREGON BLACK-TAILED DEER 100M1 HARVEST
HARVEST # OF ANTLER- 2pt+ TOTAL % % OF
UNIT HUNTERS LESS SPIKE BUCK DEER SUCCESS HARVEST
100M1 NORTH MUZZLELOADER
TRASK 188 18 9 36 63 34 24
WILLAMETTE 108 9 9 8 3
MCKENZIE 332 36 27 54 117 35 45
INDIGO 224 18 54 72 32 28
HOOD
WHITE RIVER
TOTAL 852 63 54 144 261 31 100
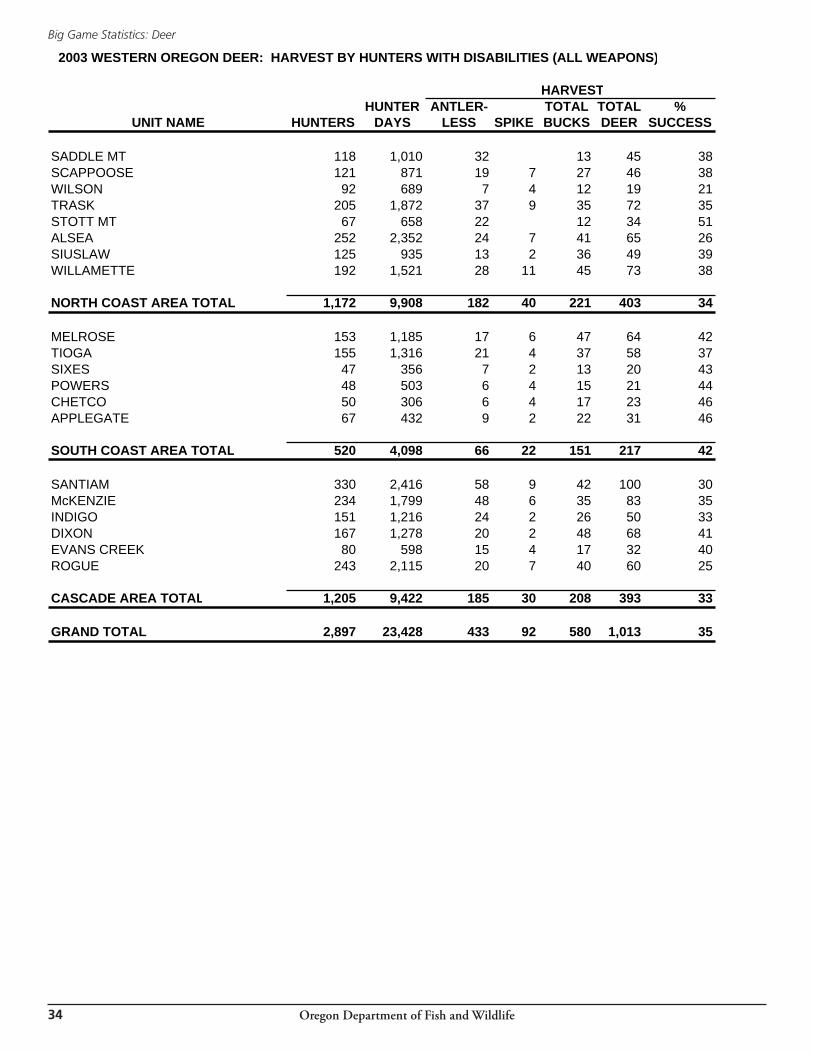
Oregon Department of Fish and Wildlife
Big Game Statistics: Deer
��
2003 WESTERN OREGON DEER: HARVEST BY HUNTERS WITH DISABILITIES (ALL WEAPONS)
HARVESTHUNTER ANTLER- TOTAL TOTAL %
UNIT NAME HUNTERS DAYS LESS SPIKE BUCKS DEER SUCCESS
SADDLE MT 118 1,010 32 13 45 38SCAPPOOSE 121 871 19 7 27 46 38WILSON 92 689 7 4 12 19 21TRASK 205 1,872 37 9 35 72 35STOTT MT 67 658 22 12 34 51ALSEA 252 2,352 24 7 41 65 26SIUSLAW 125 935 13 2 36 49 39WILLAMETTE 192 1,521 28 11 45 73 38
NORTH COAST AREA TOTAL 1,172 9,908 182 40 221 403 34
MELROSE 153 1,185 17 6 47 64 42TIOGA 155 1,316 21 4 37 58 37SIXES 47 356 7 2 13 20 43POWERS 48 503 6 4 15 21 44CHETCO 50 306 6 4 17 23 46APPLEGATE 67 432 9 2 22 31 46
SOUTH COAST AREA TOTAL 520 4,098 66 22 151 217 42
SANTIAM 330 2,416 58 9 42 100 30McKENZIE 234 1,799 48 6 35 83 35INDIGO 151 1,216 24 2 26 50 33DIXON 167 1,278 20 2 48 68 41EVANS CREEK 80 598 15 4 17 32 40ROGUE 243 2,115 20 7 40 60 25
CASCADE AREA TOTAL 1,205 9,422 185 30 208 393 33
GRAND TOTAL 2,897 23,428 433 92 580 1,013 35
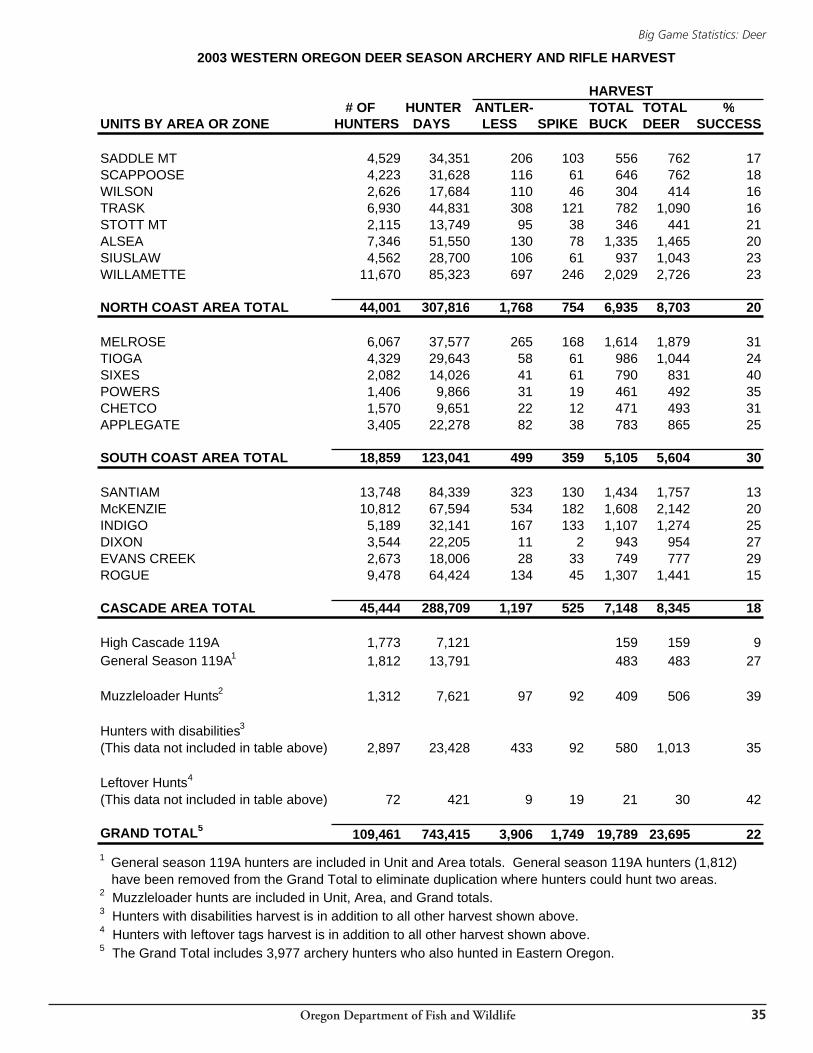
Oregon Department of Fish and Wildlife
Big Game Statistics: Deer
��
2003 WESTERN OREGON DEER SEASON ARCHERY AND RIFLE HARVEST
HARVEST # OF HUNTER ANTLER- TOTAL TOTAL %
UNITS BY AREA OR ZONE HUNTERS DAYS LESS SPIKE BUCK DEER SUCCESS
SADDLE MT 4,529 34,351 206 103 556 762 17SCAPPOOSE 4,223 31,628 116 61 646 762 18WILSON 2,626 17,684 110 46 304 414 16TRASK 6,930 44,831 308 121 782 1,090 16STOTT MT 2,115 13,749 95 38 346 441 21ALSEA 7,346 51,550 130 78 1,335 1,465 20SIUSLAW 4,562 28,700 106 61 937 1,043 23WILLAMETTE 11,670 85,323 697 246 2,029 2,726 23
NORTH COAST AREA TOTAL 44,001 307,816 1,768 754 6,935 8,703 20
MELROSE 6,067 37,577 265 168 1,614 1,879 31TIOGA 4,329 29,643 58 61 986 1,044 24SIXES 2,082 14,026 41 61 790 831 40POWERS 1,406 9,866 31 19 461 492 35CHETCO 1,570 9,651 22 12 471 493 31APPLEGATE 3,405 22,278 82 38 783 865 25
SOUTH COAST AREA TOTAL 18,859 123,041 499 359 5,105 5,604 30
SANTIAM 13,748 84,339 323 130 1,434 1,757 13McKENZIE 10,812 67,594 534 182 1,608 2,142 20INDIGO 5,189 32,141 167 133 1,107 1,274 25DIXON 3,544 22,205 11 2 943 954 27EVANS CREEK 2,673 18,006 28 33 749 777 29ROGUE 9,478 64,424 134 45 1,307 1,441 15
CASCADE AREA TOTAL 45,444 288,709 1,197 525 7,148 8,345 18
High Cascade 119A 1,773 7,121 159 159 9General Season 119A1 1,812 13,791 483 483 27
Muzzleloader Hunts2 1,312 7,621 97 92 409 506 39
Hunters with disabilities3
(This data not included in table above) 2,897 23,428 433 92 580 1,013 35
Leftover Hunts4
(This data not included in table above) 72 421 9 19 21 30 42
GRAND TOTAL5 109,461 743,415 3,906 1,749 19,789 23,695 221 General season 119A hunters are included in Unit and Area totals. General season 119A hunters (1,812) have been removed from the Grand Total to eliminate duplication where hunters could hunt two areas.2 Muzzleloader hunts are included in Unit, Area, and Grand totals. 3 Hunters with disabilities harvest is in addition to all other harvest shown above.4 Hunters with leftover tags harvest is in addition to all other harvest shown above.5 The Grand Total includes 3,977 archery hunters who also hunted in Eastern Oregon.
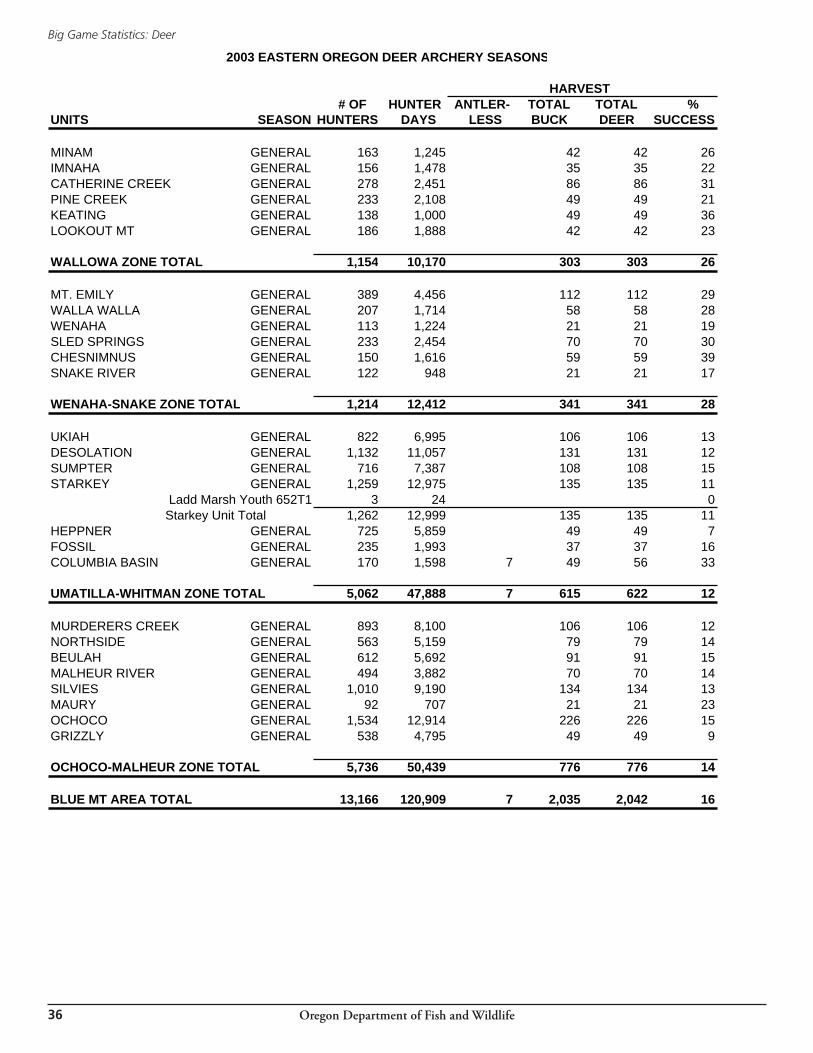
Oregon Department of Fish and Wildlife
Big Game Statistics: Deer
��
2003 EASTERN OREGON DEER ARCHERY SEASONS
HARVEST # OF HUNTER ANTLER- TOTAL TOTAL %
UNITS SEASON HUNTERS DAYS LESS BUCK DEER SUCCESS
MINAM GENERAL 163 1,245 42 42 26IMNAHA GENERAL 156 1,478 35 35 22CATHERINE CREEK GENERAL 278 2,451 86 86 31PINE CREEK GENERAL 233 2,108 49 49 21KEATING GENERAL 138 1,000 49 49 36LOOKOUT MT GENERAL 186 1,888 42 42 23
WALLOWA ZONE TOTAL 1,154 10,170 303 303 26
MT. EMILY GENERAL 389 4,456 112 112 29WALLA WALLA GENERAL 207 1,714 58 58 28WENAHA GENERAL 113 1,224 21 21 19SLED SPRINGS GENERAL 233 2,454 70 70 30CHESNIMNUS GENERAL 150 1,616 59 59 39SNAKE RIVER GENERAL 122 948 21 21 17
WENAHA-SNAKE ZONE TOTAL 1,214 12,412 341 341 28
UKIAH GENERAL 822 6,995 106 106 13DESOLATION GENERAL 1,132 11,057 131 131 12SUMPTER GENERAL 716 7,387 108 108 15STARKEY GENERAL 1,259 12,975 135 135 11
Ladd Marsh Youth 652T1 3 24 0Starkey Unit Total 1,262 12,999 135 135 11
HEPPNER GENERAL 725 5,859 49 49 7FOSSIL GENERAL 235 1,993 37 37 16COLUMBIA BASIN GENERAL 170 1,598 7 49 56 33
UMATILLA-WHITMAN ZONE TOTAL 5,062 47,888 7 615 622 12
MURDERERS CREEK GENERAL 893 8,100 106 106 12NORTHSIDE GENERAL 563 5,159 79 79 14BEULAH GENERAL 612 5,692 91 91 15MALHEUR RIVER GENERAL 494 3,882 70 70 14SILVIES GENERAL 1,010 9,190 134 134 13MAURY GENERAL 92 707 21 21 23OCHOCO GENERAL 1,534 12,914 226 226 15GRIZZLY GENERAL 538 4,795 49 49 9
OCHOCO-MALHEUR ZONE TOTAL 5,736 50,439 776 776 14
BLUE MT AREA TOTAL 13,166 120,909 7 2,035 2,042 16
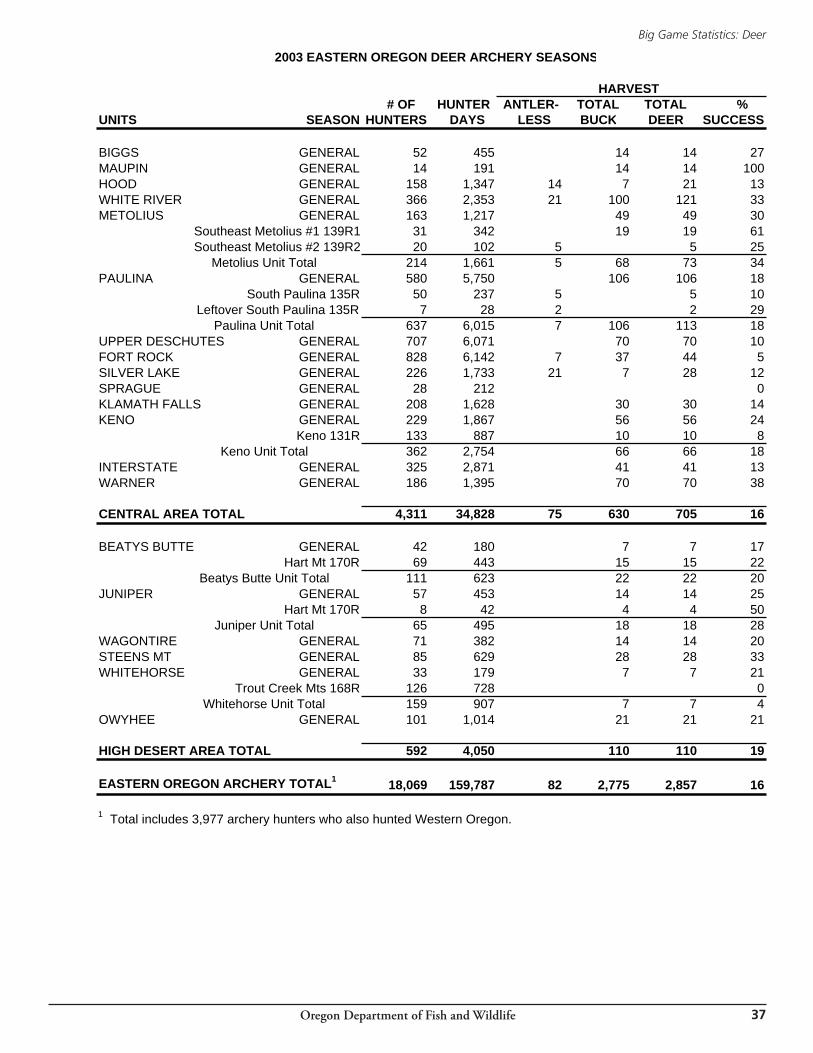
Oregon Department of Fish and Wildlife
Big Game Statistics: Deer
��
2003 EASTERN OREGON DEER ARCHERY SEASONS
HARVEST # OF HUNTER ANTLER- TOTAL TOTAL %
UNITS SEASON HUNTERS DAYS LESS BUCK DEER SUCCESS
BIGGS GENERAL 52 455 14 14 27MAUPIN GENERAL 14 191 14 14 100HOOD GENERAL 158 1,347 14 7 21 13WHITE RIVER GENERAL 366 2,353 21 100 121 33METOLIUS GENERAL 163 1,217 49 49 30
Southeast Metolius #1 139R1 31 342 19 19 61Southeast Metolius #2 139R2 20 102 5 5 25
Metolius Unit Total 214 1,661 5 68 73 34PAULINA GENERAL 580 5,750 106 106 18
South Paulina 135R 50 237 5 5 10Leftover South Paulina 135R 7 28 2 2 29
Paulina Unit Total 637 6,015 7 106 113 18UPPER DESCHUTES GENERAL 707 6,071 70 70 10FORT ROCK GENERAL 828 6,142 7 37 44 5SILVER LAKE GENERAL 226 1,733 21 7 28 12SPRAGUE GENERAL 28 212 0KLAMATH FALLS GENERAL 208 1,628 30 30 14KENO GENERAL 229 1,867 56 56 24
Keno 131R 133 887 10 10 8Keno Unit Total 362 2,754 66 66 18
INTERSTATE GENERAL 325 2,871 41 41 13WARNER GENERAL 186 1,395 70 70 38
CENTRAL AREA TOTAL 4,311 34,828 75 630 705 16
BEATYS BUTTE GENERAL 42 180 7 7 17Hart Mt 170R 69 443 15 15 22
Beatys Butte Unit Total 111 623 22 22 20JUNIPER GENERAL 57 453 14 14 25
Hart Mt 170R 8 42 4 4 50Juniper Unit Total 65 495 18 18 28
WAGONTIRE GENERAL 71 382 14 14 20STEENS MT GENERAL 85 629 28 28 33WHITEHORSE GENERAL 33 179 7 7 21
Trout Creek Mts 168R 126 728 0Whitehorse Unit Total 159 907 7 7 4
OWYHEE GENERAL 101 1,014 21 21 21
HIGH DESERT AREA TOTAL 592 4,050 110 110 19
EASTERN OREGON ARCHERY TOTAL1 18,069 159,787 82 2,775 2,857 16
1 Total includes 3,977 archery hunters who also hunted Western Oregon.
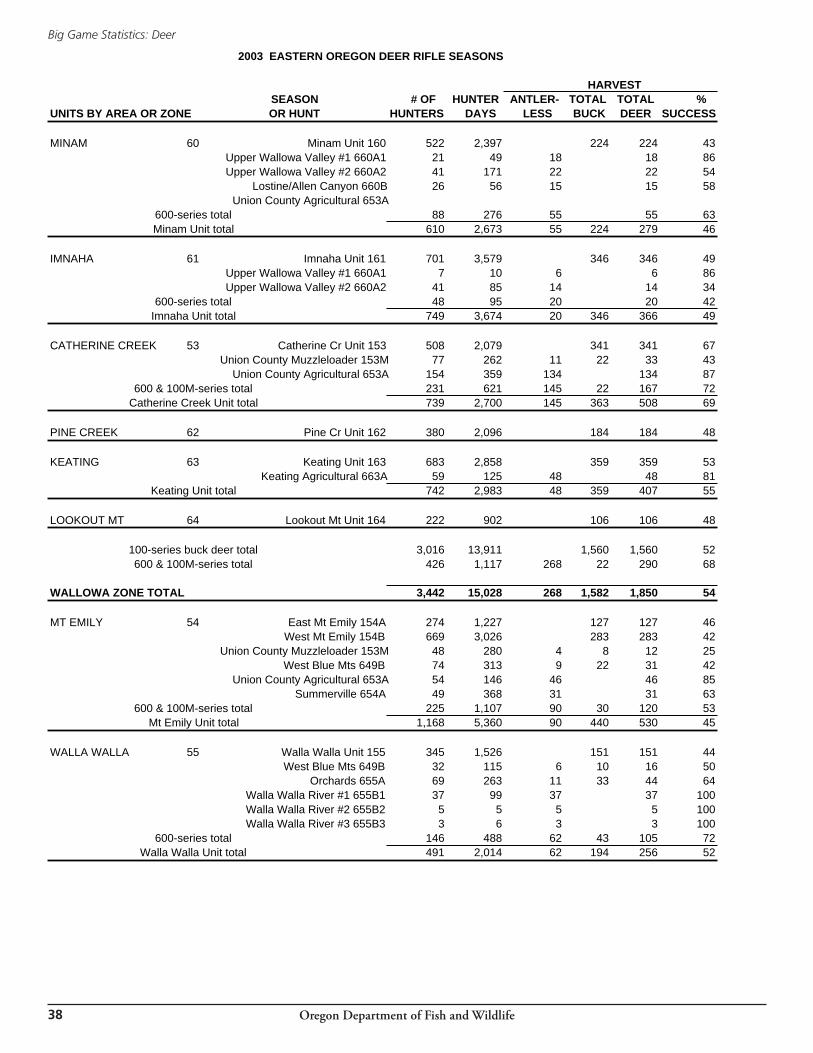
Oregon Department of Fish and Wildlife
Big Game Statistics: Deer
��
2003 EASTERN OREGON DEER RIFLE SEASONS
HARVESTSEASON # OF HUNTER ANTLER- TOTAL TOTAL %
UNITS BY AREA OR ZONE OR HUNT HUNTERS DAYS LESS BUCK DEER SUCCESS
MINAM 60 Minam Unit 160 522 2,397 224 224 43Upper Wallowa Valley #1 660A1 21 49 18 18 86Upper Wallowa Valley #2 660A2 41 171 22 22 54
Lostine/Allen Canyon 660B 26 56 15 15 58Union County Agricultural 653A
600-series total 88 276 55 55 63Minam Unit total 610 2,673 55 224 279 46
IMNAHA 61 Imnaha Unit 161 701 3,579 346 346 49Upper Wallowa Valley #1 660A1 7 10 6 6 86Upper Wallowa Valley #2 660A2 41 85 14 14 34
600-series total 48 95 20 20 42Imnaha Unit total 749 3,674 20 346 366 49
CATHERINE CREEK 53 Catherine Cr Unit 153 508 2,079 341 341 67Union County Muzzleloader 153M 77 262 11 22 33 43
Union County Agricultural 653A 154 359 134 134 87600 & 100M-series total 231 621 145 22 167 72
Catherine Creek Unit total 739 2,700 145 363 508 69
PINE CREEK 62 Pine Cr Unit 162 380 2,096 184 184 48
KEATING 63 Keating Unit 163 683 2,858 359 359 53Keating Agricultural 663A 59 125 48 48 81
Keating Unit total 742 2,983 48 359 407 55
LOOKOUT MT 64 Lookout Mt Unit 164 222 902 106 106 48
100-series buck deer total 3,016 13,911 1,560 1,560 52600 & 100M-series total 426 1,117 268 22 290 68
WALLOWA ZONE TOTAL 3,442 15,028 268 1,582 1,850 54
MT EMILY 54 East Mt Emily 154A 274 1,227 127 127 46West Mt Emily 154B 669 3,026 283 283 42
Union County Muzzleloader 153M 48 280 4 8 12 25West Blue Mts 649B 74 313 9 22 31 42
Union County Agricultural 653A 54 146 46 46 85Summerville 654A 49 368 31 31 63
600 & 100M-series total 225 1,107 90 30 120 53Mt Emily Unit total 1,168 5,360 90 440 530 45
WALLA WALLA 55 Walla Walla Unit 155 345 1,526 151 151 44West Blue Mts 649B 32 115 6 10 16 50
Orchards 655A 69 263 11 33 44 64Walla Walla River #1 655B1 37 99 37 37 100Walla Walla River #2 655B2 5 5 5 5 100Walla Walla River #3 655B3 3 6 3 3 100
600-series total 146 488 62 43 105 72Walla Walla Unit total 491 2,014 62 194 256 52
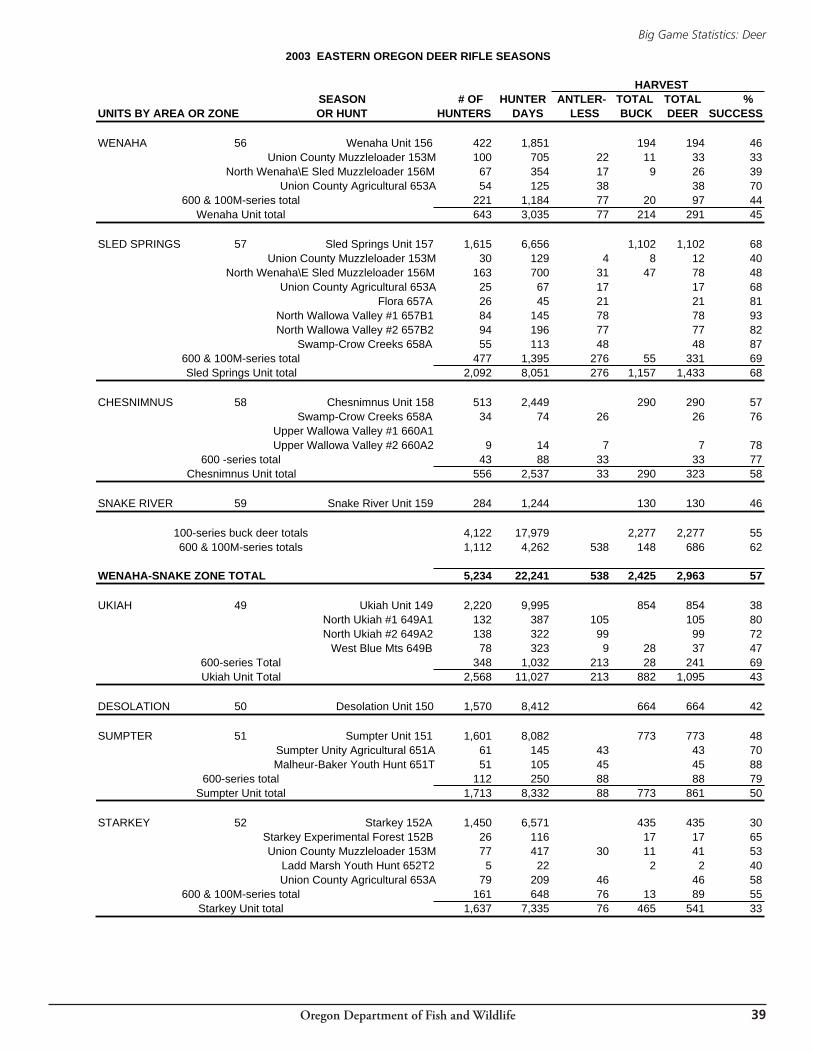
Oregon Department of Fish and Wildlife
Big Game Statistics: Deer
��
2003 EASTERN OREGON DEER RIFLE SEASONS
HARVESTSEASON # OF HUNTER ANTLER- TOTAL TOTAL %
UNITS BY AREA OR ZONE OR HUNT HUNTERS DAYS LESS BUCK DEER SUCCESS
WENAHA 56 Wenaha Unit 156 422 1,851 194 194 46Union County Muzzleloader 153M 100 705 22 11 33 33
North Wenaha\E Sled Muzzleloader 156M 67 354 17 9 26 39Union County Agricultural 653A 54 125 38 38 70
600 & 100M-series total 221 1,184 77 20 97 44Wenaha Unit total 643 3,035 77 214 291 45
SLED SPRINGS 57 Sled Springs Unit 157 1,615 6,656 1,102 1,102 68Union County Muzzleloader 153M 30 129 4 8 12 40
North Wenaha\E Sled Muzzleloader 156M 163 700 31 47 78 48Union County Agricultural 653A 25 67 17 17 68
Flora 657A 26 45 21 21 81North Wallowa Valley #1 657B1 84 145 78 78 93North Wallowa Valley #2 657B2 94 196 77 77 82
Swamp-Crow Creeks 658A 55 113 48 48 87600 & 100M-series total 477 1,395 276 55 331 69Sled Springs Unit total 2,092 8,051 276 1,157 1,433 68
CHESNIMNUS 58 Chesnimnus Unit 158 513 2,449 290 290 57Swamp-Crow Creeks 658A 34 74 26 26 76
Upper Wallowa Valley #1 660A1Upper Wallowa Valley #2 660A2 9 14 7 7 78
600 -series total 43 88 33 33 77Chesnimnus Unit total 556 2,537 33 290 323 58
SNAKE RIVER 59 Snake River Unit 159 284 1,244 130 130 46
100-series buck deer totals 4,122 17,979 2,277 2,277 55600 & 100M-series totals 1,112 4,262 538 148 686 62
WENAHA-SNAKE ZONE TOTAL 5,234 22,241 538 2,425 2,963 57
UKIAH 49 Ukiah Unit 149 2,220 9,995 854 854 38North Ukiah #1 649A1 132 387 105 105 80North Ukiah #2 649A2 138 322 99 99 72
West Blue Mts 649B 78 323 9 28 37 47600-series Total 348 1,032 213 28 241 69Ukiah Unit Total 2,568 11,027 213 882 1,095 43
DESOLATION 50 Desolation Unit 150 1,570 8,412 664 664 42
SUMPTER 51 Sumpter Unit 151 1,601 8,082 773 773 48Sumpter Unity Agricultural 651A 61 145 43 43 70Malheur-Baker Youth Hunt 651T 51 105 45 45 88
600-series total 112 250 88 88 79Sumpter Unit total 1,713 8,332 88 773 861 50
STARKEY 52 Starkey 152A 1,450 6,571 435 435 30Starkey Experimental Forest 152B 26 116 17 17 65Union County Muzzleloader 153M 77 417 30 11 41 53
Ladd Marsh Youth Hunt 652T2 5 22 2 2 40Union County Agricultural 653A 79 209 46 46 58
600 & 100M-series total 161 648 76 13 89 55Starkey Unit total 1,637 7,335 76 465 541 33
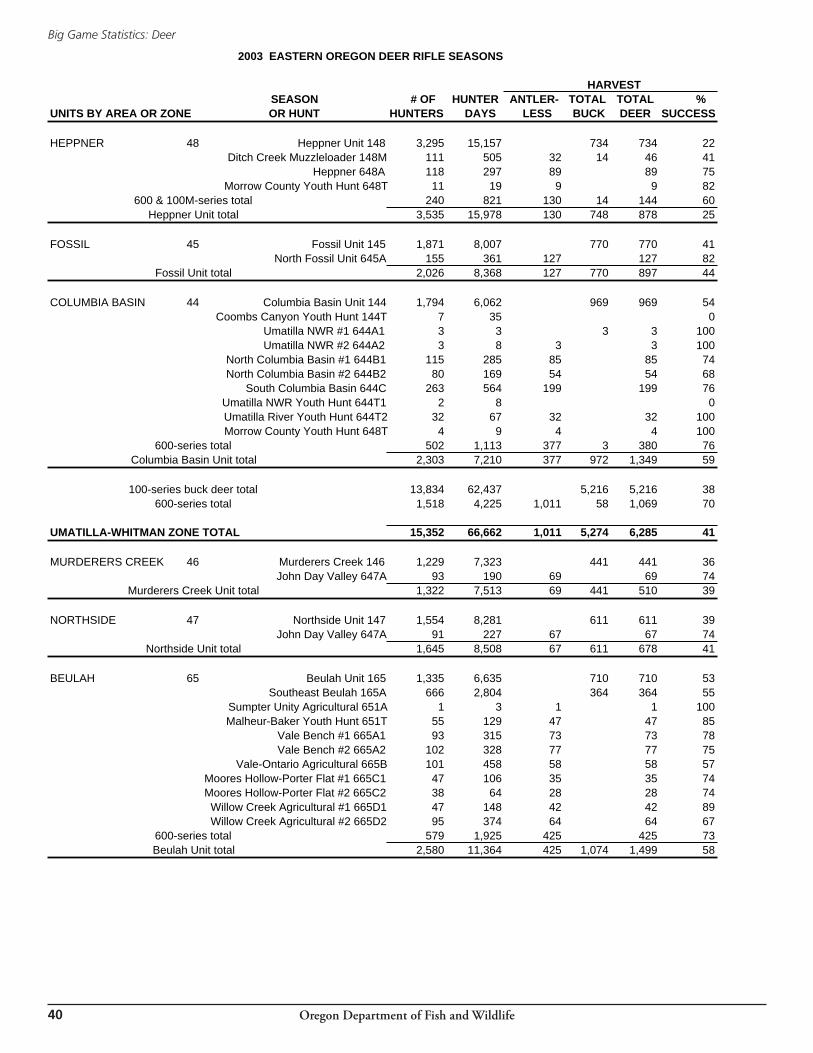
Oregon Department of Fish and Wildlife
Big Game Statistics: Deer
�0
2003 EASTERN OREGON DEER RIFLE SEASONS
HARVESTSEASON # OF HUNTER ANTLER- TOTAL TOTAL %
UNITS BY AREA OR ZONE OR HUNT HUNTERS DAYS LESS BUCK DEER SUCCESS
HEPPNER 48 Heppner Unit 148 3,295 15,157 734 734 22Ditch Creek Muzzleloader 148M 111 505 32 14 46 41
Heppner 648A 118 297 89 89 75Morrow County Youth Hunt 648T 11 19 9 9 82
600 & 100M-series total 240 821 130 14 144 60Heppner Unit total 3,535 15,978 130 748 878 25
FOSSIL 45 Fossil Unit 145 1,871 8,007 770 770 41North Fossil Unit 645A 155 361 127 127 82
Fossil Unit total 2,026 8,368 127 770 897 44
COLUMBIA BASIN 44 Columbia Basin Unit 144 1,794 6,062 969 969 54Coombs Canyon Youth Hunt 144T 7 35 0
Umatilla NWR #1 644A1 3 3 3 3 100Umatilla NWR #2 644A2 3 8 3 3 100
North Columbia Basin #1 644B1 115 285 85 85 74North Columbia Basin #2 644B2 80 169 54 54 68
South Columbia Basin 644C 263 564 199 199 76Umatilla NWR Youth Hunt 644T1 2 8 0Umatilla River Youth Hunt 644T2 32 67 32 32 100Morrow County Youth Hunt 648T 4 9 4 4 100
600-series total 502 1,113 377 3 380 76Columbia Basin Unit total 2,303 7,210 377 972 1,349 59
100-series buck deer total 13,834 62,437 5,216 5,216 38600-series total 1,518 4,225 1,011 58 1,069 70
UMATILLA-WHITMAN ZONE TOTAL 15,352 66,662 1,011 5,274 6,285 41
MURDERERS CREEK 46 Murderers Creek 146 1,229 7,323 441 441 36John Day Valley 647A 93 190 69 69 74
Murderers Creek Unit total 1,322 7,513 69 441 510 39
NORTHSIDE 47 Northside Unit 147 1,554 8,281 611 611 39John Day Valley 647A 91 227 67 67 74
Northside Unit total 1,645 8,508 67 611 678 41
BEULAH 65 Beulah Unit 165 1,335 6,635 710 710 53Southeast Beulah 165A 666 2,804 364 364 55
Sumpter Unity Agricultural 651A 1 3 1 1 100Malheur-Baker Youth Hunt 651T 55 129 47 47 85
Vale Bench #1 665A1 93 315 73 73 78Vale Bench #2 665A2 102 328 77 77 75
Vale-Ontario Agricultural 665B 101 458 58 58 57Moores Hollow-Porter Flat #1 665C1 47 106 35 35 74Moores Hollow-Porter Flat #2 665C2 38 64 28 28 74Willow Creek Agricultural #1 665D1 47 148 42 42 89Willow Creek Agricultural #2 665D2 95 374 64 64 67
600-series total 579 1,925 425 425 73Beulah Unit total 2,580 11,364 425 1,074 1,499 58
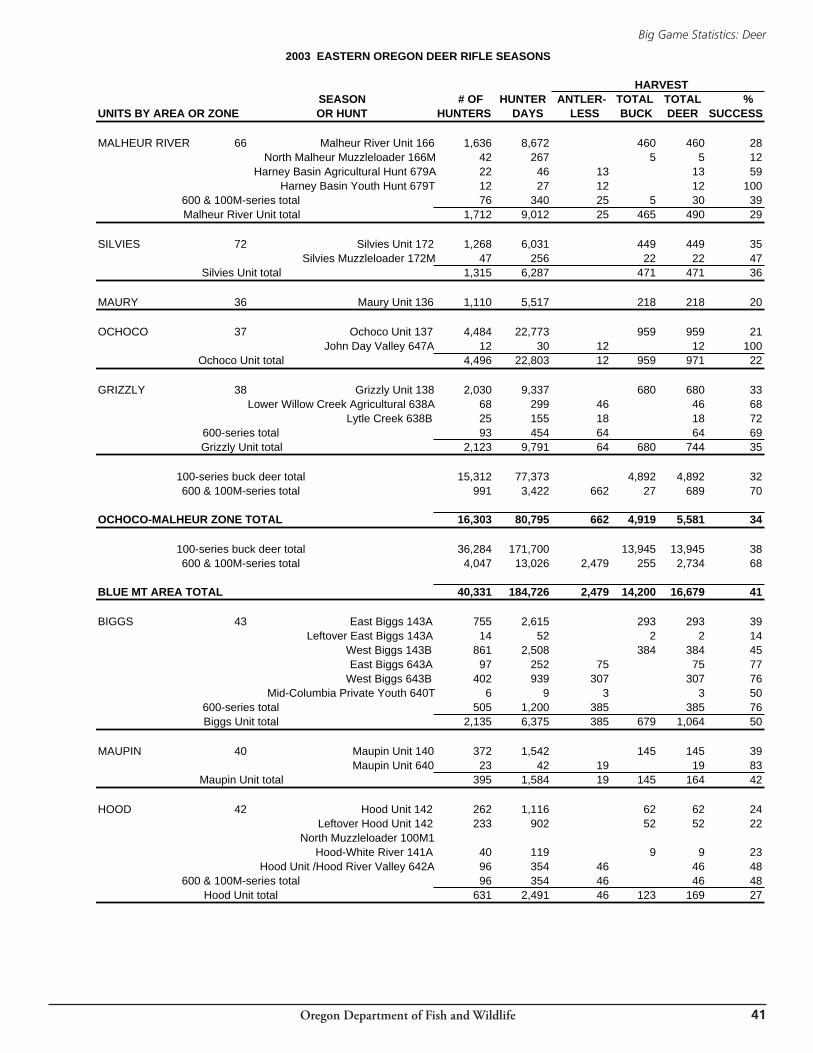
Oregon Department of Fish and Wildlife
Big Game Statistics: Deer
�1
2003 EASTERN OREGON DEER RIFLE SEASONS
HARVESTSEASON # OF HUNTER ANTLER- TOTAL TOTAL %
UNITS BY AREA OR ZONE OR HUNT HUNTERS DAYS LESS BUCK DEER SUCCESS
MALHEUR RIVER 66 Malheur River Unit 166 1,636 8,672 460 460 28North Malheur Muzzleloader 166M 42 267 5 5 12
Harney Basin Agricultural Hunt 679A 22 46 13 13 59Harney Basin Youth Hunt 679T 12 27 12 12 100
600 & 100M-series total 76 340 25 5 30 39Malheur River Unit total 1,712 9,012 25 465 490 29
SILVIES 72 Silvies Unit 172 1,268 6,031 449 449 35Silvies Muzzleloader 172M 47 256 22 22 47
Silvies Unit total 1,315 6,287 471 471 36
MAURY 36 Maury Unit 136 1,110 5,517 218 218 20
OCHOCO 37 Ochoco Unit 137 4,484 22,773 959 959 21John Day Valley 647A 12 30 12 12 100
Ochoco Unit total 4,496 22,803 12 959 971 22
GRIZZLY 38 Grizzly Unit 138 2,030 9,337 680 680 33Lower Willow Creek Agricultural 638A 68 299 46 46 68
Lytle Creek 638B 25 155 18 18 72600-series total 93 454 64 64 69Grizzly Unit total 2,123 9,791 64 680 744 35
100-series buck deer total 15,312 77,373 4,892 4,892 32600 & 100M-series total 991 3,422 662 27 689 70
OCHOCO-MALHEUR ZONE TOTAL 16,303 80,795 662 4,919 5,581 34
100-series buck deer total 36,284 171,700 13,945 13,945 38600 & 100M-series total 4,047 13,026 2,479 255 2,734 68
BLUE MT AREA TOTAL 40,331 184,726 2,479 14,200 16,679 41
BIGGS 43 East Biggs 143A 755 2,615 293 293 39Leftover East Biggs 143A 14 52 2 2 14
West Biggs 143B 861 2,508 384 384 45East Biggs 643A 97 252 75 75 77
West Biggs 643B 402 939 307 307 76Mid-Columbia Private Youth 640T 6 9 3 3 50
600-series total 505 1,200 385 385 76Biggs Unit total 2,135 6,375 385 679 1,064 50
MAUPIN 40 Maupin Unit 140 372 1,542 145 145 39Maupin Unit 640 23 42 19 19 83
Maupin Unit total 395 1,584 19 145 164 42
HOOD 42 Hood Unit 142 262 1,116 62 62 24Leftover Hood Unit 142 233 902 52 52 22
North Muzzleloader 100M1Hood-White River 141A 40 119 9 9 23
Hood Unit /Hood River Valley 642A 96 354 46 46 48600 & 100M-series total 96 354 46 46 48
Hood Unit total 631 2,491 46 123 169 27
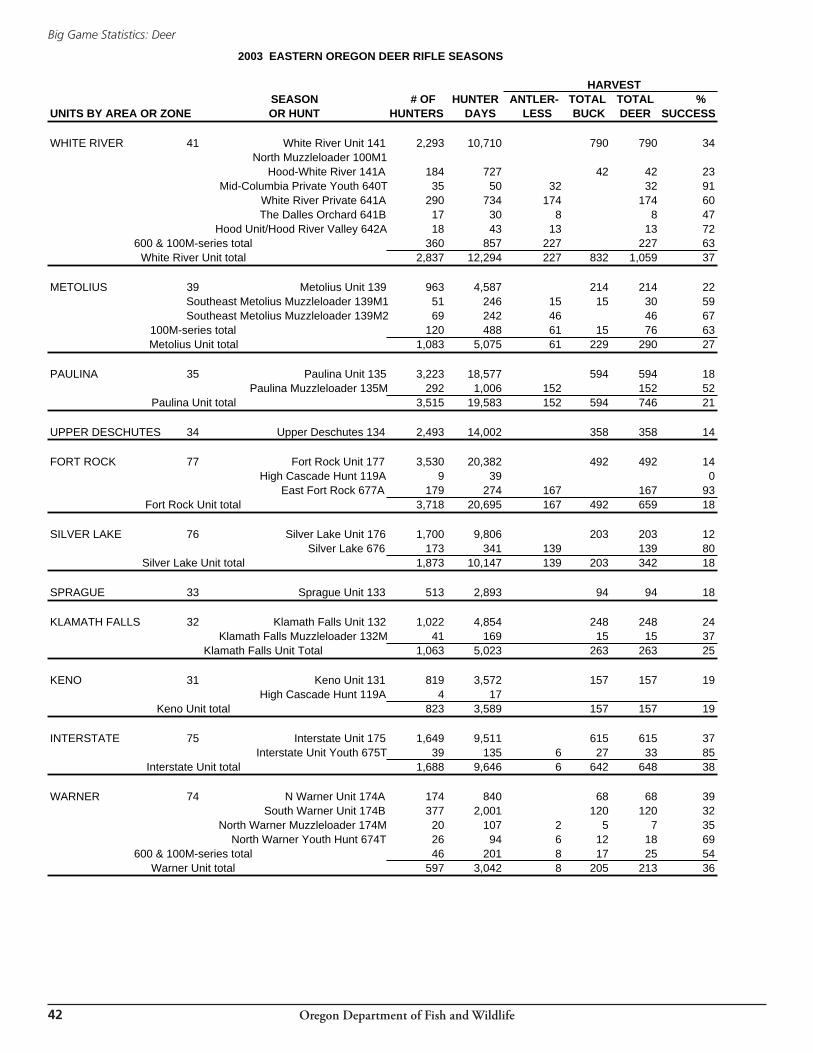
Oregon Department of Fish and Wildlife
Big Game Statistics: Deer
��
2003 EASTERN OREGON DEER RIFLE SEASONS
HARVESTSEASON # OF HUNTER ANTLER- TOTAL TOTAL %
UNITS BY AREA OR ZONE OR HUNT HUNTERS DAYS LESS BUCK DEER SUCCESS
WHITE RIVER 41 White River Unit 141 2,293 10,710 790 790 34North Muzzleloader 100M1
Hood-White River 141A 184 727 42 42 23Mid-Columbia Private Youth 640T 35 50 32 32 91
White River Private 641A 290 734 174 174 60The Dalles Orchard 641B 17 30 8 8 47
Hood Unit/Hood River Valley 642A 18 43 13 13 72600 & 100M-series total 360 857 227 227 63
White River Unit total 2,837 12,294 227 832 1,059 37
METOLIUS 39 Metolius Unit 139 963 4,587 214 214 22Southeast Metolius Muzzleloader 139M1 51 246 15 15 30 59Southeast Metolius Muzzleloader 139M2 69 242 46 46 67
100M-series total 120 488 61 15 76 63Metolius Unit total 1,083 5,075 61 229 290 27
PAULINA 35 Paulina Unit 135 3,223 18,577 594 594 18Paulina Muzzleloader 135M 292 1,006 152 152 52
Paulina Unit total 3,515 19,583 152 594 746 21
UPPER DESCHUTES 34 Upper Deschutes 134 2,493 14,002 358 358 14
FORT ROCK 77 Fort Rock Unit 177 3,530 20,382 492 492 14High Cascade Hunt 119A 9 39 0
East Fort Rock 677A 179 274 167 167 93Fort Rock Unit total 3,718 20,695 167 492 659 18
SILVER LAKE 76 Silver Lake Unit 176 1,700 9,806 203 203 12Silver Lake 676 173 341 139 139 80
Silver Lake Unit total 1,873 10,147 139 203 342 18
SPRAGUE 33 Sprague Unit 133 513 2,893 94 94 18
KLAMATH FALLS 32 Klamath Falls Unit 132 1,022 4,854 248 248 24Klamath Falls Muzzleloader 132M 41 169 15 15 37
Klamath Falls Unit Total 1,063 5,023 263 263 25
KENO 31 Keno Unit 131 819 3,572 157 157 19High Cascade Hunt 119A 4 17
Keno Unit total 823 3,589 157 157 19
INTERSTATE 75 Interstate Unit 175 1,649 9,511 615 615 37Interstate Unit Youth 675T 39 135 6 27 33 85
Interstate Unit total 1,688 9,646 6 642 648 38
WARNER 74 N Warner Unit 174A 174 840 68 68 39South Warner Unit 174B 377 2,001 120 120 32
North Warner Muzzleloader 174M 20 107 2 5 7 35North Warner Youth Hunt 674T 26 94 6 12 18 69
600 & 100M-series total 46 201 8 17 25 54Warner Unit total 597 3,042 8 205 213 36
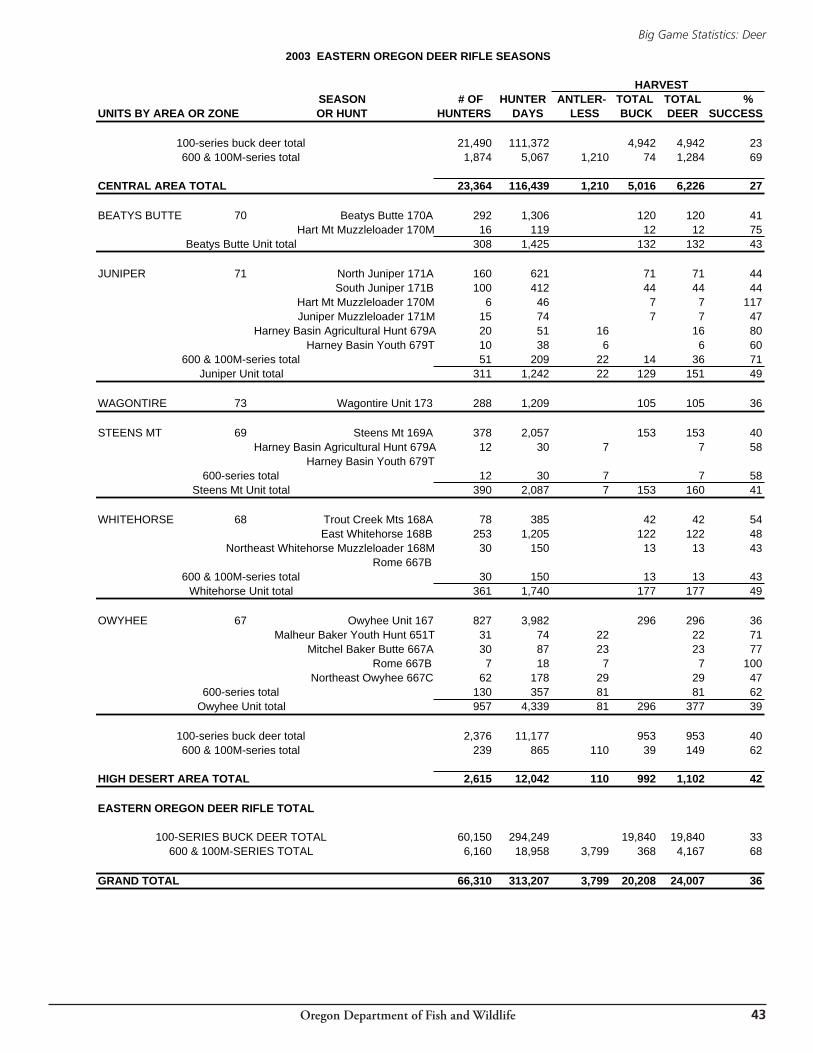
Oregon Department of Fish and Wildlife
Big Game Statistics: Deer
��
2003 EASTERN OREGON DEER RIFLE SEASONS
HARVESTSEASON # OF HUNTER ANTLER- TOTAL TOTAL %
UNITS BY AREA OR ZONE OR HUNT HUNTERS DAYS LESS BUCK DEER SUCCESS
100-series buck deer total 21,490 111,372 4,942 4,942 23600 & 100M-series total 1,874 5,067 1,210 74 1,284 69
CENTRAL AREA TOTAL 23,364 116,439 1,210 5,016 6,226 27
BEATYS BUTTE 70 Beatys Butte 170A 292 1,306 120 120 41Hart Mt Muzzleloader 170M 16 119 12 12 75
Beatys Butte Unit total 308 1,425 132 132 43
JUNIPER 71 North Juniper 171A 160 621 71 71 44South Juniper 171B 100 412 44 44 44
Hart Mt Muzzleloader 170M 6 46 7 7 117Juniper Muzzleloader 171M 15 74 7 7 47
Harney Basin Agricultural Hunt 679A 20 51 16 16 80Harney Basin Youth 679T 10 38 6 6 60
600 & 100M-series total 51 209 22 14 36 71Juniper Unit total 311 1,242 22 129 151 49
WAGONTIRE 73 Wagontire Unit 173 288 1,209 105 105 36
STEENS MT 69 Steens Mt 169A 378 2,057 153 153 40Harney Basin Agricultural Hunt 679A 12 30 7 7 58
Harney Basin Youth 679T600-series total 12 30 7 7 58
Steens Mt Unit total 390 2,087 7 153 160 41
WHITEHORSE 68 Trout Creek Mts 168A 78 385 42 42 54East Whitehorse 168B 253 1,205 122 122 48
Northeast Whitehorse Muzzleloader 168M 30 150 13 13 43Rome 667B
600 & 100M-series total 30 150 13 13 43Whitehorse Unit total 361 1,740 177 177 49
OWYHEE 67 Owyhee Unit 167 827 3,982 296 296 36Malheur Baker Youth Hunt 651T 31 74 22 22 71
Mitchel Baker Butte 667A 30 87 23 23 77Rome 667B 7 18 7 7 100
Northeast Owyhee 667C 62 178 29 29 47600-series total 130 357 81 81 62
Owyhee Unit total 957 4,339 81 296 377 39
100-series buck deer total 2,376 11,177 953 953 40600 & 100M-series total 239 865 110 39 149 62
HIGH DESERT AREA TOTAL 2,615 12,042 110 992 1,102 42
EASTERN OREGON DEER RIFLE TOTAL
100-SERIES BUCK DEER TOTAL 60,150 294,249 19,840 19,840 33600 & 100M-SERIES TOTAL 6,160 18,958 3,799 368 4,167 68
GRAND TOTAL 66,310 313,207 3,799 20,208 24,007 36
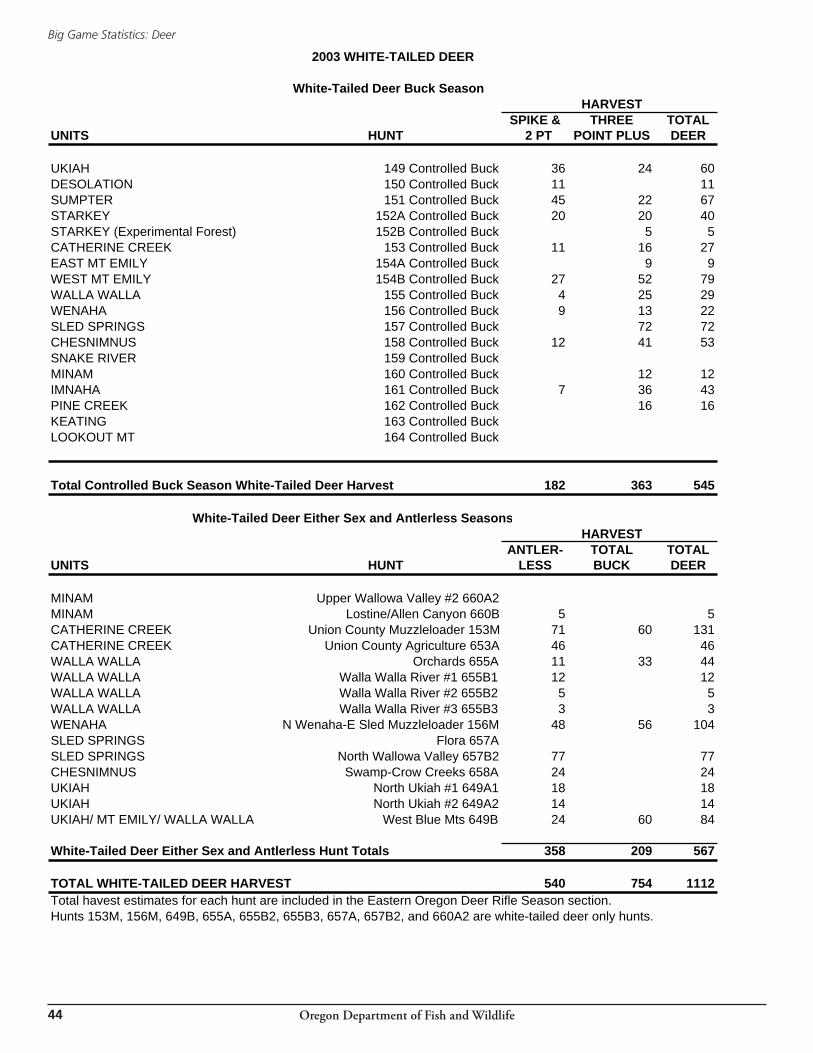
Oregon Department of Fish and Wildlife
Big Game Statistics: Deer
��
2003 WHITE-TAILED DEER
White-Tailed Deer Buck SeasonHARVEST
SPIKE & THREE TOTALUNITS HUNT 2 PT POINT PLUS DEER
UKIAH 149 Controlled Buck 36 24 60DESOLATION 150 Controlled Buck 11 11SUMPTER 151 Controlled Buck 45 22 67STARKEY 152A Controlled Buck 20 20 40STARKEY (Experimental Forest) 152B Controlled Buck 5 5CATHERINE CREEK 153 Controlled Buck 11 16 27EAST MT EMILY 154A Controlled Buck 9 9WEST MT EMILY 154B Controlled Buck 27 52 79WALLA WALLA 155 Controlled Buck 4 25 29WENAHA 156 Controlled Buck 9 13 22SLED SPRINGS 157 Controlled Buck 72 72CHESNIMNUS 158 Controlled Buck 12 41 53SNAKE RIVER 159 Controlled BuckMINAM 160 Controlled Buck 12 12IMNAHA 161 Controlled Buck 7 36 43PINE CREEK 162 Controlled Buck 16 16KEATING 163 Controlled BuckLOOKOUT MT 164 Controlled Buck
Total Controlled Buck Season White-Tailed Deer Harvest 182 363 545
White-Tailed Deer Either Sex and Antlerless SeasonsHARVEST
ANTLER- TOTAL TOTALUNITS HUNT LESS BUCK DEER
MINAM Upper Wallowa Valley #2 660A2MINAM Lostine/Allen Canyon 660B 5 5CATHERINE CREEK Union County Muzzleloader 153M 71 60 131CATHERINE CREEK Union County Agriculture 653A 46 46WALLA WALLA Orchards 655A 11 33 44WALLA WALLA Walla Walla River #1 655B1 12 12WALLA WALLA Walla Walla River #2 655B2 5 5WALLA WALLA Walla Walla River #3 655B3 3 3WENAHA N Wenaha-E Sled Muzzleloader 156M 48 56 104SLED SPRINGS Flora 657ASLED SPRINGS North Wallowa Valley 657B2 77 77CHESNIMNUS Swamp-Crow Creeks 658A 24 24UKIAH North Ukiah #1 649A1 18 18UKIAH North Ukiah #2 649A2 14 14UKIAH/ MT EMILY/ WALLA WALLA West Blue Mts 649B 24 60 84
White-Tailed Deer Either Sex and Antlerless Hunt Totals 358 209 567
TOTAL WHITE-TAILED DEER HARVEST 540 754 1112Total havest estimates for each hunt are included in the Eastern Oregon Deer Rifle Season section.Hunts 153M, 156M, 649B, 655A, 655B2, 655B3, 657A, 657B2, and 660A2 are white-tailed deer only hunts.
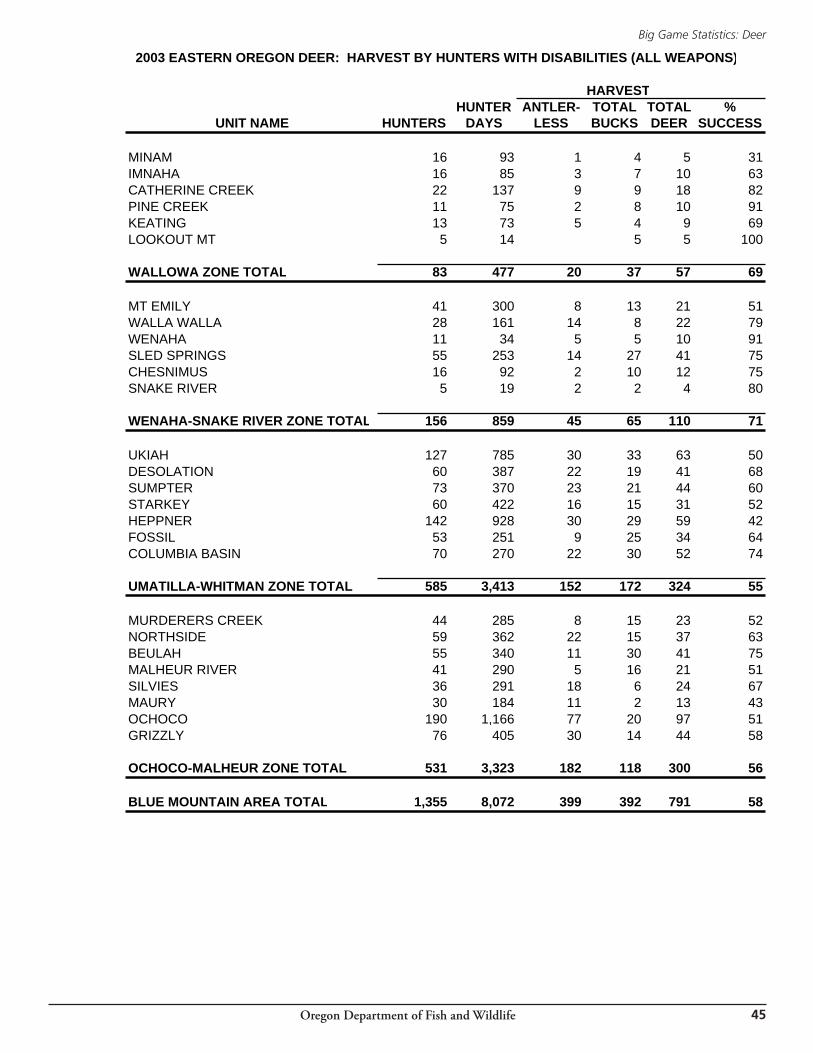
Oregon Department of Fish and Wildlife
Big Game Statistics: Deer
��
2003 EASTERN OREGON DEER: HARVEST BY HUNTERS WITH DISABILITIES (ALL WEAPONS)
HARVESTHUNTER ANTLER- TOTAL TOTAL %
UNIT NAME HUNTERS DAYS LESS BUCKS DEER SUCCESS
MINAM 16 93 1 4 5 31IMNAHA 16 85 3 7 10 63CATHERINE CREEK 22 137 9 9 18 82PINE CREEK 11 75 2 8 10 91KEATING 13 73 5 4 9 69LOOKOUT MT 5 14 5 5 100
WALLOWA ZONE TOTAL 83 477 20 37 57 69
MT EMILY 41 300 8 13 21 51WALLA WALLA 28 161 14 8 22 79WENAHA 11 34 5 5 10 91SLED SPRINGS 55 253 14 27 41 75CHESNIMUS 16 92 2 10 12 75SNAKE RIVER 5 19 2 2 4 80
WENAHA-SNAKE RIVER ZONE TOTAL 156 859 45 65 110 71
UKIAH 127 785 30 33 63 50DESOLATION 60 387 22 19 41 68SUMPTER 73 370 23 21 44 60STARKEY 60 422 16 15 31 52HEPPNER 142 928 30 29 59 42FOSSIL 53 251 9 25 34 64COLUMBIA BASIN 70 270 22 30 52 74
UMATILLA-WHITMAN ZONE TOTAL 585 3,413 152 172 324 55
MURDERERS CREEK 44 285 8 15 23 52NORTHSIDE 59 362 22 15 37 63BEULAH 55 340 11 30 41 75MALHEUR RIVER 41 290 5 16 21 51SILVIES 36 291 18 6 24 67MAURY 30 184 11 2 13 43OCHOCO 190 1,166 77 20 97 51GRIZZLY 76 405 30 14 44 58
OCHOCO-MALHEUR ZONE TOTAL 531 3,323 182 118 300 56
BLUE MOUNTAIN AREA TOTAL 1,355 8,072 399 392 791 58
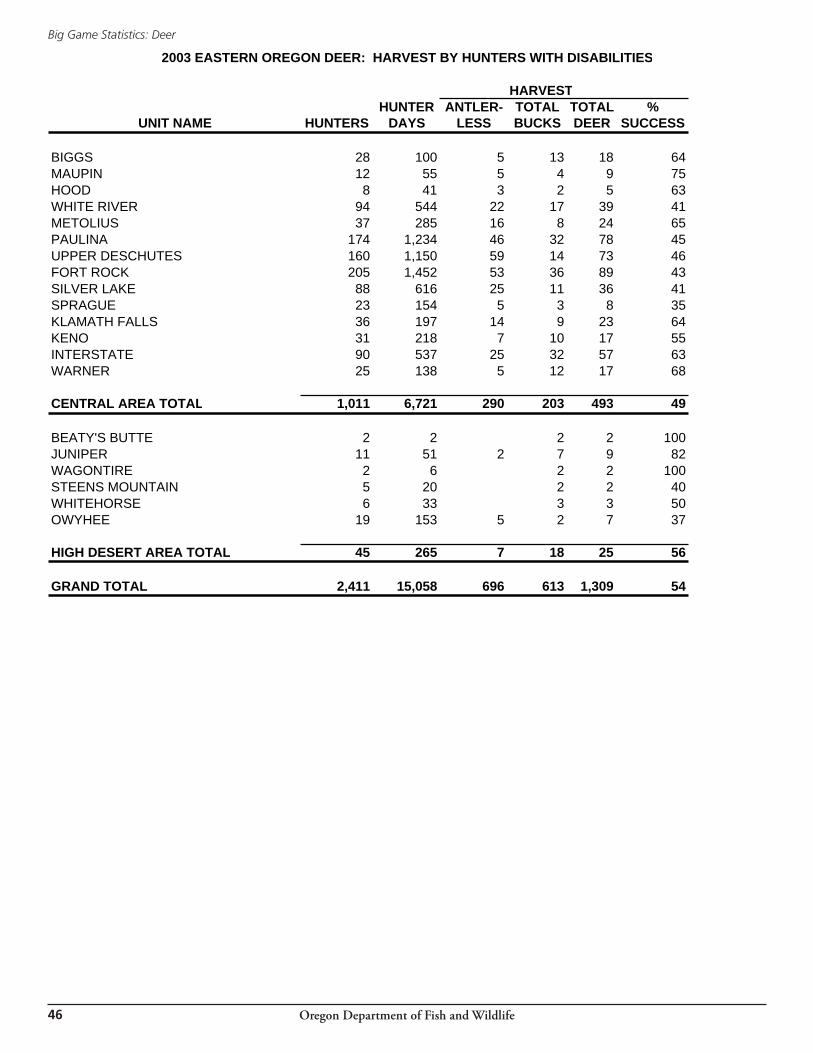
Oregon Department of Fish and Wildlife
Big Game Statistics: Deer
��
2003 EASTERN OREGON DEER: HARVEST BY HUNTERS WITH DISABILITIES
HARVESTHUNTER ANTLER- TOTAL TOTAL %
UNIT NAME HUNTERS DAYS LESS BUCKS DEER SUCCESS
BIGGS 28 100 5 13 18 64MAUPIN 12 55 5 4 9 75HOOD 8 41 3 2 5 63WHITE RIVER 94 544 22 17 39 41METOLIUS 37 285 16 8 24 65PAULINA 174 1,234 46 32 78 45UPPER DESCHUTES 160 1,150 59 14 73 46FORT ROCK 205 1,452 53 36 89 43SILVER LAKE 88 616 25 11 36 41SPRAGUE 23 154 5 3 8 35KLAMATH FALLS 36 197 14 9 23 64KENO 31 218 7 10 17 55INTERSTATE 90 537 25 32 57 63WARNER 25 138 5 12 17 68
CENTRAL AREA TOTAL 1,011 6,721 290 203 493 49
BEATY'S BUTTE 2 2 2 2 100JUNIPER 11 51 2 7 9 82WAGONTIRE 2 6 2 2 100STEENS MOUNTAIN 5 20 2 2 40WHITEHORSE 6 33 3 3 50OWYHEE 19 153 5 2 7 37
HIGH DESERT AREA TOTAL 45 265 7 18 25 56
GRAND TOTAL 2,411 15,058 696 613 1,309 54
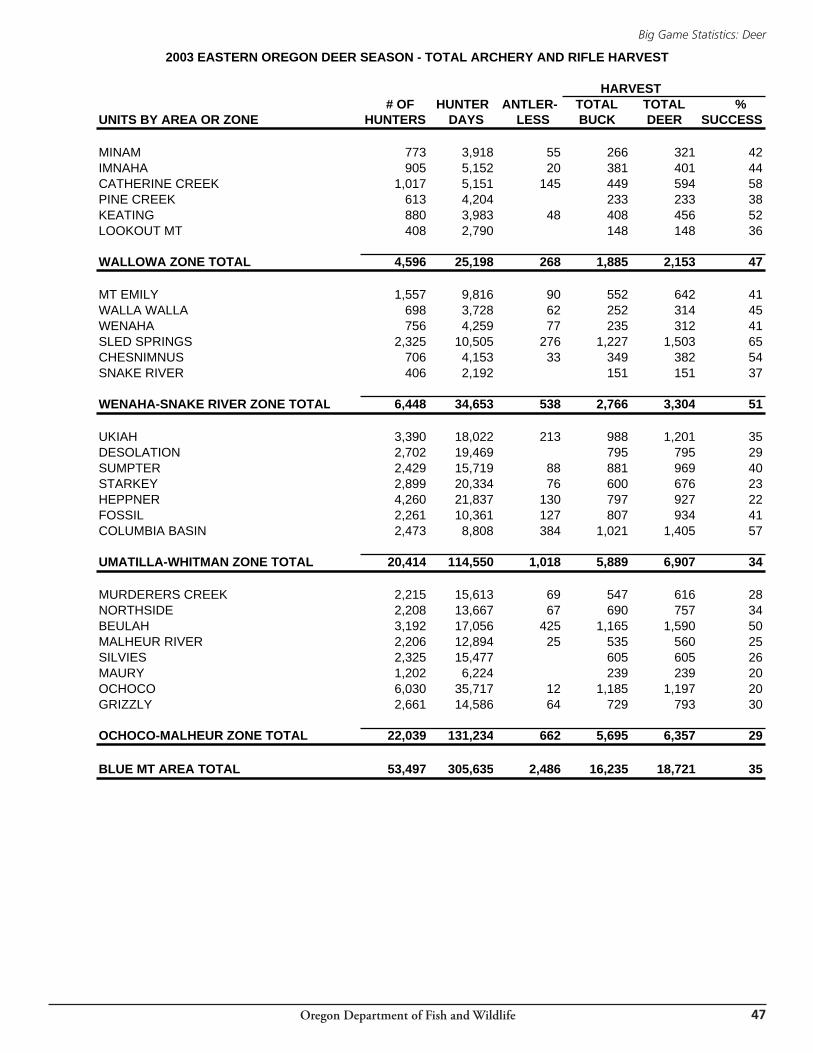
Oregon Department of Fish and Wildlife
Big Game Statistics: Deer
��
2003 EASTERN OREGON DEER SEASON - TOTAL ARCHERY AND RIFLE HARVEST
HARVEST # OF HUNTER ANTLER- TOTAL TOTAL %
UNITS BY AREA OR ZONE HUNTERS DAYS LESS BUCK DEER SUCCESS
MINAM 773 3,918 55 266 321 42IMNAHA 905 5,152 20 381 401 44CATHERINE CREEK 1,017 5,151 145 449 594 58PINE CREEK 613 4,204 233 233 38KEATING 880 3,983 48 408 456 52LOOKOUT MT 408 2,790 148 148 36
WALLOWA ZONE TOTAL 4,596 25,198 268 1,885 2,153 47
MT EMILY 1,557 9,816 90 552 642 41WALLA WALLA 698 3,728 62 252 314 45WENAHA 756 4,259 77 235 312 41SLED SPRINGS 2,325 10,505 276 1,227 1,503 65CHESNIMNUS 706 4,153 33 349 382 54SNAKE RIVER 406 2,192 151 151 37
WENAHA-SNAKE RIVER ZONE TOTAL 6,448 34,653 538 2,766 3,304 51
UKIAH 3,390 18,022 213 988 1,201 35DESOLATION 2,702 19,469 795 795 29SUMPTER 2,429 15,719 88 881 969 40STARKEY 2,899 20,334 76 600 676 23HEPPNER 4,260 21,837 130 797 927 22FOSSIL 2,261 10,361 127 807 934 41COLUMBIA BASIN 2,473 8,808 384 1,021 1,405 57
UMATILLA-WHITMAN ZONE TOTAL 20,414 114,550 1,018 5,889 6,907 34
MURDERERS CREEK 2,215 15,613 69 547 616 28NORTHSIDE 2,208 13,667 67 690 757 34BEULAH 3,192 17,056 425 1,165 1,590 50MALHEUR RIVER 2,206 12,894 25 535 560 25SILVIES 2,325 15,477 605 605 26MAURY 1,202 6,224 239 239 20OCHOCO 6,030 35,717 12 1,185 1,197 20GRIZZLY 2,661 14,586 64 729 793 30
OCHOCO-MALHEUR ZONE TOTAL 22,039 131,234 662 5,695 6,357 29
BLUE MT AREA TOTAL 53,497 305,635 2,486 16,235 18,721 35
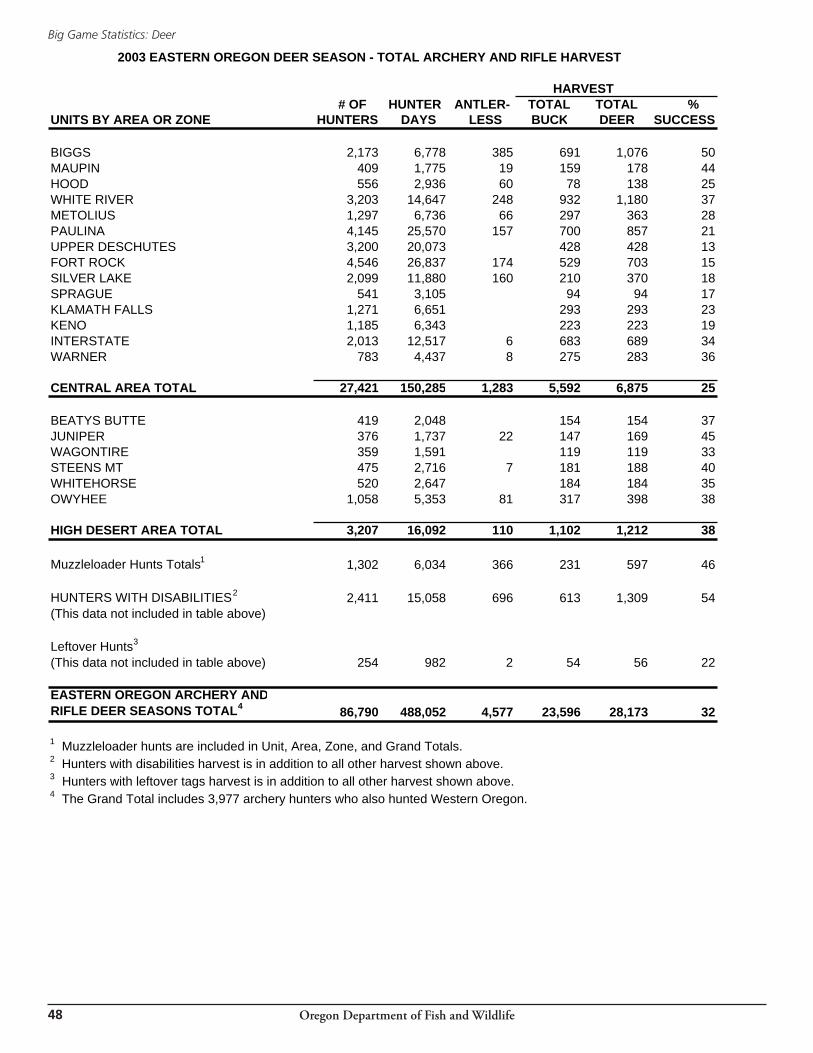
Oregon Department of Fish and Wildlife
Big Game Statistics: Deer
��
2003 EASTERN OREGON DEER SEASON - TOTAL ARCHERY AND RIFLE HARVEST
HARVEST # OF HUNTER ANTLER- TOTAL TOTAL %
UNITS BY AREA OR ZONE HUNTERS DAYS LESS BUCK DEER SUCCESS
BIGGS 2,173 6,778 385 691 1,076 50MAUPIN 409 1,775 19 159 178 44HOOD 556 2,936 60 78 138 25WHITE RIVER 3,203 14,647 248 932 1,180 37METOLIUS 1,297 6,736 66 297 363 28PAULINA 4,145 25,570 157 700 857 21UPPER DESCHUTES 3,200 20,073 428 428 13FORT ROCK 4,546 26,837 174 529 703 15SILVER LAKE 2,099 11,880 160 210 370 18SPRAGUE 541 3,105 94 94 17KLAMATH FALLS 1,271 6,651 293 293 23KENO 1,185 6,343 223 223 19INTERSTATE 2,013 12,517 6 683 689 34WARNER 783 4,437 8 275 283 36
CENTRAL AREA TOTAL 27,421 150,285 1,283 5,592 6,875 25
BEATYS BUTTE 419 2,048 154 154 37JUNIPER 376 1,737 22 147 169 45WAGONTIRE 359 1,591 119 119 33STEENS MT 475 2,716 7 181 188 40WHITEHORSE 520 2,647 184 184 35OWYHEE 1,058 5,353 81 317 398 38
HIGH DESERT AREA TOTAL 3,207 16,092 110 1,102 1,212 38
Muzzleloader Hunts Totals1 1,302 6,034 366 231 597 46
HUNTERS WITH DISABILITIES2 2,411 15,058 696 613 1,309 54(This data not included in table above)
Leftover Hunts3
(This data not included in table above) 254 982 2 54 56 22
EASTERN OREGON ARCHERY ANDRIFLE DEER SEASONS TOTAL4 86,790 488,052 4,577 23,596 28,173 32
1 Muzzleloader hunts are included in Unit, Area, Zone, and Grand Totals.2 Hunters with disabilities harvest is in addition to all other harvest shown above.3 Hunters with leftover tags harvest is in addition to all other harvest shown above.4 The Grand Total includes 3,977 archery hunters who also hunted Western Oregon.
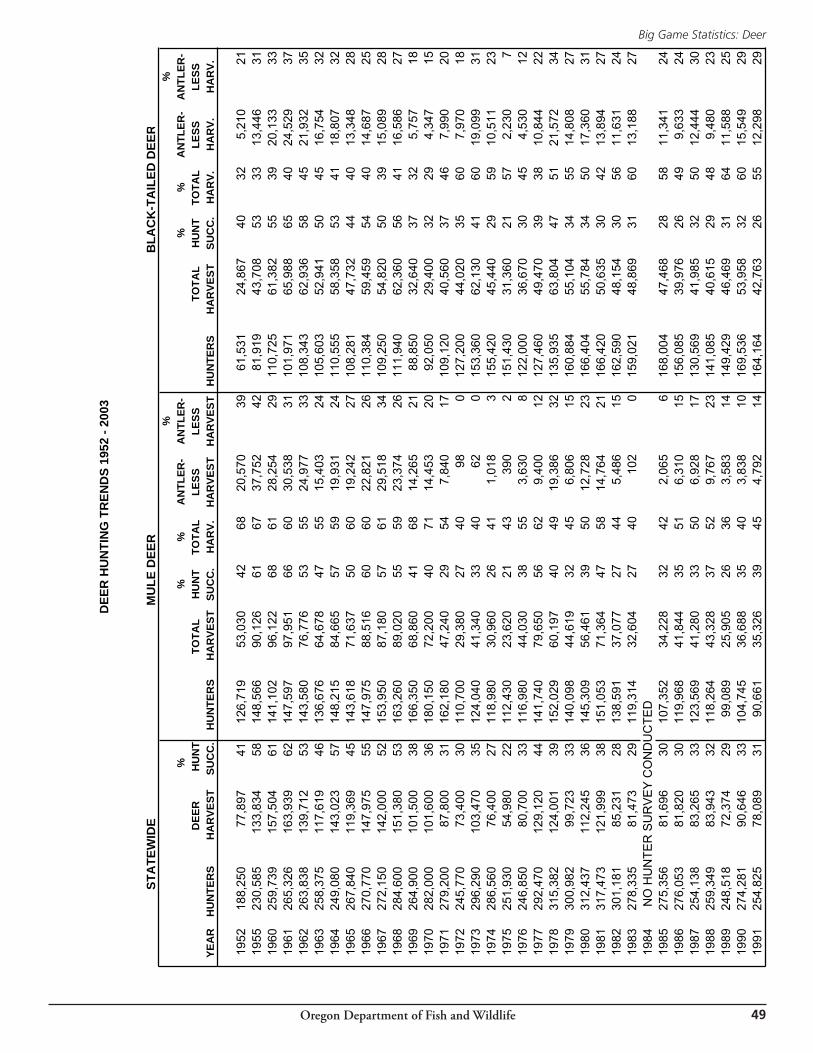
Oregon Department of Fish and Wildlife
Big Game Statistics: Deer
��
S
TATE
WID
EM
ULE
DEE
RB
LAC
K-T
AIL
ED D
EER
%%
%%
%A
NTL
ER-
AN
TLER
-%
%A
NTL
ER-
AN
TLER
-D
EER
HU
NT
TOTA
L
HU
NT
TOTA
LLE
SSLE
SSTO
TAL
H
UN
TTO
TAL
LESS
LESS
YEA
RH
UN
TER
SH
AR
VEST
SUC
C.
HU
NTE
RS
HA
RVE
STSU
CC
.H
AR
V.H
AR
VEST
HA
RVE
STH
UN
TER
SH
AR
VEST
SUC
C.
HA
RV.
HA
RV.
HA
RV.
1952
188,
250
77,8
9741
126,
719
53,0
3042
6820
,570
3961
,531
24,8
6740
325,
210
2119
5523
0,58
513
3,83
458
148,
566
90,1
2661
6737
,752
4281
,919
43,7
0853
3313
,446
3119
6025
9,73
915
7,50
461
141,
102
96,1
2268
6128
,254
2911
0,72
561
,382
5539
20,1
3333
1961
265,
326
163,
939
6214
7,59
797
,951
6660
30,5
3831
101,
971
65,9
8865
4024
,529
3719
6226
3,83
813
9,71
253
143,
580
76,7
7653
5524
,977
3310
8,34
362
,936
5845
21,9
3235
1963
258,
375
117,
619
4613
6,67
664
,678
4755
15,4
0324
105,
603
52,9
4150
4516
,754
3219
6424
9,08
014
3,02
357
148,
215
84,6
6557
5919
,931
2411
0,55
558
,358
5341
18,8
0732
1965
267,
840
119,
369
4514
3,61
871
,637
5060
19,2
4227
108,
281
47,7
3244
4013
,348
2819
6627
0,77
014
7,97
555
147,
975
88,5
1660
6022
,821
2611
0,38
459
,459
5440
14,6
8725
1967
272,
150
142,
000
5215
3,95
087
,180
5761
29,5
1834
109,
250
54,8
2050
3915
,089
2819
6828
4,60
015
1,38
053
163,
260
89,0
2055
5923
,374
2611
1,94
062
,360
5641
16,5
8627
1969
264,
900
101,
500
3816
6,35
068
,860
4168
14,2
6521
88,8
5032
,640
3732
5,75
718
1970
282,
000
101,
600
3618
0,15
072
,200
4071
14,4
5320
92,0
5029
,400
3229
4,34
715
1971
279,
200
87,8
0031
162,
180
47,2
4029
547,
840
1710
9,12
040
,560
3746
7,99
020
1972
245,
770
73,4
0030
110,
700
29,3
8027
4098
012
7,20
044
,020
3560
7,97
018
1973
296,
290
103,
470
3512
4,04
041
,340
3340
620
153,
360
62,1
3041
6019
,099
3119
7428
6,56
076
,400
2711
8,98
030
,960
2641
1,01
83
155,
420
45,4
4029
5910
,511
2319
7525
1,93
054
,980
2211
2,43
023
,620
2143
390
215
1,43
031
,360
2157
2,23
07
1976
246,
850
80,7
0033
116,
980
44,0
3038
553,
630
812
2,00
036
,670
3045
4,53
012
1977
292,
470
129,
120
4414
1,74
079
,650
5662
9,40
012
127,
460
49,4
7039
3810
,844
2219
7831
5,38
212
4,00
139
152,
029
60,1
9740
4919
,386
3213
5,93
563
,804
4751
21,5
7234
1979
300,
982
99,7
2333
140,
098
44,6
1932
456,
806
1516
0,88
455
,104
3455
14,8
0827
1980
312,
437
112,
245
3614
5,30
956
,461
3950
12,7
2823
166,
404
55,7
8434
5017
,360
3119
8131
7,47
312
1,99
938
151,
053
71,3
6447
5814
,764
2116
6,42
050
,635
3042
13,8
9427
1982
301,
181
85,2
3128
138,
591
37,0
7727
445,
486
1516
2,59
048
,154
3056
11,6
3124
1983
278,
335
81,4
7329
119,
314
32,6
0427
4010
20
159,
021
48,8
6931
6013
,188
2719
84
NO
HU
NTE
R S
UR
VE
Y C
ON
DU
CTE
D19
8527
5,35
681
,696
3010
7,35
234
,228
3242
2,06
56
168,
004
47,4
6828
5811
,341
2419
8627
6,05
381
,820
3011
9,96
841
,844
3551
6,31
015
156,
085
39,9
7626
499,
633
2419
8725
4,13
883
,265
3312
3,56
941
,280
3350
6,92
817
130,
569
41,9
8532
5012
,444
3019
8825
9,34
983
,943
3211
8,26
443
,328
3752
9,76
723
141,
085
40,6
1529
489,
480
2319
8924
8,51
872
,374
2999
,089
25,9
0526
363,
583
1414
9,42
946
,469
3164
11,5
8825
1990
274,
281
90,6
4633
104,
745
36,6
8835
403,
838
1016
9,53
653
,958
3260
15,5
4929
1991
254,
825
78,0
8931
90,6
6135
,326
3945
4,79
214
164,
164
42,7
6326
5512
,298
29
DEE
R H
UN
TIN
G T
REN
DS
1952
- 20
03
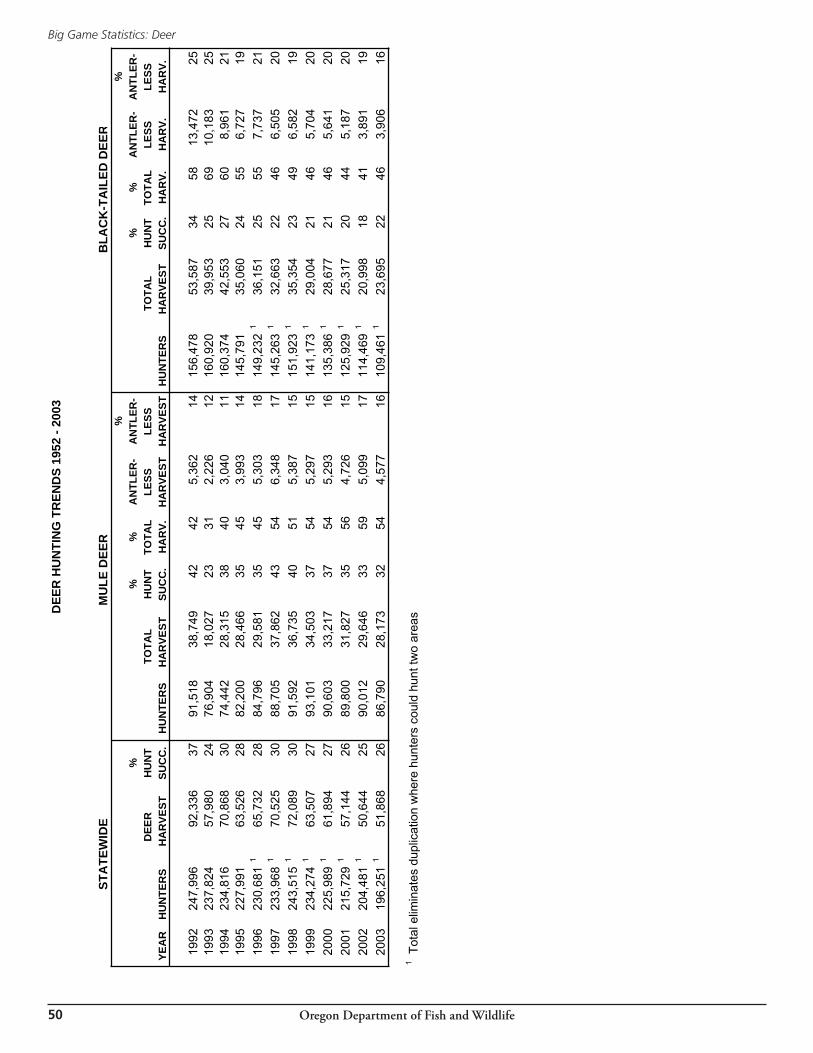
Oregon Department of Fish and Wildlife
Big Game Statistics: Deer
�0
S
TATE
WID
EM
ULE
DEE
RB
LAC
K-T
AIL
ED D
EER
%%
%%
%A
NTL
ER-
AN
TLER
-%
%A
NTL
ER-
AN
TLER
-D
EER
HU
NT
TOTA
L
HU
NT
TOTA
LLE
SSLE
SSTO
TAL
H
UN
TTO
TAL
LESS
LESS
YEA
RH
UN
TER
SH
AR
VEST
SUC
C.
HU
NTE
RS
HA
RVE
STSU
CC
.H
AR
V.H
AR
VEST
HA
RVE
STH
UN
TER
SH
AR
VEST
SUC
C.
HA
RV.
HA
RV.
HA
RV.
1992
247,
996
92,3
3637
91,5
1838
,749
4242
5,36
214
156,
478
53,5
8734
5813
,472
2519
9323
7,82
457
,980
2476
,904
18,0
2723
312,
226
1216
0,92
039
,953
2569
10,1
8325
1994
234,
816
70,8
6830
74,4
4228
,315
3840
3,04
011
160,
374
42,5
5327
608,
961
2119
9522
7,99
163
,526
2882
,200
28,4
6635
453,
993
1414
5,79
135
,060
2455
6,72
719
1996
230,
681
165
,732
2884
,796
29,5
8135
455,
303
1814
9,23
21
36,1
5125
557,
737
2119
9723
3,96
81
70,5
2530
88,7
0537
,862
4354
6,34
817
145,
263
132
,663
2246
6,50
520
1998
243,
515
172
,089
3091
,592
36,7
3540
515,
387
1515
1,92
31
35,3
5423
496,
582
1919
9923
4,27
41
63,5
0727
93,1
0134
,503
3754
5,29
715
141,
173
129
,004
2146
5,70
420
2000
225,
989
161
,894
2790
,603
33,2
1737
545,
293
1613
5,38
61
28,6
7721
465,
641
2020
0121
5,72
91
57,1
4426
89,8
0031
,827
3556
4,72
615
125,
929
125
,317
2044
5,18
720
2002
204,
481
150
,644
2590
,012
29,6
4633
595,
099
1711
4,46
91
20,9
9818
413,
891
1920
0319
6,25
11
51,8
6826
86,7
9028
,173
3254
4,57
716
109,
461
123
,695
2246
3,90
616
1 Tot
al e
limin
ates
dup
licat
ion
whe
re h
unte
rs c
ould
hun
t tw
o ar
easD
EER
HU
NTI
NG
TR
END
S 19
52 -
2003
Oregon Department of Fish and Wildlife
Big Game Statistics: Deer
�1