Embed Size (px)
Citation preview
What Does the Future of Checks Look Like?
WHITE PAPER

WHITE PAPER | What Does the Future of Checks Look Like?
© Deluxe Enterprise Operations, LLC. All rights reserved. 2
What Does the Future of Checks Look Like?Paper check volumes have been declining for the past two decades. The
number of paper checks written has fallen by more than half since 2001.
None of this is news, and no one is predicting a reversal of the trend.
However, that’s largely where the consensus ends. Opinions differ on both
the forward trajectory and the likely endgame.
Through this report, we hope to address frequently asked questions about
ongoing check usage through an objective, data-driven approach.
The 20 Billion Checks of 2015 – and the People that Still Write ThemThe authoritative source for US payments data is the Federal Reserve
Payments Study, which was initiated in 2000 and has since been conducted
every three years. The Federal Reserve’s quantitative research provides a
dispassionate, detailed snapshot of historical industry trends.
The Federal Reserve’s research disproves the notion that “the check is no
longer relevant in 2015.” Roughly 20 billion checks continue to be written
each year, conveying over $22 trillion in value – second only to the ACH
network among all payment instruments. By comparison, credit and debit
cards support $3 trillion and $2 trillion of value, respectively. Despite
ongoing declines, checks remain an integral component in the overall US
payments mix. 2013 Federal Reserve Payments Study, July 2014
DISTRIBUTION OF NONCASH PAYMENTS
38.3%
1%
21.4%
1%N/M
7.5%
82%
15.5%
17.3%
16%
NUMBER
VALUE
2006
17.0(51%)
2009
12.3(44%)
2012
9.0(43%)
Customer to Business
2006
8.3(25%)
2009
7.6(27%)
2012
6.7(32%)
Business to Business
2006
5.6(17%)
2009
5.1(19%)
2012
3.1(15%)
Business to Customer
2006
2.2 (7%)
2009
2.8 (10%)
2012
2.1 (10%)
Customer to Customer
Bill
ions
Bill
ions
Bill
ions
Bill
ions
Total Checks Total Checks
Total Checks Total Checks
0
5
10
15
20
25
2012
2013
2014
2015
2016
2017
2018
2019
2020
2021
2022
2023
2024
2025
2026
2027
2028
2029
2030
Chec
ks W
ri�en
(bill
ions
of i
tem
s)
Total Consumer Checks Total Business ChecksTotal Checks
Number ValueDebit 38.3% 1%Credit 21.4% 1%EBT/Prepaid 7.5% N/MACH 15.5% 82%Checks 17.3% 16%
Number ValueDebit 38.3% 1%Credit 21.4% 1%EBT/Prepaid 7.5% N/MACH 15.5% 82%Checks 17.3% 16%

© Deluxe Enterprise Operations, LLC. All rights reserved.
WHITE PAPER | What Does the Future of Checks Look Like?
3
Breaking Down Checks by Payment TypeAnother common view that bears closer scrutiny is that the decline of
checks is accelerating. Based on Federal Reserve data, check volumes have
been falling at a steady rate of 2 billion items per year for at least a decade.
If viewed in percentage terms, this can appear to be an accelerating pace
given the shrinking denominator.
McKinsey & Company projects that the rate of check decline will slow
slightly in the coming years. In order to appreciate the logic behind such a
stance, it’s important to disaggregate the drivers of US check usage, each
of which carries its own set of dynamics.
Consumer to Business Payments.
Payments from consumers to businesses (C2B) remain the most common
use case for checks, comprising over 40 percent of checks written. This is
also the segment that has experienced the most rapid rate of check decline.
Delving further into the numbers, one sees a dramatic reduction in check
use at the point of sale (POS) from 4.4 billion items in 2006 to 1.0 billion in
2012. This drop coincides with the widespread availability and adoption of
debit/credit cards at grocery stores, those businesses whose low margins
were once thought unable to absorb interchange fees. Excluding POS
payments, C2B declines averaged 7.3 percent from 2006-2012, well below
the 10.0 percent overall C2B rate.
CHECKS WRITTEN BY CONSUMER TO BUSINESS,
2006-2012
From a marketing standpoint checks written (reflected above) is the better measure of payor behavior, as it reflects the bank customer’s selection of payment instrument.
The majority of the Federal Reserve Study refers to checks paid, defined as the means by which the instrument is cleared through the payment system. From a back-office processing perspective, this is an appropriate measure. Checks written have exceeded checks paid by roughly 3 billion items in each of the Federal Reserve’s past two studies, although both are declining at similar rates.
38.3%
1%
21.4%
1%N/M
7.5%
82%
15.5%
17.3%
16%
NUMBER
VALUE
2006
17.0(51%)
2009
12.3(44%)
2012
9.0(43%)
Customer to Business
2006
8.3(25%)
2009
7.6(27%)
2012
6.7(32%)
Business to Business
2006
5.6(17%)
2009
5.1(19%)
2012
3.1(15%)
Business to Customer
2006
2.2 (7%)
2009
2.8 (10%)
2012
2.1 (10%)
Customer to Customer
Bill
ions
Bill
ions
Bill
ions
Bill
ions
Total Checks Total Checks
Total Checks Total Checks
0
5
10
15
20
25
2012
2013
2014
2015
2016
2017
2018
2019
2020
2021
2022
2023
2024
2025
2026
2027
2028
2029
2030
Chec
ks W
ri�en
(bill
ions
of i
tem
s)
Total Consumer Checks Total Business ChecksTotal Checks
Number ValueDebit 38.3% 1%Credit 21.4% 1%EBT/Prepaid 7.5% N/MACH 15.5% 82%Checks 17.3% 16%
Number ValueDebit 38.3% 1%Credit 21.4% 1%EBT/Prepaid 7.5% N/MACH 15.5% 82%Checks 17.3% 16%
2013 Federal Reserve Payments Study, July 2014
WHITE PAPER | What Does the Future of Checks Look Like?
© Deluxe Enterprise Operations, LLC. All rights reserved. 4
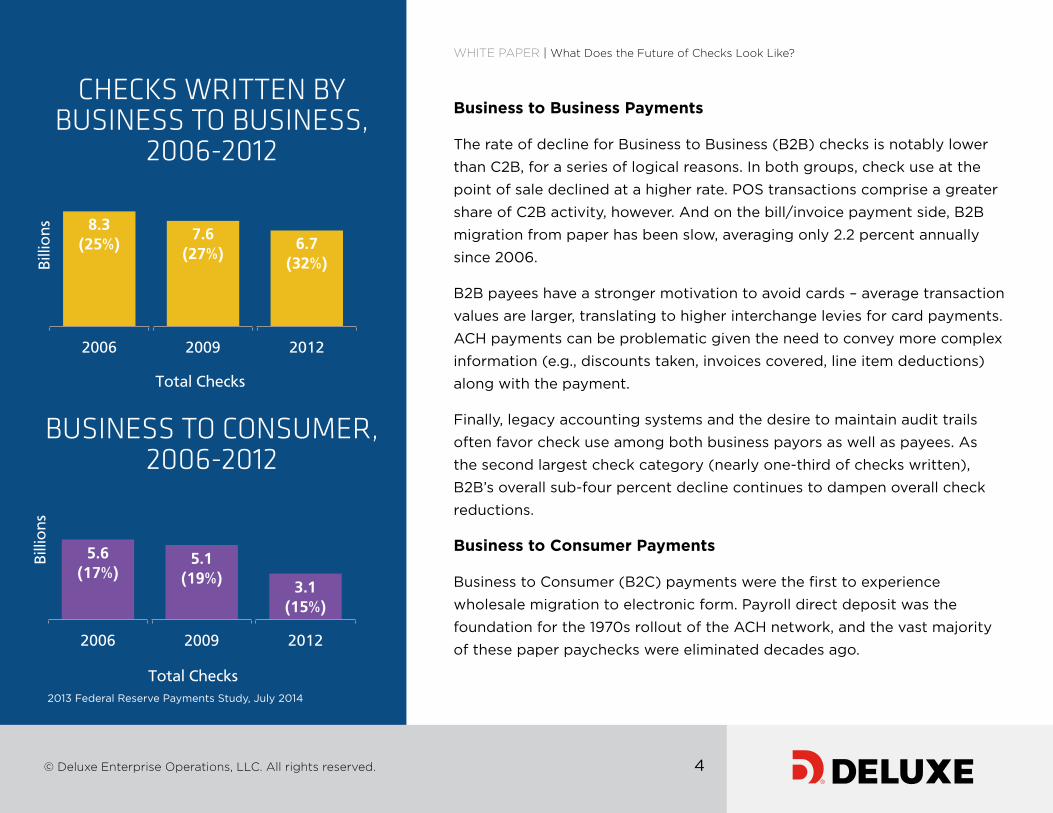
Business to Business Payments
The rate of decline for Business to Business (B2B) checks is notably lower
than C2B, for a series of logical reasons. In both groups, check use at the
point of sale declined at a higher rate. POS transactions comprise a greater
share of C2B activity, however. And on the bill/invoice payment side, B2B
migration from paper has been slow, averaging only 2.2 percent annually
since 2006.
B2B payees have a stronger motivation to avoid cards – average transaction
values are larger, translating to higher interchange levies for card payments.
ACH payments can be problematic given the need to convey more complex
information (e.g., discounts taken, invoices covered, line item deductions)
along with the payment.
Finally, legacy accounting systems and the desire to maintain audit trails
often favor check use among both business payors as well as payees. As
the second largest check category (nearly one-third of checks written),
B2B’s overall sub-four percent decline continues to dampen overall check
reductions.
Business to Consumer Payments
Business to Consumer (B2C) payments were the first to experience
wholesale migration to electronic form. Payroll direct deposit was the
foundation for the 1970s rollout of the ACH network, and the vast majority
of these paper paychecks were eliminated decades ago.
CHECKS WRITTEN BY BUSINESS TO BUSINESS,
2006-2012
BUSINESS TO CONSUMER, 2006-201238.3%
1%
21.4%
1%N/M
7.5%
82%
15.5%
17.3%
16%
NUMBER
VALUE
2006
17.0(51%)
2009
12.3(44%)
2012
9.0(43%)
Customer to Business
2006
8.3(25%)
2009
7.6(27%)
2012
6.7(32%)
Business to Business
2006
5.6(17%)
2009
5.1(19%)
2012
3.1(15%)
Business to Customer
2006
2.2 (7%)
2009
2.8 (10%)
2012
2.1 (10%)
Customer to Customer
Bill
ions
Bill
ions
Bill
ions
Bill
ions
Total Checks Total Checks
Total Checks Total Checks
0
5
10
15
20
25
2012
2013
2014
2015
2016
2017
2018
2019
2020
2021
2022
2023
2024
2025
2026
2027
2028
2029
2030
Chec
ks W
ri�en
(bill
ions
of i
tem
s)
Total Consumer Checks Total Business ChecksTotal Checks
Number ValueDebit 38.3% 1%Credit 21.4% 1%EBT/Prepaid 7.5% N/MACH 15.5% 82%Checks 17.3% 16%
Number ValueDebit 38.3% 1%Credit 21.4% 1%EBT/Prepaid 7.5% N/MACH 15.5% 82%Checks 17.3% 16%
38.3%
1%
21.4%
1%N/M
7.5%
82%
15.5%
17.3%
16%
NUMBER
VALUE
2006
17.0(51%)
2009
12.3(44%)
2012
9.0(43%)
Customer to Business
2006
8.3(25%)
2009
7.6(27%)
2012
6.7(32%)
Business to Business
2006
5.6(17%)
2009
5.1(19%)
2012
3.1(15%)
Business to Customer
2006
2.2 (7%)
2009
2.8 (10%)
2012
2.1 (10%)
Customer to Customer
Bill
ions
Bill
ions
Bill
ions
Bill
ions
Total Checks Total Checks
Total Checks Total Checks
0
5
10
15
20
25
2012
2013
2014
2015
2016
2017
2018
2019
2020
2021
2022
2023
2024
2025
2026
2027
2028
2029
2030
Chec
ks W
ri�en
(bill
ions
of i
tem
s)
Total Consumer Checks Total Business ChecksTotal Checks
Number ValueDebit 38.3% 1%Credit 21.4% 1%EBT/Prepaid 7.5% N/MACH 15.5% 82%Checks 17.3% 16%
Number ValueDebit 38.3% 1%Credit 21.4% 1%EBT/Prepaid 7.5% N/MACH 15.5% 82%Checks 17.3% 16% 2013 Federal Reserve Payments Study, July 2014

WHITE PAPER | What Does the Future of Checks Look Like?
© Deluxe Enterprise Operations, LLC. All rights reserved. 5
Recently the B2C category has undergone another drop in volume (15
percent annually between 2009 and 2012), as payroll cards made a dent
in the remaining base of non-direct deposit payroll transactions. More
importantly, during this time consumer incentive rebates migrated from
paper checks to prepaid cards. The B2C category, comprising 3 billion
annual items (15 percent of check volume), appears poised for further
double-digit declines as businesses continue to promote the use of payroll
and incentive gift cards.
Consumer to Consumer Payments
The smallest of the four categories, Consumer to Consumer (C2C)
payments have proven the slowest to migrate to electronic channels. The 2.1
billion transactions measured by the Federal Reserve in 2012 (10 percent of
checks written) were essentially unchanged from six years earlier.
Well publicized electronic alternatives have existed for some time (PayPal,
Venmo, PopMoney) and have achieved varying degrees of success.
However, there appears to be a steady base of consumers who, when faced
with certain types of events – a birthday gift or paying a neighborhood teen
for yard work – continue to regard paper checks as an effective solution.
It’s worth noting that recent advancements by Apple Pay and digital wallets
are better suited to displace existing card (and to a lesser extent, cash)
payments, rather than checks.
CHECKS WRITTEN BY CONSUMER TO CONSUMER,
2006-2012
38.3%
1%
21.4%
1%N/M
7.5%
82%
15.5%
17.3%
16%
NUMBER
VALUE
2006
17.0(51%)
2009
12.3(44%)
2012
9.0(43%)
Customer to Business
2006
8.3(25%)
2009
7.6(27%)
2012
6.7(32%)
Business to Business
2006
5.6(17%)
2009
5.1(19%)
2012
3.1(15%)
Business to Customer
2006
2.2 (7%)
2009
2.8 (10%)
2012
2.1 (10%)
Customer to Customer
Bill
ions
Bill
ions
Bill
ions
Bill
ions
Total Checks Total Checks
Total Checks Total Checks
0
5
10
15
20
25
2012
2013
2014
2015
2016
2017
2018
2019
2020
2021
2022
2023
2024
2025
2026
2027
2028
2029
2030
Chec
ks W
ri�en
(bill
ions
of i
tem
s)
Total Consumer Checks Total Business ChecksTotal Checks
Number ValueDebit 38.3% 1%Credit 21.4% 1%EBT/Prepaid 7.5% N/MACH 15.5% 82%Checks 17.3% 16%
Number ValueDebit 38.3% 1%Credit 21.4% 1%EBT/Prepaid 7.5% N/MACH 15.5% 82%Checks 17.3% 16%
2013 Federal Reserve Payments Study, July 2014.
Fed Study shows that the 2009 upswing is likely an
anomaly of statistical measurement and that the trend has
really been flat.

WHITE PAPER | What Does the Future of Checks Look Like?
© Deluxe Enterprise Operations, LLC. All rights reserved. 6
External Forces Aren’t Affecting Checks As Much As ExpectedIt’s important to note that technologies have existed to supplant check
usage for some time. Yet checks have endured and actually exceeded the
expectations of many analysts. History has shown that no one solution or
group of solutions is going to completely eliminate the demand for checks.
Clearly customer segmentation and perceived benefits play a role. A 2009
working paper by the Federal Reserve Bank of Boston concluded that while
demographic characteristics, such as age, factor into payment decisions,
more highly correlated factors include the acceptance and appeal of
features for alternative payment products. In other words, while younger
consumers write fewer checks they will still use them for some form of
payments including C2C and C2B when they feel its expedient.
Likewise, we are highly unlikely to see a groundswell of merchants refusing
to accept checks – particularly in the bill payment arena. Empirical evidence
has demonstrated that despite a desire to reduce payment acceptance
costs, merchants prioritize the ability to transact in whatever fashion a
consumer wishes to pay, rather than risk alienating customers. And notably,
the merchant cost of check acceptance remains well below that of cards.
So what is the enduring appeal of paper checks? Payment alternatives
rising in dominance are not likely to poach any more activity from checks.
WHITE PAPER | What Does the Future of Checks Look Like?
© Deluxe Enterprise Operations, LLC. All rights reserved. 7
1. Accepted almost everywhere - Checks’ ubiquity remains a core
advantage. While retailers have demonstrated a willingness to support
new payment forms which generate far lower volumes than checks,
absent an industry-wide mandate, financial institutions are highly unlikely
to disadvantage themselves competitively by ceasing check support.
Banks’ recent investment in marketing remote deposit capture is
evidence of this.
2. Minimal cost to merchant to accept or cash - Given the ongoing
merchant battles to minimize cost of acceptance, it’s important to note
that checks carry no merchant discount. The limited remaining back
office processing cost will be difficult to eliminate until all check AND
cash volume is fully eradicated- an unlikely proposition.
3. Proof of payment/receipt - The value consumers place on this feature
is validated by the increasing demand for “duplicate” check stock. It
remains easier to retrieve an image of a paid check to confirm both
receipt and purpose of payment than it is to accomplish the same task
for a card or ACH payment. This benefit is even more powerful for
business checks, as noted below.
4. Audit trail/records - A key reason that business check volumes have
proven more resilient than consumer checks. Business payors continue to
prefer the approval documentation and detailed remittance explanations
(which are often more complex than for consumers) provided by a
paper trail. Automated workflow alternatives have existed for years, but
behavior indicates that businesses do not perceive sufficient value to
justify the effort to switch.
THE ENDURING APPEAL OF
PAPER CHECKS

WHITE PAPER | What Does the Future of Checks Look Like?
© Deluxe Enterprise Operations, LLC. All rights reserved. 8
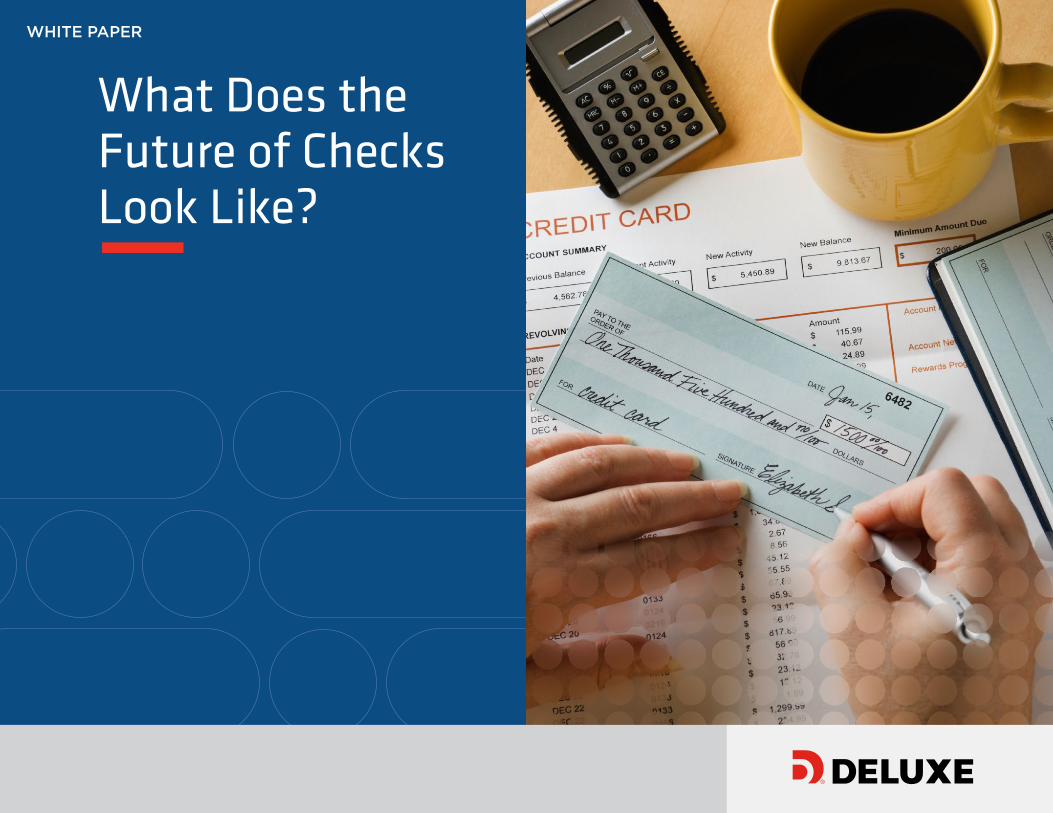
Checks Remain in the Mix Through 2030 and Beyond As any savvy investor knows, past history does not guarantee future
performance. The Federal Reserve does not offer forward projections
of payment trends. By extrapolating current trends at a detailed level
(assessing each of eight payment categories separately, e.g., C2B point of
sale vs. B2B bill payment) Deluxe has created its own estimates of future
check volumes.
Our analysis foresees nearly 12 billion checks being written in 2020, and
over 6 billion in 2030. Although developed entirely independently, Deluxe’s
projections are quite similar to two other known sources. McKinsey &
Company’s Payments Map forecast extends through 2019, showing slightly
lower check volume than Deluxe. A 2015 white paper issued by Digital
Check Corp. (a leading manufacturer of check scanners) offers three check
scenarios through 2030 – two of them tracking closely to Deluxe’s.
One interesting side note is that we see B2B check volumes matching
C2B by 2020-2021 due to the steeper decline of C2B payments. Overall,
consumers will continue to write nominally more checks than businesses,
however, thanks to relatively stable C2C volumes.
While such forecasts are an inexact science, a few predictions seem safe.
The number of check writers will decline at a slower pace than the number
of checks written. While many have blamed the decline on new checking
accounts being opened without checkbooks, the Federal Reserve Bank of
Boston’s research indicates that the greater impact is from a decline in the
number of checks written per active household.
DELUXE PROJECTIONS2012-2030
38.3%
1%
21.4%
1%N/M
7.5%
82%
15.5%
17.3%
16%
NUMBER
VALUE
2006
17.0(51%)
2009
12.3(44%)
2012
9.0(43%)
Customer to Business
2006
8.3(25%)
2009
7.6(27%)
2012
6.7(32%)
Business to Business
2006
5.6(17%)
2009
5.1(19%)
2012
3.1(15%)
Business to Customer
2006
2.2 (7%)
2009
2.8 (10%)
2012
2.1 (10%)
Customer to Customer
Bill
ions
Bill
ions
Bill
ions
Bill
ions
Total Checks Total Checks
Total Checks Total Checks
0
5
10
15
20
25
2012
2013
2014
2015
2016
2017
2018
2019
2020
2021
2022
2023
2024
2025
2026
2027
2028
2029
2030
Chec
ks W
ri�en
(bill
ions
of i
tem
s)
Total Consumer Checks Total Business ChecksTotal Checks
Number ValueDebit 38.3% 1%Credit 21.4% 1%EBT/Prepaid 7.5% N/MACH 15.5% 82%Checks 17.3% 16%
Number ValueDebit 38.3% 1%Credit 21.4% 1%EBT/Prepaid 7.5% N/MACH 15.5% 82%Checks 17.3% 16%

Attempts to Fully Retire Checks Rarely End WellAbsent some major unforeseen event, the volume of US checks written
will remain non-zero, as there is no precedent for a country fully retiring
checks without a firm government mandate. The only literal examples of
complete retirement are Sweden and the Netherlands, where checks had
always played a secondary role in the payments system. Yet banks, even in
these countries, remain capable of processing checks and there is still some
limited usage even in these countries.
More relevant is the UK experience, where in 2009 the British government
issued a mandate to eliminate checks by 2018. As deadlines for the first
tangible actions approached, however, consumer groups registered strong
opposition and the mandate was rescinded – while check elimination
remains a policy goal, there is no longer a target date attached.
WHITE PAPER | What Does the Future of Checks Look Like?
© Deluxe Enterprise Operations, LLC. All rights reserved. 9
Given the US political and regulatory environment, it’s difficult to envision a mandate to eliminate checks being enacted here.
EXTERNAL FORCES THAT DROVE REDUCTIONS IN CHECK USAGE
1983- 1988
1995-2000
1998-2004
2003-2006
Cards at grocery stores
Electronic bill payment
Cash back at the point of sale
Payroll direct deposit

WHITE PAPER | What Does the Future of Checks Look Like?
© Deluxe Enterprise Operations, LLC. All rights reserved. 10
ConclusionsHopefully our analysis has helped demystify the underlying drivers of US
check trends. Some key takeaways:
• There are still roughly 20 billion checks written in the US each
year, conveying over $22 trillion in value – more than any payment
instrument other than the ACH
• Trends vary by usage (C2B, B2B, POS, bill payment, etc.) and
must be evaluated separately to gain a firm understanding of
check trends
• Alternatives have existed for some time to eliminate all remaining
check usage – it’s customer preference/demand that drives their
persistence
• The number of checks written will decline more rapidly than the
number of check writers
• The only countries to have fully retired checks 1) never relied on
them to the same extent as the US, and 2) issued some form of
governmental mandate to complete the process
• Projections developed independently by Deluxe and other industry
experts estimate roughly 12 billion checks remaining in 2020, and
6 billion by 2030
WANT MORE INFORMATION ABOUT
THE DELUXE CHECK PROGRAM?
Contact us today.
SEARCH fi.deluxe.com/solutions/consumer-check-program
CALL800.252.3414
Listen. Solve. Deliver.

WHITE PAPER | What Does the Future of Checks Look Like?
© Deluxe Enterprise Operations, LLC. All rights reserved. 11
About DeluxeSince 1915, Deluxe has been working hard as a partner for financial institutions to
drive deeper customer engagement and more profitable revenue. As the financial
services industry has evolved, Deluxe has been an active participant in shaping it—
with the calm assurance of a company that has done it before.
Today, thanks to collaboration, innovation, and acquisition, Deluxe has an ever-
growing portfolio of retail and commercial banking FinTech solutions focused on
helping our clients manage the customer lifecycle—acquire, onboard, engage, and
operate. Our growing array of inventive, client-inspired solutions are designed to
help our clients grow in a changing, competitive landscape:
• Data and Analytics
• Digital Channels
• Marketing Services
• Performance Management
• Rewards and Loyalty
• Fraud and Risk Solutions
• Check Programs
Learn more at fi.deluxe.com Follow us on our Forward Banker blog