Embed Size (px)
Citation preview
White Paper
Samsung Solid-State Drive PM863
Optimized solid-state drives ideal for data center environments
2
Contents
1. Executive summary 3
2. Industry trends 3
3. Introduction 3
4. About the Samsung PM863 SSD 3
5. PM863 specifications 4
6. Mixed workload performance and read/write QoS 5
1) Performance comparison targets and the performance measurement environment 5
2) Sequential and random read/write performance 6
3) Latency QoS 7
7. Criteria for choosing the best data center SSD 8
1) Top-notch mixed performance using Samsung V-NAND technology 9
2) Superior QoS to fulfill SLA 11
3) Superb management for maximum latency 13
4) Solid mixed performance for stable IOPS consistency 14
8. User scenarios (UX Performance) 20
1) Social Network Services ( SNS ) 20
2) Messenger service 23
3) Application to the web, file, exchange and database servers 24
9. Conclusion 30
10. Appendix - Index ‘A’: Analysis of workload by application in the data center 31
3
The enormous growth in data traffic is driving data centers to find ways to handle the volume
1. Executive summary
Today's data centers must serve requests from diverse applications and
databases with numerous kinds of services, each requiring different
performance needs. Therefore, IT managers want solid-state drives (SSDs) that
are optimized to handle :
• M ixed Work load Per fo rmance . D e l i v e r o u t s t a n d i n g
performance under mixed workloads typical of diverse data
center applications that simultaneously access the same device
• R e a d / W r i t e Q u a l i t y o f S e r v i c e ( Q o S ) . R e t a i n
consistent IOPS performance under various heavy workloads
Designed to deliver optimal performance under data centers' varying workloads,
the Samsung PM863 has been proven to display superior performance in a real
data center environment. Based on a V-NAND TLC, the Samsung PM863 SSD
outperforms 2D planar MLC SSDs in mixed workload performance and QoS.
The PM863 shows outstanding random read/write performance
up to 99K/18K IOPS respectively with constant performance. In a
comparison test under a 4 KB mixed workload, the PM863 shows
more than a 90% IOPS read/write consistency, while the competitor
products show fluctuations with an average ± 28% IOPS deviation.
The 960 GB PM863 SSD, with 0.8 Drive Writes Per Day (DWPD), is superior to the
0.35 DWPD 800 GB MLC SSD in a 4 KB random read/write QD32 mixed workload
proportion of 75%/25%. It also shows a 45% higher mixed performance
and superior read and write QoS at 99.99% by 36% and 72% repectively.
Moreover, the 960 GB PM863 SSD is superior to the 800 GB 3 DWPD in a 4 KB
random read/write QD32 mixed workload proportation of 75%/25%. It is similar
to the 800 GB 3 DWPD in mixed performance. However, it is superior to the 800
GB 3 DWPD in read and write QoS at 99.99% by 36% and 52% respectively. These
results prove that the PM863 SSD is an economical and optimized solution
for data center environments that outperforms the 2D planar MLC SSD, which
shows relatively low performance and is expensive. Plus, the enhanced reliability
features of the PM863 ensure uninterrupted operation regardless of power
losses. Based on these findings, it is clear that the PM863 is the preferred choice
for data center IT managers.
2. Industry trends
In recent years, there has been exponential growth in data center traffic, driven
by businesses and consumers. Employees are more connected than ever before
wherever their work takes them around the world. From emailing and texting
to videoconferencing, workers have access to data from virtually anywhere.
Likewise, consumer traffic on the Internet and the ubiquitous use of mobile
devices has given rise to everything from online banking and purchasing to social
networking and video on demand (VOD). To meet this demand, data centers
must handle enormous volumes of data of various kinds 24/7, 365 days a year.
Various types of data center SSDs have been released to address these demands.
Typically, an SLC or MLC NAND flash is mounted on the SSD with manufacturer
claims of high-performance and high-reliability, along with a high price tag.
However, testing these SSDs has proven that they do not offer consistent and
steady high-performance. Plus, they have some compatibility issues, revealing
that they are not suitable for data center applications.
3. Introduction
Choose an SSD that provides consistent high performance and reliability
To improve this expensive and inefficient structure, Samsung Electronics has
developed the V-NAND TLC-based PM863 SSD. It is generally believed that TLC
NAND flash is slower and less stable than SLC and MLC NAND flash. However, the
Samsung Vertical-NAND (V-NAND) TLC is quite different. Using superb solution
technology, Samsung Electronics has proven that its TLC NAND flash easily
performs as well as SLC/MLC NAND flash. The Samsung V-NAND TLC-based
PM863 SSD demonstrates 20% higher mixed random read/write performance
than the MLC-based data center SSD and 20 times better performance on
latency (QoS). Considering that the MLC-based data center SSD has been
evaluated as the most superior SSD in the market, these statistics are impressive.
This white paper will prove through test data how the Samsung V-NAND TLC-
based SSD is highly efficient compared with a competitor’s MLC SSD in both
mixed workload performance and read/write QoS. Tests were performed with
various types of workloads in a real-life data center environment to compare the
superior performance and Input/Output Per Second (IOPS) consistency of the
Samsung PM863 SSD versus a competitor's MLC SSD. superior performance
and Input/Output Per Second (IOPS) consistency of the Samsung PM863 SSD
versus a competitor's MLC SSD.
4. About the Samsung PM863 SSD
The Samsung PM863 SSD has been optimized for data center use, boasting
high-performance random read/write mixed workloads and always processing
read/write Input/Output (IO) with a constant and equal response time. This
benefit makes the PM863 an excellent choice for environments that must
comply with a Service Level Agreement (SLA), such as cloud services. In addition,
the PM863 is an economical and highly reliable solution to the TLC NAND flash
because of its innovative V-NAND technology. The PM863 provides higher
reliability than the 2D planar NAND flash as a result of its vertical structure, which
virtually eliminates the interference between NAND flash cells. In addition, the
improved error correction engine quickly detects errors that occur during SSD
operation, recovers the user data and improves the reliability of the data stored
in the NAND flash memory.
4
Powerful features protect valuable data and expensive servers
Samsung PM863
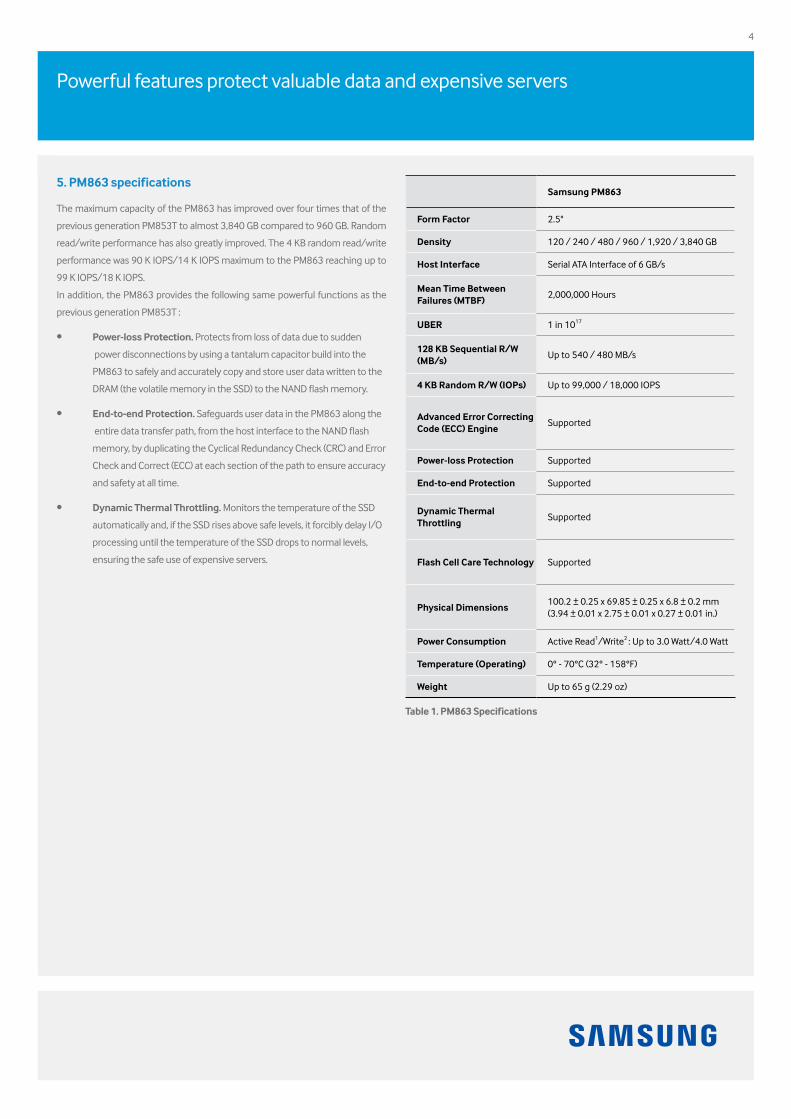
Form Factor 2.5"
Density 120 / 240 / 480 / 960 / 1,920 / 3,840 GB
Host Interface Serial ATA Interface of 6 GB/s
Mean Time Between Failures (MTBF)
2,000,000 Hours
UBER 1 in 1017
128KBSequentialR/W(MB/s)
Up to 540 / 480 MB/s
4KBRandomR/W(IOPs) Up to 99,000 / 18,000 IOPS
Advanced Error Correcting Code (ECC) Engine
Supported
Power-loss Protection Supported
End-to-end Protection Supported
Dynamic Thermal Throttling
Supported
Flash Cell Care Technology Supported
Physical Dimensions100.2 ± 0.25 x 69.85 ± 0.25 x 6.8 ± 0.2 mm (3.94 ± 0.01 x 2.75 ± 0.01 x 0.27 ± 0.01 in.)
Power Consumption Active Read1/Write2 : Up to 3.0 Watt/4.0 Watt
Temperature (Operating) 0° - 70°C (32° - 158°F)
Weight Up to 65 g (2.29 oz)
Table 1. PM863 Specifications
5. PM863 specifications
The maximum capacity of the PM863 has improved over four times that of the
previous generation PM853T to almost 3,840 GB compared to 960 GB. Random
read/write performance has also greatly improved. The 4 KB random read/write
performance was 90 K IOPS/14 K IOPS maximum to the PM863 reaching up to
99 K IOPS/18 K IOPS.
In addition, the PM863 provides the following same powerful functions as the
previous generation PM853T :
• Power-lossProtection.Protects from loss of data due to sudden
power disconnections by using a tantalum capacitor build into the
PM863 to safely and accurately copy and store user data written to the
DRAM (the volatile memory in the SSD) to the NAND flash memory.
• End-to-endProtection. Safeguards user data in the PM863 along the
entire data transfer path, from the host interface to the NAND flash
memory, by duplicating the Cyclical Redundancy Check (CRC) and Error
Check and Correct (ECC) at each section of the path to ensure accuracy
and safety at all time.
• DynamicThermalThrottling. Monitors the temperature of the SSD
automatically and, if the SSD rises above safe levels, it forcibly delay I/O
processing until the temperature of the SSD drops to normal levels,
ensuring the safe use of expensive servers.
5
PM863 technology is compared to 2D planar MLC NAND flash memory products
6.Mixed workload performance and read/write QoS
1) Per formance comparison targets and the per formance
measurement environment
The system configuration used to measure the performance of the 960 GB
and 800 GB* PM863 included basic sequential, mixed random read/write
performance and QoS and was compared with two products that use the 2D
planar MLC NAND flash memory. Product one is a 0.35 DWPD 800 GB SSD
(hereafter referred to as MLC SSD-A). Product two is a 3 DWPD 800 GB SSD
(hereafter referred to as MLC SSD-B). Like the PM863, the MLC SSD-A is designed
for read-intensive workloads and uses a 25 nm MLC NAND flash. The MLC
SSD-B is designed for mixed read/write usage, such as an Online Transaction
Processing (OLTP) environment and uses a 20 nm MLC NAND flash. The MLC
SSD-B provides a larger over provisioning (OP) ratio than the MLC SSD-A and
therefore, provides a higher random write performance than the MLC SSD-A.
It's important to note that all performance items mentioned in this white paper
have been measured at the sustained state, except the sequential read/write
performance. The sustained state in this document refers to the status that a
128 KB sequential write has been completed equal to the drive capacity and the
4 KB random write has completed twice as much as the drive capacity.
It's important to note that all performance items mentioned in this white paper
have been measured at the sustained state, except the sequential read/write
performance. The sustained state in this document refers to the status that a
128 KB sequential write has been completed equal to the drive capacity and
then 4 KB random write has completed twice as much as the drive capacity.
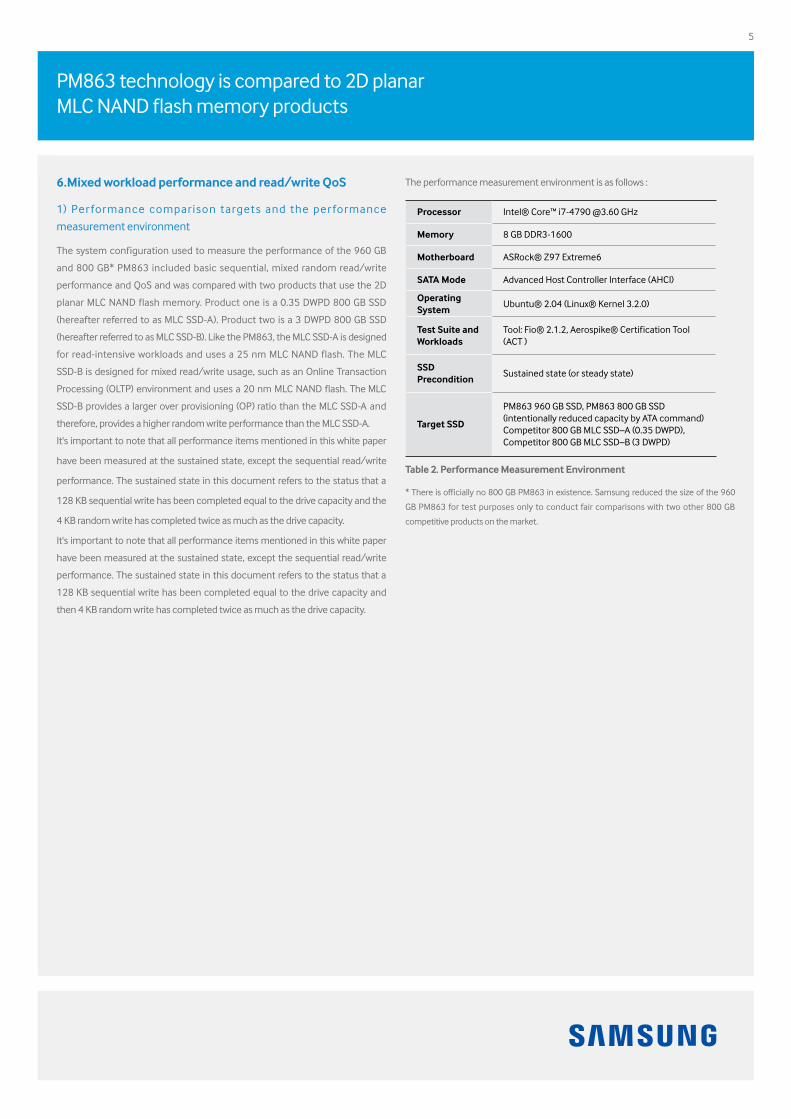
The performance measurement environment is as follows :
Processor Intel® Core™ i7-4790 @3.60 GHz
Memory 8 GB DDR3-1600
Motherboard ASRock® Z97 Extreme6
SATA Mode Advanced Host Controller Interface (AHCI)
Operating System
Ubuntu® 2.04 (Linux® Kernel 3.2.0)
Test Suite and Workloads
Tool: Fio® 2.1.2, Aerospike® Certification Tool (ACT )
SSD Precondition
Sustained state (or steady state)
Target SSD
PM863 960 GB SSD, PM863 800 GB SSD (intentionally reduced capacity by ATA command)Competitor 800 GB MLC SSD–A (0.35 DWPD),Competitor 800 GB MLC SSD–B (3 DWPD)
Table 2. Performance Measurement Environment
* There is officially no 800 GB PM863 in existence. Samsung reduced the size of the 960
GB PM863 for test purposes only to conduct fair comparisons with two other 800 GB
competitive products on the market.
6
The V-NAND TLC-based PM863 shows greater performance over the MLC NAND-based SSDs
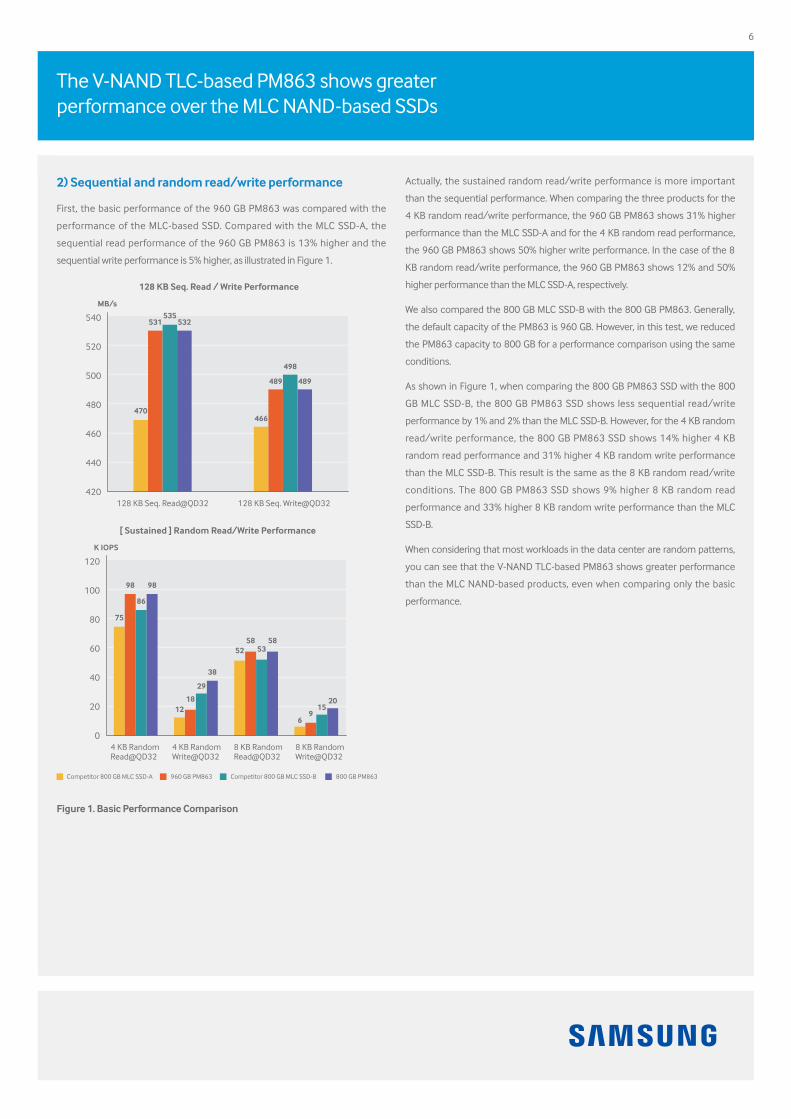
2) Sequential and random read/write performance
First, the basic performance of the 960 GB PM863 was compared with the
performance of the MLC-based SSD. Compared with the MLC SSD-A, the
sequential read performance of the 960 GB PM863 is 13% higher and the
sequential write performance is 5% higher, as illustrated in Figure 1.
Actually, the sustained random read/write performance is more important
than the sequential performance. When comparing the three products for the
4 KB random read/write performance, the 960 GB PM863 shows 31% higher
performance than the MLC SSD-A and for the 4 KB random read performance,
the 960 GB PM863 shows 50% higher write performance. In the case of the 8
KB random read/write performance, the 960 GB PM863 shows 12% and 50%
higher performance than the MLC SSD-A, respectively.
We also compared the 800 GB MLC SSD-B with the 800 GB PM863. Generally,
the default capacity of the PM863 is 960 GB. However, in this test, we reduced
the PM863 capacity to 800 GB for a performance comparison using the same
conditions.
As shown in Figure 1, when comparing the 800 GB PM863 SSD with the 800
GB MLC SSD-B, the 800 GB PM863 SSD shows less sequential read/write
performance by 1% and 2% than the MLC SSD-B. However, for the 4 KB random
read/write performance, the 800 GB PM863 SSD shows 14% higher 4 KB
random read performance and 31% higher 4 KB random write performance
than the MLC SSD-B. This result is the same as the 8 KB random read/write
conditions. The 800 GB PM863 SSD shows 9% higher 8 KB random read
performance and 33% higher 8 KB random write performance than the MLC
SSD-B.
When considering that most workloads in the data center are random patterns,
you can see that the V-NAND TLC-based PM863 shows greater performance
than the MLC NAND-based products, even when comparing only the basic
performance.
Figure 1. Basic Performance Comparison
120
K IOPS
75
126
915
20
52 5358 58
18
29
38
98
86
98
4 KB RandomRead@QD32
4 KB RandomWrite@QD32
8 KB RandomRead@QD32
8 KB RandomWrite@QD32
[ Sustained ] Random Read/Write Performance
100
80
60
40
20
0
540
MB/s
470466
489 489
498
531535
532
128 KB Seq. Read@QD32 128 KB Seq. Write@QD32
128 KB Seq. Read / Write Performance
520
500
480
460
440
420
Competitor 800 GB MLC SSD-A 960 GB PM863 800 GB PM863 Competitor 800 GB MLC SSD-B
7
More requests are performed in less time with the PM863 compared with the other products
3) Latency QoS
In addition to the sequential and random read/write performance, we need to
compare the latency of the SSD. The term latency is similar to the I/O response
time. The sequential or random read/write performance shows how may I/Os
can be processed within a unit of time. The latency shows how quickly the host
read/write I/O can be processed and completed. A short latency indicates that
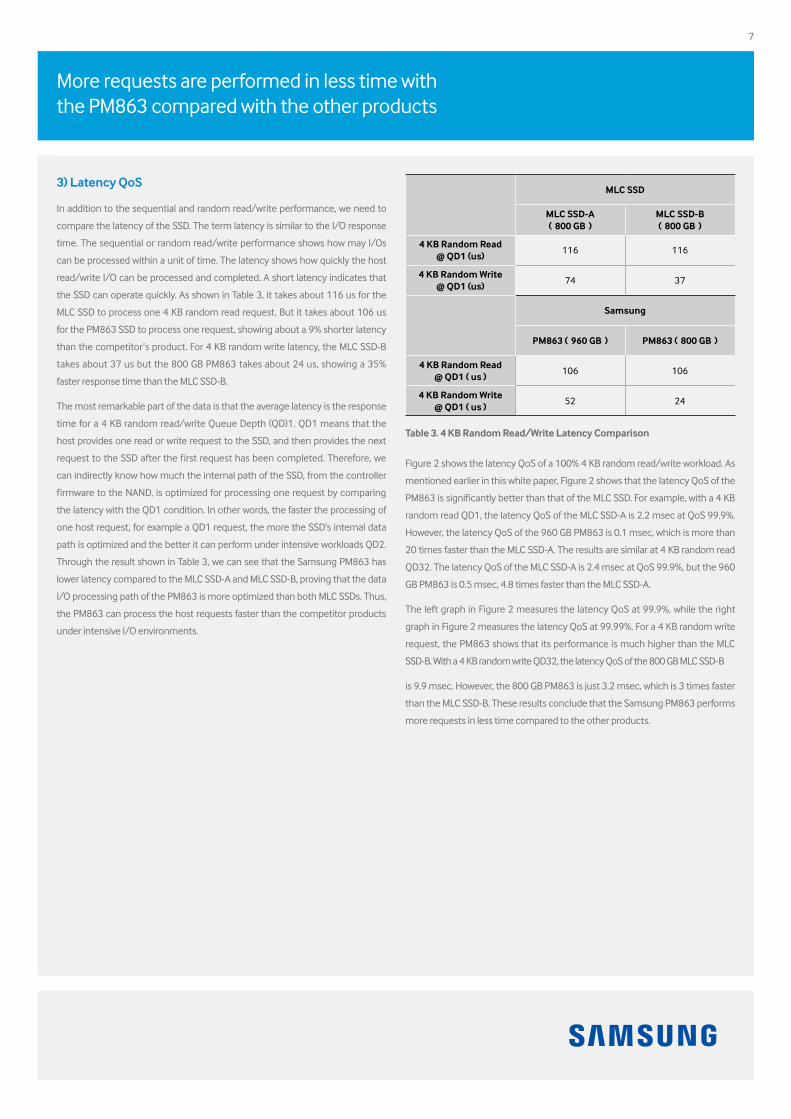
the SSD can operate quickly. As shown in Table 3, it takes about 116 us for the
MLC SSD to process one 4 KB random read request. But it takes about 106 us
for the PM863 SSD to process one request, showing about a 9% shorter latency
than the competitor’s product. For 4 KB random write latency, the MLC SSD-B
takes about 37 us but the 800 GB PM863 takes about 24 us, showing a 35%
faster response time than the MLC SSD-B.
The most remarkable part of the data is that the average latency is the response
time for a 4 KB random read/write Queue Depth (QD)1. QD1 means that the
host provides one read or write request to the SSD, and then provides the next
request to the SSD after the first request has been completed. Therefore, we
can indirectly know how much the internal path of the SSD, from the controller
firmware to the NAND, is optimized for processing one request by comparing
the latency with the QD1 condition. In other words, the faster the processing of
one host request, for example a QD1 request, the more the SSD's internal data
path is optimized and the better it can perform under intensive workloads QD2.
Through the result shown in Table 3, we can see that the Samsung PM863 has
lower latency compared to the MLC SSD-A and MLC SSD-B, proving that the data
I/O processing path of the PM863 is more optimized than both MLC SSDs. Thus,
the PM863 can process the host requests faster than the competitor products
under intensive I/O environments.
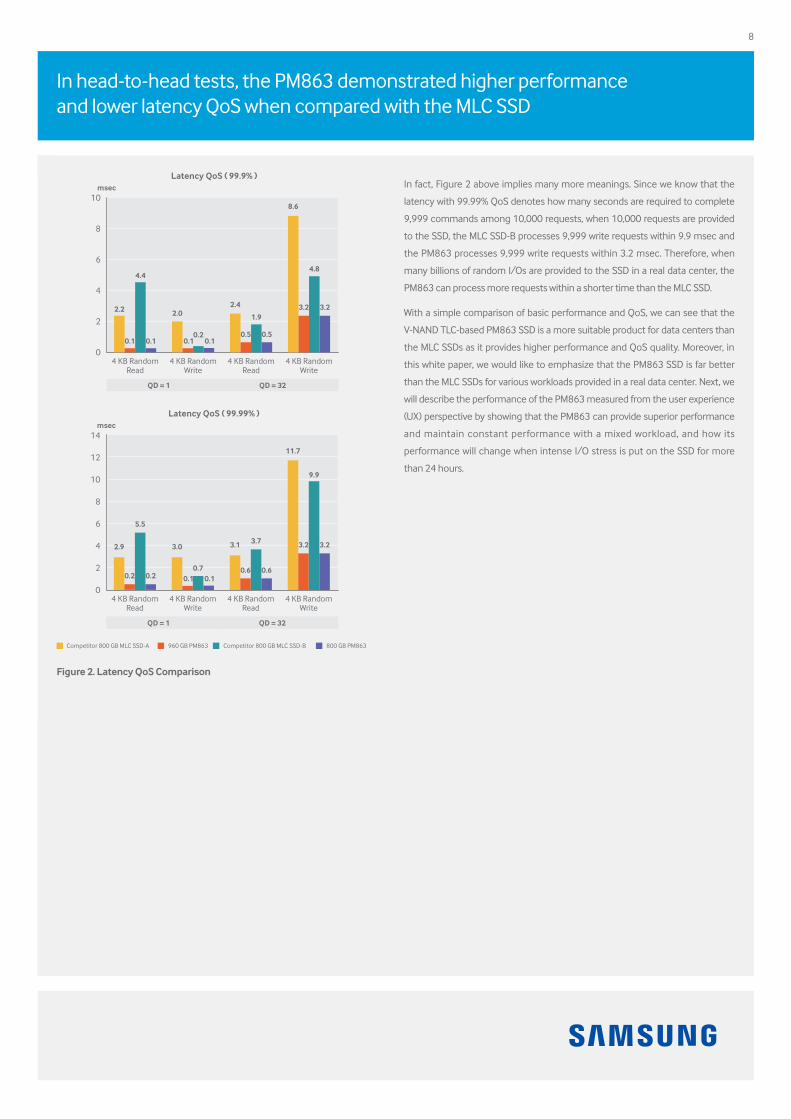
Figure 2 shows the latency QoS of a 100% 4 KB random read/write workload. As
mentioned earlier in this white paper, Figure 2 shows that the latency QoS of the
PM863 is significantly better than that of the MLC SSD. For example, with a 4 KB
random read QD1, the latency QoS of the MLC SSD-A is 2.2 msec at QoS 99.9%.
However, the latency QoS of the 960 GB PM863 is 0.1 msec, which is more than
20 times faster than the MLC SSD-A. The results are similar at 4 KB random read
QD32. The latency QoS of the MLC SSD-A is 2.4 msec at QoS 99.9%, but the 960
GB PM863 is 0.5 msec, 4.8 times faster than the MLC SSD-A.
The left graph in Figure 2 measures the latency QoS at 99.9%, while the right
graph in Figure 2 measures the latency QoS at 99.99%. For a 4 KB random write
request, the PM863 shows that its performance is much higher than the MLC
SSD-B. With a 4 KB random write QD32, the latency QoS of the 800 GB MLC SSD-B
is 9.9 msec. However, the 800 GB PM863 is just 3.2 msec, which is 3 times faster
than the MLC SSD-B. These results conclude that the Samsung PM863 performs
more requests in less time compared to the other products.
MLC SSD
MLC SSD-A ( 800 GB )
MLC SSD-B ( 800 GB )
4KBRandomRead@ QD1 (us)
116 116
4KBRandomWrite@ QD1 (us)
74 37
Samsung
PM863 ( 960 GB ) PM863 ( 800 GB )
4KBRandomRead@ QD1 ( us )
106 106
4KBRandomWrite@ QD1 ( us )
52 24
Table3.4KBRandomRead/WriteLatencyComparison
8
In head-to-head tests, the PM863 demonstrated higher performance and lower latency QoS when compared with the MLC SSD
In fact, Figure 2 above implies many more meanings. Since we know that the
latency with 99.99% QoS denotes how many seconds are required to complete
9,999 commands among 10,000 requests, when 10,000 requests are provided
to the SSD, the MLC SSD-B processes 9,999 write requests within 9.9 msec and
the PM863 processes 9,999 write requests within 3.2 msec. Therefore, when
many billions of random I/Os are provided to the SSD in a real data center, the
PM863 can process more requests within a shorter time than the MLC SSD.
With a simple comparison of basic performance and QoS, we can see that the
V-NAND TLC-based PM863 SSD is a more suitable product for data centers than
the MLC SSDs as it provides higher performance and QoS quality. Moreover, in
this white paper, we would like to emphasize that the PM863 SSD is far better
than the MLC SSDs for various workloads provided in a real data center. Next, we
will describe the performance of the PM863 measured from the user experience
(UX) perspective by showing that the PM863 can provide superior performance
and maintain constant performance with a mixed workload, and how its
performance will change when intense I/O stress is put on the SSD for more
than 24 hours.
Figure 2. Latency QoS Comparison
10msec
2.22.4
2.0
8.6
3.2 3.2
4.8
1.9
0.5 0.50.20.1
4.4
0.1 0.1 0.1
4 KB RandomRead
4 KB RandomWrite
4 KB RandomRead
4 KB RandomWrite
8
6
4
2
0
Latency QoS ( 99.9% )
Competitor 800 GB MLC SSD-A 960 GB PM863 800 GB PM863 Competitor 800 GB MLC SSD-B
QD = 1 QD = 32
14msec
2.9 3.13.0
11.7
3.2 3.2
9.9
3.7
0.6 0.60.70.2
5.5
0.2 0.1 0.1
4 KB RandomRead
4 KB RandomWrite
4 KB RandomRead
4 KB RandomWrite
10
8
12
6
4
2
0
Latency QoS ( 99.99% )
QD = 1 QD = 32
9
7. Criteria for choosing the best data center SSD
Enhance the user experience with the superior performance of the
PM863
In a real data center, SSD applications can be infinite, ranging from video
streaming service to cloud service, OLTP, messaging service and virtual desktop
infrastructure (VDI). It may be very difficult to measure how much superior
performance will be provided by SSDs for the various services. As the services
are provided to users, the workload given to the SSD is not a simple sequential
I/O, pure 100% random read or 100% random write workload, but a mixture of
random read and write workload.
Therefore, we can determine whether the SSD can provide high performance
with a small deviation in real data center services by observing the performance
indices shown in the mixed workload environment. Here, we will compare the
V-NAND TLC-based PM863 with the 2D planar MLC-based SSDs by using the
mixed workload to discuss the performance that users will experience in a real
environment and determine which product is more suitable for the data center.
1) Top-notch mixed performance using Samsung V-NAND
technology
As mentioned before, the workload in a real data center has a mixed pattern. Therefore, in this test, we measured and compared the performance at the sustained state when the 4 KB random read/write I/Os are mixed in a certain proportion.
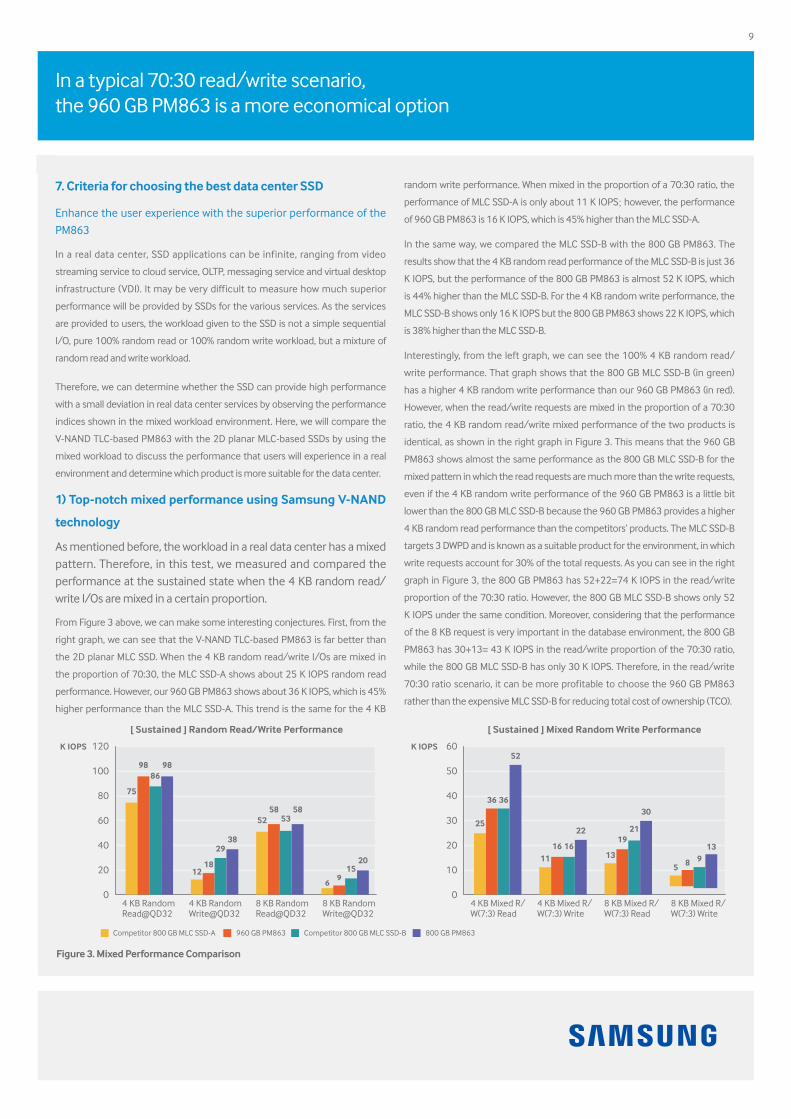
From Figure 3 above, we can make some interesting conjectures. First, from the
right graph, we can see that the V-NAND TLC-based PM863 is far better than
the 2D planar MLC SSD. When the 4 KB random read/write I/Os are mixed in
the proportion of 70:30, the MLC SSD-A shows about 25 K IOPS random read
performance. However, our 960 GB PM863 shows about 36 K IOPS, which is 45%
higher performance than the MLC SSD-A. This trend is the same for the 4 KB
In a typical 70:30 read/write scenario, the 960 GB PM863 is a more economical option
Figure 3. Mixed Performance Comparison
random write performance. When mixed in the proportion of a 70:30 ratio, the
performance of MLC SSD-A is only about 11 K IOPS; however, the performance
of 960 GB PM863 is 16 K IOPS, which is 45% higher than the MLC SSD-A.
In the same way, we compared the MLC SSD-B with the 800 GB PM863. The
results show that the 4 KB random read performance of the MLC SSD-B is just 36
K IOPS, but the performance of the 800 GB PM863 is almost 52 K IOPS, which
is 44% higher than the MLC SSD-B. For the 4 KB random write performance, the
MLC SSD-B shows only 16 K IOPS but the 800 GB PM863 shows 22 K IOPS, which
is 38% higher than the MLC SSD-B.
Interestingly, from the left graph, we can see the 100% 4 KB random read/
write performance. That graph shows that the 800 GB MLC SSD-B (in green)
has a higher 4 KB random write performance than our 960 GB PM863 (in red).
However, when the read/write requests are mixed in the proportion of a 70:30
ratio, the 4 KB random read/write mixed performance of the two products is
identical, as shown in the right graph in Figure 3. This means that the 960 GB
PM863 shows almost the same performance as the 800 GB MLC SSD-B for the
mixed pattern in which the read requests are much more than the write requests,
even if the 4 KB random write performance of the 960 GB PM863 is a little bit
lower than the 800 GB MLC SSD-B because the 960 GB PM863 provides a higher
4 KB random read performance than the competitors’ products. The MLC SSD-B
targets 3 DWPD and is known as a suitable product for the environment, in which
write requests account for 30% of the total requests. As you can see in the right
graph in Figure 3, the 800 GB PM863 has 52+22=74 K IOPS in the read/write
proportion of the 70:30 ratio. However, the 800 GB MLC SSD-B shows only 52
K IOPS under the same condition. Moreover, considering that the performance
of the 8 KB request is very important in the database environment, the 800 GB
PM863 has 30+13= 43 K IOPS in the read/write proportion of the 70:30 ratio,
while the 800 GB MLC SSD-B has only 30 K IOPS. Therefore, in the read/write
70:30 ratio scenario, it can be more profitable to choose the 960 GB PM863
rather than the expensive MLC SSD-B for reducing total cost of ownership (TCO).
K IOPS
[ Sustained ] Random Read/Write Performance [ Sustained ] Mixed Random Write Performance
120
100
80
60
40
20
0
75
126
915
20
52 5358 58
18
2938
9886
98
4 KB RandomRead@QD32
4 KB RandomWrite@QD32
8 KB RandomRead@QD32
8 KB RandomWrite@QD32
K IOPS 60
50
40
30
20
10
0
25
115 8 9
1313
2119
30
16 16
22
36 36
52
4 KB Mixed R/W(7:3) Read
4 KB Mixed R/W(7:3) Write
8 KB Mixed R/W(7:3) Read
8 KB Mixed R/W(7:3) Write
Competitor 800 GB MLC SSD-A 960 GB PM863 800 GB PM863 Competitor 800 GB MLC SSD-B
10
With nearly a 50% higher mixed performance, the 960 GB PM863 is a better data center choice
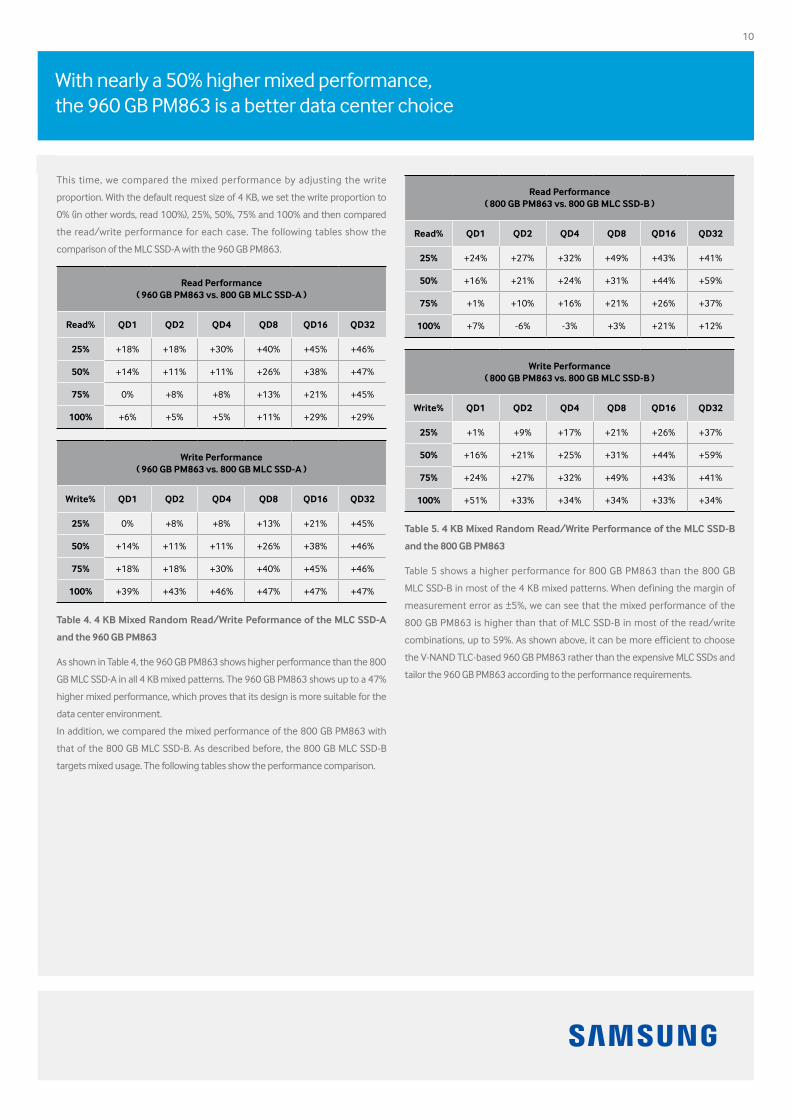
This time, we compared the mixed performance by adjusting the write
proportion. With the default request size of 4 KB, we set the write proportion to
0% (in other words, read 100%), 25%, 50%, 75% and 100% and then compared
the read/write performance for each case. The following tables show the
comparison of the MLC SSD-A with the 960 GB PM863.
ReadPerformance( 960 GB PM863 vs. 800 GB MLC SSD-A )
Read% QD1 QD2 QD4 QD8 QD16 QD32
25% +18% +18% +30% +40% +45% +46%
50% +14% +11% +11% +26% +38% +47%
75% 0% +8% +8% +13% +21% +45%
100% +6% +5% +5% +11% +29% +29%
WritePerformance( 960 GB PM863 vs. 800 GB MLC SSD-A )
Write% QD1 QD2 QD4 QD8 QD16 QD32
25% 0% +8% +8% +13% +21% +45%
50% +14% +11% +11% +26% +38% +46%
75% +18% +18% +30% +40% +45% +46%
100% +39% +43% +46% +47% +47% +47%
Table4.4KBMixedRandomRead/WritePeformanceoftheMLCSSD-A
and the 960 GB PM863
As shown in Table 4, the 960 GB PM863 shows higher performance than the 800
GB MLC SSD-A in all 4 KB mixed patterns. The 960 GB PM863 shows up to a 47%
higher mixed performance, which proves that its design is more suitable for the
data center environment.
In addition, we compared the mixed performance of the 800 GB PM863 with
that of the 800 GB MLC SSD-B. As described before, the 800 GB MLC SSD-B
targets mixed usage. The following tables show the performance comparison.
ReadPerformance( 800 GB PM863 vs. 800 GB MLC SSD-B )
Read% QD1 QD2 QD4 QD8 QD16 QD32
25% +24% +27% +32% +49% +43% +41%
50% +16% +21% +24% +31% +44% +59%
75% +1% +10% +16% +21% +26% +37%
100% +7% -6% -3% +3% +21% +12%
WritePerformance( 800 GB PM863 vs. 800 GB MLC SSD-B )
Write% QD1 QD2 QD4 QD8 QD16 QD32
25% +1% +9% +17% +21% +26% +37%
50% +16% +21% +25% +31% +44% +59%
75% +24% +27% +32% +49% +43% +41%
100% +51% +33% +34% +34% +33% +34%
Table5.4KBMixedRandomRead/WritePerformanceoftheMLCSSD-B
and the 800 GB PM863
Table 5 shows a higher performance for 800 GB PM863 than the 800 GB
MLC SSD-B in most of the 4 KB mixed patterns. When defining the margin of
measurement error as ±5%, we can see that the mixed performance of the
800 GB PM863 is higher than that of MLC SSD-B in most of the read/write
combinations, up to 59%. As shown above, it can be more efficient to choose
the V-NAND TLC-based 960 GB PM863 rather than the expensive MLC SSDs and
tailor the 960 GB PM863 according to the performance requirements.
11
The 960 GB PM863 shows superior read latency QoS of up to 47% and write latency of up 95%
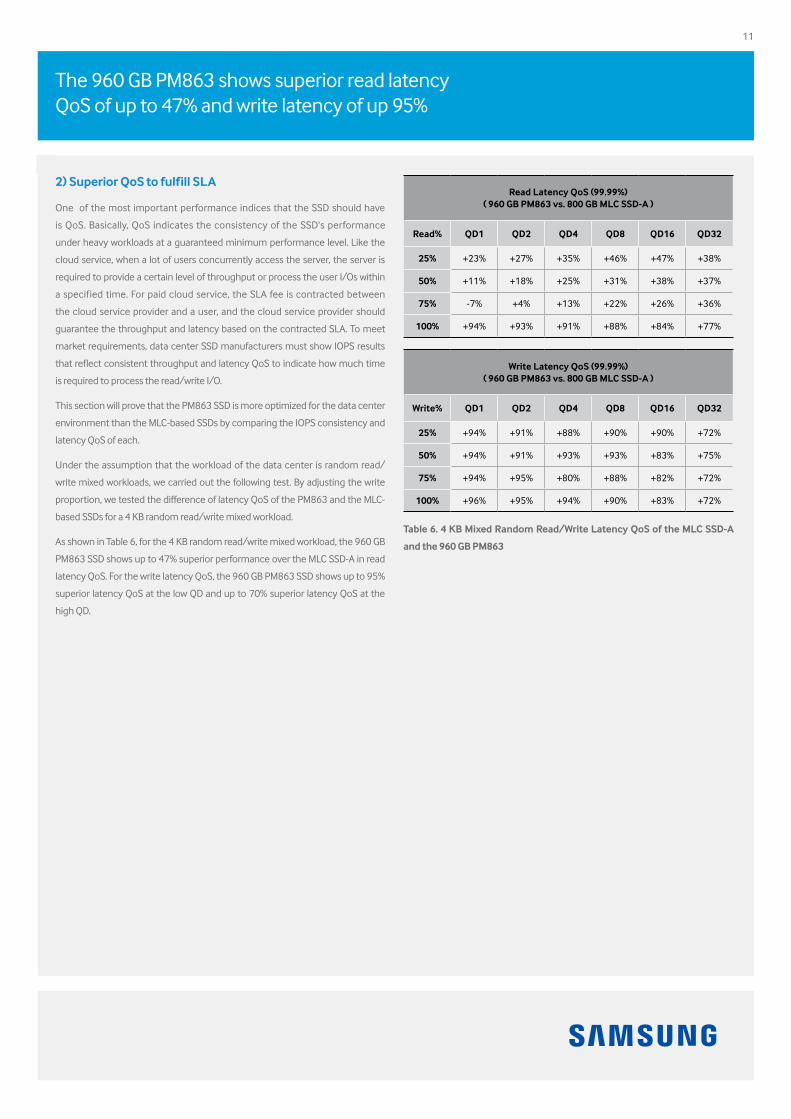
2) Superior QoS to fulfill SLA
One of the most important performance indices that the SSD should have
is QoS. Basically, QoS indicates the consistency of the SSD's performance
under heavy workloads at a guaranteed minimum performance level. Like the
cloud service, when a lot of users concurrently access the server, the server is
required to provide a certain level of throughput or process the user I/Os within
a specified time. For paid cloud service, the SLA fee is contracted between
the cloud service provider and a user, and the cloud service provider should
guarantee the throughput and latency based on the contracted SLA. To meet
market requirements, data center SSD manufacturers must show IOPS results
that reflect consistent throughput and latency QoS to indicate how much time
is required to process the read/write I/O.
This section will prove that the PM863 SSD is more optimized for the data center
environment than the MLC-based SSDs by comparing the IOPS consistency and
latency QoS of each.
Under the assumption that the workload of the data center is random read/
write mixed workloads, we carried out the following test. By adjusting the write
proportion, we tested the difference of latency QoS of the PM863 and the MLC-
based SSDs for a 4 KB random read/write mixed workload.
As shown in Table 6, for the 4 KB random read/write mixed workload, the 960 GB
PM863 SSD shows up to 47% superior performance over the MLC SSD-A in read
latency QoS. For the write latency QoS, the 960 GB PM863 SSD shows up to 95%
superior latency QoS at the low QD and up to 70% superior latency QoS at the
high QD.
ReadLatencyQoS(99.99%)( 960 GB PM863 vs. 800 GB MLC SSD-A )
Read% QD1 QD2 QD4 QD8 QD16 QD32
25% +23% +27% +35% +46% +47% +38%
50% +11% +18% +25% +31% +38% +37%
75% -7% +4% +13% +22% +26% +36%
100% +94% +93% +91% +88% +84% +77%
WriteLatencyQoS(99.99%)( 960 GB PM863 vs. 800 GB MLC SSD-A )
Write% QD1 QD2 QD4 QD8 QD16 QD32
25% +94% +91% +88% +90% +90% +72%
50% +94% +91% +93% +93% +83% +75%
75% +94% +95% +80% +88% +82% +72%
100% +96% +95% +94% +90% +83% +72%
Table6.4KBMixedRandomRead/WriteLatencyQoSoftheMLCSSD-A
and the 960 GB PM863
12
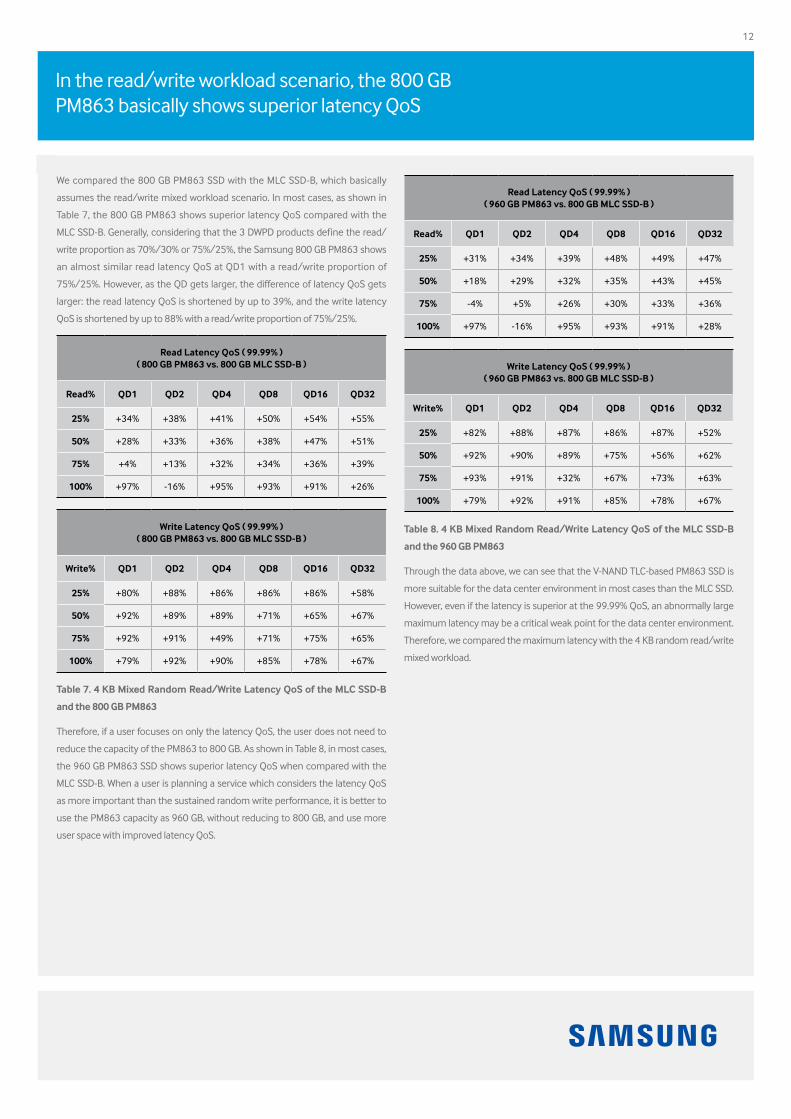
In the read/write workload scenario, the 800 GB PM863 basically shows superior latency QoS
We compared the 800 GB PM863 SSD with the MLC SSD-B, which basically
assumes the read/write mixed workload scenario. In most cases, as shown in
Table 7, the 800 GB PM863 shows superior latency QoS compared with the
MLC SSD-B. Generally, considering that the 3 DWPD products define the read/
write proportion as 70%/30% or 75%/25%, the Samsung 800 GB PM863 shows
an almost similar read latency QoS at QD1 with a read/write proportion of
75%/25%. However, as the QD gets larger, the difference of latency QoS gets
larger: the read latency QoS is shortened by up to 39%, and the write latency
QoS is shortened by up to 88% with a read/write proportion of 75%/25%.
ReadLatencyQoS(99.99%)( 800 GB PM863 vs. 800 GB MLC SSD-B )
Read% QD1 QD2 QD4 QD8 QD16 QD32
25% +34% +38% +41% +50% +54% +55%
50% +28% +33% +36% +38% +47% +51%
75% +4% +13% +32% +34% +36% +39%
100% +97% -16% +95% +93% +91% +26%
WriteLatencyQoS(99.99%)( 800 GB PM863 vs. 800 GB MLC SSD-B )
Write% QD1 QD2 QD4 QD8 QD16 QD32
25% +80% +88% +86% +86% +86% +58%
50% +92% +89% +89% +71% +65% +67%
75% +92% +91% +49% +71% +75% +65%
100% +79% +92% +90% +85% +78% +67%
Table7.4KBMixedRandomRead/WriteLatencyQoSoftheMLCSSD-B
and the 800 GB PM863
Therefore, if a user focuses on only the latency QoS, the user does not need to
reduce the capacity of the PM863 to 800 GB. As shown in Table 8, in most cases,
the 960 GB PM863 SSD shows superior latency QoS when compared with the
MLC SSD-B. When a user is planning a service which considers the latency QoS
as more important than the sustained random write performance, it is better to
use the PM863 capacity as 960 GB, without reducing to 800 GB, and use more
user space with improved latency QoS.
ReadLatencyQoS(99.99%)( 960 GB PM863 vs. 800 GB MLC SSD-B )
Read% QD1 QD2 QD4 QD8 QD16 QD32
25% +31% +34% +39% +48% +49% +47%
50% +18% +29% +32% +35% +43% +45%
75% -4% +5% +26% +30% +33% +36%
100% +97% -16% +95% +93% +91% +28%
WriteLatencyQoS(99.99%)( 960 GB PM863 vs. 800 GB MLC SSD-B )
Write% QD1 QD2 QD4 QD8 QD16 QD32
25% +82% +88% +87% +86% +87% +52%
50% +92% +90% +89% +75% +56% +62%
75% +93% +91% +32% +67% +73% +63%
100% +79% +92% +91% +85% +78% +67%
Table8.4KBMixedRandomRead/WriteLatencyQoSoftheMLCSSD-B
and the 960 GB PM863
Through the data above, we can see that the V-NAND TLC-based PM863 SSD is
more suitable for the data center environment in most cases than the MLC SSD.
However, even if the latency is superior at the 99.99% QoS, an abnormally large
maximum latency may be a critical weak point for the data center environment.
Therefore, we compared the maximum latency with the 4 KB random read/write
mixed workload.
13
Optimal maximum latency is achieved with an advanced error correction engine and fair resource allocation
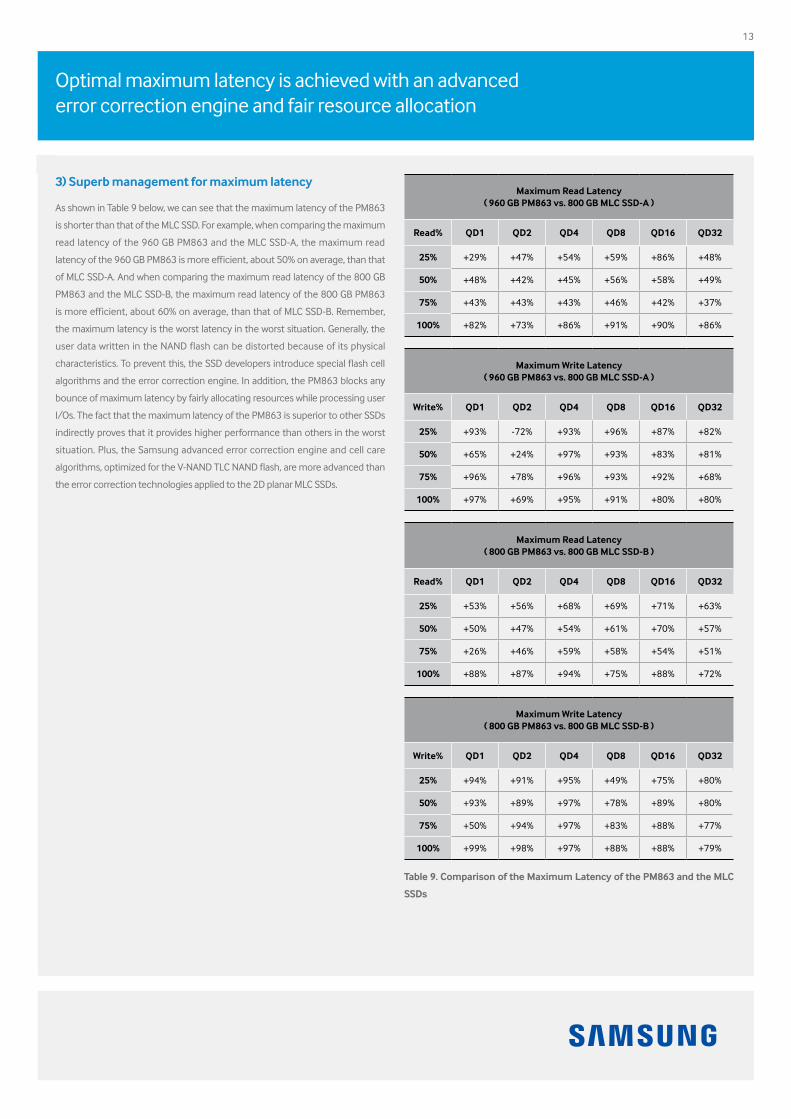
3) Superb management for maximum latency
As shown in Table 9 below, we can see that the maximum latency of the PM863
is shorter than that of the MLC SSD. For example, when comparing the maximum
read latency of the 960 GB PM863 and the MLC SSD-A, the maximum read
latency of the 960 GB PM863 is more efficient, about 50% on average, than that
of MLC SSD-A. And when comparing the maximum read latency of the 800 GB
PM863 and the MLC SSD-B, the maximum read latency of the 800 GB PM863
is more efficient, about 60% on average, than that of MLC SSD-B. Remember,
the maximum latency is the worst latency in the worst situation. Generally, the
user data written in the NAND flash can be distorted because of its physical
characteristics. To prevent this, the SSD developers introduce special flash cell
algorithms and the error correction engine. In addition, the PM863 blocks any
bounce of maximum latency by fairly allocating resources while processing user
I/Os. The fact that the maximum latency of the PM863 is superior to other SSDs
indirectly proves that it provides higher performance than others in the worst
situation. Plus, the Samsung advanced error correction engine and cell care
algorithms, optimized for the V-NAND TLC NAND flash, are more advanced than
the error correction technologies applied to the 2D planar MLC SSDs.
MaximumReadLatency( 960 GB PM863 vs. 800 GB MLC SSD-A )
Read% QD1 QD2 QD4 QD8 QD16 QD32
25% +29% +47% +54% +59% +86% +48%
50% +48% +42% +45% +56% +58% +49%
75% +43% +43% +43% +46% +42% +37%
100% +82% +73% +86% +91% +90% +86%
MaximumWriteLatency( 960 GB PM863 vs. 800 GB MLC SSD-A )
Write% QD1 QD2 QD4 QD8 QD16 QD32
25% +93% -72% +93% +96% +87% +82%
50% +65% +24% +97% +93% +83% +81%
75% +96% +78% +96% +93% +92% +68%
100% +97% +69% +95% +91% +80% +80%
MaximumReadLatency( 800 GB PM863 vs. 800 GB MLC SSD-B )
Read% QD1 QD2 QD4 QD8 QD16 QD32
25% +53% +56% +68% +69% +71% +63%
50% +50% +47% +54% +61% +70% +57%
75% +26% +46% +59% +58% +54% +51%
100% +88% +87% +94% +75% +88% +72%
MaximumWriteLatency( 800 GB PM863 vs. 800 GB MLC SSD-B )
Write% QD1 QD2 QD4 QD8 QD16 QD32
25% +94% +91% +95% +49% +75% +80%
50% +93% +89% +97% +78% +89% +80%
75% +50% +94% +97% +83% +88% +77%
100% +99% +98% +97% +88% +88% +79%
Table 9. Comparison of the Maximum Latency of the PM863 and the MLC
SSDs
14
The PM863 shows excellent IOPS consistency in the 100% random read/write condition
4) Solid mixed performance for stable IOPS consistency
In addition to the latency QoS, the IOPS consistency is an important
performance index in the data center environment. If the latency QoS indicates
how long it takes to process a specific read/write I/O, the IOPS consistency
indicates how consistently the SSD performance can be kept. Some SSDs shows
high peak performance, but have a large deviation in performance after the
SSDs are entered in the sustained state, so they are not suitable for the data
center environment. High IOPS consistency indicates that the SSD can provide
consistent and constant performance to users. For easy comparison, the IOPS
consistency for a 100% 4 KB random read workload and 100% 4 KB random
write workload are compared. We measured how long the SSD performance can
be kept under the pure 100% random read and 100% random write conditions,
not the mixed workload.
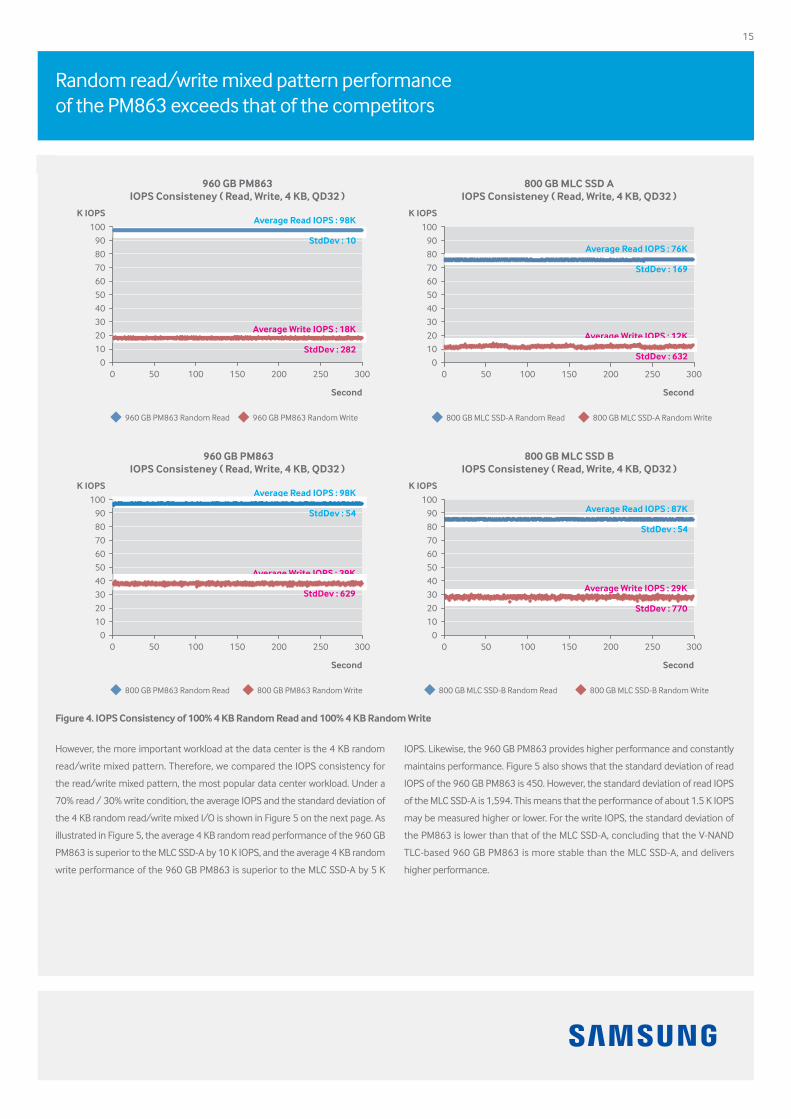
As shown in Figure 4 on the next page, under the 100% random read/write
condition, the 960 GB PM863, the 800 GB PM863, and the MLC SSD show
excellent IOPS consistency. For example, when comparing the 960 GB PM863
with the MLC SSD-A, the average 4 KB random read performance of the 960 GB
PM863 is 98 K IOPS and the standard deviation is 10. In other words, the 960 GB
PM863 processes the 4 KB random read request at the speed of 98 K IOPS, and
the deviation of 4 KB random read IOPS between high IOPS and low IOPS is just
10 IOPS. Under the same condition, the average 4 KB random read performance
of the MLC SSD-A is 76 K IOPS and the standard deviation is 632. For the 4 KB
random write workload, the performance of the 960 GB PM863 is on average
18 K IOPS and the standard deviation is 282, providing the higher performance
in a constant way. Finally, the 960 GB PM863 can provide higher random read
performance with lower deviation than the MLC SSD-A.
We measured the IOPS consistency of the MLC SSD-B, too. As shown in the
right graph of Figure 4, the 4 KB random read performance of the MLC SSD-B
is 87 K IOPS and its standard deviation is 54, and the 800 GB PM863 average
is 98 K IOPS. Therefore, the 800 GB PM863 can provide higher random read
performance than the competitor’s product. For the 4 KB random write, the
performance of the 800 GB PM863 averages 39 K IOPS, which is 34% higher
than the MLC SSD-B, and it can process random write constantly.
15
Random read/write mixed pattern performance of the PM863 exceeds that of the competitors
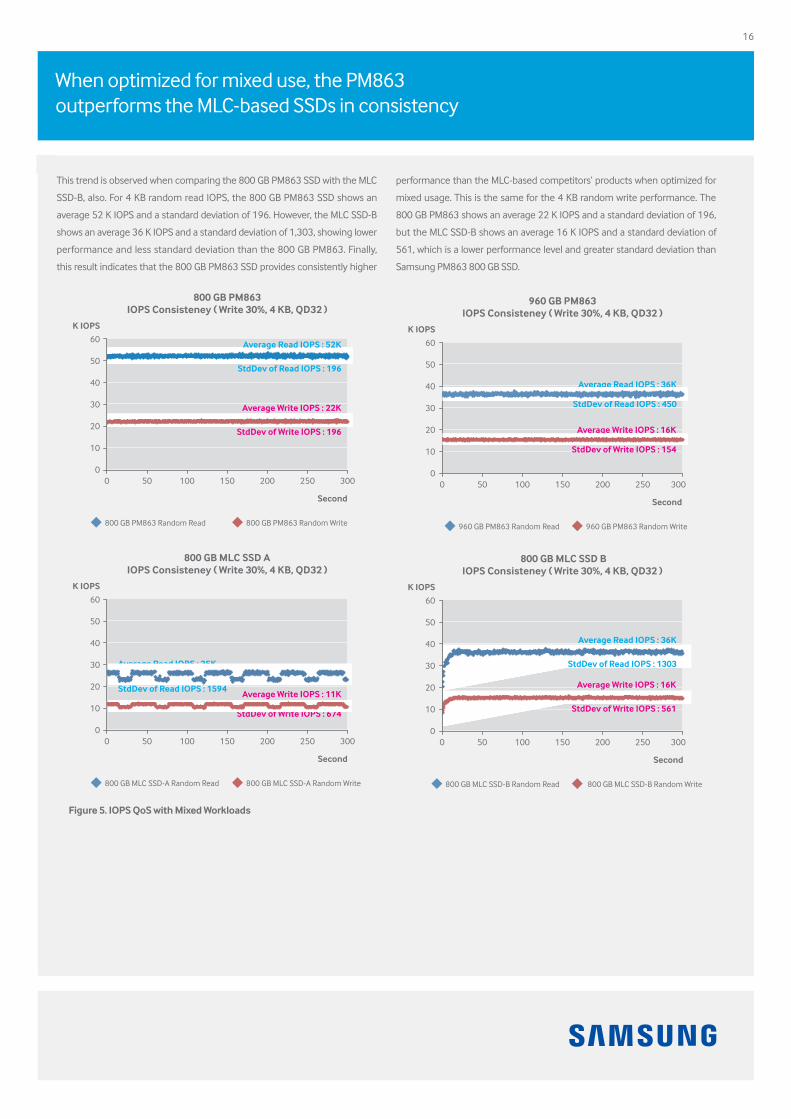
However, the more important workload at the data center is the 4 KB random
read/write mixed pattern. Therefore, we compared the IOPS consistency for
the read/write mixed pattern, the most popular data center workload. Under a
70% read / 30% write condition, the average IOPS and the standard deviation of
the 4 KB random read/write mixed I/O is shown in Figure 5 on the next page. As
illustrated in Figure 5, the average 4 KB random read performance of the 960 GB
PM863 is superior to the MLC SSD-A by 10 K IOPS, and the average 4 KB random
write performance of the 960 GB PM863 is superior to the MLC SSD-A by 5 K
IOPS. Likewise, the 960 GB PM863 provides higher performance and constantly
maintains performance. Figure 5 also shows that the standard deviation of read
IOPS of the 960 GB PM863 is 450. However, the standard deviation of read IOPS
of the MLC SSD-A is 1,594. This means that the performance of about 1.5 K IOPS
may be measured higher or lower. For the write IOPS, the standard deviation of
the PM863 is lower than that of the MLC SSD-A, concluding that the V-NAND
TLC-based 960 GB PM863 is more stable than the MLC SSD-A, and delivers
higher performance.
Figure4.IOPSConsistencyof100%4KBRandomReadand100%4KBRandomWrite
Average Read IOPS : 98K
StdDev : 10
K IOPS
Second
960 GB PM863IOPS Consisteney ( Read, Write, 4 KB, QD32 )
100
90
80
70
60
50
40
30
20
10
00 50 100 150 200 250 300
Average Write IOPS : 18K
StdDev : 282
960 GB PM863 Random Read 960 GB PM863 Random Write
Average Read IOPS : 98K
StdDev : 54
K IOPS
Second
960 GB PM863IOPS Consisteney ( Read, Write, 4 KB, QD32 )
100
90
80
70
60
50
40
30
20
10
00 50 100 150 200 250 300
Average Write IOPS : 39K
StdDev : 629
800 GB PM863 Random Read 800 GB PM863 Random Write 800 GB MLC SSD-B Random Read 800 GB MLC SSD-B Random Write
Average Read IOPS : 87K
StdDev : 54
K IOPS
Second
800 GB MLC SSD BIOPS Consisteney ( Read, Write, 4 KB, QD32 )
100
90
80
70
60
50
40
30
20
10
00 50 100 150 200 250 300
Average Write IOPS : 29K
StdDev : 770
800 GB MLC SSD-A Random Read 800 GB MLC SSD-A Random Write
Average Read IOPS : 76K
StdDev : 169
K IOPS
Second
800 GB MLC SSD AIOPS Consisteney ( Read, Write, 4 KB, QD32 )
100
90
80
70
60
50
40
30
20
10
00 50 100 150 200 250 300
Average Write IOPS : 12K
StdDev : 632
16
When optimized for mixed use, the PM863 outperforms the MLC-based SSDs in consistency
This trend is observed when comparing the 800 GB PM863 SSD with the MLC
SSD-B, also. For 4 KB random read IOPS, the 800 GB PM863 SSD shows an
average 52 K IOPS and a standard deviation of 196. However, the MLC SSD-B
shows an average 36 K IOPS and a standard deviation of 1,303, showing lower
performance and less standard deviation than the 800 GB PM863. Finally,
this result indicates that the 800 GB PM863 SSD provides consistently higher
performance than the MLC-based competitors’ products when optimized for
mixed usage. This is the same for the 4 KB random write performance. The
800 GB PM863 shows an average 22 K IOPS and a standard deviation of 196,
but the MLC SSD-B shows an average 16 K IOPS and a standard deviation of
561, which is a lower performance level and greater standard deviation than
Samsung PM863 800 GB SSD.
Figure5.IOPSQoSwithMixedWorkloads
Average Read IOPS : 25K
StdDev of Read IOPS : 1594
K IOPS
Second
800 GB MLC SSD AIOPS Consisteney ( Write 30%, 4 KB, QD32 )
60
50
40
30
20
10
00 50 100 150 200 250 300
Average Write IOPS : 11K
StdDev of Write IOPS : 674
800 GB MLC SSD-A Random Read 800 GB MLC SSD-A Random Write
60
50
40
30
20
10
00 50 100 150 200 250 300
Average Read IOPS : 36K
StdDev of Read IOPS : 450
K IOPS
Second
960 GB PM863IOPS Consisteney ( Write 30%, 4 KB, QD32 )
Average Write IOPS : 16K
StdDev of Write IOPS : 154
960 GB PM863 Random Read 960 GB PM863 Random Write
60
50
40
30
20
10
00 50 100 150 200 250 300
Average Read IOPS : 36K
StdDev of Read IOPS : 1303
K IOPS
Second
800 GB MLC SSD BIOPS Consisteney ( Write 30%, 4 KB, QD32 )
Average Write IOPS : 16K
StdDev of Write IOPS : 561
800 GB MLC SSD-B Random Read 800 GB MLC SSD-B Random Write
StdDev of Read IOPS : 196
K IOPS
Second
800 GB PM863IOPS Consisteney ( Write 30%, 4 KB, QD32 )
60
50
40
30
20
10
00 50 100 150 200 250 300
Average Write IOPS : 22K
StdDev of Write IOPS : 196
800 GB PM863 Random Read 800 GB PM863 Random Write
Average Read IOPS : 52K
17
The PM863 is designed to serve a constantly greater improved mixed workload performance
When comparing Figure 4 with Figure 5, an interesting fact can be observed.
Figure 4 represents the IOPS consistency for the pure 100% random read/
write. In Figure 4, the standard deviation of the 4 KB random read of the 960 GB
PM863 is 10 and 54 for the 800 GB PM863. But the value increases to 450 and
196 respectively at the mixed workload in Figure 5. In the mixed pattern, the
IOPS of the 960 GB PM863 is increased by 440 IOPS and the IOPS of the 800
GB PM863 is increased by 142 IOPS. In comparison, the standard deviation of
the MLC SSD-A in the mixed pattern is increased from 169 to 1,594, as much
as about 1.4 K IOPS, and that of the MLC SSD-B is increased from 54 to 1303,
as much as about 1.2 K IOPS. From this result, we can see that the PM863 SSD
is designed to serve a constantly greater improved performance for the mixed
workload than the competitors’ products.
Based on this result, we measured the IOPS consistency of the Samsung PM863
SSD and the MLC SSD when the write proportion is changed at the mixed
workload. Generally, the IOPS consistency is calculated using the following
formula:
IOPS Consistency = ( [ IOPS in the 99.9th percentile ] ÷ [ Average IOPS ] ) × 100*
By analyzing the above formula, we can see that the IOPS consistency value
gets larger when the IOPS in the 99.9th percentile is near the average IOPS. In
other words, even when there is a deviation in the IOPS, high IOPS consistency
indicates that the deviation is small and the performance is constant. Table
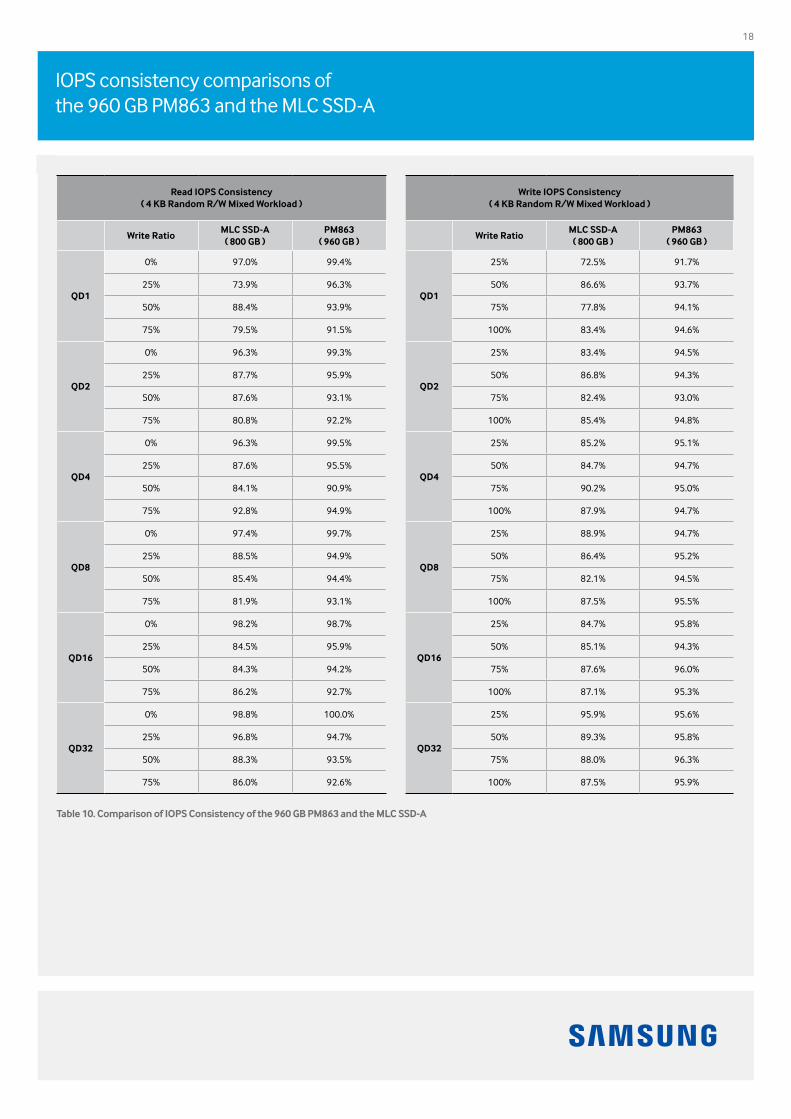
10, on the next page, shows the IOPS consistency of the 960 GB PM863
SSD and the MLC SSD-A. In a real data center environment, we assume the
4 KB random read/write mixed workload and calculate the read/write IOPS
consistency according to the write proportion. As shown in Table 10, the 960
GB PM863 shows more than a 90% IOPS consistency for both read and write.
However, under the write proportion of 25%, the MLC SSD-A shows a read IOPS
consistency of 73.9% and write IOPS consistency of 72.5%, indicating that the
MLC SSD-A is not suitable for a data center environment where consistent and
constant performance is essential. Finally, Samsung PM863 can provide the
performance of an average IOPS ± 10% to users consistently. However, the MLC
SSD-A can provide the performance of an average IOPS ± 28%. This means that
the 960 GB PM863 is the right choice for a data center environment.
* IOPS consistency in the 99.9th percentile is crucial for cloud data center
environments, such as Amazon Web Services™ (AWS).
See: https://aws.amazon.com/ebs/faqs/
18
IOPS consistency comparisons of the 960 GB PM863 and the MLC SSD-A
ReadIOPSConsistency(4KBRandomR/WMixedWorkload)
WriteRatioMLC SSD-A
( 800 GB )PM863
( 960 GB )
QD1
0% 97.0% 99.4%
25% 73.9% 96.3%
50% 88.4% 93.9%
75% 79.5% 91.5%
QD2
0% 96.3% 99.3%
25% 87.7% 95.9%
50% 87.6% 93.1%
75% 80.8% 92.2%
QD4
0% 96.3% 99.5%
25% 87.6% 95.5%
50% 84.1% 90.9%
75% 92.8% 94.9%
QD8
0% 97.4% 99.7%
25% 88.5% 94.9%
50% 85.4% 94.4%
75% 81.9% 93.1%
QD16
0% 98.2% 98.7%
25% 84.5% 95.9%
50% 84.3% 94.2%
75% 86.2% 92.7%
QD32
0% 98.8% 100.0%
25% 96.8% 94.7%
50% 88.3% 93.5%
75% 86.0% 92.6%
WriteIOPSConsistency(4KBRandomR/WMixedWorkload)
WriteRatioMLC SSD-A
( 800 GB )PM863
( 960 GB )
QD1
25% 72.5% 91.7%
50% 86.6% 93.7%
75% 77.8% 94.1%
100% 83.4% 94.6%
QD2
25% 83.4% 94.5%
50% 86.8% 94.3%
75% 82.4% 93.0%
100% 85.4% 94.8%
QD4
25% 85.2% 95.1%
50% 84.7% 94.7%
75% 90.2% 95.0%
100% 87.9% 94.7%
QD8
25% 88.9% 94.7%
50% 86.4% 95.2%
75% 82.1% 94.5%
100% 87.5% 95.5%
QD16
25% 84.7% 95.8%
50% 85.1% 94.3%
75% 87.6% 96.0%
100% 87.1% 95.3%
QD32
25% 95.9% 95.6%
50% 89.3% 95.8%
75% 88.0% 96.3%
100% 87.5% 95.9%
Table 10. Comparison of IOPS Consistency of the 960 GB PM863 and the MLC SSD-A
19
IOPS consistency comparisons of the 800 GB PM863 and the MLC SSD-B
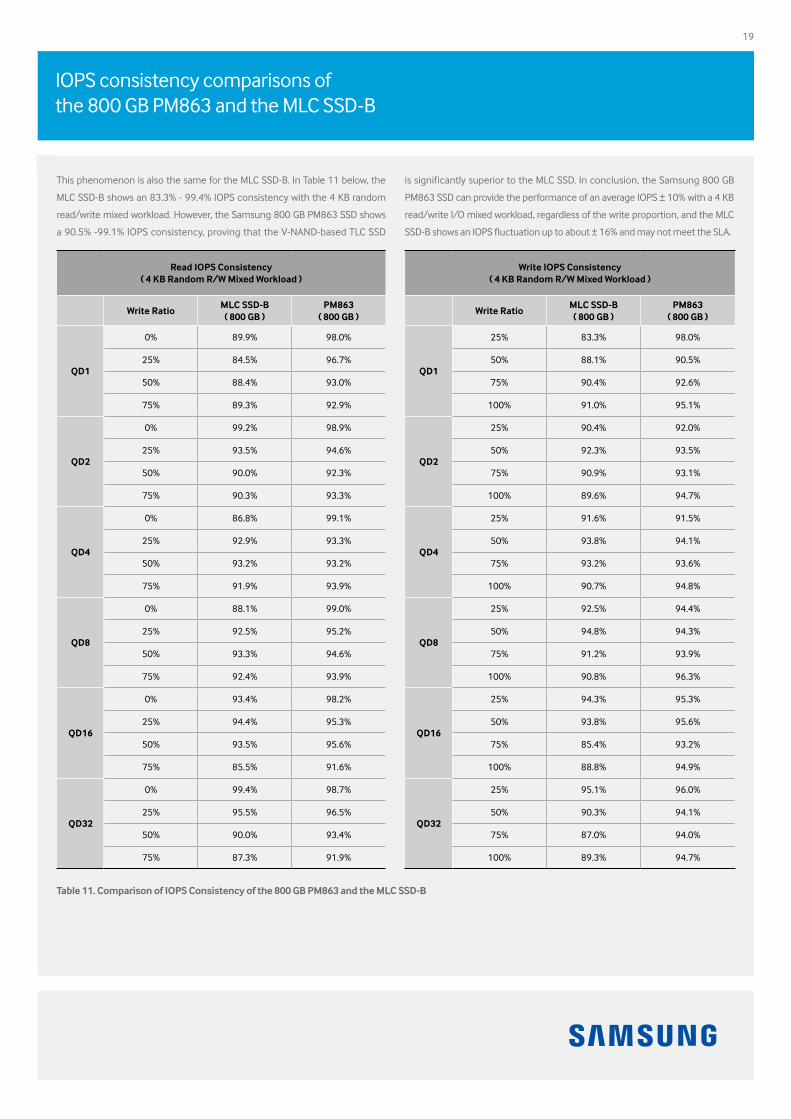
Table 11. Comparison of IOPS Consistency of the 800 GB PM863 and the MLC SSD-B
ReadIOPSConsistency(4KBRandomR/WMixedWorkload)
WriteRatioMLC SSD-B( 800 GB )
PM863 ( 800 GB )
QD1
0% 89.9% 98.0%
25% 84.5% 96.7%
50% 88.4% 93.0%
75% 89.3% 92.9%
QD2
0% 99.2% 98.9%
25% 93.5% 94.6%
50% 90.0% 92.3%
75% 90.3% 93.3%
QD4
0% 86.8% 99.1%
25% 92.9% 93.3%
50% 93.2% 93.2%
75% 91.9% 93.9%
QD8
0% 88.1% 99.0%
25% 92.5% 95.2%
50% 93.3% 94.6%
75% 92.4% 93.9%
QD16
0% 93.4% 98.2%
25% 94.4% 95.3%
50% 93.5% 95.6%
75% 85.5% 91.6%
QD32
0% 99.4% 98.7%
25% 95.5% 96.5%
50% 90.0% 93.4%
75% 87.3% 91.9%
WriteIOPSConsistency(4KBRandomR/WMixedWorkload)
WriteRatioMLC SSD-B( 800 GB )
PM863 ( 800 GB )
QD1
25% 83.3% 98.0%
50% 88.1% 90.5%
75% 90.4% 92.6%
100% 91.0% 95.1%
QD2
25% 90.4% 92.0%
50% 92.3% 93.5%
75% 90.9% 93.1%
100% 89.6% 94.7%
QD4
25% 91.6% 91.5%
50% 93.8% 94.1%
75% 93.2% 93.6%
100% 90.7% 94.8%
QD8
25% 92.5% 94.4%
50% 94.8% 94.3%
75% 91.2% 93.9%
100% 90.8% 96.3%
QD16
25% 94.3% 95.3%
50% 93.8% 95.6%
75% 85.4% 93.2%
100% 88.8% 94.9%
QD32
25% 95.1% 96.0%
50% 90.3% 94.1%
75% 87.0% 94.0%
100% 89.3% 94.7%
This phenomenon is also the same for the MLC SSD-B. In Table 11 below, the
MLC SSD-B shows an 83.3% - 99.4% IOPS consistency with the 4 KB random
read/write mixed workload. However, the Samsung 800 GB PM863 SSD shows
a 90.5% -99.1% IOPS consistency, proving that the V-NAND-based TLC SSD
is significantly superior to the MLC SSD. In conclusion, the Samsung 800 GB
PM863 SSD can provide the performance of an average IOPS ± 10% with a 4 KB
read/write I/O mixed workload, regardless of the write proportion, and the MLC
SSD-B shows an IOPS fluctuation up to about ± 16% and may not meet the SLA.
20
The 960 GB PM863 demonstrates a higher user capacity in SNS scenarios
8. User scenarios (UX Performance)
Discover the notable results of the PM863 when tested in user
scenarios
So far, we have reviewed that the V-NAND-based PM863 SSD can provide
superior performance, QoS and performance consistency with a mixed
workload. Now, we will check the PM863 performance in detailed data center
services by using a user scenario.
1) Social Network Services ( SNS )
The Aerospike Certification Tool (ACT) is an application that applies a huge
volume of I/O stress on the SSD and benchmarks how the SSD provides stable
latency without any fault. The purpose of the ACT is to determine whether a
specific SSD is suitable for real-time big data. For example, the ACT simulates
whether the SSD can process big data created by social network services
(SNS), such as Twitter® and Facebook® 24/7, 365 days a year without any
performance degradation.
The ACT tests the SSD for 24 hours. Based on the 24-hour benchmarking result,
the ACT Certificate can be given to the SSD only when the transactions over 1
msec are within 5% of the total transactions, transactions over 8 msec are within
1% of the total transactions, and transactions over 64 msec are within 0.1% of
the total transactions.
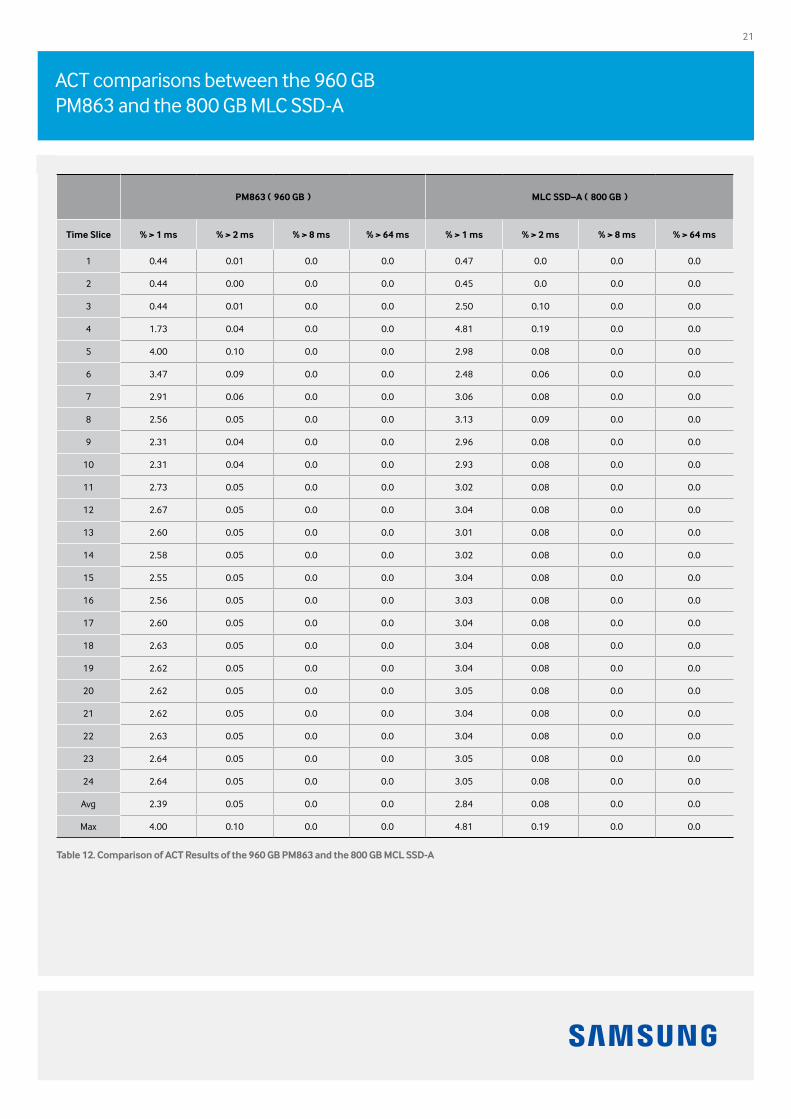
First, the test results of the MLC SSD-A and the 960 GB PM863, outlined in
Table 12 on the next page, show the proportions of transactions over 1 msec,
2 msec, 8 msec and 64 msec for 24 hours. For example, after 4 hours had
elapsed since the starting time of the test (Time Slice 4), the 960 GB PM863
showed the proportion of transactions over 1 msec, 2 msec, 8 msec and 64
msec to be 1.73%, 0.04%, 0% and 0%, respectively. On the other hand, the
results of the MLC SSD-A were 4.81%, 0.19%, 0.0% and 0.0%. As shown in Table
10, the performance was stabilized after 10 hours from the test start and the
latency has a certain constant ratio. When the 24-hour test was completed, the
proportions of transactions over 1 msec and 2 msec were 2.39% and 0.05%
on average. However, those of the MLC SSD-A were 2.84% and 0.08%, showing
lower performance than the 960 GB PM863. Of course, both the MLC SSD-A and
the 960 GB PM863 satisfied the ACT Certificate requirements. However, if the
MLC SSD-A provides a user capacity smaller than that of the 960 GB PM863, and
the performance is not so excellent, there is no need for users to purchase the
MLC SSD-A.
21
ACT comparisons between the 960 GB PM863 and the 800 GB MLC SSD-A
PM863 ( 960 GB ) MLC SSD–A ( 800 GB )
Time Slice %>1ms %>2ms %>8ms %>64ms %>1ms %>2ms %>8ms %>64ms
1 0.44 0.01 0.0 0.0 0.47 0.0 0.0 0.0
2 0.44 0.00 0.0 0.0 0.45 0.0 0.0 0.0
3 0.44 0.01 0.0 0.0 2.50 0.10 0.0 0.0
4 1.73 0.04 0.0 0.0 4.81 0.19 0.0 0.0
5 4.00 0.10 0.0 0.0 2.98 0.08 0.0 0.0
6 3.47 0.09 0.0 0.0 2.48 0.06 0.0 0.0
7 2.91 0.06 0.0 0.0 3.06 0.08 0.0 0.0
8 2.56 0.05 0.0 0.0 3.13 0.09 0.0 0.0
9 2.31 0.04 0.0 0.0 2.96 0.08 0.0 0.0
10 2.31 0.04 0.0 0.0 2.93 0.08 0.0 0.0
11 2.73 0.05 0.0 0.0 3.02 0.08 0.0 0.0
12 2.67 0.05 0.0 0.0 3.04 0.08 0.0 0.0
13 2.60 0.05 0.0 0.0 3.01 0.08 0.0 0.0
14 2.58 0.05 0.0 0.0 3.02 0.08 0.0 0.0
15 2.55 0.05 0.0 0.0 3.04 0.08 0.0 0.0
16 2.56 0.05 0.0 0.0 3.03 0.08 0.0 0.0
17 2.60 0.05 0.0 0.0 3.04 0.08 0.0 0.0
18 2.63 0.05 0.0 0.0 3.04 0.08 0.0 0.0
19 2.62 0.05 0.0 0.0 3.04 0.08 0.0 0.0
20 2.62 0.05 0.0 0.0 3.05 0.08 0.0 0.0
21 2.62 0.05 0.0 0.0 3.04 0.08 0.0 0.0
22 2.63 0.05 0.0 0.0 3.04 0.08 0.0 0.0
23 2.64 0.05 0.0 0.0 3.05 0.08 0.0 0.0
24 2.64 0.05 0.0 0.0 3.05 0.08 0.0 0.0
Avg 2.39 0.05 0.0 0.0 2.84 0.08 0.0 0.0
Max 4.00 0.10 0.0 0.0 4.81 0.19 0.0 0.0
Table12.ComparisonofACTResultsofthe960GBPM863andthe800GBMCLSSD-A
22
The ACT results prove the PM863 provides superior performance under I/O stress for extended periods
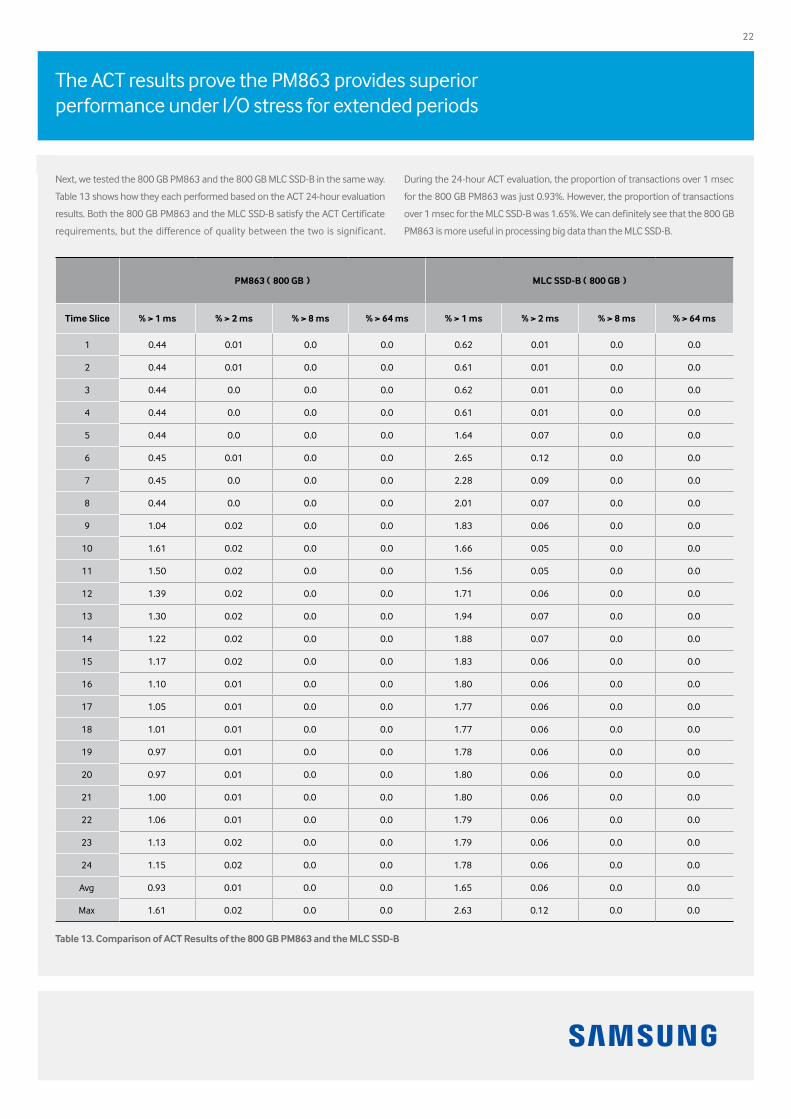
Next, we tested the 800 GB PM863 and the 800 GB MLC SSD-B in the same way.
Table 13 shows how they each performed based on the ACT 24-hour evaluation
results. Both the 800 GB PM863 and the MLC SSD-B satisfy the ACT Certificate
requirements, but the difference of quality between the two is significant.
During the 24-hour ACT evaluation, the proportion of transactions over 1 msec
for the 800 GB PM863 was just 0.93%. However, the proportion of transactions
over 1 msec for the MLC SSD-B was 1.65%. We can definitely see that the 800 GB
PM863 is more useful in processing big data than the MLC SSD-B.
Table13.ComparisonofACTResultsofthe800GBPM863andtheMLCSSD-B
PM863 ( 800 GB ) MLC SSD-B ( 800 GB )
Time Slice %>1ms %>2ms %>8ms %>64ms %>1ms %>2ms %>8ms %>64ms
1 0.44 0.01 0.0 0.0 0.62 0.01 0.0 0.0
2 0.44 0.01 0.0 0.0 0.61 0.01 0.0 0.0
3 0.44 0.0 0.0 0.0 0.62 0.01 0.0 0.0
4 0.44 0.0 0.0 0.0 0.61 0.01 0.0 0.0
5 0.44 0.0 0.0 0.0 1.64 0.07 0.0 0.0
6 0.45 0.01 0.0 0.0 2.65 0.12 0.0 0.0
7 0.45 0.0 0.0 0.0 2.28 0.09 0.0 0.0
8 0.44 0.0 0.0 0.0 2.01 0.07 0.0 0.0
9 1.04 0.02 0.0 0.0 1.83 0.06 0.0 0.0
10 1.61 0.02 0.0 0.0 1.66 0.05 0.0 0.0
11 1.50 0.02 0.0 0.0 1.56 0.05 0.0 0.0
12 1.39 0.02 0.0 0.0 1.71 0.06 0.0 0.0
13 1.30 0.02 0.0 0.0 1.94 0.07 0.0 0.0
14 1.22 0.02 0.0 0.0 1.88 0.07 0.0 0.0
15 1.17 0.02 0.0 0.0 1.83 0.06 0.0 0.0
16 1.10 0.01 0.0 0.0 1.80 0.06 0.0 0.0
17 1.05 0.01 0.0 0.0 1.77 0.06 0.0 0.0
18 1.01 0.01 0.0 0.0 1.77 0.06 0.0 0.0
19 0.97 0.01 0.0 0.0 1.78 0.06 0.0 0.0
20 0.97 0.01 0.0 0.0 1.80 0.06 0.0 0.0
21 1.00 0.01 0.0 0.0 1.80 0.06 0.0 0.0
22 1.06 0.01 0.0 0.0 1.79 0.06 0.0 0.0
23 1.13 0.02 0.0 0.0 1.79 0.06 0.0 0.0
24 1.15 0.02 0.0 0.0 1.78 0.06 0.0 0.0
Avg 0.93 0.01 0.0 0.0 1.65 0.06 0.0 0.0
Max 1.61 0.02 0.0 0.0 2.63 0.12 0.0 0.0
23
In a message service scenario, the PM863 shows superior message synchronization
Figure 6. Performance for Messenger Service ( 960 GB PM863 vs. 800 GB MLC SSD-A )
The ACT benchmark results prove that the V-NAND TLC-based PM863 SSD
provides superior performance over the 2D planar MLC SSD under I/O stress
for an extended period of time, and that the V-NAND TLC-based PM863 SSD is
more suitable for processing big data in real time.
2) Messenger service
As the use of smartphones has grown over time, mobile messenger services,
such as Kakao Talk® and LINE, have recently become widespread. As a result,
to successfully provide these messenger services, expansion of servers and
the development of an SSD that meets the needs of these services becomes
urgent. In most cases with mobile messengers, we can see that so many users
create group chat rooms and several users exchange texts, photos and videos
in the group chat room, rather than using 1:1 chat rooms. In short, one user
sends text messages or photos and the other users read the messages and
view the photos. This means that, when one write request occurs (when one
text message or photo is uploaded), the content is uploaded (written) on the
messenger server and then sent to dozens of users in the group chat room,
creating dozens of read requests.
Based on this service model, we mixed one 512 KB random write thread
(representing the user uploading photos or video clips) and 20 random read
threads of 4 KB each (representing the users that read the text message and
view the photos or video clips) for the test. We assumed that messages were
sent and received within a certain time gap when the messenger service users
start chatting, and set the restriction on the write throughput to provide only 32
random writes of 512 KB each per second.
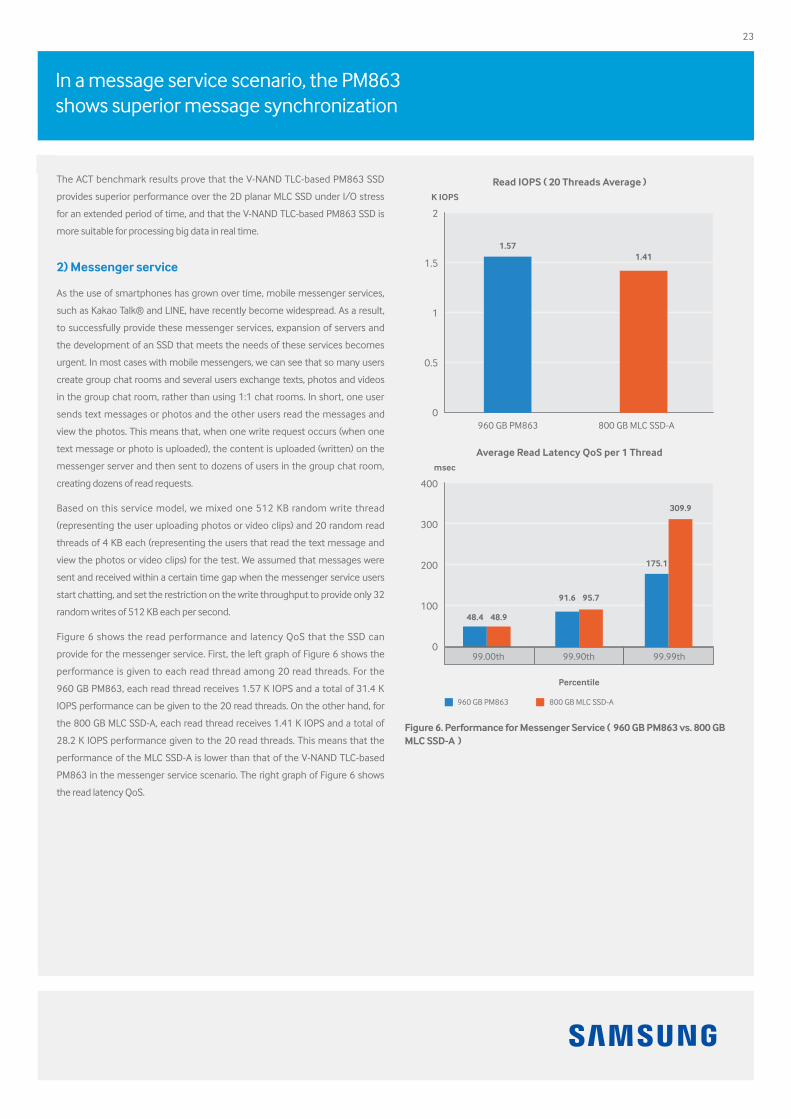
Figure 6 shows the read performance and latency QoS that the SSD can
provide for the messenger service. First, the left graph of Figure 6 shows the
performance is given to each read thread among 20 read threads. For the
960 GB PM863, each read thread receives 1.57 K IOPS and a total of 31.4 K
IOPS performance can be given to the 20 read threads. On the other hand, for
the 800 GB MLC SSD-A, each read thread receives 1.41 K IOPS and a total of
28.2 K IOPS performance given to the 20 read threads. This means that the
performance of the MLC SSD-A is lower than that of the V-NAND TLC-based
PM863 in the messenger service scenario. The right graph of Figure 6 shows
the read latency QoS.
2
K IOPS
1.57
960 GB PM863
Read IOPS ( 20 Threads Average )
1.5
1
0.5
0
1.41
800 GB MLC SSD-A
400
msec
Average Read Latency QoS per 1 Thread
300
200
100
0
Percentile
99.00th 99.90th 99.99th
48.4 48.9
91.6
175.1
309.9
95.7
960 GB PM863 800 GB MLC SSD-A
24
Based on a web server workload, the PM863 provides an absolutely higher performance level
The graph was created by calculating the QoS data of each read thread and then
averaging the latencies of the percentile. For example, QoS 99.99% indicates the
average read latencies of read threads, which corresponds to QoS 99.99%. As
shown in the right graph of Figure 6, the average latency of QoS 99.99% of the
960 GB PM863 is 175.1 msec, but for the 800GB MLC SSD-A it is 309.9 msec.
This value is the read latency that one read thread feels. In short, a large read
latency QoS indicates that it may be difficult to share the same data with other
users at exactly the same time. For the 960 GB PM863, the text message or
photo uploaded by a user can be shared with 20 users (20 read threads) within
175.1 msec at QoS 99.99%. But for the MLC SSD-A, the text message or photo
uploaded by a user can be shared with 20 users (20 read threads) within 309.9
msec, indicating that message synchronization may be difficult.
3) Application to the web, file, exchange and database
servers
Now, we will test how superior the V-NAND TLC-based PM863 SSD is in the web,
file, exchange and database server environments compared with the MLC-based
SSDs.
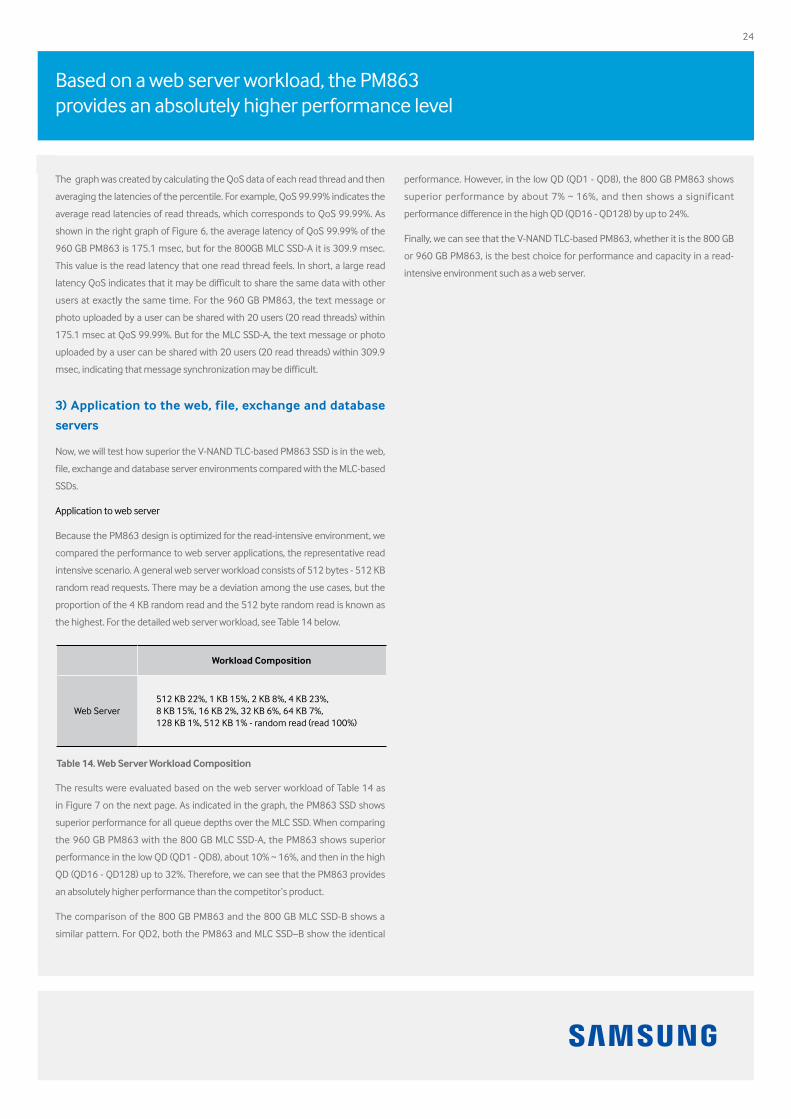
Application to web server
Because the PM863 design is optimized for the read-intensive environment, we
compared the performance to web server applications, the representative read
intensive scenario. A general web server workload consists of 512 bytes - 512 KB
random read requests. There may be a deviation among the use cases, but the
proportion of the 4 KB random read and the 512 byte random read is known as
the highest. For the detailed web server workload, see Table 14 below.
WorkloadComposition
Web Server512 KB 22%, 1 KB 15%, 2 KB 8%, 4 KB 23%, 8 KB 15%, 16 KB 2%, 32 KB 6%, 64 KB 7%, 128 KB 1%, 512 KB 1% - random read (read 100%)
Table14.WebServerWorkloadComposition
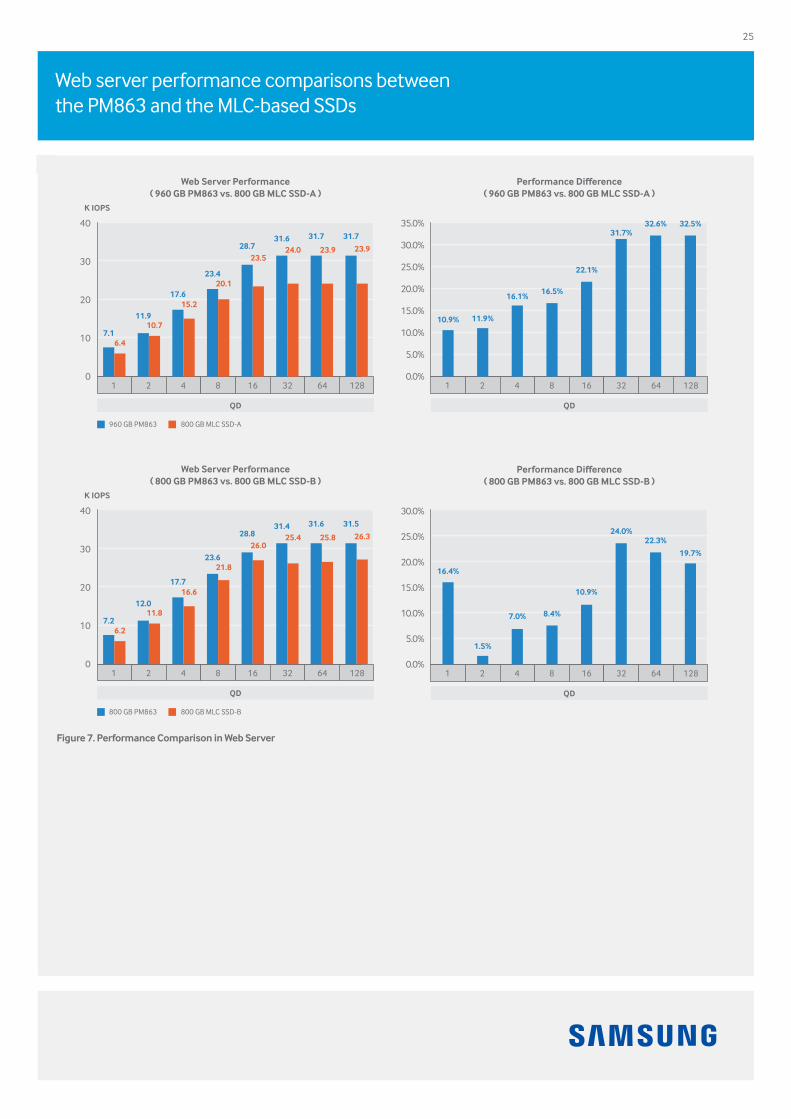
performance. However, in the low QD (QD1 - QD8), the 800 GB PM863 shows
superior performance by about 7% ~ 16%, and then shows a significant
performance difference in the high QD (QD16 - QD128) by up to 24%.
Finally, we can see that the V-NAND TLC-based PM863, whether it is the 800 GB
or 960 GB PM863, is the best choice for performance and capacity in a read-
intensive environment such as a web server.
The results were evaluated based on the web server workload of Table 14 as
in Figure 7 on the next page. As indicated in the graph, the PM863 SSD shows
superior performance for all queue depths over the MLC SSD. When comparing
the 960 GB PM863 with the 800 GB MLC SSD-A, the PM863 shows superior
performance in the low QD (QD1 - QD8), about 10% ~ 16%, and then in the high
QD (QD16 - QD128) up to 32%. Therefore, we can see that the PM863 provides
an absolutely higher performance than the competitor’s product.
The comparison of the 800 GB PM863 and the 800 GB MLC SSD-B shows a
similar pattern. For QD2, both the PM863 and MLC SSD–B show the identical
25
Web server performance comparisons between the PM863 and the MLC-based SSDs
Figure7.PerformanceComparisoninWebServer
40
K IOPS
Web Server Performance( 960 GB PM863 vs. 800 GB MLC SSD-A )
30
20
10
0
QD
1 2 4 8 16 32 64 128
7.16.4
11.910.7
17.615.2
23.420.1
28.723.5
31.624.0
31.7
23.9
31.7
23.9
960 GB PM863 800 GB MLC SSD-A
35.0%
25.0%
30.0%
Performance Difference( 960 GB PM863 vs. 800 GB MLC SSD-A )
20.0%
10.0%
15.0%
5.0%
0.0%
QD
1 2 4 8 16 32 64 128
10.9% 11.9%
16.1%16.5%
22.1%
31.7%32.6% 32.5%
30.0%
Performance Difference( 800 GB PM863 vs. 800 GB MLC SSD-B )
20.0%
25.0%
10.0%
15.0%
5.0%
0.0%
QD
1 2 4 8 16 32 64 128
16.4%
1.5%
7.0% 8.4%
10.9%
24.0%22.3%
19.7%
40
K IOPS
Web Server Performance( 800 GB PM863 vs. 800 GB MLC SSD-B )
30
20
10
0
QD
1 2 4 8 16 32 64 128
7.26.2
12.011.8
17.716.6
23.621.8
28.826.0
31.425.4
31.6
25.8
31.5
26.3
800 GB PM863 800 GB MLC SSD-B
26
In a read-intensive file server scenario, the PM863 shows up to 30% higher performance
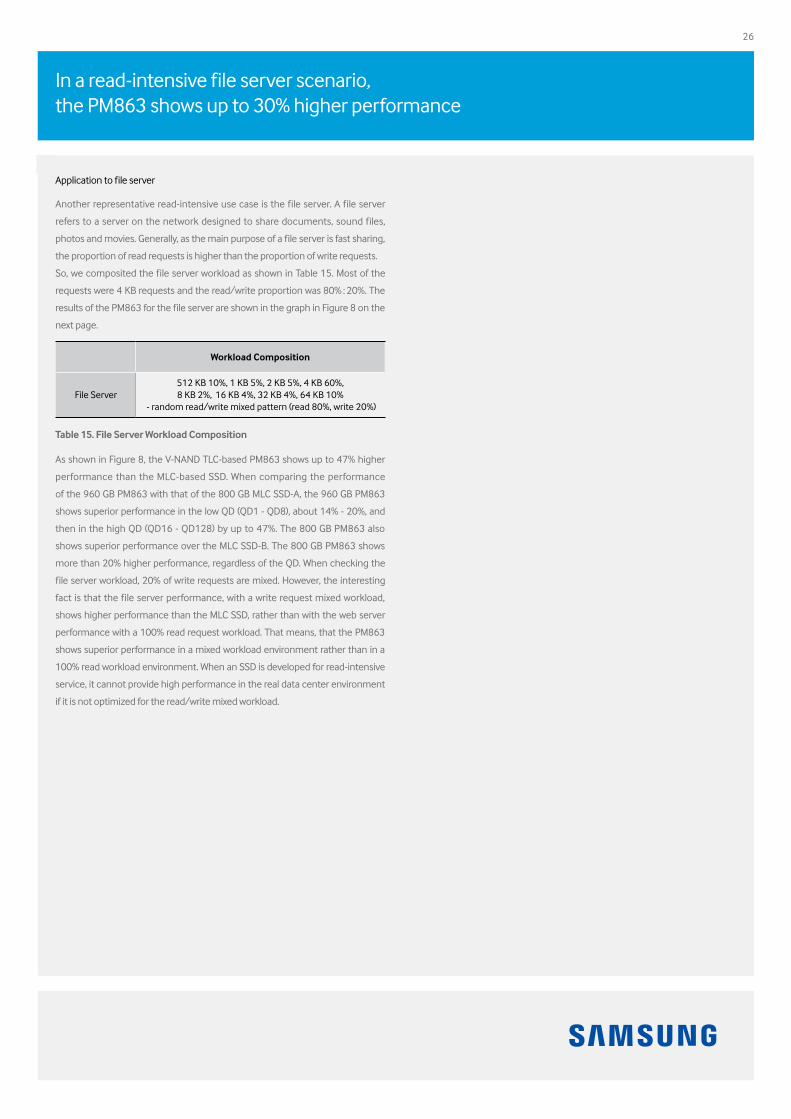
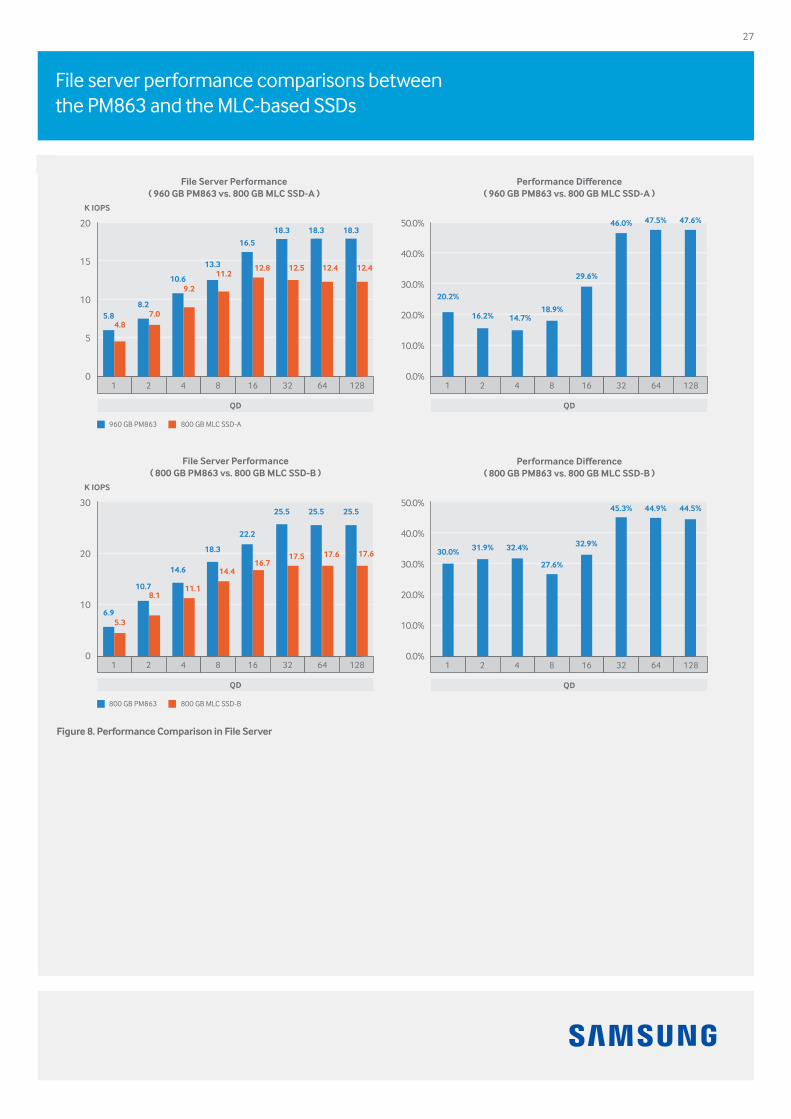
Application to file server
Another representative read-intensive use case is the file server. A file server
refers to a server on the network designed to share documents, sound files,
photos and movies. Generally, as the main purpose of a file server is fast sharing,
the proportion of read requests is higher than the proportion of write requests.
So, we composited the file server workload as shown in Table 15. Most of the
requests were 4 KB requests and the read/write proportion was 80% : 20%. The
results of the PM863 for the file server are shown in the graph in Figure 8 on the
next page.
As shown in Figure 8, the V-NAND TLC-based PM863 shows up to 47% higher
performance than the MLC-based SSD. When comparing the performance
of the 960 GB PM863 with that of the 800 GB MLC SSD-A, the 960 GB PM863
shows superior performance in the low QD (QD1 - QD8), about 14% - 20%, and
then in the high QD (QD16 - QD128) by up to 47%. The 800 GB PM863 also
shows superior performance over the MLC SSD-B. The 800 GB PM863 shows
more than 20% higher performance, regardless of the QD. When checking the
file server workload, 20% of write requests are mixed. However, the interesting
fact is that the file server performance, with a write request mixed workload,
shows higher performance than the MLC SSD, rather than with the web server
performance with a 100% read request workload. That means, that the PM863
shows superior performance in a mixed workload environment rather than in a
100% read workload environment. When an SSD is developed for read-intensive
service, it cannot provide high performance in the real data center environment
if it is not optimized for the read/write mixed workload.
WorkloadComposition
File Server512 KB 10%, 1 KB 5%, 2 KB 5%, 4 KB 60%, 8 KB 2%, 16 KB 4%, 32 KB 4%, 64 KB 10%
- random read/write mixed pattern (read 80%, write 20%)
Table15.FileServerWorkloadComposition
27
File server performance comparisons between the PM863 and the MLC-based SSDs
Figure 8. Performance Comparison in File Server
20
K IOPS
File Server Performance( 960 GB PM863 vs. 800 GB MLC SSD-A )
15
10
5
0
QD
1 2 4 8 16 32 64 128
5.84.8
8.27.0
10.69.2
13.311.2
16.5
12.8
18.3
12.5
18.3
12.4
18.3
12.4
960 GB PM863 800 GB MLC SSD-A
50.0%
40.0%
Performance Difference( 960 GB PM863 vs. 800 GB MLC SSD-A )
20.0%
30.0%
10.0%
0.0%
QD
1 2 4 8 16 32 64 128
20.2%
16.2% 14.7%18.9%
29.6%
46.0% 47.5% 47.6%
50.0%
40.0%
Performance Difference( 800 GB PM863 vs. 800 GB MLC SSD-B )
20.0%
30.0%
10.0%
0.0%
QD
1 2 4 8 16 32 64 128
30.0% 31.9% 32.4%
27.6%
32.9%
45.3% 44.9% 44.5%30
K IOPS
File Server Performance( 800 GB PM863 vs. 800 GB MLC SSD-B )
20
10
0
QD
1 2 4 8 16 32 64 128
6.95.3
10.78.1
14.6
11.1
18.3
14.4
22.2
16.7
25.5
17.5
25.5
17.6
25.5
17.6
800 GB PM863 800 GB MLC SSD-B
28
The PM863 shows improved performance over the MLC SSDs in an exchange server environment
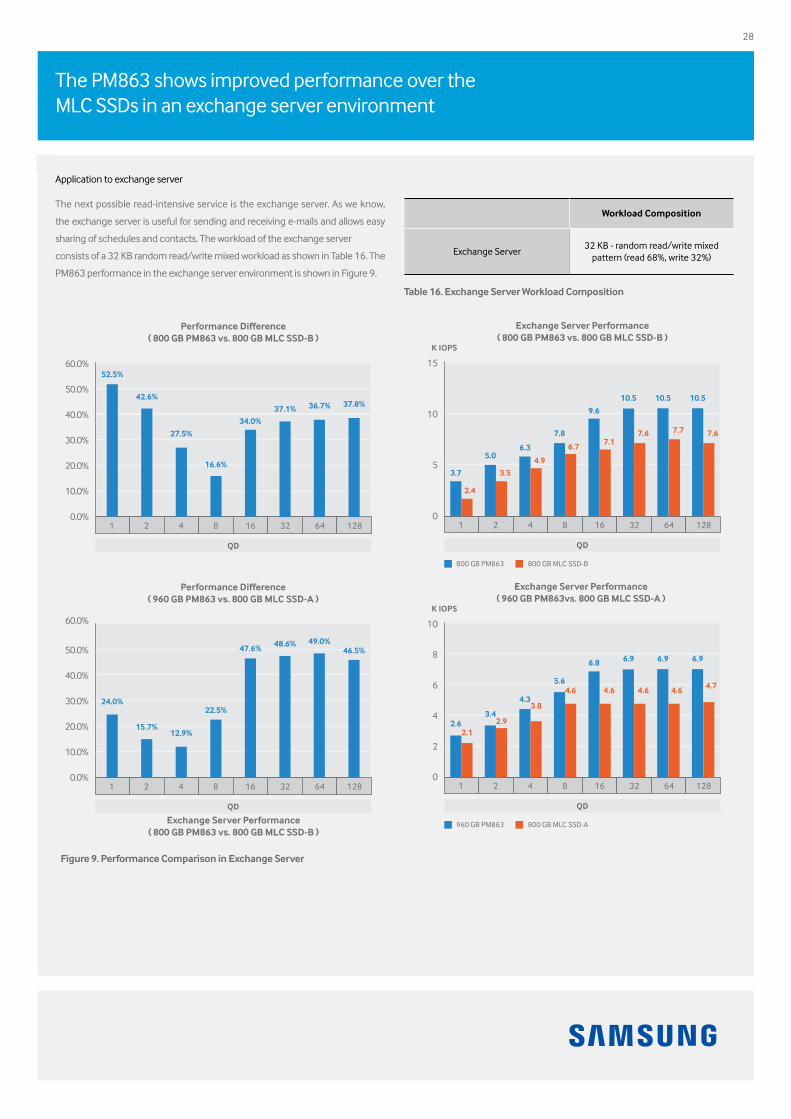
Application to exchange server
The next possible read-intensive service is the exchange server. As we know,
the exchange server is useful for sending and receiving e-mails and allows easy
sharing of schedules and contacts. The workload of the exchange server
consists of a 32 KB random read/write mixed workload as shown in Table 16. The
PM863 performance in the exchange server environment is shown in Figure 9.
WorkloadComposition
Exchange Server32 KB - random read/write mixed
pattern (read 68%, write 32%)
Table16.ExchangeServerWorkloadComposition
Figure 9. Performance Comparison in Exchange Server
10
K IOPS
Exchange Server Performance( 960 GB PM863vs. 800 GB MLC SSD-A )
6
8
4
2
0
QD
1 2 4 8 16 32 64 128
2.62.1
3.42.9
4.33.8
5.64.6
6.8
4.6
6.9
4.6
6.9
4.6
6.9
4.7
960 GB PM863 800 GB MLC SSD-A
60.0%
50.0%
Performance Difference( 960 GB PM863 vs. 800 GB MLC SSD-A )
20.0%
40.0%
30.0%
10.0%
0.0%
QD
1 2 4 8 16 32 64 128
24.0%
15.7%12.9%
22.5%
47.6% 48.6% 49.0%46.5%
60.0%
50.0%
Performance Difference( 800 GB PM863 vs. 800 GB MLC SSD-B )
20.0%
40.0%
30.0%
10.0%
0.0%
QD
1 2 4 8 16 32 64 128
52.5%
42.6%
27.5%
16.6%
34.0%37.1% 36.7% 37.8%
15
K IOPS
Exchange Server Performance( 800 GB PM863 vs. 800 GB MLC SSD-B )
10
5
0
QD
1 2 4 8 16 32 64 128
3.7
2.4
5.0
3.5
6.3
4.9
7.8
6.7
9.6
7.1
10.5
7.6
10.5
7.7
10.5
7.6
800 GB PM863 800 GB MLC SSD-B
10
K IOPS
Exchange Server Performance( 960 GB PM863vs. 800 GB MLC SSD-A )
6
8
4
2
0
QD
1 2 4 8 16 32 64 128
2.62.1
3.42.9
4.33.8
5.64.6
6.8
4.6
6.9
4.6
6.9
4.6
6.9
4.7
960 GB PM863 800 GB MLC SSD-A
60.0%
50.0%
Performance Difference( 960 GB PM863 vs. 800 GB MLC SSD-A )
20.0%
40.0%
30.0%
10.0%
0.0%
QD
1 2 4 8 16 32 64 128
24.0%
15.7%12.9%
22.5%
47.6% 48.6% 49.0%46.5%
60.0%
50.0%
Performance Difference( 800 GB PM863 vs. 800 GB MLC SSD-B )
20.0%
40.0%
30.0%
10.0%
0.0%
QD
1 2 4 8 16 32 64 128
52.5%
42.6%
27.5%
16.6%
34.0%37.1% 36.7% 37.8%
15
K IOPS
Exchange Server Performance( 800 GB PM863 vs. 800 GB MLC SSD-B )
10
5
0
QD
1 2 4 8 16 32 64 128
3.7
2.4
5.0
3.5
6.3
4.9
7.8
6.7
9.6
7.1
10.5
7.6
10.5
7.7
10.5
7.6
800 GB PM863 800 GB MLC SSD-B
29
In a database server scenario, the PM863 provesits differential performance competitiveness
As shown in Figure 9, the 960 GB PM863 shows a minimum of 12% and a
maximum of 49% improved performance compared to the 800 GB MLC SSD-A.
The 800 GB PM863 also shows a minimum of 16% and a maximum of 52%
improved performance compared to the 800 GB MLC SSD-B.
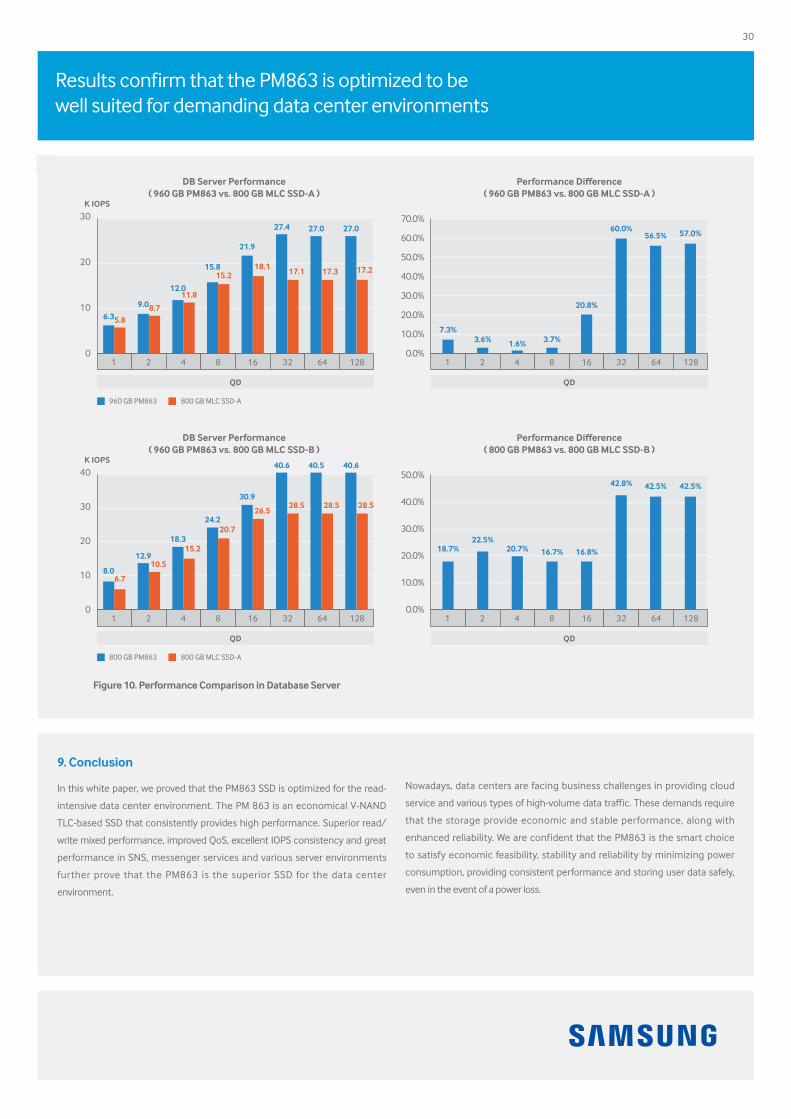
Application to database server
A database server is also classified as a read-intensive service scenario except
for the delete transaction. Therefore, the read performance of an SSD is an
essential factor to improve the database server performance. For example, in
regard to the update transaction, which is common in the database, it simply
reads, modifies and rewrites the existing data. Therefore, when analyzing the
composition of the total workload, the proportion of read requests is higher
than that of the write requests. Table 17 shows the composition of the workload
in a database server.
WorkloadComposition
Database Server8 KB – random read/write mixed pattern
( read 67%, write 33% )
Table17.DatabaseServerWorkloadComposition
Figure 10 shows the performance difference in the database server between the
PM863 and the MLC SSD. When comparing the 960 GB PM863 with the 800 GB
MLC SSD-A, the 960 GB PM863 SSD shows 60% higher performance in QD32.
In the low QD, the performance difference between the 960 GB PM863 and the
800 GB MLC SSD-A is very slight. However, when the workload is intensive and
the QD increases, the 960 GB PM863 shows an improved performance of 20% in
minimum and over 60% in maximum, proving that the PM863 is the best choice
for a database environment.
When comparing the 800 GB PM863 with the 800 GB MLC SSD-B, the result
shows that the 800 GB PM863 is the best choice. The 800 GB PM863 SSD shows
a minimum of 16% higher performance in the low QD (QD1 - QD8) than the
800 GB MLC SSD-B. Plus, the 800 GB PM863 SSD shows about a 42% higher
performance in QD32 or the higher QD, proving its differential performance
competitiveness.
30
Results confirm that the PM863 is optimized to be well suited for demanding data center environments
Figure 10. Performance Comparison in Database Server
9. Conclusion
In this white paper, we proved that the PM863 SSD is optimized for the read-
intensive data center environment. The PM 863 is an economical V-NAND
TLC-based SSD that consistently provides high performance. Superior read/
write mixed performance, improved QoS, excellent IOPS consistency and great
performance in SNS, messenger services and various server environments
further prove that the PM863 is the superior SSD for the data center
environment.
Nowadays, data centers are facing business challenges in providing cloud
service and various types of high-volume data traffic. These demands require
that the storage provide economic and stable performance, along with
enhanced reliability. We are confident that the PM863 is the smart choice
to satisfy economic feasibility, stability and reliability by minimizing power
consumption, providing consistent performance and storing user data safely,
even in the event of a power loss.
30K IOPS
DB Server Performance( 960 GB PM863 vs. 800 GB MLC SSD-A )
20
10
0
QD
1 2 4 8 16 32 64 128
6.35.8
9.08.7
12.011.8
15.815.2
21.9
18.1
27.4
17.1
27.0
17.3
27.0
17.2
960 GB PM863 800 GB MLC SSD-A
70.0%
60.0%
Performance Difference( 960 GB PM863 vs. 800 GB MLC SSD-A )
30.0%
20.0%
50.0%
40.0%
10.0%
0.0%
QD
1 2 4 8 16 32 64 128
7.3%3.6% 1.6% 3.7%
20.8%
60.0%56.5% 57.0%
40K IOPS
DB Server Performance( 960 GB PM863 vs. 800 GB MLC SSD-B )
20
30
10
0
QD
1 2 4 8 16 32 64 128
8.06.7
12.910.5
18.315.2
24.220.7
30.9
26.5
40.6
28.5
40.5
28.5
40.6
28.5
800 GB PM863 800 GB MLC SSD-A
50.0%
40.0%
Performance Difference( 800 GB PM863 vs. 800 GB MLC SSD-B )
20.0%
30.0%
10.0%
0.0%
QD
1 2 4 8 16 32 64 128
18.7%22.5%
20.7% 16.7% 16.8%
42.8% 42.5% 42.5%
31
Appendix
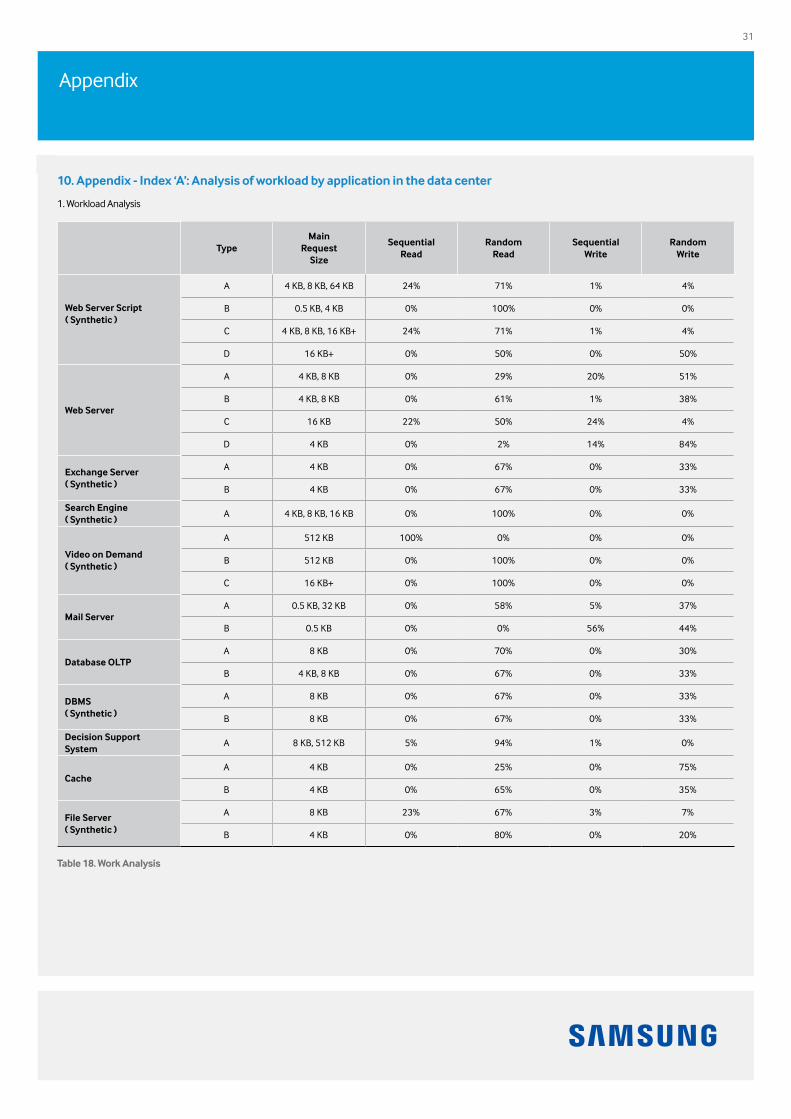
10. Appendix - Index ‘A’: Analysis of workload by application in the data center
1. Workload Analysis
TypeMain
RequestSize
SequentialRead
RandomRead
SequentialWrite
RandomWrite
WebServerScript( Synthetic )
A 4 KB, 8 KB, 64 KB 24% 71% 1% 4%
B 0.5 KB, 4 KB 0% 100% 0% 0%
C 4 KB, 8 KB, 16 KB+ 24% 71% 1% 4%
D 16 KB+ 0% 50% 0% 50%
WebServer
A 4 KB, 8 KB 0% 29% 20% 51%
B 4 KB, 8 KB 0% 61% 1% 38%
C 16 KB 22% 50% 24% 4%
D 4 KB 0% 2% 14% 84%
Exchange Server( Synthetic )
A 4 KB 0% 67% 0% 33%
B 4 KB 0% 67% 0% 33%
Search Engine( Synthetic )
A 4 KB, 8 KB, 16 KB 0% 100% 0% 0%
Video on Demand( Synthetic )
A 512 KB 100% 0% 0% 0%
B 512 KB 0% 100% 0% 0%
C 16 KB+ 0% 100% 0% 0%
Mail ServerA 0.5 KB, 32 KB 0% 58% 5% 37%
B 0.5 KB 0% 0% 56% 44%
Database OLTPA 8 KB 0% 70% 0% 30%
B 4 KB, 8 KB 0% 67% 0% 33%
DBMS( Synthetic )
A 8 KB 0% 67% 0% 33%
B 8 KB 0% 67% 0% 33%
Decision SupportSystem
A 8 KB, 512 KB 5% 94% 1% 0%
CacheA 4 KB 0% 25% 0% 75%
B 4 KB 0% 65% 0% 35%
File Server( Synthetic )
A 8 KB 23% 67% 3% 7%
B 4 KB 0% 80% 0% 20%
Table18.WorkAnalysis
32
Legal and additional information
About Samsung Electronics Co., Ltd.
Samsung Electronics Co., Ltd. inspires the world and shapes the future
with transformative ideas and technologies, redefining the worlds of TVs,
smartphones, wearable devices, tablets, cameras, digital appliances, printers,
medical equipment, network systems and semiconductors. We are also
leading in the Internet of Things space through, among others, our Digital
Health and Smart Home initiatives. We employ 307,000 people across 84
countries. To discover more, please visit our official website at www.samsung.
com and our official blog at global.samsungtomorrow.com.
For more information
For more information about the Samsung PM863,
v is it www.samsung.com/semiconductor or www.samsung.com/
semiconductor/ssd
Copyright © 2015 Samsung Electronics Co., Ltd. All rights reserved.
Samsung is a registered trademark of Samsung Electronics Co., Ltd.
Specif ications and designs are subject to change without notice.
Nonmetric weights and measurements are approximate. All data were
deemed correct at time of creation. Samsung is not liable for errors or
omissions. All brand, product, service names and logos are trademarks
and/or registered trademarks of their respective owners and are hereby
recognized and acknowledged.
Aerospike is a registered trademark of Aerospike, Inc., in the United States and/
or other countries.
Amazon Web Services is a trademark of Amazon.com, Inc. or its affiliates in the
United States and/or other countries.
ASRock is the official trademark for ASRock Rack, Inc.
Facebook is a registered trademark of Facebook, Inc.
Fio is a registered trademark of Fio Corporation.
Intel and Intel Core are trademarks of Intel Corporation in the U.S. and/or other
countries.
Kakao Talk is a registered trademark of Kakao Corporation.
Linux is a registered trademark of Linus Torvalds.
Twitter is a registered trademark of Twitter, Inc.
Ubuntu is a registered trademark of Canonical Ltd.
Samsung provides this white paper for information purposes only. All information
included herein is subject to change without notice. Samsung Electronics is not
responsible for any direct or indirect damages, arising from or related to use of
this white paper.
Samsung Electronics Co., Ltd.
416, Maetan 3-dong,
Yeongtong-gu
Suwon-si, Gyeonggi-do 443-772,
Korea
www.samsung.com
2015-08
![Nutanix Platform Specifications - WebScaleWorks.com · HYBRID ALL FLASH All-Flash with NVMe 2x SSD: [960 GB, 1.92 TB or 3.84 TB]; 4x HDD: [2 TB]; 2x, 4x or 6x SSD: [960 GB, 1.92 TB](https://img.pdfslide.us/doc/110x75/5ec5c29b4b59e275ef4fa83b/nutanix-platform-specifications-hybrid-all-flash-all-flash-with-nvme-2x-ssd-960.jpg)


![fileâneC{JEk. ,/ZC2 MINIS • 45" IPS displej • rozlišení 960 x 540 • Android 4.3 .4x 1,2 GHz procesor 1 GB RAM 8 GB pamét • Wi-Fi • GPS • Bluetooth • MicroSDHC [6036Y]](https://img.pdfslide.us/doc/110x75/5e1c17c4ac71fe2972514080/necjek-zc2-minis-a-45-ips-displej-a-rozlien-960-x-540-a-android.jpg)