Embed Size (px)
Citation preview
Project 2010‐17: Definition of Bulk Electric System
PUBLIC VERSION
White Paper on Bulk Electric System Radial Exclusion (E1) Low Voltage Loop Threshold September 2013
TableofContents
Background ..................................................................................................................................... 1
Executive Summary ........................................................................................................................ 2
Step 1: Establishment of Minimum Monitored Regional Voltage Levels ................................... 3
Step 1 Conclusion .................................................................................................................... 6
Step 2: Load Flows and Technical Considerations ....................................................................... 7
Step 2 Conclusion .................................................................................................................. 16
Study Conclusion .......................................................................................................................... 17
Appendix 1: Regional Elements ................................................................................................... 18
Appendix 2: One‐Line Diagrams…………………………………………………………………………………………….. 19
Appendix 3: Simulation Results ................................................................................................... 21
Appendix 4: Summary of Loop Flow Issue Through Systems <50 kV .......................................... 32
Project 2010‐17 Definition of BES – Phase 2 SDT Report on sub‐100 kV Looping Facilities Page1
BulkElectricSystemRadialExclusion(E1)
LowVoltageLoopThreshold
Background
The definition of “Bulk Electric System” (BES) in the NERC Glossary consists of a core definition and a list
of facilities configurations that will be included or excluded from the core definition. The core definition
is used to establish the bright line of 100 kV, the overall demarcation point between BES and non‐BES
elements. Exclusion E1 applies to radial systems. In Order No. 773 and 773‐A, the Federal Energy
Regulatory Commission’s (Commission or FERC) expressed concerns that facilities operating below 100
kV may be required to support the reliable operation of the interconnected transmission system. The
Commission also indicated that additional factors beyond impedance must be considered to
demonstrate that looped or networked connections operating below 100 kV need not be considered in
the application of Exclusion E1.1
This document responds to the Commission’s concerns and provides a technical justification for the
establishment of a voltage threshold below which sub‐100 kV equipment need not be considered in the
evaluation of Exclusion E1.
NOTE: This justification does not address whether sub‐ 100 kV systems should be evaluated as
Bulk Electrical System (BES) Facilities. Sub‐ 100 kV systems are already excluded from the BES
under the core definition. Order 773, paragraph 155 states: “Thus, the Commission, while
disagreeing with NERC’s interpretation, does not propose to include the below 100 kV elements
in figure 3 in the bulk electric system, unless determined otherwise in the exception process.”
This was reaffirmed by the Commission in Order 773A, paragraph 36: “Moreover, as noted in the
Final Rule, the sub‐100 kV elements comprising radial systems and local networks will not be
included in the bulk electric system, unless determined otherwise in the exception process.” Sub‐
100 kV facilities will only be included as BES Facilities if justified under the NERC Rules of
Procedure (ROP) Appendix 5C Exception Process.
1 Revisions to Electric Reliability Organization Definition of Bulk Electric System and Rules of Procedure, Order No. 773, 141 FERC ¶ 61,236 at P155, n.139 (2012); order on reh’g, Order No. 773‐A, 143 FERC ¶ 61,053 (2013).
Project 2010‐17 Definition of BES – Phase 2 SDT Report on sub‐100 kV Looping Facilities Page2
ExecutiveSummary
The Project 2010‐17 Standard Drafting Team conducted a two‐step process to establish a technical
justification for the establishment of a voltage threshold below which sub‐100 kV loops do not affect the
application of Exclusion E1. The justification for establishing a lower voltage threshold for application of
Exclusion E1 consisted of a two‐step technical approach:
Step 1: A review was performed to determine the minimum voltage levels that are monitored
by Balancing Authorities, Reliability Coordinators, and Transmission Operators for Interfaces,
Paths, and Monitored Elements. This minimum voltage level reflects a value that industry
experts consider necessary to monitor and facilitate the operation of the Bulk Electric System
(BES). This step provided a technically sound approach to screen for a minimum voltage limit
that served as a starting point for the technical analysis performed in Step 2 of this study.
Step 2: Technical studies modeling the physics of loop flows through sub‐100 kV systems were
performed to establish which voltage level, while less than 100 kV, should be considered in the
evaluation of Exclusion E1.
The analysis establishes that a 50 kV threshold for sub‐100 kV loops does not affect the application of
Exclusion E1. This approach will ease the administrative burden on entities as it negates the necessity
for an entity to prove that they qualify for Exclusion E1 if the sub‐100 kV loop in question is less than or
equal to 50 kV. This analysis provides an equally effective and efficient alternative to address the
Commission’s directives expressed in Order No. 773 and 773‐A.
It should be noted that, although this study resulted in a technically justified 50 kV threshold based on
proven analytic methods, there are other preventative loop flow methods that entities can apply on
sub‐100 kV loop systems to address physical equipment concerns. These methods include:
Interlocked control schemes;
Reverse power schemes;
Transformer, feeder and bus tie protection; and
Custom protection and control schemes.
These methods are discussed in detail in Appendix 4. The presence of such equipment does not alter the
criteria developed in this white paper, nor does it influence the conclusions reached. Additionally, the
presence of this equipment does not remove or lessen an entity’s obligations associated with the bright‐
line application of the Bulk Electric System (BES) definition.
Project 2010‐17 Definition of BES – Phase 2 SDT Report on sub‐100 kV Looping Facilities Page3
RadialSystemsExclusion(E1)
The proposed definition (first posting) of radial systems in the Phase 2 BES Definition (Exclusion E1) was:
A group of contiguous transmission Elements that emanates from a single point of connection of 100 kV
or higher and:
a) Only serves Load. Or,
b) Only includes generation resources, not identified in Inclusions I2 and I3, with an aggregate
capacity less than or equal to 75 MVA (gross nameplate rating). Or,
c) Where the radial system serves Load and includes generation resources, not identified in
Inclusions I2 and I3, with an aggregate capacity of non‐retail generation less than or equal
to 75 MVA (gross nameplate rating).
Note 1 – A normally open switching device between radial systems, as depicted on prints or
one‐line diagrams for example, does not affect this exclusion.
Note 2 ‐ The presence of a contiguous loop, operated at a voltage level of 30 kV or less2, between
configurations being considered as radial systems, does not affect this exclusion.
STEP1–EstablishmentofMinimumMonitoredRegionalVoltageLevelsAll operating entities have guidelines to identify the elements they believe need to be monitored to
facilitate the reliable operation of the interconnected transmission system. Pursuant to these
guidelines, operating entities in each of the eight Regions in North America have identified and monitor
key groupings of the transmission elements that limit the amount of power that can be reliably
transferred across their systems. The groupings of these elements have different names: for instance,
Paths in the Western Interconnection; Interfaces or Flowgates in the Eastern Interconnection; or
Monitored Elements in the Electric Reliability Council of Texas (ERCOT). Nevertheless, they all constitute
element groupings that operating entities (Reliability Coordinators, Balancing Authorities, and
Transmission Operators) monitor because they understand that they are necessary to ensure the
reliable operation of the interconnected transmission system under diverse operating conditions.
To provide information in determining a voltage level where the presence of a contiguous loop between
system configurations may not affect the determination of radial systems under Exclusion E1 of the BES
definition, voltage levels that are monitored on major Interfaces, Flowgates, Paths, and ERCOT
Monitored Elements were examined. This examination focused on elements owned and operated by
entities in North America. The objective was to identify the lowest monitored voltage level on these key
element groupings. The lowest monitored line voltage on the major element groupings provides an
indication of the lower limit which operating entities have historically believed necessary to ensure the
2 The first posting of this Phase 2 definition used a threshold of 30 kV; however as a result of the study work described in this paper, the Standard Drafting Team has revised the threshold to 50 kV for subsequent industry consideration.
Project 2010‐17 Definition of BES – Phase 2 SDT Report on sub‐100 kV Looping Facilities Page4
reliable operation of the interconnected transmission system. The results of this analysis provided a
starting point for the technical analysis which was performed in Step 2 of this study.
Step 1 Approach Each Region was requested to provide the key groupings of elements they monitor to ensure reliable
operation of the interconnected transmission system. This list, contained in Appendix 1, was reviewed
to identify the lowest voltage element in the major element groupings monitored by operating entities
in the eight Regions. Identification of this lowest voltage level served as a starting point to begin a
closer examination into the voltage level where the presence of a contiguous loop should not affect the
evaluation of radial systems under Exclusion E1 of the BES definition.
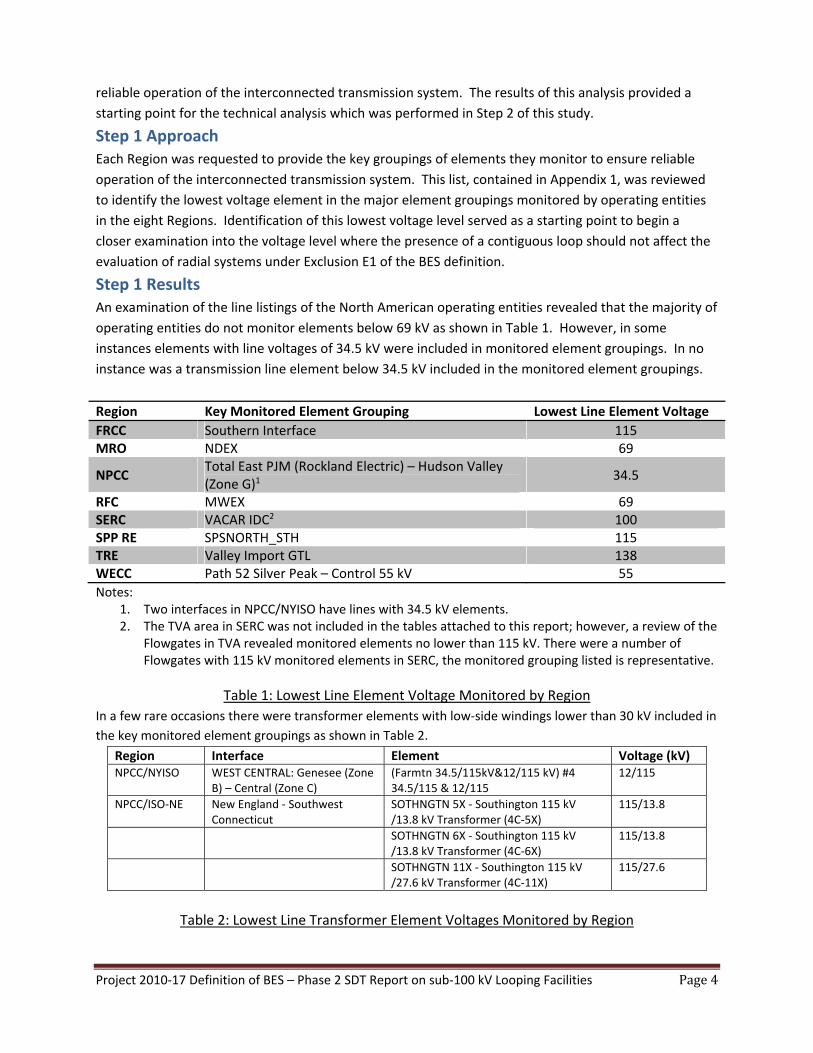
Step 1 Results An examination of the line listings of the North American operating entities revealed that the majority of
operating entities do not monitor elements below 69 kV as shown in Table 1. However, in some
instances elements with line voltages of 34.5 kV were included in monitored element groupings. In no
instance was a transmission line element below 34.5 kV included in the monitored element groupings.
Region Key Monitored Element Grouping Lowest Line Element Voltage
FRCC Southern Interface 115 MRO NDEX 69
NPCC Total East PJM (Rockland Electric) – Hudson Valley (Zone G)1
34.5
RFC MWEX 69 SERC VACAR IDC2 100 SPP RE SPSNORTH_STH 115 TRE Valley Import GTL 138 WECC Path 52 Silver Peak – Control 55 kV 55
Notes: 1. Two interfaces in NPCC/NYISO have lines with 34.5 kV elements. 2. The TVA area in SERC was not included in the tables attached to this report; however, a review of the
Flowgates in TVA revealed monitored elements no lower than 115 kV. There were a number of Flowgates with 115 kV monitored elements in SERC, the monitored grouping listed is representative.
Table 1: Lowest Line Element Voltage Monitored by Region
In a few rare occasions there were transformer elements with low‐side windings lower than 30 kV included in
the key monitored element groupings as shown in Table 2.
Region Interface Element Voltage (kV)NPCC/NYISO WEST CENTRAL: Genesee (Zone
B) – Central (Zone C) (Farmtn 34.5/115kV&12/115 kV) #4 34.5/115 & 12/115
12/115
NPCC/ISO‐NE New England ‐ Southwest Connecticut
SOTHNGTN 5X ‐ Southington 115 kV /13.8 kV Transformer (4C‐5X)
115/13.8
SOTHNGTN 6X ‐ Southington 115 kV /13.8 kV Transformer (4C‐6X)
115/13.8
SOTHNGTN 11X ‐ Southington 115 kV /27.6 kV Transformer (4C‐11X)
115/27.6
Table 2: Lowest Line Transformer Element Voltages Monitored by Region
Project 2010‐17 Definition of BES – Phase 2 SDT Report on sub‐100 kV Looping Facilities Page5
Upon closer investigation, for New England’s Southwest Connecticut interface, it was determined that
the inclusion of these elements was the result of longstanding, historical interface definitions and not
for the purpose of addressing BES reliability concerns. Transformers serving lower voltage networks
continue to be included based on familiarity with the existing interface rather than a specific technical
concern. These transformers could be removed from the interface definition with no impact on
monitoring the reliability of the interconnected transmission system. For the New York West Central
interface, the low voltage element was included because the interface definition included boundary
transmission lines between Transmission Owner control areas; hence, it was included for completeness
to measure the power flow from one Transmission Owner control area to the other Transmission Owner
control area.
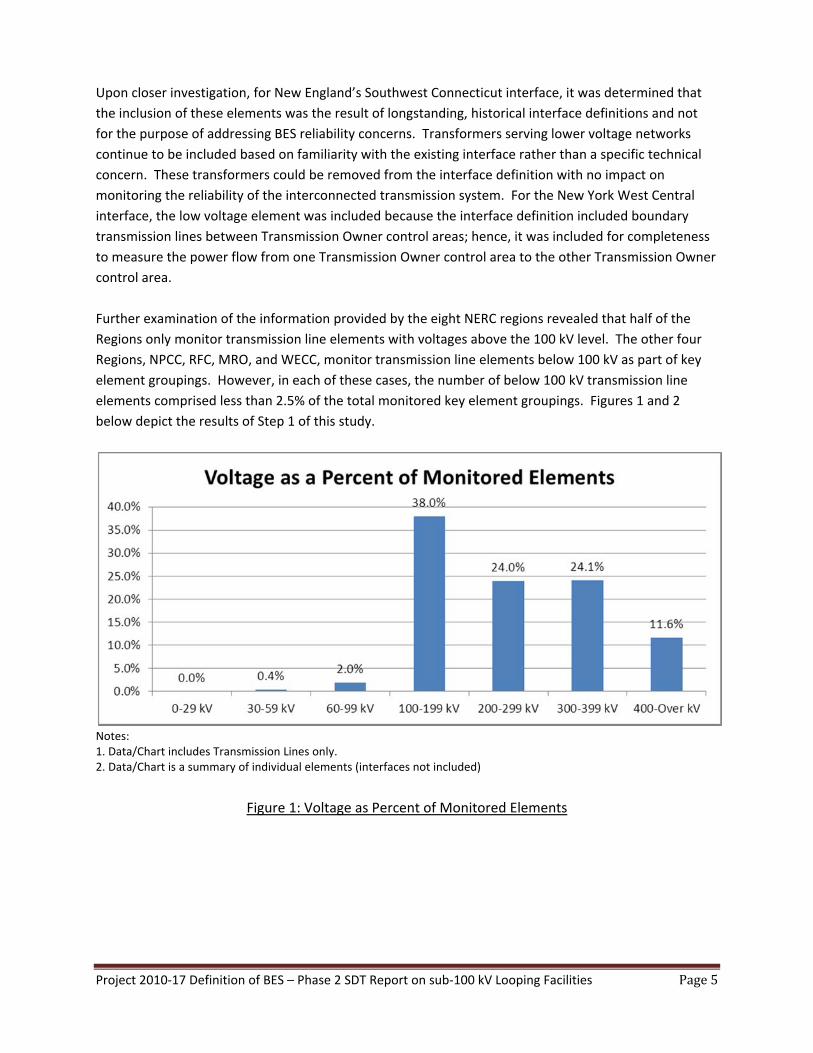
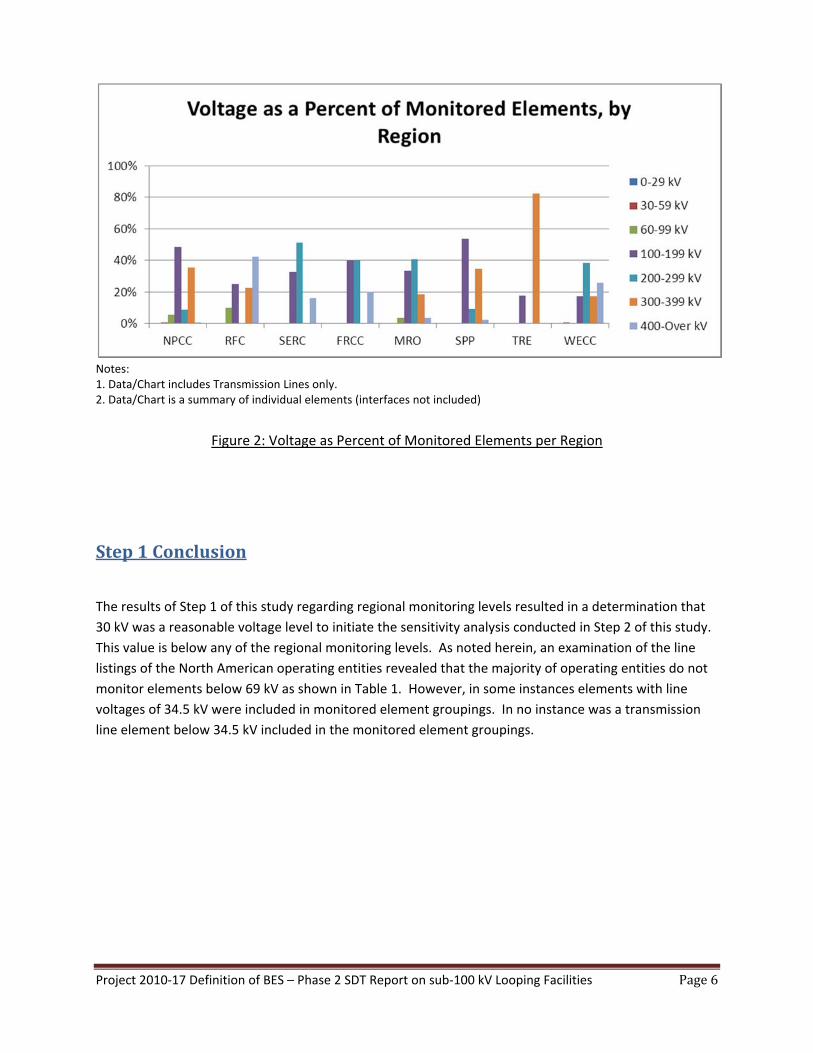
Further examination of the information provided by the eight NERC regions revealed that half of the
Regions only monitor transmission line elements with voltages above the 100 kV level. The other four
Regions, NPCC, RFC, MRO, and WECC, monitor transmission line elements below 100 kV as part of key
element groupings. However, in each of these cases, the number of below 100 kV transmission line
elements comprised less than 2.5% of the total monitored key element groupings. Figures 1 and 2
below depict the results of Step 1 of this study.
Notes: 1. Data/Chart includes Transmission Lines only. 2. Data/Chart is a summary of individual elements (interfaces not included)
Figure 1: Voltage as Percent of Monitored Elements
Project 2010‐17 Definition of BES – Phase 2 SDT Report on sub‐100 kV Looping Facilities Page6
Notes: 1. Data/Chart includes Transmission Lines only. 2. Data/Chart is a summary of individual elements (interfaces not included)
Figure 2: Voltage as Percent of Monitored Elements per Region
Step1Conclusion
The results of Step 1 of this study regarding regional monitoring levels resulted in a determination that
30 kV was a reasonable voltage level to initiate the sensitivity analysis conducted in Step 2 of this study.
This value is below any of the regional monitoring levels. As noted herein, an examination of the line
listings of the North American operating entities revealed that the majority of operating entities do not
monitor elements below 69 kV as shown in Table 1. However, in some instances elements with line
voltages of 34.5 kV were included in monitored element groupings. In no instance was a transmission
line element below 34.5 kV included in the monitored element groupings.
Project 2010‐17 Definition of BES – Phase 2 SDT Report on sub‐100 kV Looping Facilities Page7
STEP2‐LoadFlowsandTechnicalConsiderations
The threshold of 30 kV was established in Step 1 as a reasonable starting point to initiate the technical
sensitivity analysis performed in Step 2 of this study. The purpose of this step was to determine if there
is a technical justification to support a voltage threshold for the purpose of determining whether
facilities greater than 100 kV can be considered to be radial under the BES Definition Exclusion E1. If the
resulting voltage threshold was deemed appropriate through technical study efforts, then contiguous
loop connections operated at voltages below this value would not preclude the application of Exclusion
E1. Conversely, contiguous loops connecting radial lines at voltages above this kV value would negate
the ability for an entity to use Exclusion E1 for the subject facilities.
This study focused on two typical configurations: a distribution loop and a sub‐transmission loop. The
study evaluated a range of voltages for the loop and the parallel transmission system with the goal of
determining the voltage level below which single contingencies on the transmission system would not
result in power flow from a low voltage distribution or sub‐transmission loop to the BES. The study
included sensitivity analysis varying the loads and impedances. Variations in loop and transmission
system impedances account for a range of physical parameters such as conductor length, conductor
type, system configuration, and proximity of the loop to the transmission system. This study provided
the low voltage floor that can be used as a consideration for BES exclusion E1.
Project 2010‐17 Definition of BES – Phase 2 SDT Report on sub‐100 kV Looping Facilities Page8
AnalyticalApproach–DistributionCircuitLoopExample
The Project 2010‐17 Standard Drafting Team sought to examine the interaction and relative magnitude
of flows on the 100 kV and above Facilities of the electric system and those of any underlying low
voltage distribution loops. While not the determining factor leading to this study’s recommendation,
line outage distribution factors (LODF) were a useful tool in understanding the relationship between
underlying systems and the BES elements. It illustrated the relative scale of interaction between the BES
and the lower voltage systems and its review was a consideration when this study was performed. As
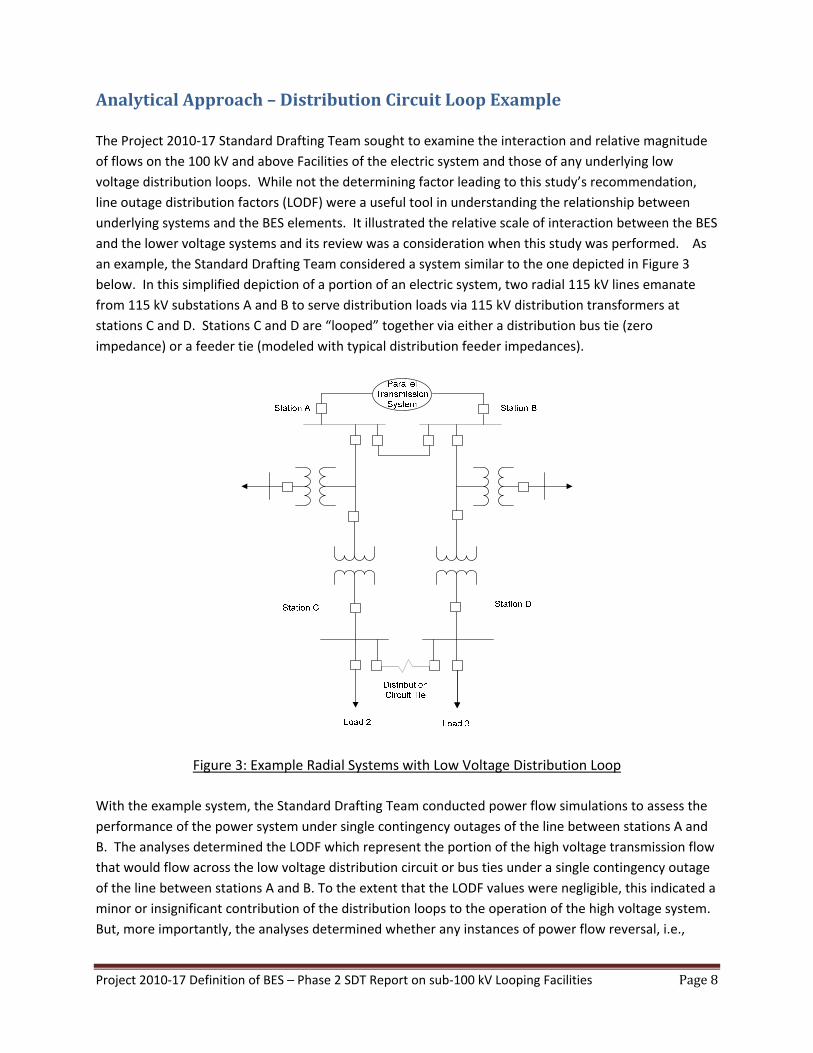
an example, the Standard Drafting Team considered a system similar to the one depicted in Figure 3
below. In this simplified depiction of a portion of an electric system, two radial 115 kV lines emanate
from 115 kV substations A and B to serve distribution loads via 115 kV distribution transformers at
stations C and D. Stations C and D are “looped” together via either a distribution bus tie (zero
impedance) or a feeder tie (modeled with typical distribution feeder impedances).
Figure 3: Example Radial Systems with Low Voltage Distribution Loop
With the example system, the Standard Drafting Team conducted power flow simulations to assess the
performance of the power system under single contingency outages of the line between stations A and
B. The analyses determined the LODF which represent the portion of the high voltage transmission flow
that would flow across the low voltage distribution circuit or bus ties under a single contingency outage
of the line between stations A and B. To the extent that the LODF values were negligible, this indicated a
minor or insignificant contribution of the distribution loops to the operation of the high voltage system.
But, more importantly, the analyses determined whether any instances of power flow reversal, i.e.,
Project 2010‐17 Definition of BES – Phase 2 SDT Report on sub‐100 kV Looping Facilities Page9
resultant flow delivered into the BES, would occur during contingent operating scenarios. Instances of
flow reversal into the BES would indicate that the underlying distribution looped system is exhibiting
behavior similar to a sub‐transmission or transmission system, which would call into question the
applicability of radial exclusion E1.
The study work in this approach examined the sensitivity of parallel circuit flow on the distribution
elements to the size of the distribution transformers, the operating voltage of distribution delivery buses
at stations C and D and the strength of the transmission network serving stations A and B as manifested
in the variation of the transmission network transfer impedances used in the model.
In order to simply, yet accurately, represent this low voltage loop scenario between two radial circuits, a
Power System Simulator for Engineering (PSSE) model was created. Elements represented in this model
included the following:
Radial 115 kV lines from station A to station C and station B to station D;
Interconnecting transmission line from station A to station B;
Distribution transformers tapped off the 115 kV lines between stations A and C and between
stations B and D and at stations C and D;
Feeder tie impedance to represent a feeder tie (or zero impedance bus tie) between distribution
buses at stations C and D;
Transfer impedance equivalent between stations A and B, representing the strength of the
interconnected transmission network3.
Within this model, parameters were modified to simulate differences in the length and impedance of
the transmission lines, the amount of distribution load, the strength of the transmission network
supplying stations A and B, the size of the distribution transformers and the character of the bus or
feeder ties at distribution Stations C and D.
DistributionModelSimulation
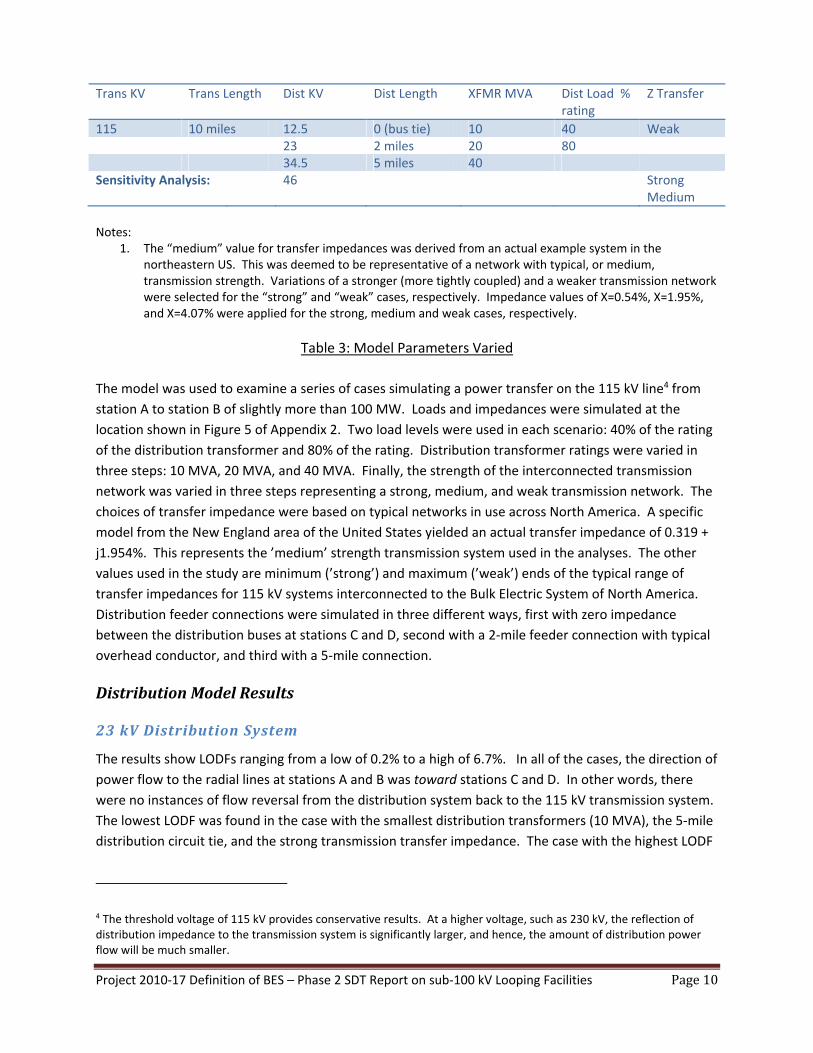
Table 3 below illustrates the domain of the various parameters that were simulated in this distribution
circuit loop scenario. A parametric analysis was performed using all combinations of variables shown in
each column of the upper portion of Table 3. Sensitivity analysis was performed as indicated in the
lower portion of the table.
3 The relative strength of the surrounding transmission system network is a function of the quantity of parallel transmission paths and the impedance of those paths between the two source substations. A high number of parallel paths with low impedance translates to a low transfer impedance, which allows power to more readily flow between the stations. Conversely, a low number of parallel paths having higher impedance is represented by a relatively large transfer impedance.
Project 2010‐17 Definition of BES – Phase 2 SDT Report on sub‐100 kV Looping Facilities Page10
Trans KV Trans Length Dist KV Dist Length XFMR MVA Dist Load % rating
Z Transfer
115 10 miles 12.5 0 (bus tie) 10 40 Weak 23 2 miles 20 80 34.5 5 miles 40 Sensitivity Analysis: 46 Strong
Medium
Notes:
1. The “medium” value for transfer impedances was derived from an actual example system in the northeastern US. This was deemed to be representative of a network with typical, or medium, transmission strength. Variations of a stronger (more tightly coupled) and a weaker transmission network were selected for the “strong” and “weak” cases, respectively. Impedance values of X=0.54%, X=1.95%, and X=4.07% were applied for the strong, medium and weak cases, respectively.
Table 3: Model Parameters Varied
The model was used to examine a series of cases simulating a power transfer on the 115 kV line4 from
station A to station B of slightly more than 100 MW. Loads and impedances were simulated at the
location shown in Figure 5 of Appendix 2. Two load levels were used in each scenario: 40% of the rating
of the distribution transformer and 80% of the rating. Distribution transformer ratings were varied in
three steps: 10 MVA, 20 MVA, and 40 MVA. Finally, the strength of the interconnected transmission
network was varied in three steps representing a strong, medium, and weak transmission network. The
choices of transfer impedance were based on typical networks in use across North America. A specific
model from the New England area of the United States yielded an actual transfer impedance of 0.319 +
j1.954%. This represents the ’medium’ strength transmission system used in the analyses. The other
values used in the study are minimum (’strong’) and maximum (’weak’) ends of the typical range of
transfer impedances for 115 kV systems interconnected to the Bulk Electric System of North America.
Distribution feeder connections were simulated in three different ways, first with zero impedance
between the distribution buses at stations C and D, second with a 2‐mile feeder connection with typical
overhead conductor, and third with a 5‐mile connection.
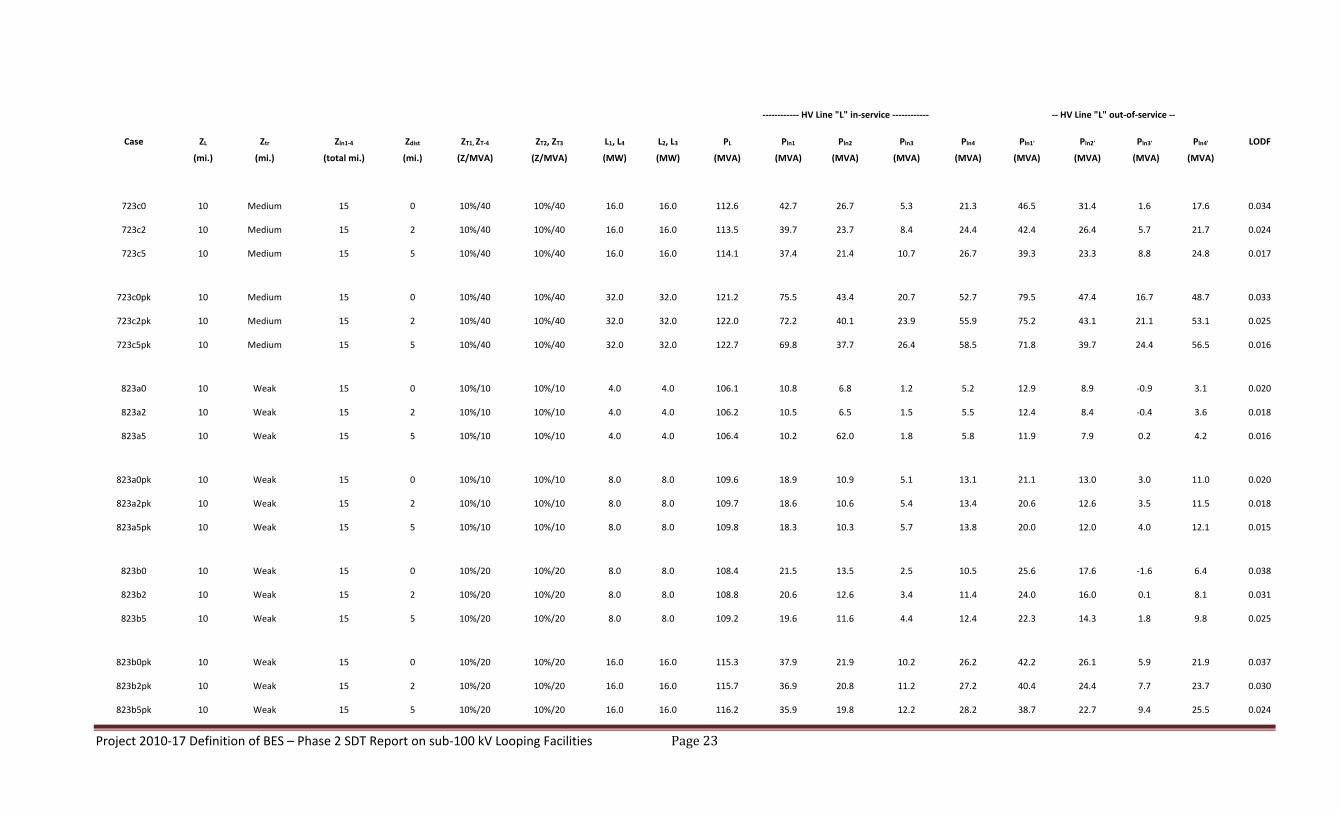
DistributionModelResults
23kVDistribution System
The results show LODFs ranging from a low of 0.2% to a high of 6.7%. In all of the cases, the direction of
power flow to the radial lines at stations A and B was toward stations C and D. In other words, there
were no instances of flow reversal from the distribution system back to the 115 kV transmission system.
The lowest LODF was found in the case with the smallest distribution transformers (10 MVA), the 5‐mile
distribution circuit tie, and the strong transmission transfer impedance. The case with the highest LODF
4 The threshold voltage of 115 kV provides conservative results. At a higher voltage, such as 230 kV, the reflection of distribution impedance to the transmission system is significantly larger, and hence, the amount of distribution power flow will be much smaller.
Project 2010‐17 Definition of BES – Phase 2 SDT Report on sub‐100 kV Looping Facilities Page11
was that which used the largest distribution transformers (40 MVA) with the lightest load and the use of
a zero‐impedance bus tie between the two distribution stations.
12.5 kVDistributionSystemAs compared to the simulations using the 23 kV distribution system, the 12.5 kV system model yielded
far lower LODF values. This result is reasonable, as the reflection of impedances on a 12.5 kV
distribution system will be nearly four times as large as those for a 23 kV distribution system, and the
transformer sizes in use at the 12.5 kV class are generally smaller, i.e., higher impedance. As with the
cases simulated for the 23 kV system, the 12.5 kV system exhibited a power flow direction in the radial
line terminals at stations A and B in the direction of the distribution stations C and D; no flow reversal
was seen in any of the contingency cases.
Given the lower voltage of the distribution system, the cases studied at this low voltage level were
limited to the scenario with the high transfer impedance value (’weak’ transmission case). This is a
conservative assumption as all cases with lower transfer impedance will yield far lower LODF values.
With that, the range of LODF values was found to be 1.0% to 6.7%. When compared with the 23 kV
system results in the weak transmission case, the range of LODF values was 1.8% to 6.7%. Higher LODF
values were found in the cases with the largest transformer size, which is to be expected.
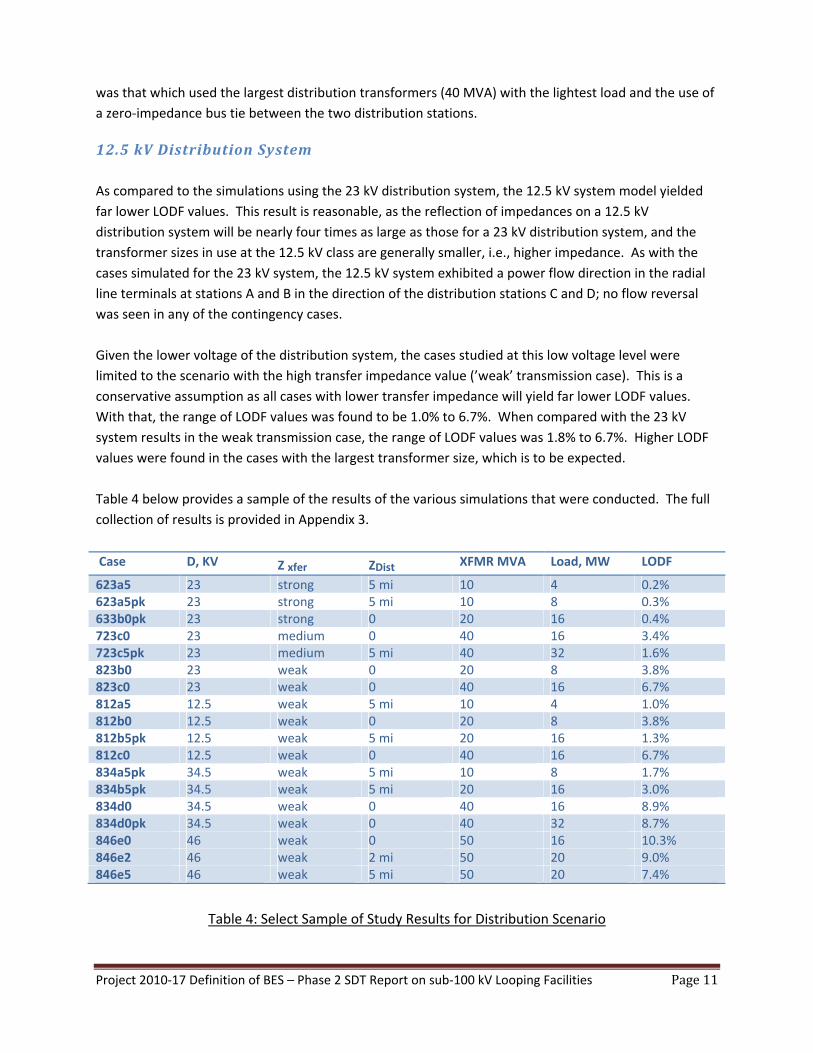
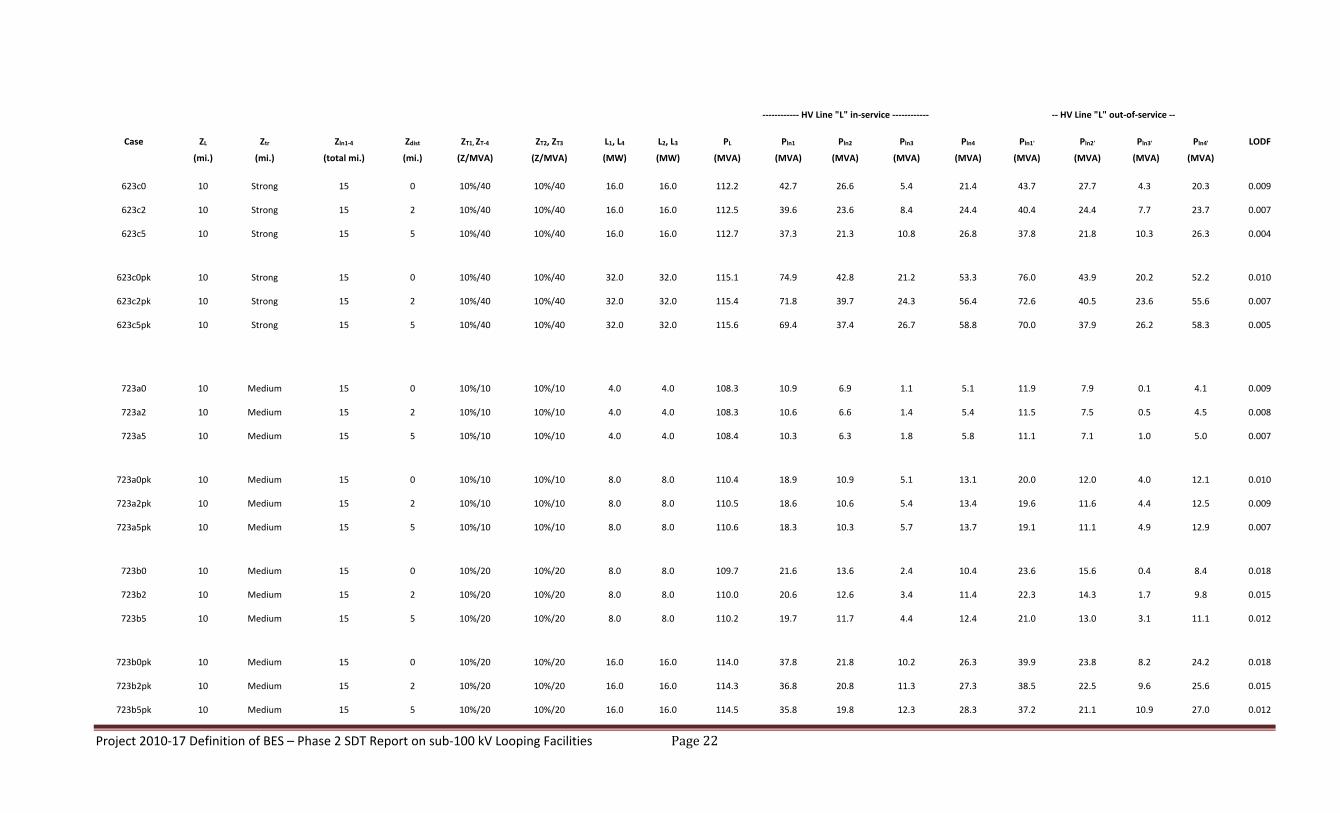
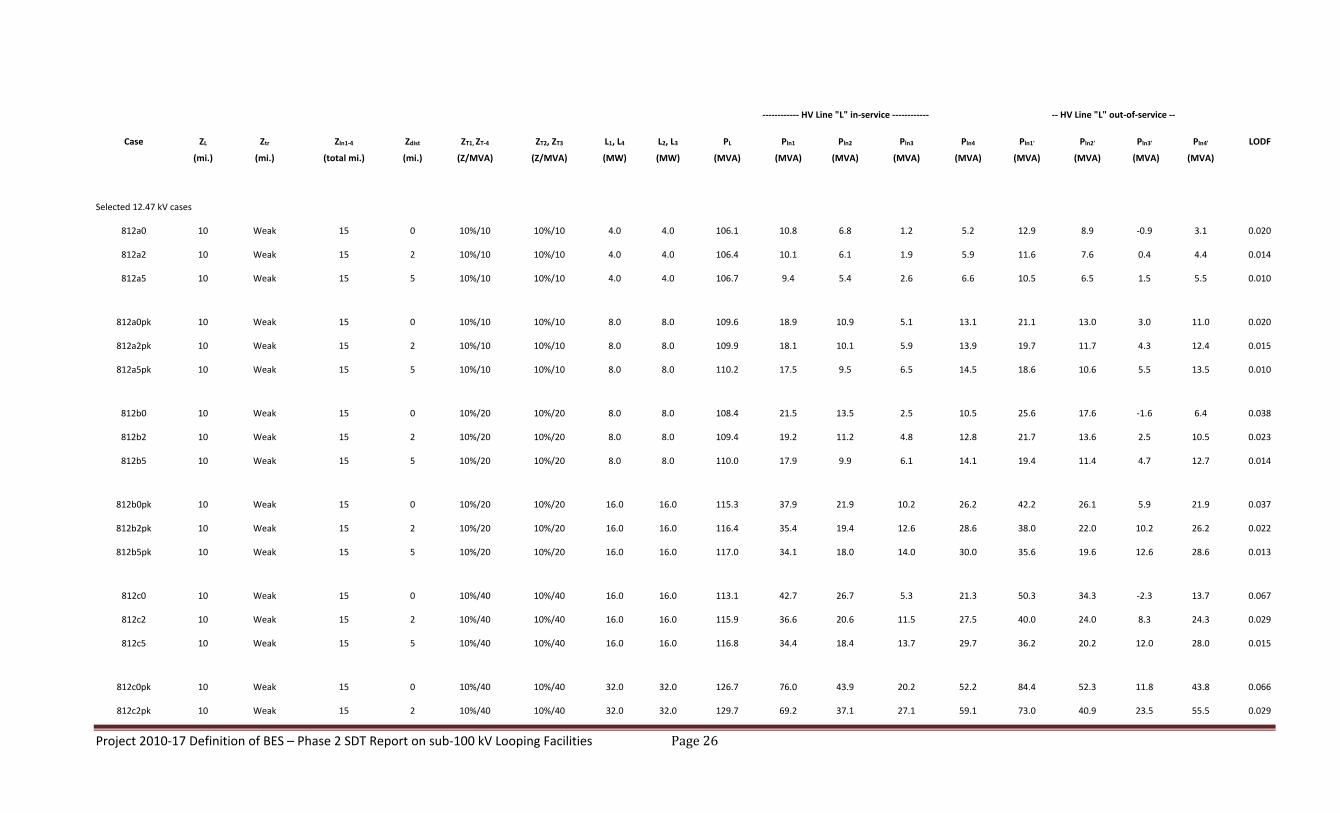
Table 4 below provides a sample of the results of the various simulations that were conducted. The full
collection of results is provided in Appendix 3.
Case D, KV Z xfer ZDist XFMR MVA Load, MW LODF
623a5 23 strong 5 mi 10 4 0.2%623a5pk 23 strong 5 mi 10 8 0.3%633b0pk 23 strong 0 20 16 0.4%723c0 23 medium 0 40 16 3.4%723c5pk 23 medium 5 mi 40 32 1.6%823b0 23 weak 0 20 8 3.8%823c0 23 weak 0 40 16 6.7%812a5 12.5 weak 5 mi 10 4 1.0%812b0 12.5 weak 0 20 8 3.8%812b5pk 12.5 weak 5 mi 20 16 1.3%812c0 12.5 weak 0 40 16 6.7%834a5pk 34.5 weak 5 mi 10 8 1.7%834b5pk 34.5 weak 5 mi 20 16 3.0%834d0 34.5 weak 0 40 16 8.9%834d0pk 34.5 weak 0 40 32 8.7%846e0 46 weak 0 50 16 10.3%846e2 46 weak 2 mi 50 20 9.0%846e5 46 weak 5 mi 50 20 7.4%
Table 4: Select Sample of Study Results for Distribution Scenario
Project 2010‐17 Definition of BES – Phase 2 SDT Report on sub‐100 kV Looping Facilities Page12
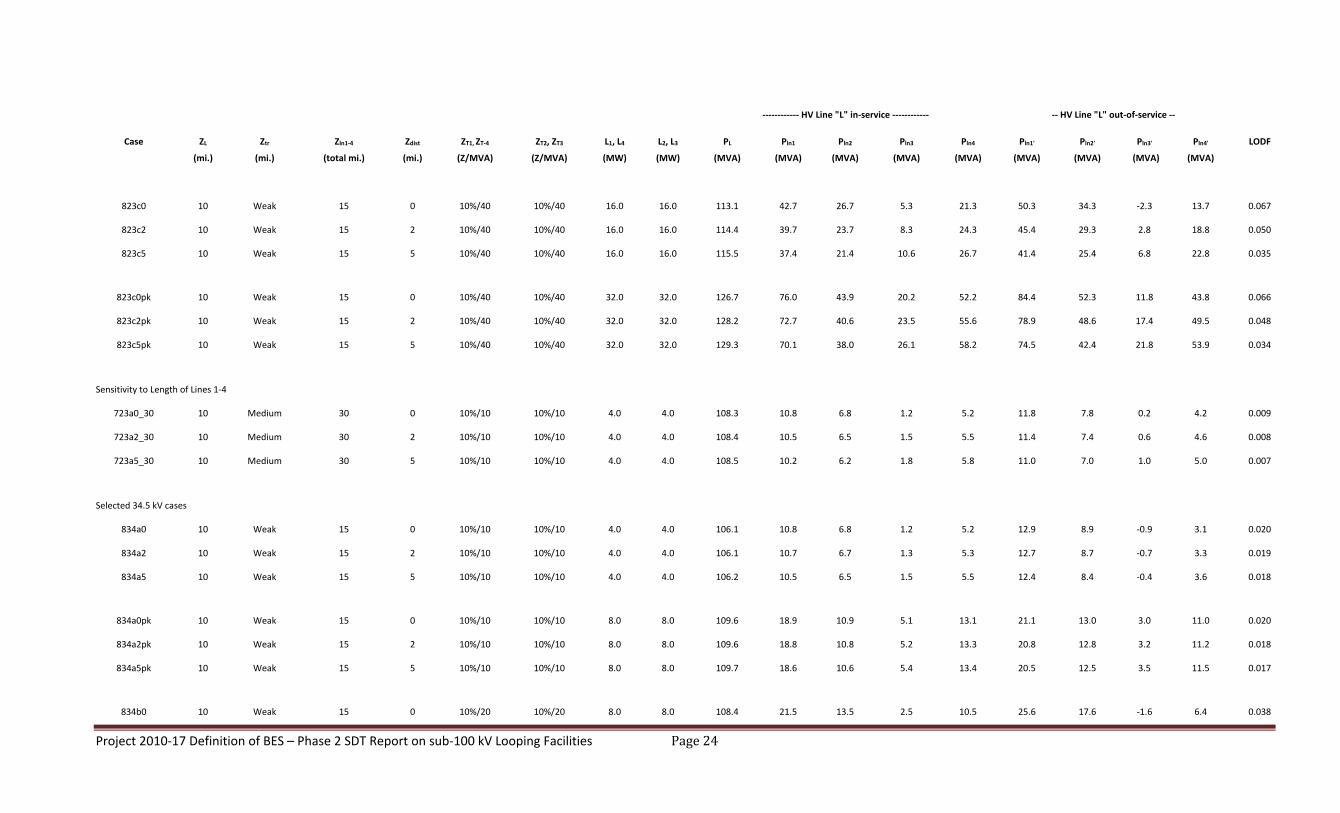
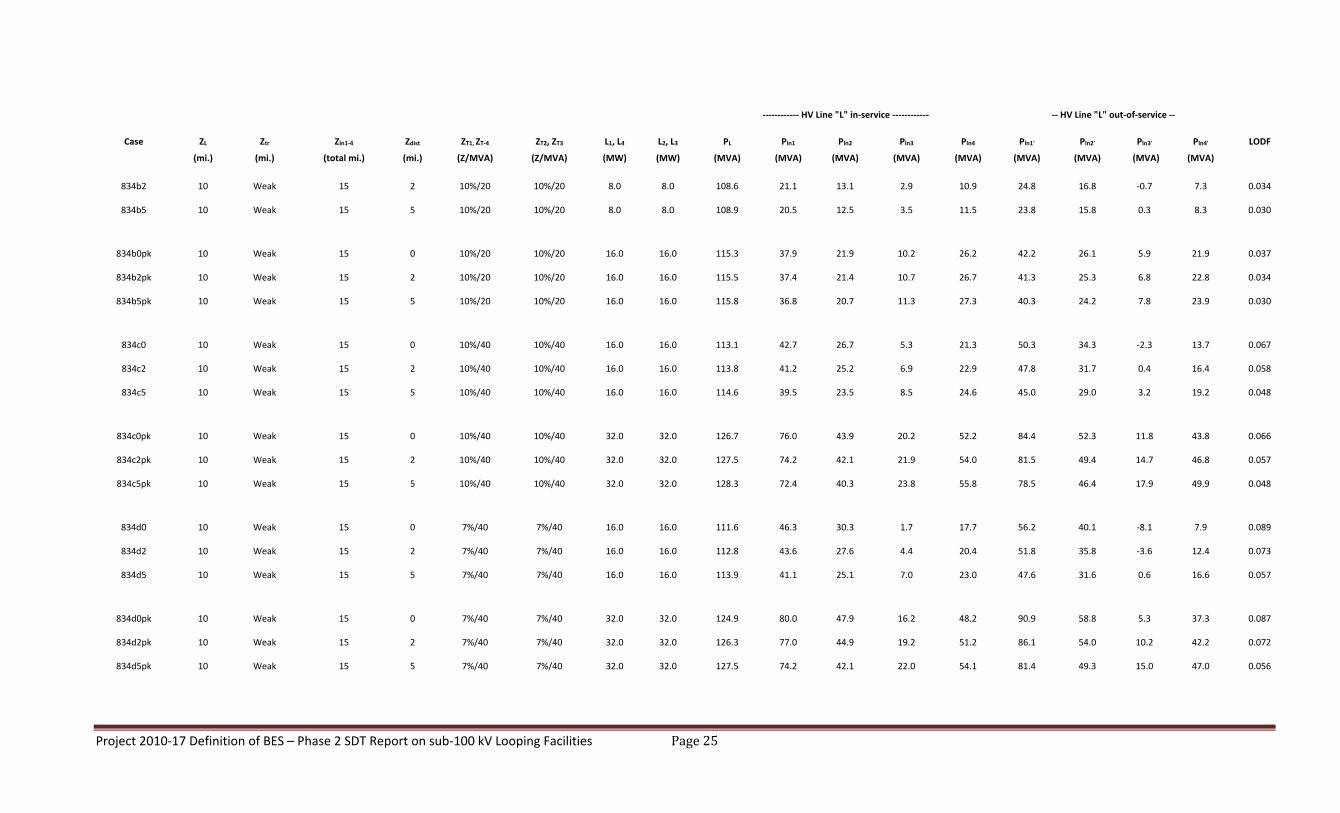
34.5 kVand46 kVDistributionSystems
As with the analysis done for the 12.5 kV system, a conservative transfer impedance value, that of the
’weak’ transmission network, was used in selecting the transfer impedance to be used in the simulations
at 34.5 kV and 46 kV. With this conservative parameter, the simulation results show distribution factors
(LODF) ranging from a low of 1.7% to a high of 10.3%. In all of the cases, the direction of power flow to
the radial lines remained from stations A and B toward stations C and D. In other words, there were no
instances of flow reversal from the distribution system back to the 115 kV transmission system.
Project 2010‐17 Definition of BES – Phase 2 SDT Report on sub‐100 kV Looping Facilities Page13
AnalyticalApproach–Sub‐transmissionExample
In addition to the distribution circuit loop example described above, the study examined the
performance of systems typically described as ’sub‐transmission.’ The study sought to examine the
interaction and relative magnitude of flows on the 100 kV and above Facilities of the interconnected
transmission system and those of the underlying parallel sub‐transmission facilities. The study
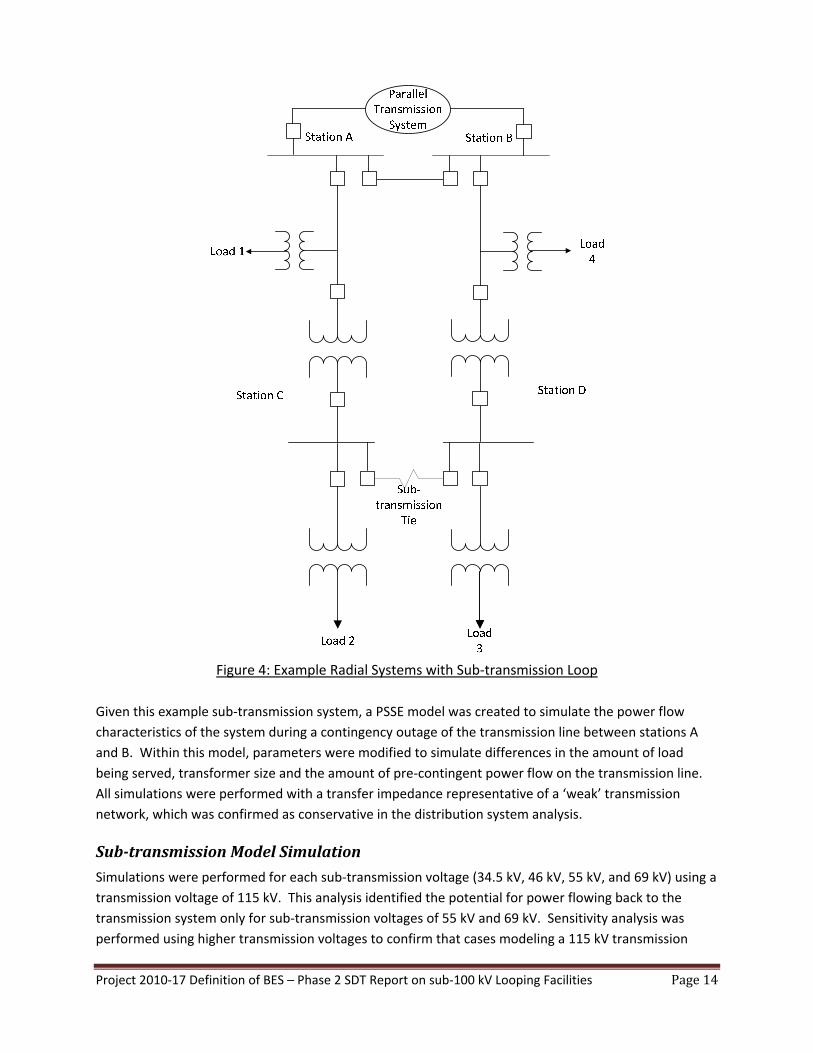
considered a system similar to the one depicted in Figure 4 below. In this simplified depiction of a
portion of a transmission and sub‐transmission system, a 40‐mile transmission line connecting two
sources with transfer impedance between the two sources representing the parallel transmission
network. Each source also supplies a 10‐mile transmission line with a load tap at the mid‐point of the
line, each serving a load of 16 MW. At the end of each of these lines is a step‐down transformer to the
sub‐transmission voltage, where an additional load is served. The two sub‐transmission stations are
connected by a 25‐mile sub‐transmission tie line. Loads and impedances were simulated at the location
shown in Figure 6 of Appendix 2.
Project 2010‐17 Definition of BES – Phase 2 SDT Report on sub‐100 kV Looping Facilities Page14
Figure 4: Example Radial Systems with Sub‐transmission Loop
Given this example sub‐transmission system, a PSSE model was created to simulate the power flow
characteristics of the system during a contingency outage of the transmission line between stations A
and B. Within this model, parameters were modified to simulate differences in the amount of load
being served, transformer size and the amount of pre‐contingent power flow on the transmission line.
All simulations were performed with a transfer impedance representative of a ‘weak’ transmission
network, which was confirmed as conservative in the distribution system analysis.
Sub‐transmissionModelSimulation
Simulations were performed for each sub‐transmission voltage (34.5 kV, 46 kV, 55 kV, and 69 kV) using a
transmission voltage of 115 kV. This analysis identified the potential for power flowing back to the
transmission system only for sub‐transmission voltages of 55 kV and 69 kV. Sensitivity analysis was
performed using higher transmission voltages to confirm that cases modeling a 115 kV transmission
Project 2010‐17 Definition of BES – Phase 2 SDT Report on sub‐100 kV Looping Facilities Page15
system yield the most conservative results. Therefore, it was not necessary to perform sensitivity
analysis for sub‐transmission voltages of 34.5 kV and 46 kV for transmission voltages higher than 115 kV.
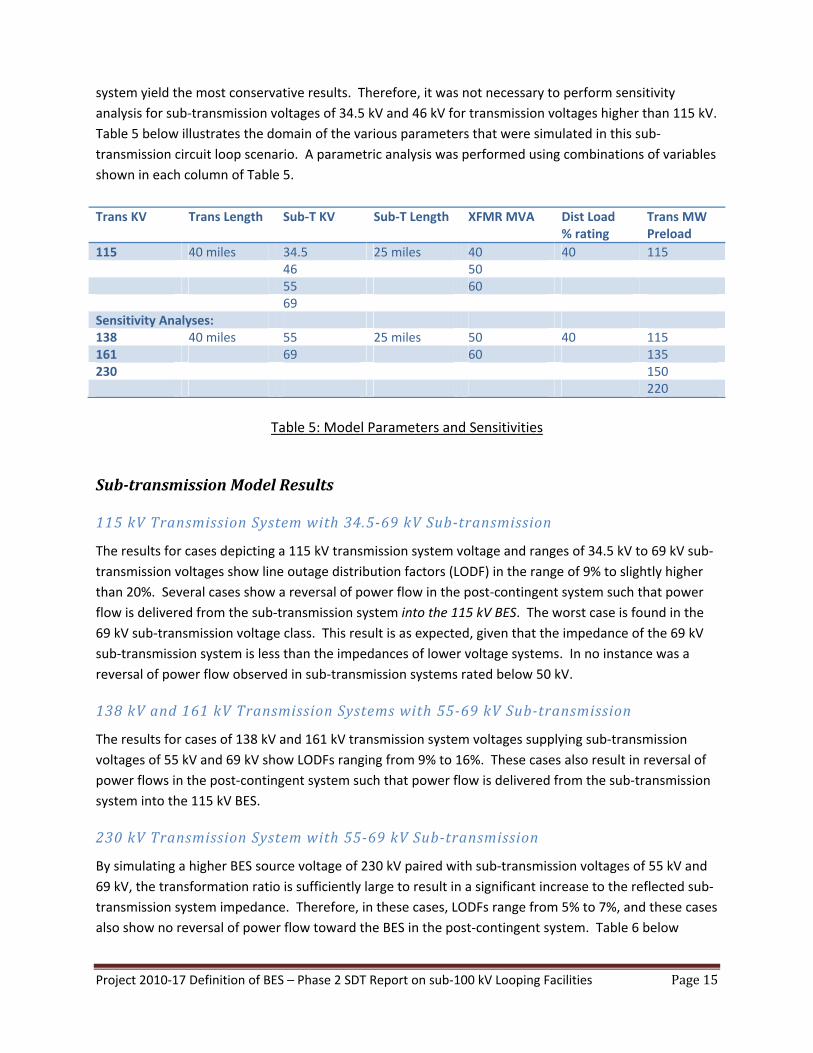
Table 5 below illustrates the domain of the various parameters that were simulated in this sub‐
transmission circuit loop scenario. A parametric analysis was performed using combinations of variables
shown in each column of Table 5.
Trans KV Trans Length Sub‐T KV Sub‐T Length XFMR MVA Dist Load % rating
Trans MW Preload
115 40 miles 34.5 25 miles 40 40 115 46 50 55 60 69 Sensitivity Analyses: 138 40 miles 55 25 miles 50 40 115161 69 60 135230 150 220
Table 5: Model Parameters and Sensitivities
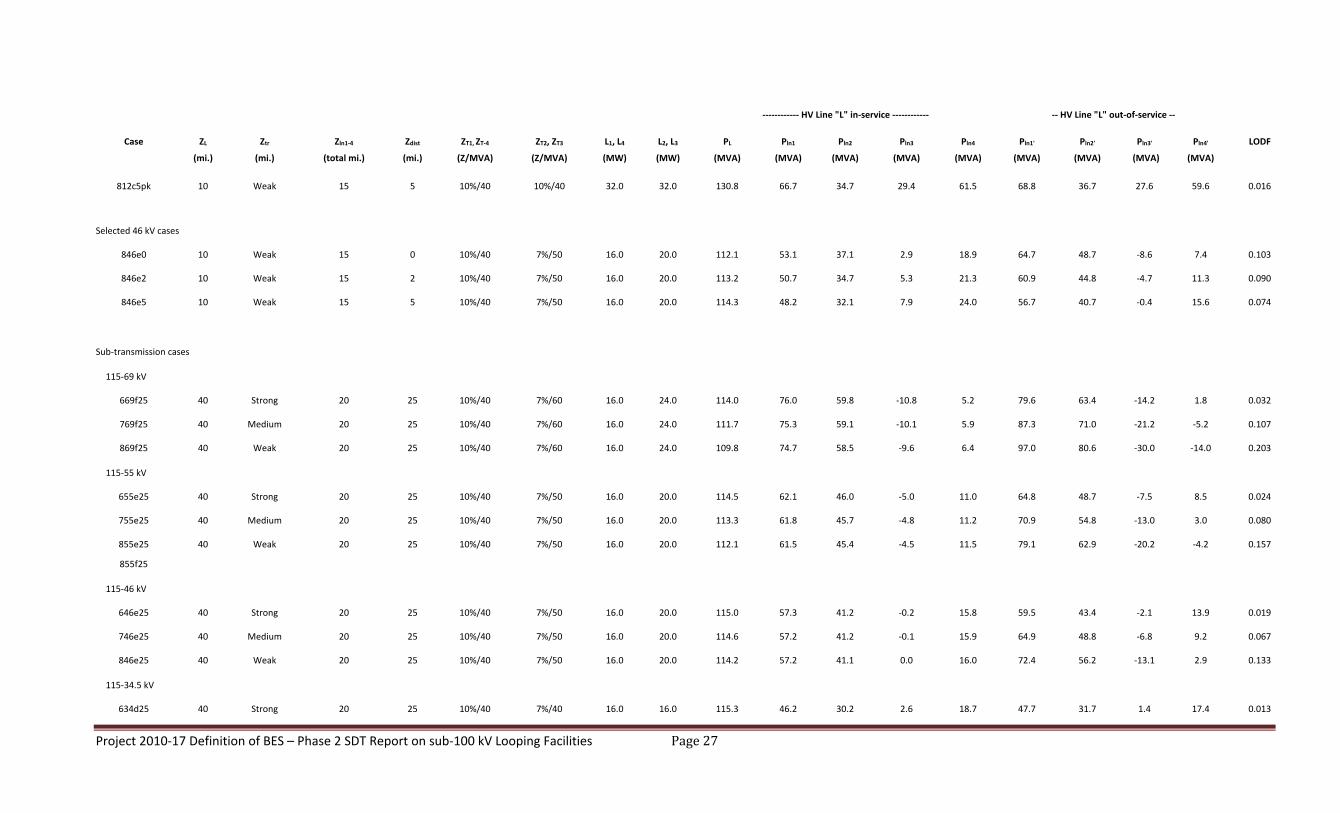
Sub‐transmissionModelResults
115 kVTransmission System with 34.5‐69 kVSub‐transmission
The results for cases depicting a 115 kV transmission system voltage and ranges of 34.5 kV to 69 kV sub‐
transmission voltages show line outage distribution factors (LODF) in the range of 9% to slightly higher
than 20%. Several cases show a reversal of power flow in the post‐contingent system such that power
flow is delivered from the sub‐transmission system into the 115 kV BES. The worst case is found in the
69 kV sub‐transmission voltage class. This result is as expected, given that the impedance of the 69 kV
sub‐transmission system is less than the impedances of lower voltage systems. In no instance was a
reversal of power flow observed in sub‐transmission systems rated below 50 kV.
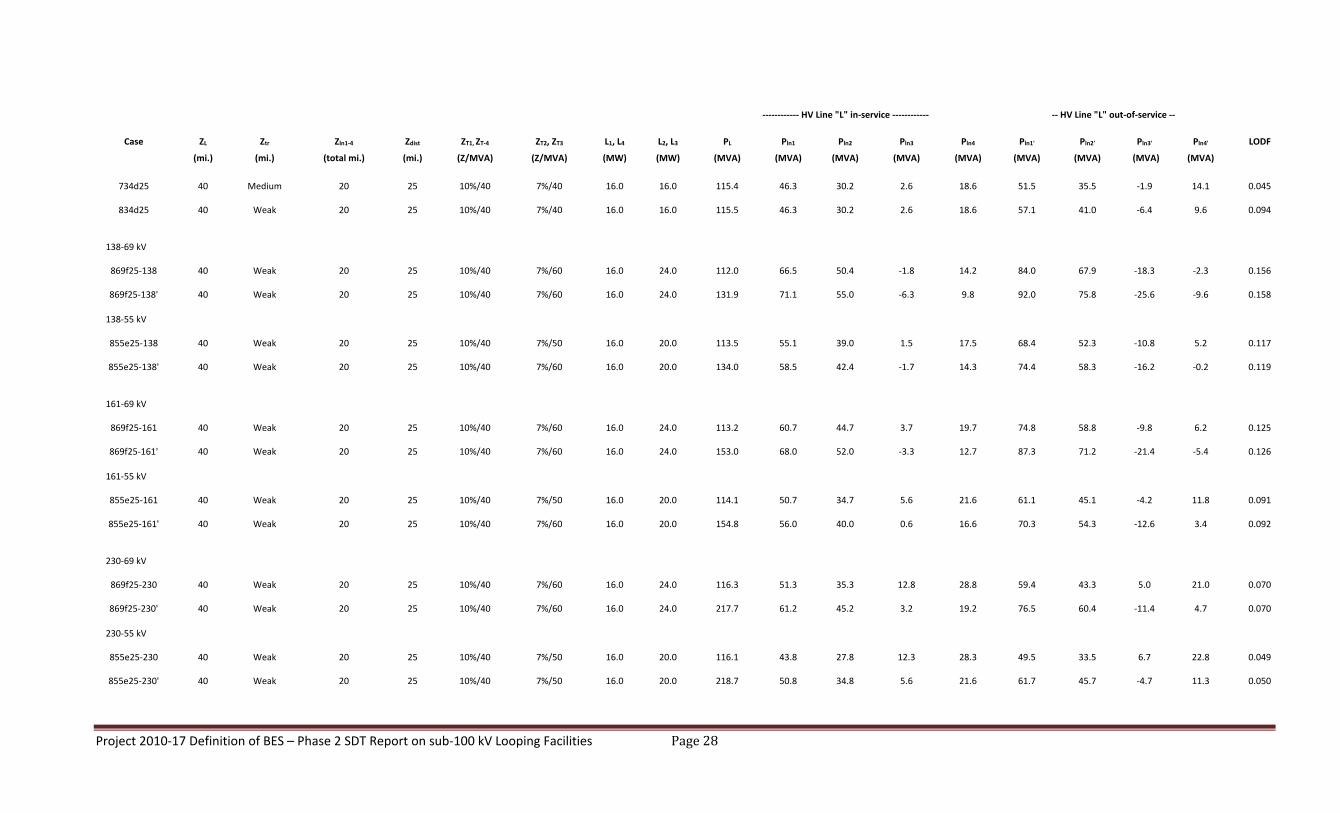
138 kVand161 kVTransmissionSystems with 55‐69kVSub‐transmission
The results for cases of 138 kV and 161 kV transmission system voltages supplying sub‐transmission
voltages of 55 kV and 69 kV show LODFs ranging from 9% to 16%. These cases also result in reversal of
power flows in the post‐contingent system such that power flow is delivered from the sub‐transmission
system into the 115 kV BES.
230 kVTransmission System with 55‐69 kVSub‐transmission
By simulating a higher BES source voltage of 230 kV paired with sub‐transmission voltages of 55 kV and
69 kV, the transformation ratio is sufficiently large to result in a significant increase to the reflected sub‐
transmission system impedance. Therefore, in these cases, LODFs range from 5% to 7%, and these cases
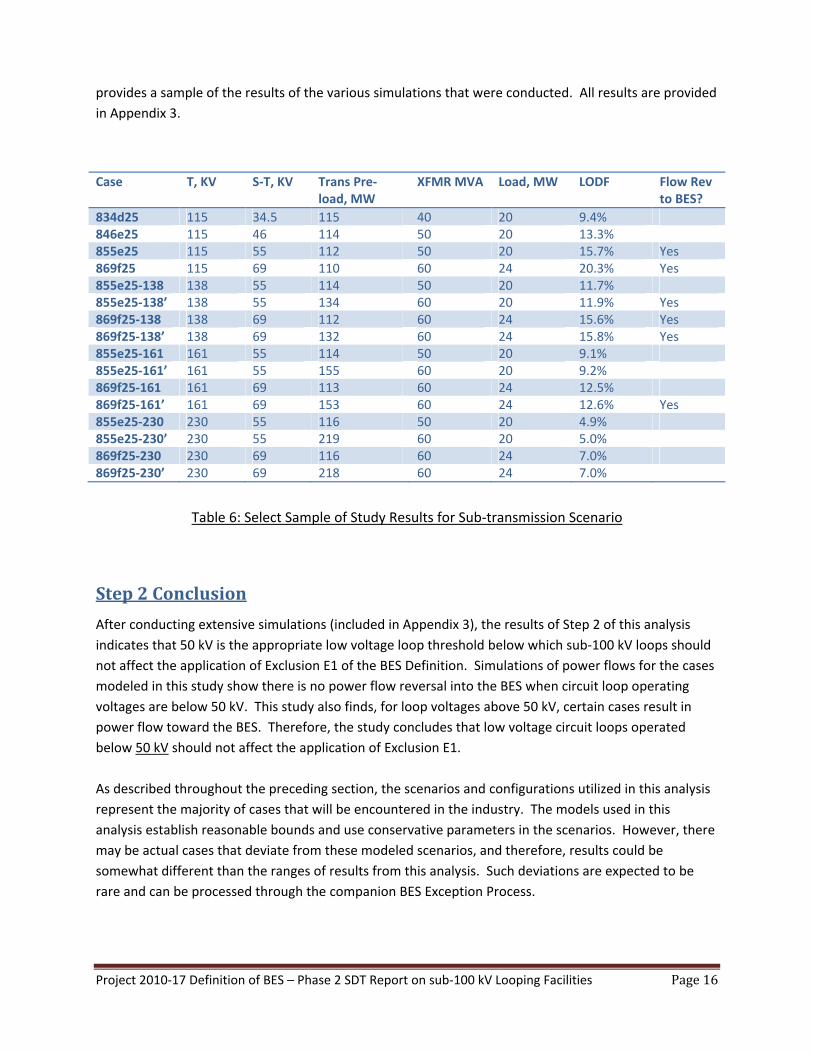
also show no reversal of power flow toward the BES in the post‐contingent system. Table 6 below
Project 2010‐17 Definition of BES – Phase 2 SDT Report on sub‐100 kV Looping Facilities Page16
provides a sample of the results of the various simulations that were conducted. All results are provided
in Appendix 3.
Case T, KV S‐T, KV Trans Pre‐load, MW
XFMR MVA Load, MW LODF Flow Rev to BES?
834d25 115 34.5 115 40 20 9.4% 846e25 115 46 114 50 20 13.3% 855e25 115 55 112 50 20 15.7% Yes869f25 115 69 110 60 24 20.3% Yes855e25‐138 138 55 114 50 20 11.7% 855e25‐138’ 138 55 134 60 20 11.9% Yes869f25‐138 138 69 112 60 24 15.6% Yes869f25‐138’ 138 69 132 60 24 15.8% Yes855e25‐161 161 55 114 50 20 9.1% 855e25‐161’ 161 55 155 60 20 9.2% 869f25‐161 161 69 113 60 24 12.5% 869f25‐161’ 161 69 153 60 24 12.6% Yes855e25‐230 230 55 116 50 20 4.9% 855e25‐230’ 230 55 219 60 20 5.0% 869f25‐230 230 69 116 60 24 7.0% 869f25‐230’ 230 69 218 60 24 7.0%
Table 6: Select Sample of Study Results for Sub‐transmission Scenario
Step2Conclusion
After conducting extensive simulations (included in Appendix 3), the results of Step 2 of this analysis
indicates that 50 kV is the appropriate low voltage loop threshold below which sub‐100 kV loops should
not affect the application of Exclusion E1 of the BES Definition. Simulations of power flows for the cases
modeled in this study show there is no power flow reversal into the BES when circuit loop operating
voltages are below 50 kV. This study also finds, for loop voltages above 50 kV, certain cases result in
power flow toward the BES. Therefore, the study concludes that low voltage circuit loops operated
below 50 kV should not affect the application of Exclusion E1.
As described throughout the preceding section, the scenarios and configurations utilized in this analysis
represent the majority of cases that will be encountered in the industry. The models used in this
analysis establish reasonable bounds and use conservative parameters in the scenarios. However, there
may be actual cases that deviate from these modeled scenarios, and therefore, results could be
somewhat different than the ranges of results from this analysis. Such deviations are expected to be
rare and can be processed through the companion BES Exception Process.
Project 2010‐17 Definition of BES – Phase 2 SDT Report on sub‐100 kV Looping Facilities Page17
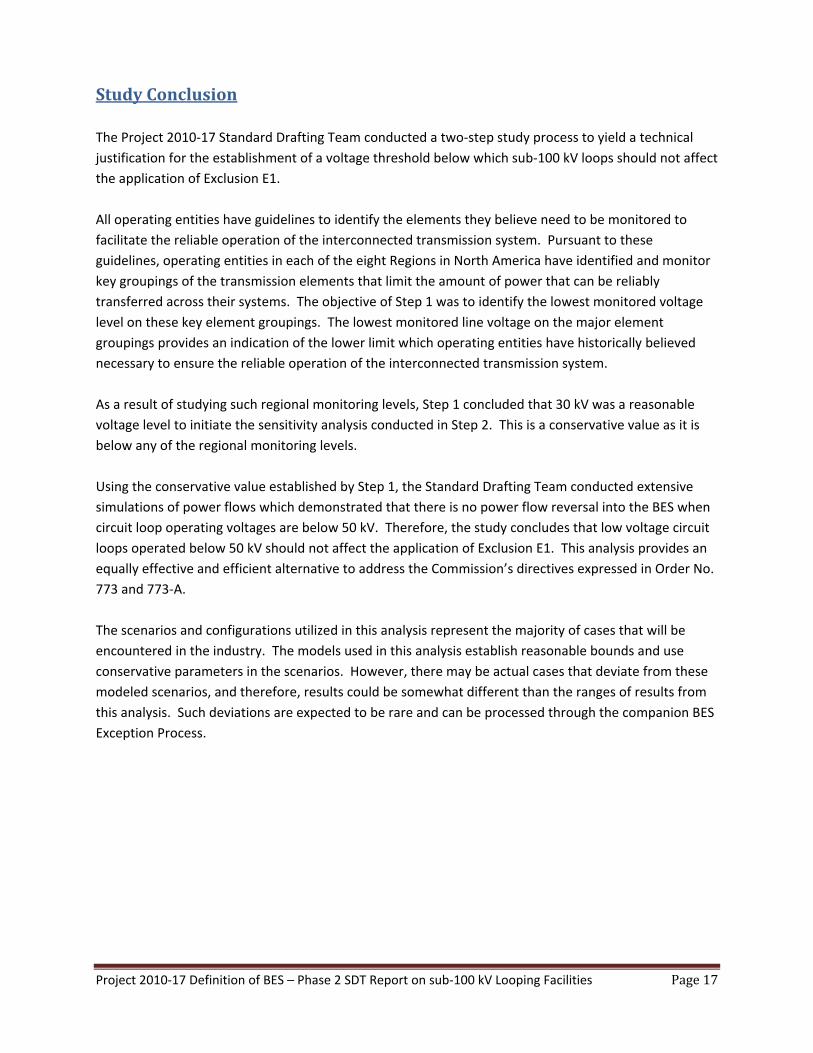
StudyConclusion
The Project 2010‐17 Standard Drafting Team conducted a two‐step study process to yield a technical
justification for the establishment of a voltage threshold below which sub‐100 kV loops should not affect
the application of Exclusion E1.
All operating entities have guidelines to identify the elements they believe need to be monitored to
facilitate the reliable operation of the interconnected transmission system. Pursuant to these
guidelines, operating entities in each of the eight Regions in North America have identified and monitor
key groupings of the transmission elements that limit the amount of power that can be reliably
transferred across their systems. The objective of Step 1 was to identify the lowest monitored voltage
level on these key element groupings. The lowest monitored line voltage on the major element
groupings provides an indication of the lower limit which operating entities have historically believed
necessary to ensure the reliable operation of the interconnected transmission system.
As a result of studying such regional monitoring levels, Step 1 concluded that 30 kV was a reasonable
voltage level to initiate the sensitivity analysis conducted in Step 2. This is a conservative value as it is
below any of the regional monitoring levels.
Using the conservative value established by Step 1, the Standard Drafting Team conducted extensive
simulations of power flows which demonstrated that there is no power flow reversal into the BES when
circuit loop operating voltages are below 50 kV. Therefore, the study concludes that low voltage circuit
loops operated below 50 kV should not affect the application of Exclusion E1. This analysis provides an
equally effective and efficient alternative to address the Commission’s directives expressed in Order No.
773 and 773‐A.
The scenarios and configurations utilized in this analysis represent the majority of cases that will be
encountered in the industry. The models used in this analysis establish reasonable bounds and use
conservative parameters in the scenarios. However, there may be actual cases that deviate from these
modeled scenarios, and therefore, results could be somewhat different than the ranges of results from
this analysis. Such deviations are expected to be rare and can be processed through the companion BES
Exception Process.
Project 2010‐17 Definition of BES – Phase 2 SDT Report on sub‐100 kV Looping Facilities Page18
Appendix1:RegionalElements
PRIVILEGED AND CONFIDENTIAL INFORMATION HAS BEEN REDACTED FROM THIS PUBLIC VERSION
Project 2010‐17 Definition of BES – Phase 2 SDT Report on sub‐100 kV Looping Facilities Page19
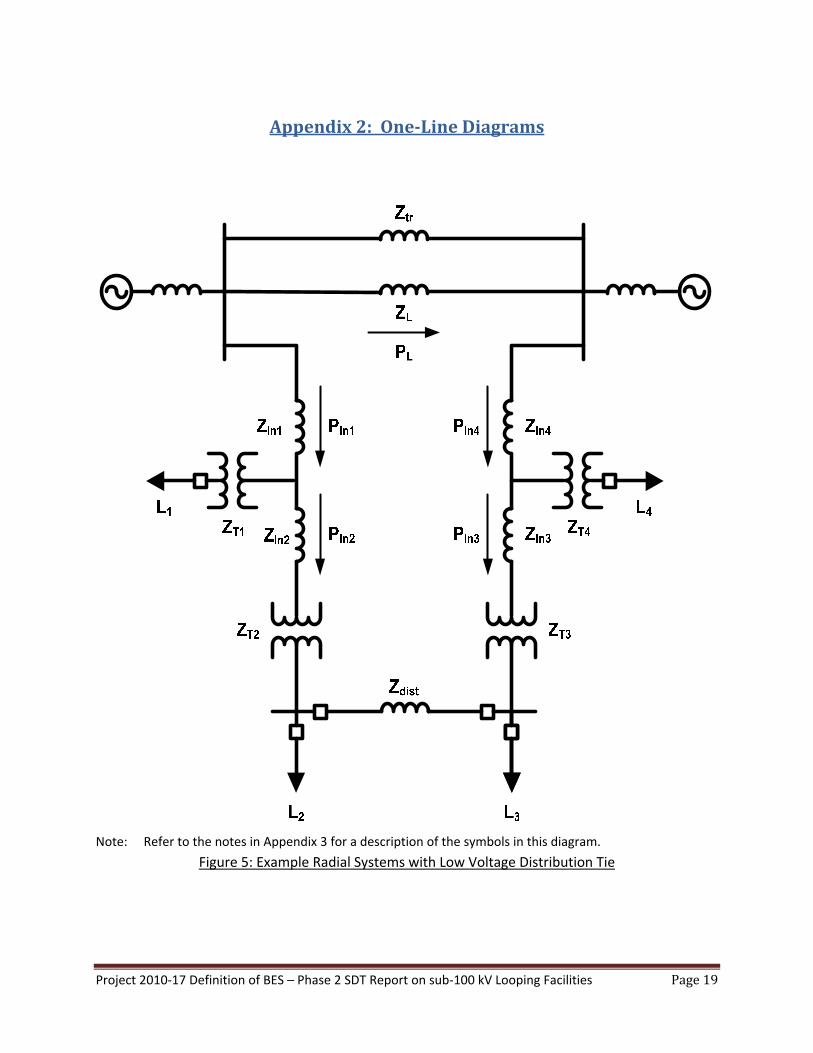
Appendix2:One‐LineDiagrams
Note: Refer to the notes in Appendix 3 for a description of the symbols in this diagram.
Figure 5: Example Radial Systems with Low Voltage Distribution Tie
Project 2010‐17 Definition of BES – Phase 2 SDT Report on sub‐100 kV Looping Facilities Page20
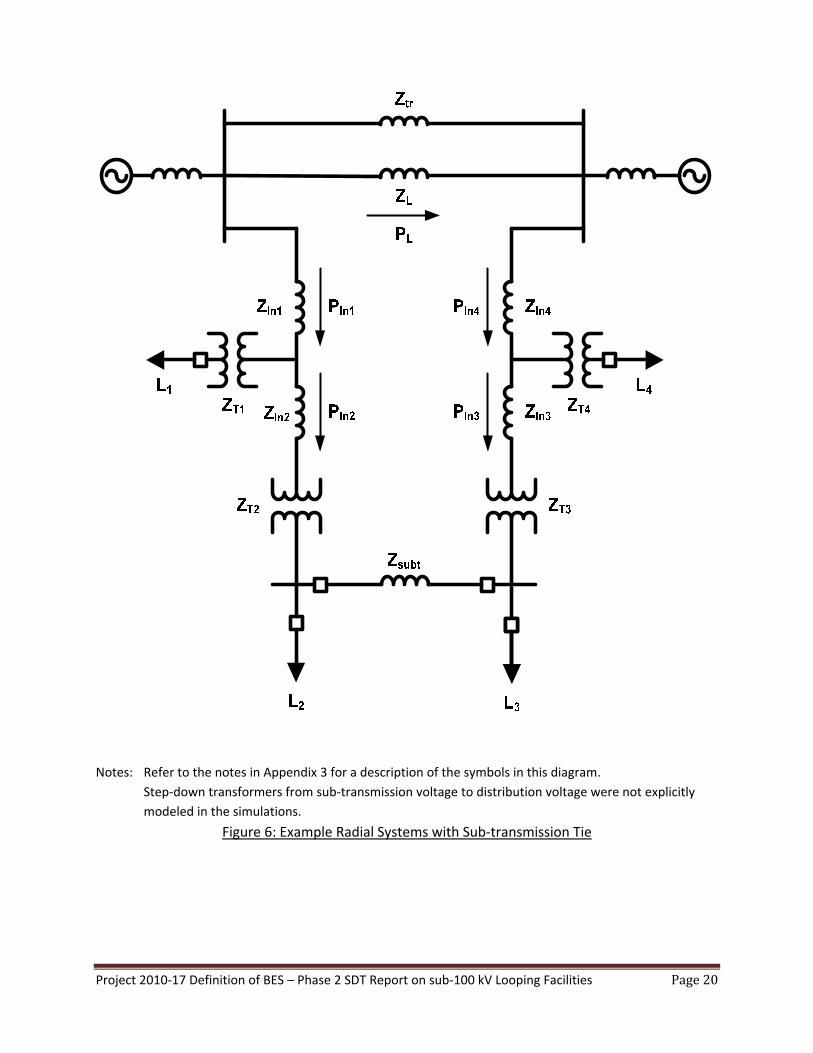
Notes: Refer to the notes in Appendix 3 for a description of the symbols in this diagram.
Step‐down transformers from sub‐transmission voltage to distribution voltage were not explicitly
modeled in the simulations.
Figure 6: Example Radial Systems with Sub‐transmission Tie
Project 2010‐17 Definition of BES – Phase 2 SDT Report on sub‐100 kV Looping Facilities Page21
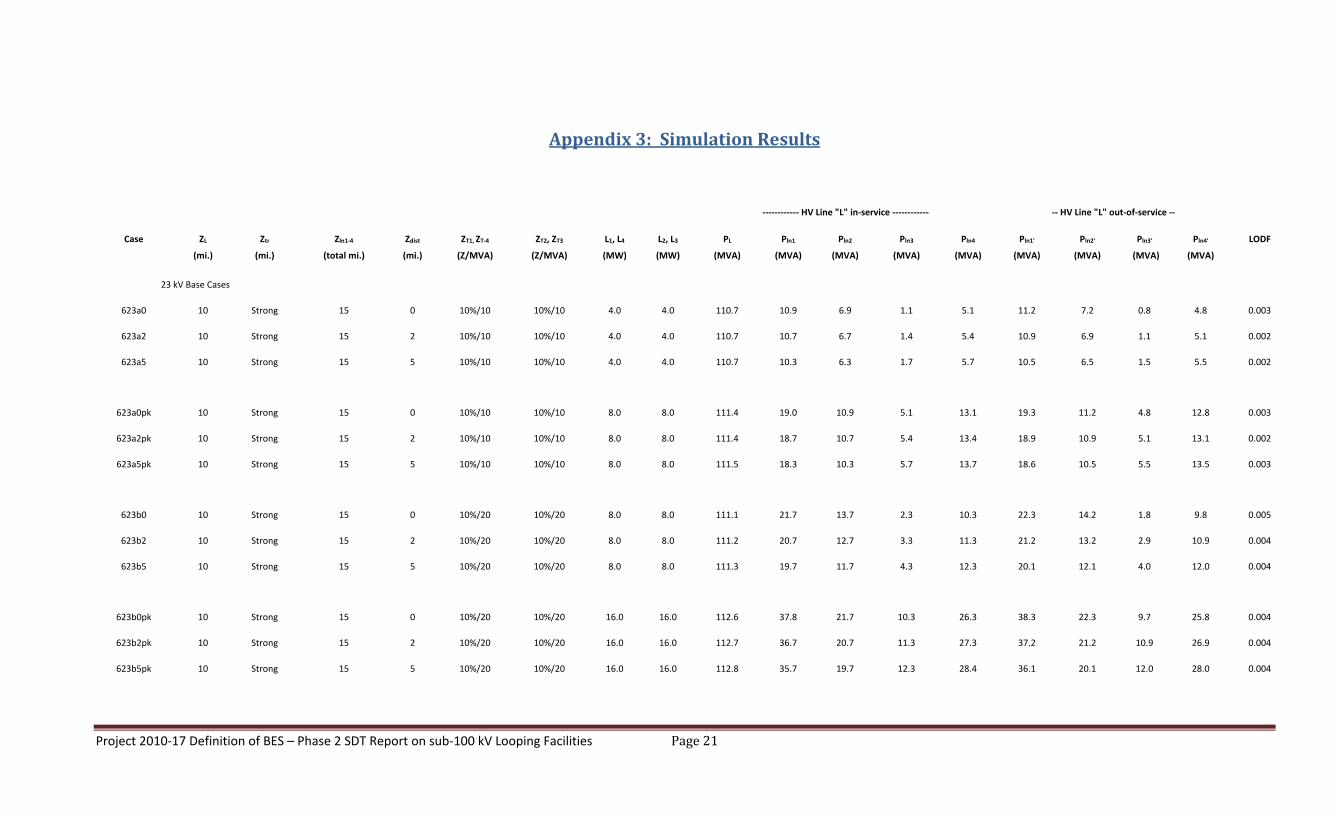
Appendix3:SimulationResults
‐‐‐‐‐‐‐‐‐‐‐‐ HV Line "L" in‐service ‐‐‐‐‐‐‐‐‐‐‐‐ ‐‐ HV Line "L" out‐of‐service ‐‐
Case ZL Ztr Zln1‐4 Zdist ZT1, ZT‐4 ZT2, ZT3 L1, L4 L2, L3 PL Pln1 Pln2 Pln3 Pln4 Pln1' Pln2' Pln3' Pln4' LODF
(mi.) (mi.) (total mi.) (mi.) (Z/MVA) (Z/MVA) (MW) (MW) (MVA) (MVA) (MVA) (MVA) (MVA) (MVA) (MVA) (MVA) (MVA)
23 kV Base Cases
623a0 10 Strong 15 0 10%/10 10%/10 4.0 4.0 110.7 10.9 6.9 1.1 5.1 11.2 7.2 0.8 4.8 0.003
623a2 10 Strong 15 2 10%/10 10%/10 4.0 4.0 110.7 10.7 6.7 1.4 5.4 10.9 6.9 1.1 5.1 0.002
623a5 10 Strong 15 5 10%/10 10%/10 4.0 4.0 110.7 10.3 6.3 1.7 5.7 10.5 6.5 1.5 5.5 0.002
623a0pk 10 Strong 15 0 10%/10 10%/10 8.0 8.0 111.4 19.0 10.9 5.1 13.1 19.3 11.2 4.8 12.8 0.003
623a2pk 10 Strong 15 2 10%/10 10%/10 8.0 8.0 111.4 18.7 10.7 5.4 13.4 18.9 10.9 5.1 13.1 0.002
623a5pk 10 Strong 15 5 10%/10 10%/10 8.0 8.0 111.5 18.3 10.3 5.7 13.7 18.6 10.5 5.5 13.5 0.003
623b0 10 Strong 15 0 10%/20 10%/20 8.0 8.0 111.1 21.7 13.7 2.3 10.3 22.3 14.2 1.8 9.8 0.005
623b2 10 Strong 15 2 10%/20 10%/20 8.0 8.0 111.2 20.7 12.7 3.3 11.3 21.2 13.2 2.9 10.9 0.004
623b5 10 Strong 15 5 10%/20 10%/20 8.0 8.0 111.3 19.7 11.7 4.3 12.3 20.1 12.1 4.0 12.0 0.004
623b0pk 10 Strong 15 0 10%/20 10%/20 16.0 16.0 112.6 37.8 21.7 10.3 26.3 38.3 22.3 9.7 25.8 0.004
623b2pk 10 Strong 15 2 10%/20 10%/20 16.0 16.0 112.7 36.7 20.7 11.3 27.3 37.2 21.2 10.9 26.9 0.004
623b5pk 10 Strong 15 5 10%/20 10%/20 16.0 16.0 112.8 35.7 19.7 12.3 28.4 36.1 20.1 12.0 28.0 0.004
Project 2010‐17 Definition of BES – Phase 2 SDT Report on sub‐100 kV Looping Facilities Page22
‐‐‐‐‐‐‐‐‐‐‐‐ HV Line "L" in‐service ‐‐‐‐‐‐‐‐‐‐‐‐ ‐‐ HV Line "L" out‐of‐service ‐‐
Case ZL Ztr Zln1‐4 Zdist ZT1, ZT‐4 ZT2, ZT3 L1, L4 L2, L3 PL Pln1 Pln2 Pln3 Pln4 Pln1' Pln2' Pln3' Pln4' LODF
(mi.) (mi.) (total mi.) (mi.) (Z/MVA) (Z/MVA) (MW) (MW) (MVA) (MVA) (MVA) (MVA) (MVA) (MVA) (MVA) (MVA) (MVA)
623c0 10 Strong 15 0 10%/40 10%/40 16.0 16.0 112.2 42.7 26.6 5.4 21.4 43.7 27.7 4.3 20.3 0.009
623c2 10 Strong 15 2 10%/40 10%/40 16.0 16.0 112.5 39.6 23.6 8.4 24.4 40.4 24.4 7.7 23.7 0.007
623c5 10 Strong 15 5 10%/40 10%/40 16.0 16.0 112.7 37.3 21.3 10.8 26.8 37.8 21.8 10.3 26.3 0.004
623c0pk 10 Strong 15 0 10%/40 10%/40 32.0 32.0 115.1 74.9 42.8 21.2 53.3 76.0 43.9 20.2 52.2 0.010
623c2pk 10 Strong 15 2 10%/40 10%/40 32.0 32.0 115.4 71.8 39.7 24.3 56.4 72.6 40.5 23.6 55.6 0.007
623c5pk 10 Strong 15 5 10%/40 10%/40 32.0 32.0 115.6 69.4 37.4 26.7 58.8 70.0 37.9 26.2 58.3 0.005
723a0 10 Medium 15 0 10%/10 10%/10 4.0 4.0 108.3 10.9 6.9 1.1 5.1 11.9 7.9 0.1 4.1 0.009
723a2 10 Medium 15 2 10%/10 10%/10 4.0 4.0 108.3 10.6 6.6 1.4 5.4 11.5 7.5 0.5 4.5 0.008
723a5 10 Medium 15 5 10%/10 10%/10 4.0 4.0 108.4 10.3 6.3 1.8 5.8 11.1 7.1 1.0 5.0 0.007
723a0pk 10 Medium 15 0 10%/10 10%/10 8.0 8.0 110.4 18.9 10.9 5.1 13.1 20.0 12.0 4.0 12.1 0.010
723a2pk 10 Medium 15 2 10%/10 10%/10 8.0 8.0 110.5 18.6 10.6 5.4 13.4 19.6 11.6 4.4 12.5 0.009
723a5pk 10 Medium 15 5 10%/10 10%/10 8.0 8.0 110.6 18.3 10.3 5.7 13.7 19.1 11.1 4.9 12.9 0.007
723b0 10 Medium 15 0 10%/20 10%/20 8.0 8.0 109.7 21.6 13.6 2.4 10.4 23.6 15.6 0.4 8.4 0.018
723b2 10 Medium 15 2 10%/20 10%/20 8.0 8.0 110.0 20.6 12.6 3.4 11.4 22.3 14.3 1.7 9.8 0.015
723b5 10 Medium 15 5 10%/20 10%/20 8.0 8.0 110.2 19.7 11.7 4.4 12.4 21.0 13.0 3.1 11.1 0.012
723b0pk 10 Medium 15 0 10%/20 10%/20 16.0 16.0 114.0 37.8 21.8 10.2 26.3 39.9 23.8 8.2 24.2 0.018
723b2pk 10 Medium 15 2 10%/20 10%/20 16.0 16.0 114.3 36.8 20.8 11.3 27.3 38.5 22.5 9.6 25.6 0.015
723b5pk 10 Medium 15 5 10%/20 10%/20 16.0 16.0 114.5 35.8 19.8 12.3 28.3 37.2 21.1 10.9 27.0 0.012
Project 2010‐17 Definition of BES – Phase 2 SDT Report on sub‐100 kV Looping Facilities Page23
‐‐‐‐‐‐‐‐‐‐‐‐ HV Line "L" in‐service ‐‐‐‐‐‐‐‐‐‐‐‐ ‐‐ HV Line "L" out‐of‐service ‐‐
Case ZL Ztr Zln1‐4 Zdist ZT1, ZT‐4 ZT2, ZT3 L1, L4 L2, L3 PL Pln1 Pln2 Pln3 Pln4 Pln1' Pln2' Pln3' Pln4' LODF
(mi.) (mi.) (total mi.) (mi.) (Z/MVA) (Z/MVA) (MW) (MW) (MVA) (MVA) (MVA) (MVA) (MVA) (MVA) (MVA) (MVA) (MVA)
723c0 10 Medium 15 0 10%/40 10%/40 16.0 16.0 112.6 42.7 26.7 5.3 21.3 46.5 31.4 1.6 17.6 0.034
723c2 10 Medium 15 2 10%/40 10%/40 16.0 16.0 113.5 39.7 23.7 8.4 24.4 42.4 26.4 5.7 21.7 0.024
723c5 10 Medium 15 5 10%/40 10%/40 16.0 16.0 114.1 37.4 21.4 10.7 26.7 39.3 23.3 8.8 24.8 0.017
723c0pk 10 Medium 15 0 10%/40 10%/40 32.0 32.0 121.2 75.5 43.4 20.7 52.7 79.5 47.4 16.7 48.7 0.033
723c2pk 10 Medium 15 2 10%/40 10%/40 32.0 32.0 122.0 72.2 40.1 23.9 55.9 75.2 43.1 21.1 53.1 0.025
723c5pk 10 Medium 15 5 10%/40 10%/40 32.0 32.0 122.7 69.8 37.7 26.4 58.5 71.8 39.7 24.4 56.5 0.016
823a0 10 Weak 15 0 10%/10 10%/10 4.0 4.0 106.1 10.8 6.8 1.2 5.2 12.9 8.9 ‐0.9 3.1 0.020
823a2 10 Weak 15 2 10%/10 10%/10 4.0 4.0 106.2 10.5 6.5 1.5 5.5 12.4 8.4 ‐0.4 3.6 0.018
823a5 10 Weak 15 5 10%/10 10%/10 4.0 4.0 106.4 10.2 62.0 1.8 5.8 11.9 7.9 0.2 4.2 0.016
823a0pk 10 Weak 15 0 10%/10 10%/10 8.0 8.0 109.6 18.9 10.9 5.1 13.1 21.1 13.0 3.0 11.0 0.020
823a2pk 10 Weak 15 2 10%/10 10%/10 8.0 8.0 109.7 18.6 10.6 5.4 13.4 20.6 12.6 3.5 11.5 0.018
823a5pk 10 Weak 15 5 10%/10 10%/10 8.0 8.0 109.8 18.3 10.3 5.7 13.8 20.0 12.0 4.0 12.1 0.015
823b0 10 Weak 15 0 10%/20 10%/20 8.0 8.0 108.4 21.5 13.5 2.5 10.5 25.6 17.6 ‐1.6 6.4 0.038
823b2 10 Weak 15 2 10%/20 10%/20 8.0 8.0 108.8 20.6 12.6 3.4 11.4 24.0 16.0 0.1 8.1 0.031
823b5 10 Weak 15 5 10%/20 10%/20 8.0 8.0 109.2 19.6 11.6 4.4 12.4 22.3 14.3 1.8 9.8 0.025
823b0pk 10 Weak 15 0 10%/20 10%/20 16.0 16.0 115.3 37.9 21.9 10.2 26.2 42.2 26.1 5.9 21.9 0.037
823b2pk 10 Weak 15 2 10%/20 10%/20 16.0 16.0 115.7 36.9 20.8 11.2 27.2 40.4 24.4 7.7 23.7 0.030
823b5pk 10 Weak 15 5 10%/20 10%/20 16.0 16.0 116.2 35.9 19.8 12.2 28.2 38.7 22.7 9.4 25.5 0.024
Project 2010‐17 Definition of BES – Phase 2 SDT Report on sub‐100 kV Looping Facilities Page24
‐‐‐‐‐‐‐‐‐‐‐‐ HV Line "L" in‐service ‐‐‐‐‐‐‐‐‐‐‐‐ ‐‐ HV Line "L" out‐of‐service ‐‐
Case ZL Ztr Zln1‐4 Zdist ZT1, ZT‐4 ZT2, ZT3 L1, L4 L2, L3 PL Pln1 Pln2 Pln3 Pln4 Pln1' Pln2' Pln3' Pln4' LODF
(mi.) (mi.) (total mi.) (mi.) (Z/MVA) (Z/MVA) (MW) (MW) (MVA) (MVA) (MVA) (MVA) (MVA) (MVA) (MVA) (MVA) (MVA)
823c0 10 Weak 15 0 10%/40 10%/40 16.0 16.0 113.1 42.7 26.7 5.3 21.3 50.3 34.3 ‐2.3 13.7 0.067
823c2 10 Weak 15 2 10%/40 10%/40 16.0 16.0 114.4 39.7 23.7 8.3 24.3 45.4 29.3 2.8 18.8 0.050
823c5 10 Weak 15 5 10%/40 10%/40 16.0 16.0 115.5 37.4 21.4 10.6 26.7 41.4 25.4 6.8 22.8 0.035
823c0pk 10 Weak 15 0 10%/40 10%/40 32.0 32.0 126.7 76.0 43.9 20.2 52.2 84.4 52.3 11.8 43.8 0.066
823c2pk 10 Weak 15 2 10%/40 10%/40 32.0 32.0 128.2 72.7 40.6 23.5 55.6 78.9 48.6 17.4 49.5 0.048
823c5pk 10 Weak 15 5 10%/40 10%/40 32.0 32.0 129.3 70.1 38.0 26.1 58.2 74.5 42.4 21.8 53.9 0.034
Sensitivity to Length of Lines 1‐4
723a0_30 10 Medium 30 0 10%/10 10%/10 4.0 4.0 108.3 10.8 6.8 1.2 5.2 11.8 7.8 0.2 4.2 0.009
723a2_30 10 Medium 30 2 10%/10 10%/10 4.0 4.0 108.4 10.5 6.5 1.5 5.5 11.4 7.4 0.6 4.6 0.008
723a5_30 10 Medium 30 5 10%/10 10%/10 4.0 4.0 108.5 10.2 6.2 1.8 5.8 11.0 7.0 1.0 5.0 0.007
Selected 34.5 kV cases
834a0 10 Weak 15 0 10%/10 10%/10 4.0 4.0 106.1 10.8 6.8 1.2 5.2 12.9 8.9 ‐0.9 3.1 0.020
834a2 10 Weak 15 2 10%/10 10%/10 4.0 4.0 106.1 10.7 6.7 1.3 5.3 12.7 8.7 ‐0.7 3.3 0.019
834a5 10 Weak 15 5 10%/10 10%/10 4.0 4.0 106.2 10.5 6.5 1.5 5.5 12.4 8.4 ‐0.4 3.6 0.018
834a0pk 10 Weak 15 0 10%/10 10%/10 8.0 8.0 109.6 18.9 10.9 5.1 13.1 21.1 13.0 3.0 11.0 0.020
834a2pk 10 Weak 15 2 10%/10 10%/10 8.0 8.0 109.6 18.8 10.8 5.2 13.3 20.8 12.8 3.2 11.2 0.018
834a5pk 10 Weak 15 5 10%/10 10%/10 8.0 8.0 109.7 18.6 10.6 5.4 13.4 20.5 12.5 3.5 11.5 0.017
834b0 10 Weak 15 0 10%/20 10%/20 8.0 8.0 108.4 21.5 13.5 2.5 10.5 25.6 17.6 ‐1.6 6.4 0.038
Project 2010‐17 Definition of BES – Phase 2 SDT Report on sub‐100 kV Looping Facilities Page25
‐‐‐‐‐‐‐‐‐‐‐‐ HV Line "L" in‐service ‐‐‐‐‐‐‐‐‐‐‐‐ ‐‐ HV Line "L" out‐of‐service ‐‐
Case ZL Ztr Zln1‐4 Zdist ZT1, ZT‐4 ZT2, ZT3 L1, L4 L2, L3 PL Pln1 Pln2 Pln3 Pln4 Pln1' Pln2' Pln3' Pln4' LODF
(mi.) (mi.) (total mi.) (mi.) (Z/MVA) (Z/MVA) (MW) (MW) (MVA) (MVA) (MVA) (MVA) (MVA) (MVA) (MVA) (MVA) (MVA)
834b2 10 Weak 15 2 10%/20 10%/20 8.0 8.0 108.6 21.1 13.1 2.9 10.9 24.8 16.8 ‐0.7 7.3 0.034
834b5 10 Weak 15 5 10%/20 10%/20 8.0 8.0 108.9 20.5 12.5 3.5 11.5 23.8 15.8 0.3 8.3 0.030
834b0pk 10 Weak 15 0 10%/20 10%/20 16.0 16.0 115.3 37.9 21.9 10.2 26.2 42.2 26.1 5.9 21.9 0.037
834b2pk 10 Weak 15 2 10%/20 10%/20 16.0 16.0 115.5 37.4 21.4 10.7 26.7 41.3 25.3 6.8 22.8 0.034
834b5pk 10 Weak 15 5 10%/20 10%/20 16.0 16.0 115.8 36.8 20.7 11.3 27.3 40.3 24.2 7.8 23.9 0.030
834c0 10 Weak 15 0 10%/40 10%/40 16.0 16.0 113.1 42.7 26.7 5.3 21.3 50.3 34.3 ‐2.3 13.7 0.067
834c2 10 Weak 15 2 10%/40 10%/40 16.0 16.0 113.8 41.2 25.2 6.9 22.9 47.8 31.7 0.4 16.4 0.058
834c5 10 Weak 15 5 10%/40 10%/40 16.0 16.0 114.6 39.5 23.5 8.5 24.6 45.0 29.0 3.2 19.2 0.048
834c0pk 10 Weak 15 0 10%/40 10%/40 32.0 32.0 126.7 76.0 43.9 20.2 52.2 84.4 52.3 11.8 43.8 0.066
834c2pk 10 Weak 15 2 10%/40 10%/40 32.0 32.0 127.5 74.2 42.1 21.9 54.0 81.5 49.4 14.7 46.8 0.057
834c5pk 10 Weak 15 5 10%/40 10%/40 32.0 32.0 128.3 72.4 40.3 23.8 55.8 78.5 46.4 17.9 49.9 0.048
834d0 10 Weak 15 0 7%/40 7%/40 16.0 16.0 111.6 46.3 30.3 1.7 17.7 56.2 40.1 ‐8.1 7.9 0.089
834d2 10 Weak 15 2 7%/40 7%/40 16.0 16.0 112.8 43.6 27.6 4.4 20.4 51.8 35.8 ‐3.6 12.4 0.073
834d5 10 Weak 15 5 7%/40 7%/40 16.0 16.0 113.9 41.1 25.1 7.0 23.0 47.6 31.6 0.6 16.6 0.057
834d0pk 10 Weak 15 0 7%/40 7%/40 32.0 32.0 124.9 80.0 47.9 16.2 48.2 90.9 58.8 5.3 37.3 0.087
834d2pk 10 Weak 15 2 7%/40 7%/40 32.0 32.0 126.3 77.0 44.9 19.2 51.2 86.1 54.0 10.2 42.2 0.072
834d5pk 10 Weak 15 5 7%/40 7%/40 32.0 32.0 127.5 74.2 42.1 22.0 54.1 81.4 49.3 15.0 47.0 0.056
Project 2010‐17 Definition of BES – Phase 2 SDT Report on sub‐100 kV Looping Facilities Page26
‐‐‐‐‐‐‐‐‐‐‐‐ HV Line "L" in‐service ‐‐‐‐‐‐‐‐‐‐‐‐ ‐‐ HV Line "L" out‐of‐service ‐‐
Case ZL Ztr Zln1‐4 Zdist ZT1, ZT‐4 ZT2, ZT3 L1, L4 L2, L3 PL Pln1 Pln2 Pln3 Pln4 Pln1' Pln2' Pln3' Pln4' LODF
(mi.) (mi.) (total mi.) (mi.) (Z/MVA) (Z/MVA) (MW) (MW) (MVA) (MVA) (MVA) (MVA) (MVA) (MVA) (MVA) (MVA) (MVA)
Selected 12.47 kV cases
812a0 10 Weak 15 0 10%/10 10%/10 4.0 4.0 106.1 10.8 6.8 1.2 5.2 12.9 8.9 ‐0.9 3.1 0.020
812a2 10 Weak 15 2 10%/10 10%/10 4.0 4.0 106.4 10.1 6.1 1.9 5.9 11.6 7.6 0.4 4.4 0.014
812a5 10 Weak 15 5 10%/10 10%/10 4.0 4.0 106.7 9.4 5.4 2.6 6.6 10.5 6.5 1.5 5.5 0.010
812a0pk 10 Weak 15 0 10%/10 10%/10 8.0 8.0 109.6 18.9 10.9 5.1 13.1 21.1 13.0 3.0 11.0 0.020
812a2pk 10 Weak 15 2 10%/10 10%/10 8.0 8.0 109.9 18.1 10.1 5.9 13.9 19.7 11.7 4.3 12.4 0.015
812a5pk 10 Weak 15 5 10%/10 10%/10 8.0 8.0 110.2 17.5 9.5 6.5 14.5 18.6 10.6 5.5 13.5 0.010
812b0 10 Weak 15 0 10%/20 10%/20 8.0 8.0 108.4 21.5 13.5 2.5 10.5 25.6 17.6 ‐1.6 6.4 0.038
812b2 10 Weak 15 2 10%/20 10%/20 8.0 8.0 109.4 19.2 11.2 4.8 12.8 21.7 13.6 2.5 10.5 0.023
812b5 10 Weak 15 5 10%/20 10%/20 8.0 8.0 110.0 17.9 9.9 6.1 14.1 19.4 11.4 4.7 12.7 0.014
812b0pk 10 Weak 15 0 10%/20 10%/20 16.0 16.0 115.3 37.9 21.9 10.2 26.2 42.2 26.1 5.9 21.9 0.037
812b2pk 10 Weak 15 2 10%/20 10%/20 16.0 16.0 116.4 35.4 19.4 12.6 28.6 38.0 22.0 10.2 26.2 0.022
812b5pk 10 Weak 15 5 10%/20 10%/20 16.0 16.0 117.0 34.1 18.0 14.0 30.0 35.6 19.6 12.6 28.6 0.013
812c0 10 Weak 15 0 10%/40 10%/40 16.0 16.0 113.1 42.7 26.7 5.3 21.3 50.3 34.3 ‐2.3 13.7 0.067
812c2 10 Weak 15 2 10%/40 10%/40 16.0 16.0 115.9 36.6 20.6 11.5 27.5 40.0 24.0 8.3 24.3 0.029
812c5 10 Weak 15 5 10%/40 10%/40 16.0 16.0 116.8 34.4 18.4 13.7 29.7 36.2 20.2 12.0 28.0 0.015
812c0pk 10 Weak 15 0 10%/40 10%/40 32.0 32.0 126.7 76.0 43.9 20.2 52.2 84.4 52.3 11.8 43.8 0.066
812c2pk 10 Weak 15 2 10%/40 10%/40 32.0 32.0 129.7 69.2 37.1 27.1 59.1 73.0 40.9 23.5 55.5 0.029
Project 2010‐17 Definition of BES – Phase 2 SDT Report on sub‐100 kV Looping Facilities Page27
‐‐‐‐‐‐‐‐‐‐‐‐ HV Line "L" in‐service ‐‐‐‐‐‐‐‐‐‐‐‐ ‐‐ HV Line "L" out‐of‐service ‐‐
Case ZL Ztr Zln1‐4 Zdist ZT1, ZT‐4 ZT2, ZT3 L1, L4 L2, L3 PL Pln1 Pln2 Pln3 Pln4 Pln1' Pln2' Pln3' Pln4' LODF
(mi.) (mi.) (total mi.) (mi.) (Z/MVA) (Z/MVA) (MW) (MW) (MVA) (MVA) (MVA) (MVA) (MVA) (MVA) (MVA) (MVA) (MVA)
812c5pk 10 Weak 15 5 10%/40 10%/40 32.0 32.0 130.8 66.7 34.7 29.4 61.5 68.8 36.7 27.6 59.6 0.016
Selected 46 kV cases
846e0 10 Weak 15 0 10%/40 7%/50 16.0 20.0 112.1 53.1 37.1 2.9 18.9 64.7 48.7 ‐8.6 7.4 0.103
846e2 10 Weak 15 2 10%/40 7%/50 16.0 20.0 113.2 50.7 34.7 5.3 21.3 60.9 44.8 ‐4.7 11.3 0.090
846e5 10 Weak 15 5 10%/40 7%/50 16.0 20.0 114.3 48.2 32.1 7.9 24.0 56.7 40.7 ‐0.4 15.6 0.074
Sub‐transmission cases
115‐69 kV
669f25 40 Strong 20 25 10%/40 7%/60 16.0 24.0 114.0 76.0 59.8 ‐10.8 5.2 79.6 63.4 ‐14.2 1.8 0.032
769f25 40 Medium 20 25 10%/40 7%/60 16.0 24.0 111.7 75.3 59.1 ‐10.1 5.9 87.3 71.0 ‐21.2 ‐5.2 0.107
869f25 40 Weak 20 25 10%/40 7%/60 16.0 24.0 109.8 74.7 58.5 ‐9.6 6.4 97.0 80.6 ‐30.0 ‐14.0 0.203
115‐55 kV
655e25 40 Strong 20 25 10%/40 7%/50 16.0 20.0 114.5 62.1 46.0 ‐5.0 11.0 64.8 48.7 ‐7.5 8.5 0.024
755e25 40 Medium 20 25 10%/40 7%/50 16.0 20.0 113.3 61.8 45.7 ‐4.8 11.2 70.9 54.8 ‐13.0 3.0 0.080
855e25 40 Weak 20 25 10%/40 7%/50 16.0 20.0 112.1 61.5 45.4 ‐4.5 11.5 79.1 62.9 ‐20.2 ‐4.2 0.157
855f25
115‐46 kV
646e25 40 Strong 20 25 10%/40 7%/50 16.0 20.0 115.0 57.3 41.2 ‐0.2 15.8 59.5 43.4 ‐2.1 13.9 0.019
746e25 40 Medium 20 25 10%/40 7%/50 16.0 20.0 114.6 57.2 41.2 ‐0.1 15.9 64.9 48.8 ‐6.8 9.2 0.067
846e25 40 Weak 20 25 10%/40 7%/50 16.0 20.0 114.2 57.2 41.1 0.0 16.0 72.4 56.2 ‐13.1 2.9 0.133
115‐34.5 kV
634d25 40 Strong 20 25 10%/40 7%/40 16.0 16.0 115.3 46.2 30.2 2.6 18.7 47.7 31.7 1.4 17.4 0.013
Project 2010‐17 Definition of BES – Phase 2 SDT Report on sub‐100 kV Looping Facilities Page28
‐‐‐‐‐‐‐‐‐‐‐‐ HV Line "L" in‐service ‐‐‐‐‐‐‐‐‐‐‐‐ ‐‐ HV Line "L" out‐of‐service ‐‐
Case ZL Ztr Zln1‐4 Zdist ZT1, ZT‐4 ZT2, ZT3 L1, L4 L2, L3 PL Pln1 Pln2 Pln3 Pln4 Pln1' Pln2' Pln3' Pln4' LODF
(mi.) (mi.) (total mi.) (mi.) (Z/MVA) (Z/MVA) (MW) (MW) (MVA) (MVA) (MVA) (MVA) (MVA) (MVA) (MVA) (MVA) (MVA)
734d25 40 Medium 20 25 10%/40 7%/40 16.0 16.0 115.4 46.3 30.2 2.6 18.6 51.5 35.5 ‐1.9 14.1 0.045
834d25 40 Weak 20 25 10%/40 7%/40 16.0 16.0 115.5 46.3 30.2 2.6 18.6 57.1 41.0 ‐6.4 9.6 0.094
138‐69 kV
869f25‐138 40 Weak 20 25 10%/40 7%/60 16.0 24.0 112.0 66.5 50.4 ‐1.8 14.2 84.0 67.9 ‐18.3 ‐2.3 0.156
869f25‐138' 40 Weak 20 25 10%/40 7%/60 16.0 24.0 131.9 71.1 55.0 ‐6.3 9.8 92.0 75.8 ‐25.6 ‐9.6 0.158
138‐55 kV
855e25‐138 40 Weak 20 25 10%/40 7%/50 16.0 20.0 113.5 55.1 39.0 1.5 17.5 68.4 52.3 ‐10.8 5.2 0.117
855e25‐138' 40 Weak 20 25 10%/40 7%/60 16.0 20.0 134.0 58.5 42.4 ‐1.7 14.3 74.4 58.3 ‐16.2 ‐0.2 0.119
161‐69 kV
869f25‐161 40 Weak 20 25 10%/40 7%/60 16.0 24.0 113.2 60.7 44.7 3.7 19.7 74.8 58.8 ‐9.8 6.2 0.125
869f25‐161' 40 Weak 20 25 10%/40 7%/60 16.0 24.0 153.0 68.0 52.0 ‐3.3 12.7 87.3 71.2 ‐21.4 ‐5.4 0.126
161‐55 kV
855e25‐161 40 Weak 20 25 10%/40 7%/50 16.0 20.0 114.1 50.7 34.7 5.6 21.6 61.1 45.1 ‐4.2 11.8 0.091
855e25‐161' 40 Weak 20 25 10%/40 7%/60 16.0 20.0 154.8 56.0 40.0 0.6 16.6 70.3 54.3 ‐12.6 3.4 0.092
230‐69 kV
869f25‐230 40 Weak 20 25 10%/40 7%/60 16.0 24.0 116.3 51.3 35.3 12.8 28.8 59.4 43.3 5.0 21.0 0.070
869f25‐230' 40 Weak 20 25 10%/40 7%/60 16.0 24.0 217.7 61.2 45.2 3.2 19.2 76.5 60.4 ‐11.4 4.7 0.070
230‐55 kV
855e25‐230 40 Weak 20 25 10%/40 7%/50 16.0 20.0 116.1 43.8 27.8 12.3 28.3 49.5 33.5 6.7 22.8 0.049
855e25‐230' 40 Weak 20 25 10%/40 7%/50 16.0 20.0 218.7 50.8 34.8 5.6 21.6 61.7 45.7 ‐4.7 11.3 0.050
Project 2010‐17 Definition of BES – Phase 2 SDT Report on sub‐100 kV Looping Facilities Page29
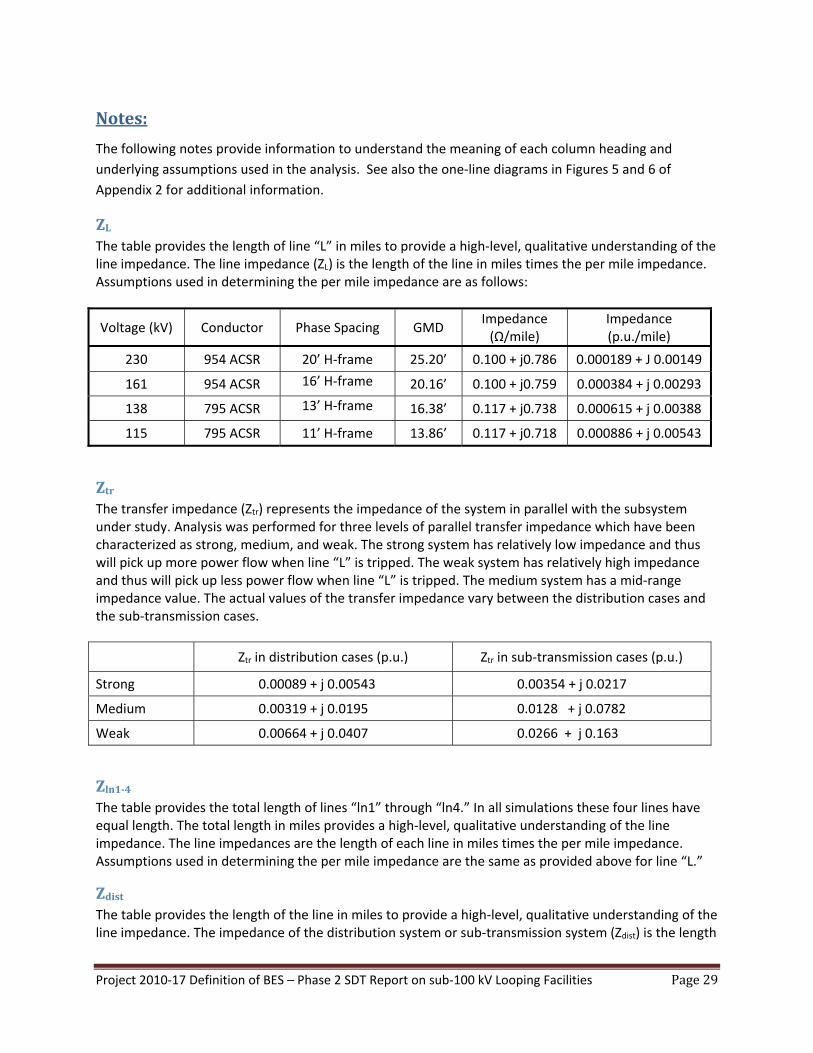
Notes:
The following notes provide information to understand the meaning of each column heading and
underlying assumptions used in the analysis. See also the one‐line diagrams in Figures 5 and 6 of
Appendix 2 for additional information.
ZLThe table provides the length of line “L” in miles to provide a high‐level, qualitative understanding of the line impedance. The line impedance (ZL) is the length of the line in miles times the per mile impedance. Assumptions used in determining the per mile impedance are as follows:
Voltage (kV) Conductor Phase Spacing GMD Impedance (Ω/mile)
Impedance (p.u./mile)
230 954 ACSR 20’ H‐frame 25.20’ 0.100 + j0.786 0.000189 + J 0.00149
161 954 ACSR 16’ H‐frame 20.16’ 0.100 + j0.759 0.000384 + j 0.00293
138 795 ACSR 13’ H‐frame 16.38’ 0.117 + j0.738 0.000615 + j 0.00388
115 795 ACSR 11’ H‐frame 13.86’ 0.117 + j0.718 0.000886 + j 0.00543
ZtrThe transfer impedance (Ztr) represents the impedance of the system in parallel with the subsystem under study. Analysis was performed for three levels of parallel transfer impedance which have been characterized as strong, medium, and weak. The strong system has relatively low impedance and thus will pick up more power flow when line “L” is tripped. The weak system has relatively high impedance and thus will pick up less power flow when line “L” is tripped. The medium system has a mid‐range impedance value. The actual values of the transfer impedance vary between the distribution cases and the sub‐transmission cases.
Ztr in distribution cases (p.u.) Ztr in sub‐transmission cases (p.u.)
Strong 0.00089 + j 0.00543 0.00354 + j 0.0217
Medium 0.00319 + j 0.0195 0.0128 + j 0.0782
Weak 0.00664 + j 0.0407 0.0266 + j 0.163
Zln1‐4The table provides the total length of lines “ln1” through “ln4.” In all simulations these four lines have equal length. The total length in miles provides a high‐level, qualitative understanding of the line impedance. The line impedances are the length of each line in miles times the per mile impedance. Assumptions used in determining the per mile impedance are the same as provided above for line “L.”
ZdistThe table provides the length of the line in miles to provide a high‐level, qualitative understanding of the line impedance. The impedance of the distribution system or sub‐transmission system (Zdist) is the length
Project 2010‐17 Definition of BES – Phase 2 SDT Report on sub‐100 kV Looping Facilities Page30
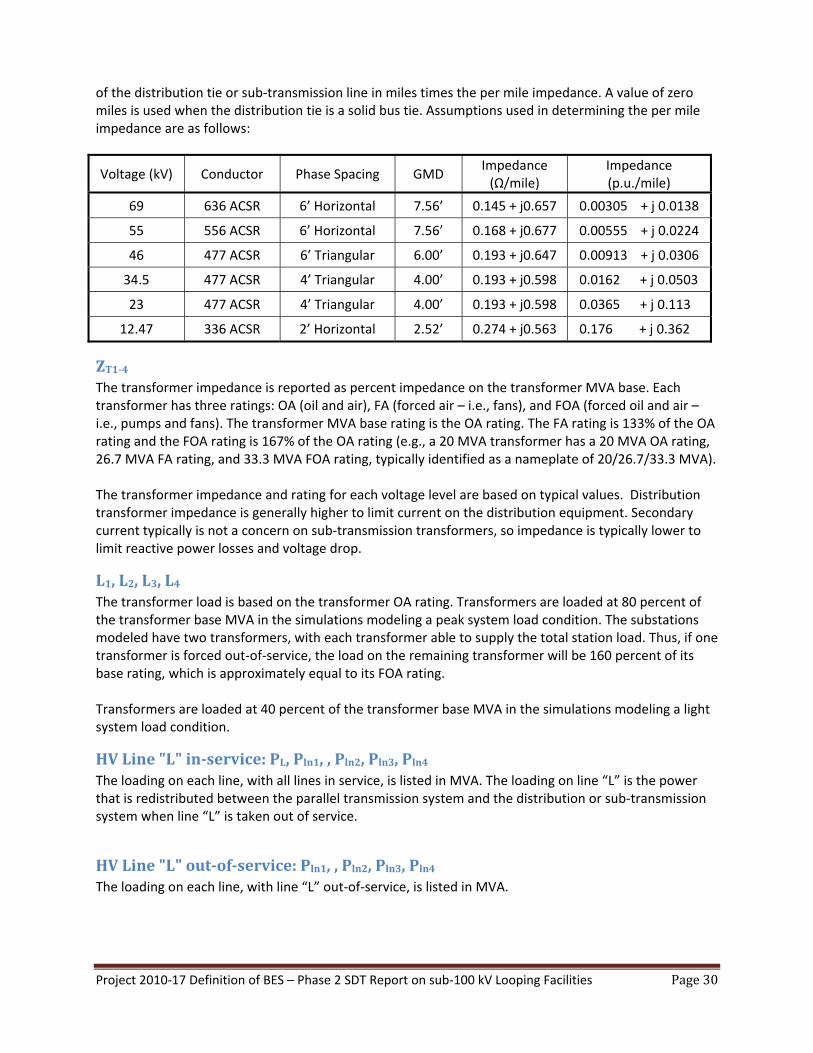
of the distribution tie or sub‐transmission line in miles times the per mile impedance. A value of zero miles is used when the distribution tie is a solid bus tie. Assumptions used in determining the per mile impedance are as follows:
Voltage (kV) Conductor Phase Spacing GMD Impedance (Ω/mile)
Impedance (p.u./mile)
69 636 ACSR 6’ Horizontal 7.56’ 0.145 + j0.657 0.00305 + j 0.0138
55 556 ACSR 6’ Horizontal 7.56’ 0.168 + j0.677 0.00555 + j 0.0224
46 477 ACSR 6’ Triangular 6.00’ 0.193 + j0.647 0.00913 + j 0.0306
34.5 477 ACSR 4’ Triangular 4.00’ 0.193 + j0.598 0.0162 + j 0.0503
23 477 ACSR 4’ Triangular 4.00’ 0.193 + j0.598 0.0365 + j 0.113
12.47 336 ACSR 2’ Horizontal 2.52’ 0.274 + j0.563 0.176 + j 0.362
ZT1‐4The transformer impedance is reported as percent impedance on the transformer MVA base. Each transformer has three ratings: OA (oil and air), FA (forced air – i.e., fans), and FOA (forced oil and air – i.e., pumps and fans). The transformer MVA base rating is the OA rating. The FA rating is 133% of the OA rating and the FOA rating is 167% of the OA rating (e.g., a 20 MVA transformer has a 20 MVA OA rating, 26.7 MVA FA rating, and 33.3 MVA FOA rating, typically identified as a nameplate of 20/26.7/33.3 MVA). The transformer impedance and rating for each voltage level are based on typical values. Distribution transformer impedance is generally higher to limit current on the distribution equipment. Secondary current typically is not a concern on sub‐transmission transformers, so impedance is typically lower to limit reactive power losses and voltage drop.
L1,L2,L3,L4The transformer load is based on the transformer OA rating. Transformers are loaded at 80 percent of the transformer base MVA in the simulations modeling a peak system load condition. The substations modeled have two transformers, with each transformer able to supply the total station load. Thus, if one transformer is forced out‐of‐service, the load on the remaining transformer will be 160 percent of its base rating, which is approximately equal to its FOA rating. Transformers are loaded at 40 percent of the transformer base MVA in the simulations modeling a light system load condition.
HVLine"L"in‐service:PL,Pln1,,Pln2,Pln3,Pln4The loading on each line, with all lines in service, is listed in MVA. The loading on line “L” is the power that is redistributed between the parallel transmission system and the distribution or sub‐transmission system when line “L” is taken out of service.
HVLine"L"out‐of‐service:Pln1,,Pln2,Pln3,Pln4The loading on each line, with line “L” out‐of‐service, is listed in MVA.
Project 2010‐17 Definition of BES – Phase 2 SDT Report on sub‐100 kV Looping Facilities Page31
LODFThe Line Outage Distribution Factor (LODF) is the fraction of the load on line “L” that is picked up on the distribution or sub‐transmission system. This information is included for illustrative purposes to understand the analysis, but was not used in identifying the voltage threshold for Exclusion E1.
Project 2010‐17 Definition of BES – Phase 2 SDT Report on sub‐100 kV Looping Facilities Page32
Appendix4:SummaryofLoopFlowIssueThroughSystems<50kV
In the course of developing ‘real‐world’ scenarios for the analysis of potential sub‐100 kV loop flows, the
Standard Drafting Team found that the industry has employed various measures to minimize the subject
loop flows. Some of these methods that were found to be applied by entities on sub‐100 kV loop
systems are described below. However, it is important to note that the presence of the equipment in
the following examples does not remove or lessen an entity’s obligations associated with the bright‐line
application of the Bulk Electric System (BES) definition.
Sustained power flow through substation power transformers and low voltage loops is generally
undesirable and, in some instances injurious. For this reason, power system engineers typically address
this issue in their design, operating, and planning criteria and apply methods to prevent this condition
from occurring. The high impedance of transformers and low voltage elements inherently prevent
excessive flow, but in many instances this flow can exceed ratings of equipment. For these reasons
entities develop control schemes, add relaying, and provide operational and planning guidelines to
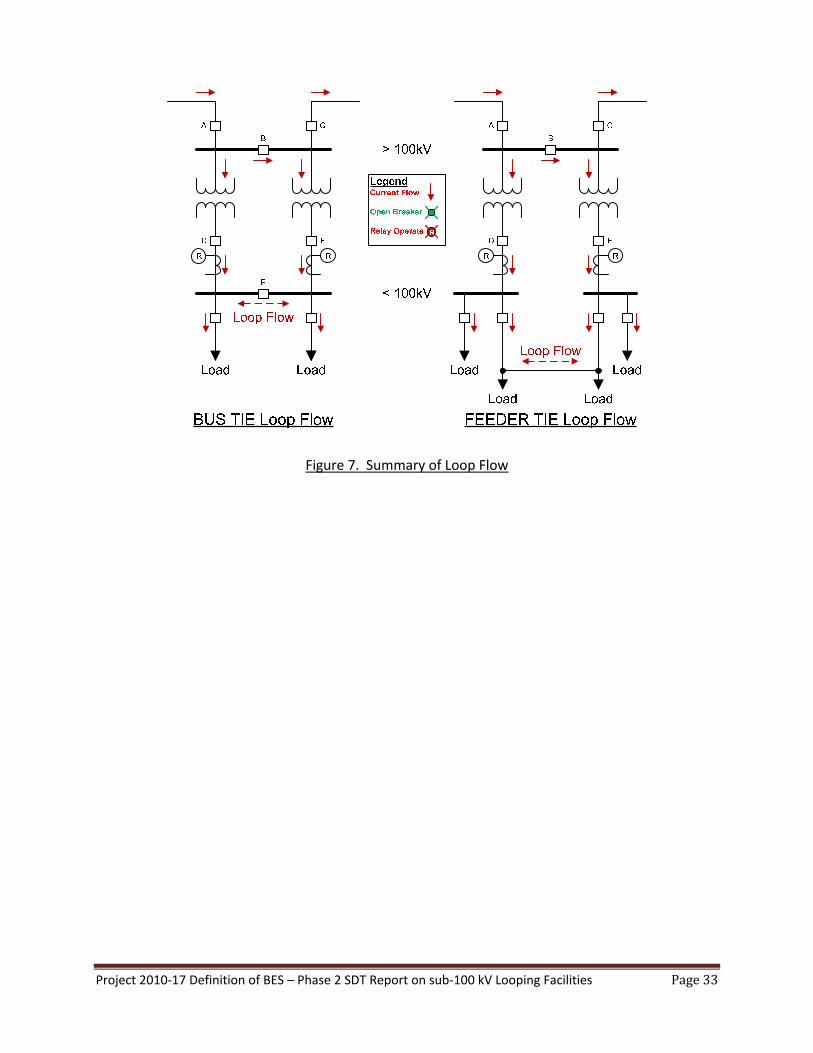
prevent this loop flow. Figure 7 depicts two systems that could provide a possible loop flow across the
low voltage system and back up to the high voltage system. The loop flow in these diagrams is increased
when the breaker on the high voltage side (breaker B) is opened.
The diagrams presented below depict a generic power system. The higher voltage and lower voltage
circuit breakers and bus arrangements will, in practice, vary (i.e., straight bus, half‐breaker, ring bus,
breaker‐and‐a‐half, etc.), but the concepts remain the same.
Specifically, Figure 7, shown below, depicts segments of an electrical power system. They consist of a
greater than 100 kV system and a sub‐100 kV system. Figure 7 depicts the power flow through the
electrical system under the condition that all circuit breakers are closed (normal condition). In the event
that circuit breaker B opens (i.e., manually, supervisory control, or protective device operation) and (1)
and either of the sub‐100 kV line circuit breakers (A or C) or (2) either of the low‐side transformer circuit
breakers (D or F) or (3) the low‐side bus tie circuit breaker (E) does not open, a condition could occur
where some amount of flow will occur through the sub‐100 kV system to the greater than 100 kV
system. This flow is severely limited by the high impedance of the two transformers in series and the
sub‐100 kV system impedance. This condition, however, may be deemed undesirable from an
equipment standpoint and precautions may be taken to prevent it. Subsequent sections of this appendix
show some of the physical schemes that entities can employ in this regard.
Project 2010‐17 Definition of BES – Phase 2 SDT Report on sub‐100 kV Looping Facilities Page33
Figure 7. Summary of Loop Flow
Project 2010‐17 Definition of BES – Phase 2 SDT Report on sub‐100 kV Looping Facilities Page34
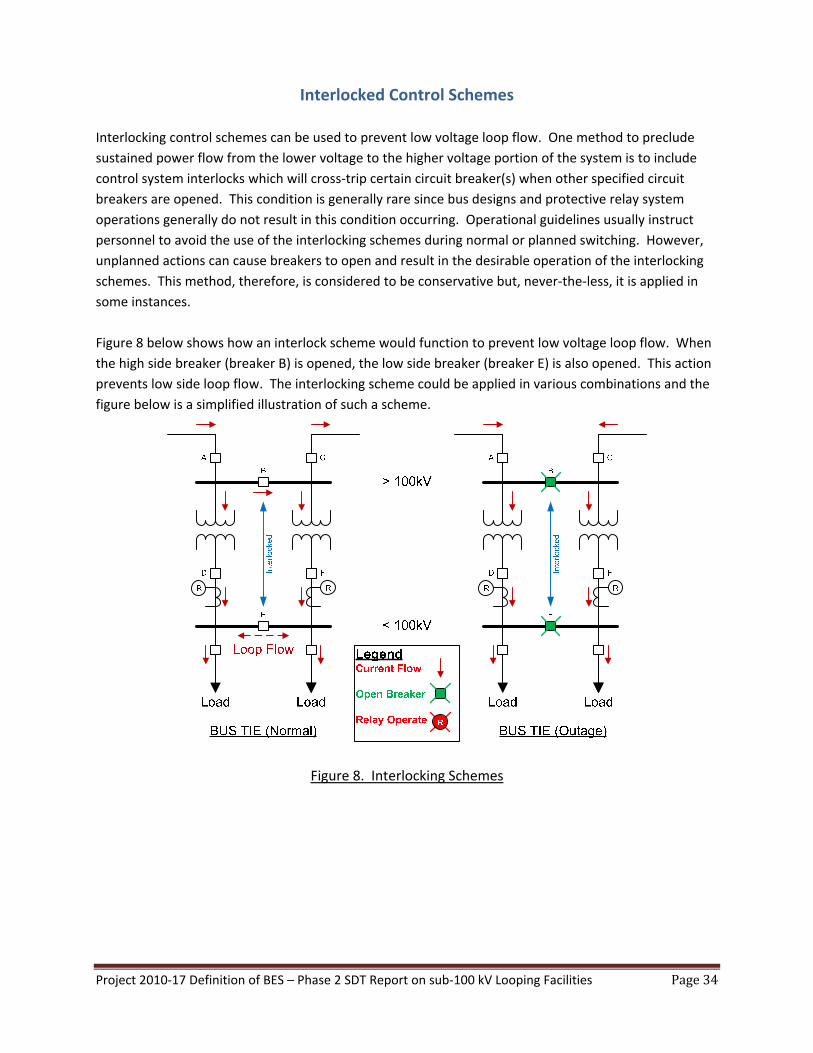
Interlocked Control Schemes
Interlocking control schemes can be used to prevent low voltage loop flow. One method to preclude
sustained power flow from the lower voltage to the higher voltage portion of the system is to include
control system interlocks which will cross‐trip certain circuit breaker(s) when other specified circuit
breakers are opened. This condition is generally rare since bus designs and protective relay system
operations generally do not result in this condition occurring. Operational guidelines usually instruct
personnel to avoid the use of the interlocking schemes during normal or planned switching. However,
unplanned actions can cause breakers to open and result in the desirable operation of the interlocking
schemes. This method, therefore, is considered to be conservative but, never‐the‐less, it is applied in
some instances.
Figure 8 below shows how an interlock scheme would function to prevent low voltage loop flow. When
the high side breaker (breaker B) is opened, the low side breaker (breaker E) is also opened. This action
prevents low side loop flow. The interlocking scheme could be applied in various combinations and the
figure below is a simplified illustration of such a scheme.
Figure 8. Interlocking Schemes
Project 2010‐17 Definition of BES – Phase 2 SDT Report on sub‐100 kV Looping Facilities Page35
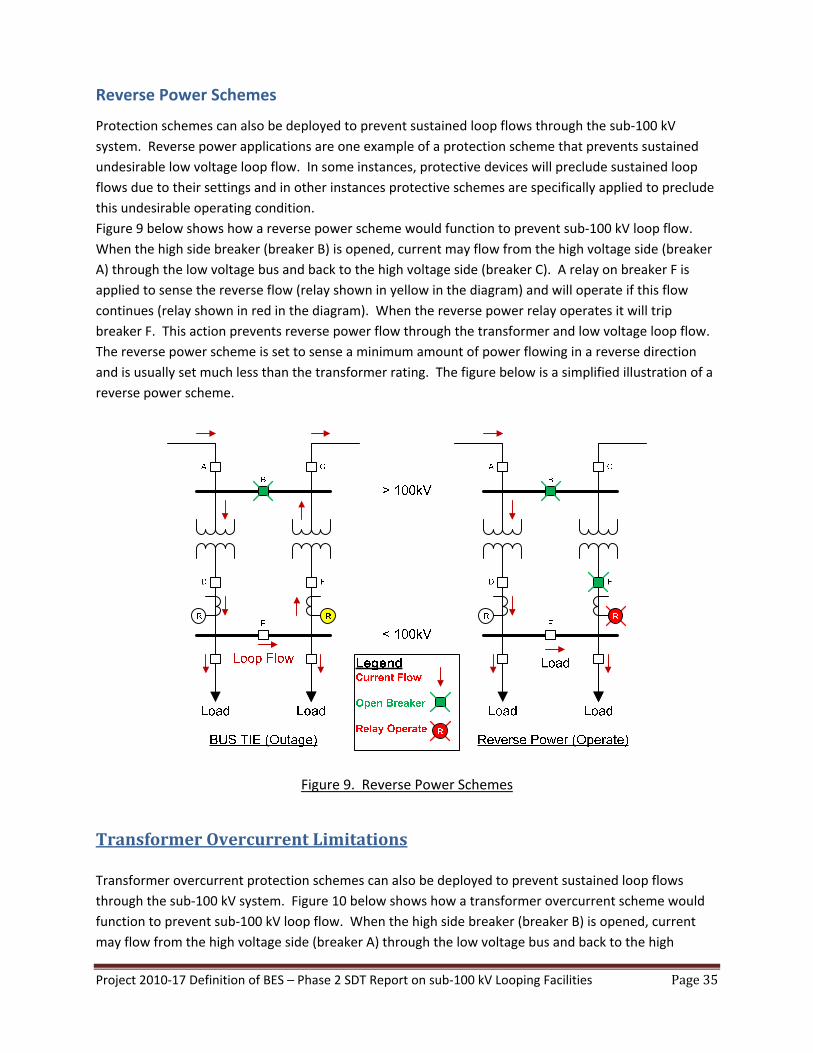
Reverse Power Schemes
Protection schemes can also be deployed to prevent sustained loop flows through the sub‐100 kV
system. Reverse power applications are one example of a protection scheme that prevents sustained
undesirable low voltage loop flow. In some instances, protective devices will preclude sustained loop
flows due to their settings and in other instances protective schemes are specifically applied to preclude
this undesirable operating condition.
Figure 9 below shows how a reverse power scheme would function to prevent sub‐100 kV loop flow.
When the high side breaker (breaker B) is opened, current may flow from the high voltage side (breaker
A) through the low voltage bus and back to the high voltage side (breaker C). A relay on breaker F is
applied to sense the reverse flow (relay shown in yellow in the diagram) and will operate if this flow
continues (relay shown in red in the diagram). When the reverse power relay operates it will trip
breaker F. This action prevents reverse power flow through the transformer and low voltage loop flow.
The reverse power scheme is set to sense a minimum amount of power flowing in a reverse direction
and is usually set much less than the transformer rating. The figure below is a simplified illustration of a
reverse power scheme.
Figure 9. Reverse Power Schemes
TransformerOvercurrentLimitations
Transformer overcurrent protection schemes can also be deployed to prevent sustained loop flows
through the sub‐100 kV system. Figure 10 below shows how a transformer overcurrent scheme would
function to prevent sub‐100 kV loop flow. When the high side breaker (breaker B) is opened, current
may flow from the high voltage side (breaker A) through the low voltage bus and back to the high
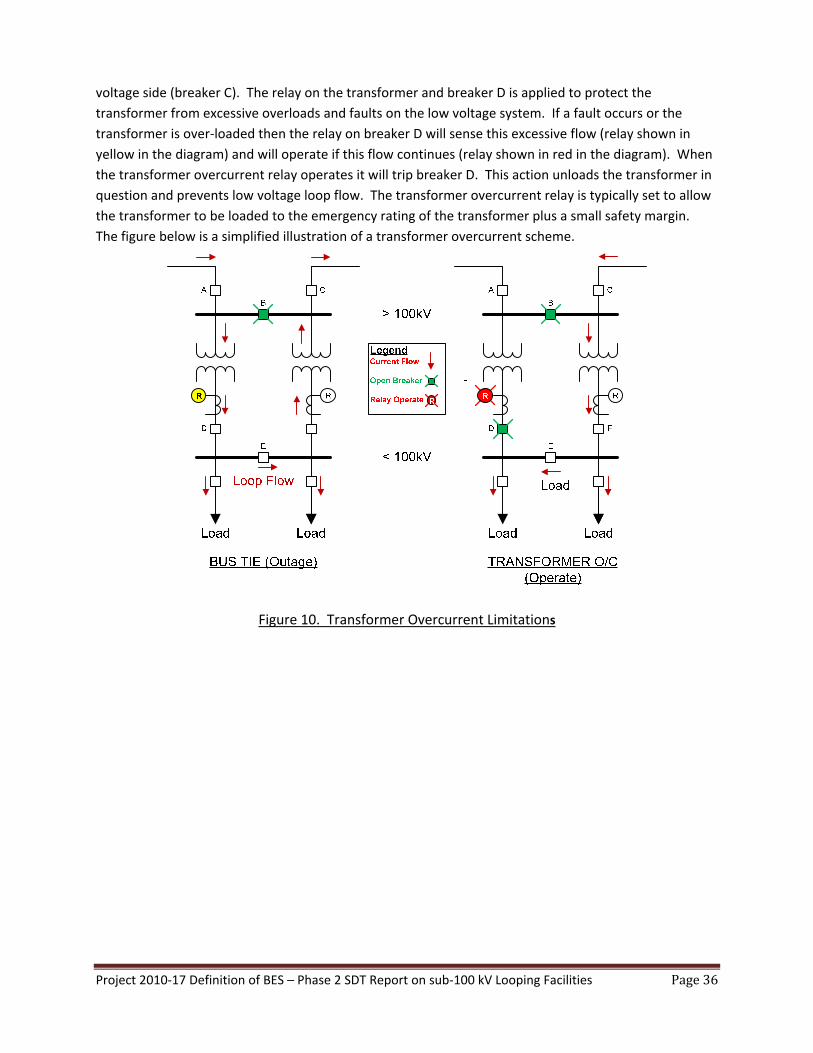
Project 2010‐17 Definition of BES – Phase 2 SDT Report on sub‐100 kV Looping Facilities Page36
voltage side (breaker C). The relay on the transformer and breaker D is applied to protect the
transformer from excessive overloads and faults on the low voltage system. If a fault occurs or the
transformer is over‐loaded then the relay on breaker D will sense this excessive flow (relay shown in
yellow in the diagram) and will operate if this flow continues (relay shown in red in the diagram). When
the transformer overcurrent relay operates it will trip breaker D. This action unloads the transformer in
question and prevents low voltage loop flow. The transformer overcurrent relay is typically set to allow
the transformer to be loaded to the emergency rating of the transformer plus a small safety margin.
The figure below is a simplified illustration of a transformer overcurrent scheme.
Figure 10. Transformer Overcurrent Limitations
Project 2010‐17 Definition of BES – Phase 2 SDT Report on sub‐100 kV Looping Facilities Page37
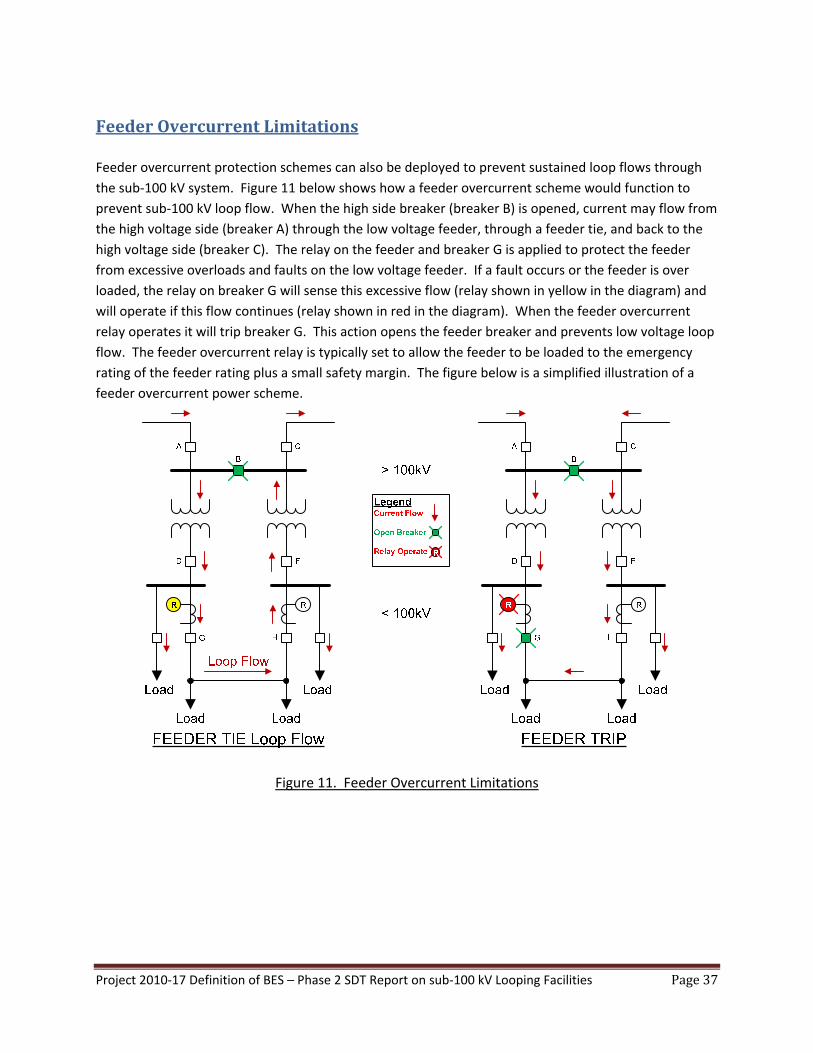
FeederOvercurrentLimitations
Feeder overcurrent protection schemes can also be deployed to prevent sustained loop flows through
the sub‐100 kV system. Figure 11 below shows how a feeder overcurrent scheme would function to
prevent sub‐100 kV loop flow. When the high side breaker (breaker B) is opened, current may flow from
the high voltage side (breaker A) through the low voltage feeder, through a feeder tie, and back to the
high voltage side (breaker C). The relay on the feeder and breaker G is applied to protect the feeder
from excessive overloads and faults on the low voltage feeder. If a fault occurs or the feeder is over
loaded, the relay on breaker G will sense this excessive flow (relay shown in yellow in the diagram) and
will operate if this flow continues (relay shown in red in the diagram). When the feeder overcurrent
relay operates it will trip breaker G. This action opens the feeder breaker and prevents low voltage loop
flow. The feeder overcurrent relay is typically set to allow the feeder to be loaded to the emergency
rating of the feeder rating plus a small safety margin. The figure below is a simplified illustration of a
feeder overcurrent power scheme.
Figure 11. Feeder Overcurrent Limitations
Project 2010‐17 Definition of BES – Phase 2 SDT Report on sub‐100 kV Looping Facilities Page38
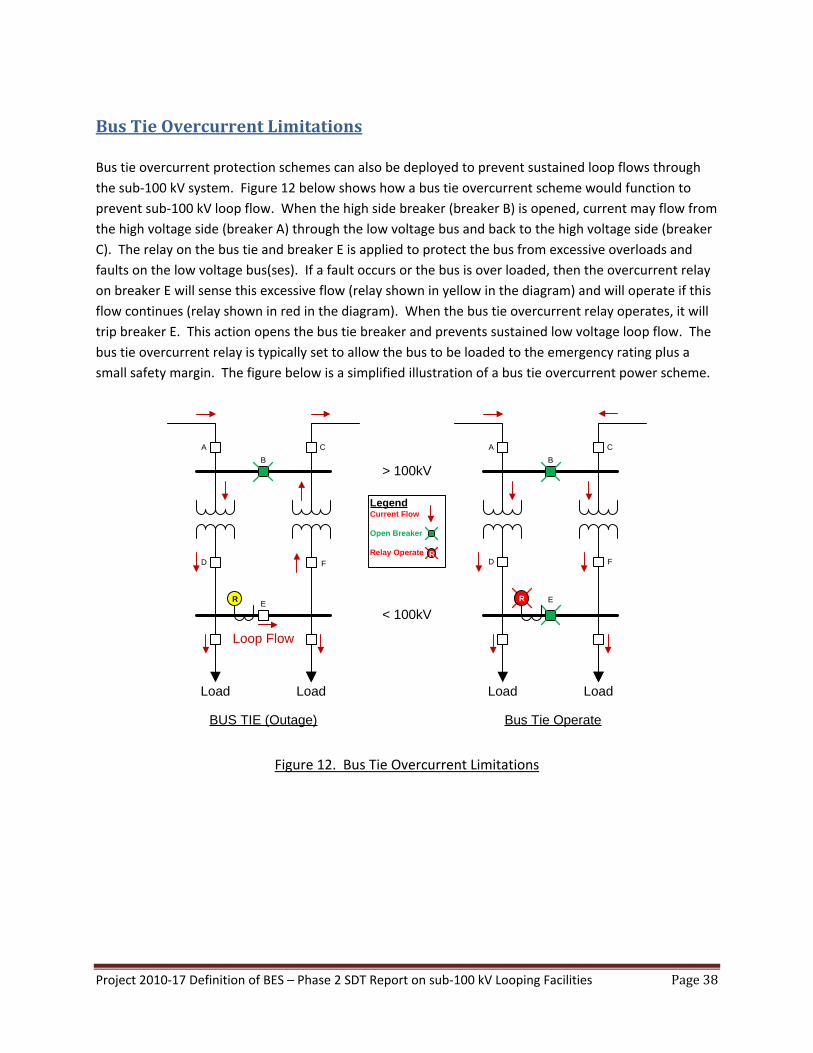
BusTieOvercurrentLimitations
Bus tie overcurrent protection schemes can also be deployed to prevent sustained loop flows through
the sub‐100 kV system. Figure 12 below shows how a bus tie overcurrent scheme would function to
prevent sub‐100 kV loop flow. When the high side breaker (breaker B) is opened, current may flow from
the high voltage side (breaker A) through the low voltage bus and back to the high voltage side (breaker
C). The relay on the bus tie and breaker E is applied to protect the bus from excessive overloads and
faults on the low voltage bus(ses). If a fault occurs or the bus is over loaded, then the overcurrent relay
on breaker E will sense this excessive flow (relay shown in yellow in the diagram) and will operate if this
flow continues (relay shown in red in the diagram). When the bus tie overcurrent relay operates, it will
trip breaker E. This action opens the bus tie breaker and prevents sustained low voltage loop flow. The
bus tie overcurrent relay is typically set to allow the bus to be loaded to the emergency rating plus a
small safety margin. The figure below is a simplified illustration of a bus tie overcurrent power scheme.
R
A
F
E
D
C
BUS TIE (Outage)
Loop Flow
LoadLoad
> 100kV
< 100kV
A
B
F
E
D
C
LoadLoad
Bus Tie Operate
R
B
LegendCurrent Flow
Open Breaker
Relay Operate R
Figure 12. Bus Tie Overcurrent Limitations
Project 2010‐17 Definition of BES – Phase 2 SDT Report on sub‐100 kV Looping Facilities Page39
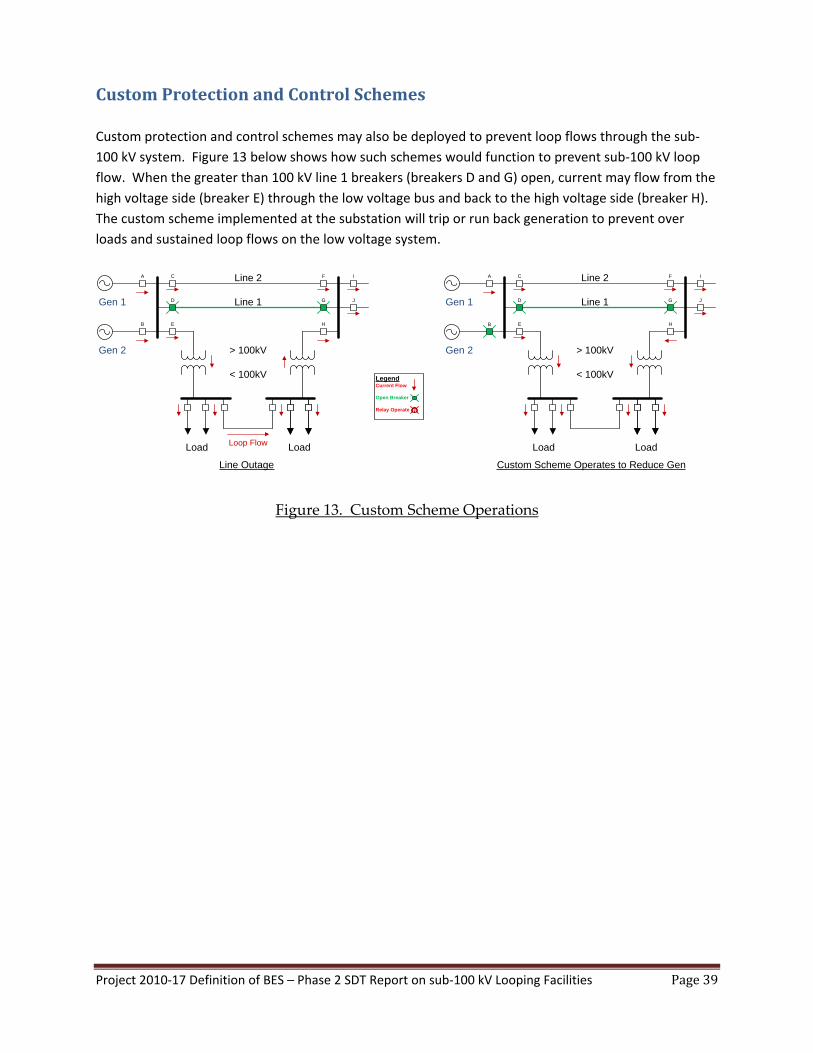
CustomProtectionandControlSchemes
Custom protection and control schemes may also be deployed to prevent loop flows through the sub‐
100 kV system. Figure 13 below shows how such schemes would function to prevent sub‐100 kV loop
flow. When the greater than 100 kV line 1 breakers (breakers D and G) open, current may flow from the
high voltage side (breaker E) through the low voltage bus and back to the high voltage side (breaker H).
The custom scheme implemented at the substation will trip or run back generation to prevent over
loads and sustained loop flows on the low voltage system.
< 100kV
Load Load
> 100kV
Line 1
Line 2
Gen 1
A
B
C
E
F
G
H
I
J
Gen 2
Loop Flow
D
< 100kV
Load Load
> 100kV
Line 1
Line 2
Gen 1
A C
E
F
G
H
I
J
Gen 2
D
B
Line Outage
LegendCurrent Flow
Open Breaker
Relay Operate R
Custom Scheme Operates to Reduce Gen
Figure 13. Custom Scheme Operations
Project 2010‐17 Definition of BES – Phase 2 SDT Report on sub‐100 kV Looping Facilities Page40
Appendix4Summary
The issues and methods described in Appendix 4 are reflective of why, in most instances, conditions of
sustained loop flows through sub‐100 kV systems are alleviated. When the low voltage is much less
than 100 kV, the design considerations shown above become even more pertinent and preventative
methods are employed; BES reliability is not the main concern, protecting the equipment from physical
damage is the primary concern. In the vast majority of cases, robust planning and operating criteria and
procedures will alleviate any concerns regarding sustained loop flows.