Embed Size (px)
Citation preview

White paper
MR-only RT planning for the brain and pelvis with Synthetic CT

Over the past decades, the use of magnetic resonance (MR) imaging to support radiation therapy (RT) treatment planning has increased significantly. As an example, MRI utilization in RT treatment planning in the United States increased from 6 % to 24 % between 2006 and 2017 [1]. This growing trend can be attributed in part to the superior soft-tissue contrast of MRI compared to CT imaging. This can potentially allow more accurate delineation not only of a patient’s target volume, but also of the surrounding organs at risk (OARs), as indicated in Figures 1 and 2a. MR imaging can additionally offer information on tumor activity such as cellular density and tumor biology with functional imaging, Figure 2b.
Until now, the inherent limitation of MR imaging for RT planning compared to CT imaging has been its inability to provide the electron density information that is needed for dose calculation in a treatment planning system. CT imaging provides it, therefore CT has been utilized in almost 100 % of RT planning [1].
To benefit most from the additional information that MR can provide, clinical institutions are increasingly including MR images in their workflow. Until recently, the required electron density information could only be provided by CT imaging. Therefore, a combined workflow is used that includes both traditional CT simulation for dose calculation and MR imaging for superior and more precise delineation of targets and surrounding soft tissue (OARs) is the current standard when using MR images for radiotherapy.
A combined MR and CT workflow includes image registration to align the images from both modalities to the same coordinate system. The target volumes and some OARs defined in the MR image can then be transferred to the CT image, in which the plan optimization and the dose calculation can be performed. In summary, the electron density information required for accurate dose calculation and the digitally reconstructed radiographs (DRR) used for patient positioning are obtained from the CT scan and excellent soft-tissue contrast as well as functional imaging for contouring and treatment assessment are provided by MR imaging. However, several challenges arise from a combined MR and CT workflow. These challenges include:
• Accurate image registration between MR and CT, given that the two images contain different information that make it challenging to identify common features
• Patient scheduling: due to organs filling over time and other physiological processes, imaging slots need to be booked close to one another
• Financial issues such as bundled reimbursement schemes not awarding the use of additional imaging in the course of a patient's radiotherapy treatment
2A
2B
2 (2A) MR image of prostate with superior soft-tissue contrast for more accurate delineation of the prostate, surrounding organs at risk, and lesion (indicated by an arrow) (2B) Anatomical MR image with diffusion weighted imaging overlaid showing an area of strongly restricted diffusion, suggesting active tumor Images courtesy of Radiologische Allianz, Hamburg, Germany
1
1 CT image of prostate provides electron density information for dose calculation
2
MR-only RT planning for brain and pelvis with Synthetic CT · White paper
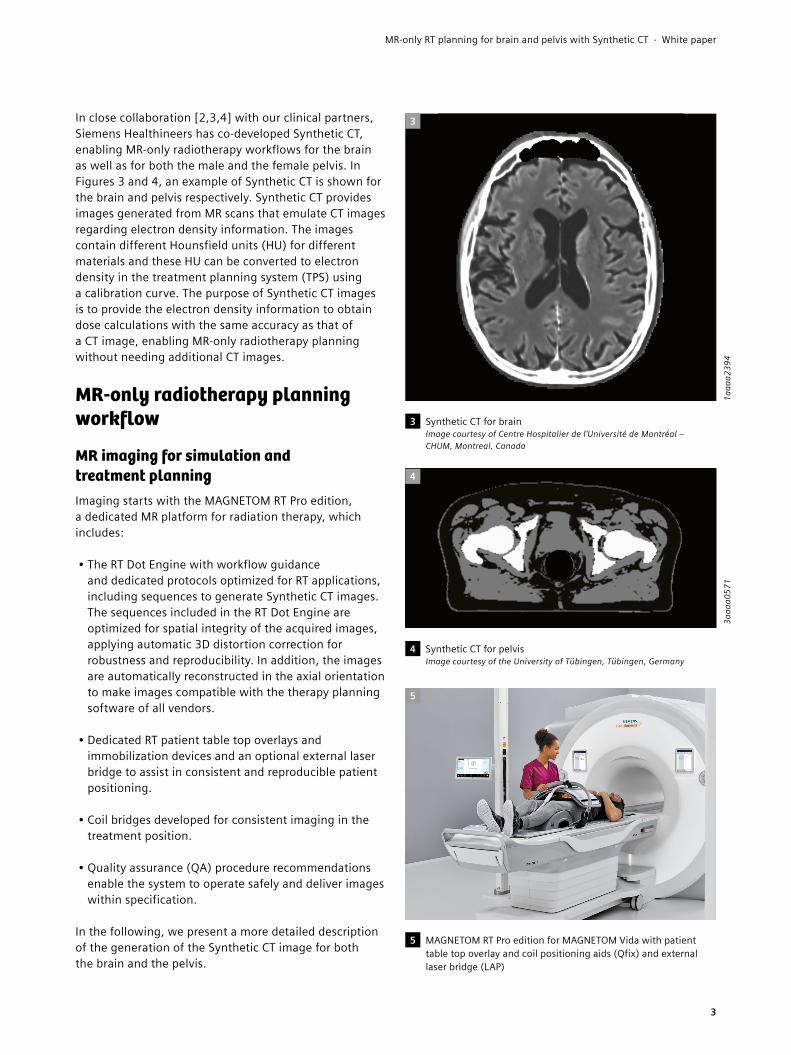
In close collaboration [2,3,4] with our clinical partners, Siemens Healthineers has co-developed Synthetic CT, enabling MR-only radiotherapy workflows for the brain as well as for both the male and the female pelvis. In Figures 3 and 4, an example of Synthetic CT is shown for the brain and pelvis respectively. Synthetic CT provides images generated from MR scans that emulate CT images regarding electron density information. The images contain different Hounsfield units (HU) for different materials and these HU can be converted to electron density in the treatment planning system (TPS) using a calibration curve. The purpose of Synthetic CT images is to provide the electron density information to obtain dose calculations with the same accuracy as that of a CT image, enabling MR-only radiotherapy planning without needing additional CT images.
MR-only radiotherapy planning workflow
MR imaging for simulation and treatment planningImaging starts with the MAGNETOM RT Pro edition, a dedicated MR platform for radiation therapy, which includes:
• The RT Dot Engine with workflow guidance and dedicated protocols optimized for RT applications, including sequences to generate Synthetic CT images. The sequences included in the RT Dot Engine are optimized for spatial integrity of the acquired images, applying automatic 3D distortion correction for robustness and reproducibility. In addition, the images are automatically reconstructed in the axial orientation to make images compatible with the therapy planning software of all vendors.
• Dedicated RT patient table top overlays and immobilization devices and an optional external laser bridge to assist in consistent and reproducible patient positioning.
• Coil bridges developed for consistent imaging in the treatment position.
• Quality assurance (QA) procedure recommendations enable the system to operate safely and deliver images within specification.
In the following, we present a more detailed description of the generation of the Synthetic CT image for both the brain and the pelvis.
3
3 Synthetic CT for brain Image courtesy of Centre Hospitalier de l'Université de Montréal – CHUM, Montreal, Canada
4
4 Synthetic CT for pelvis Image courtesy of the University of Tübingen, Tübingen, Germany
5
5 MAGNETOM RT Pro edition for MAGNETOM Vida with patient table top overlay and coil positioning aids (Qfix) and external laser bridge (LAP)
3aaa
a057
11a
aaa2
394
3
MR-only RT planning for brain and pelvis with Synthetic CT · White paper
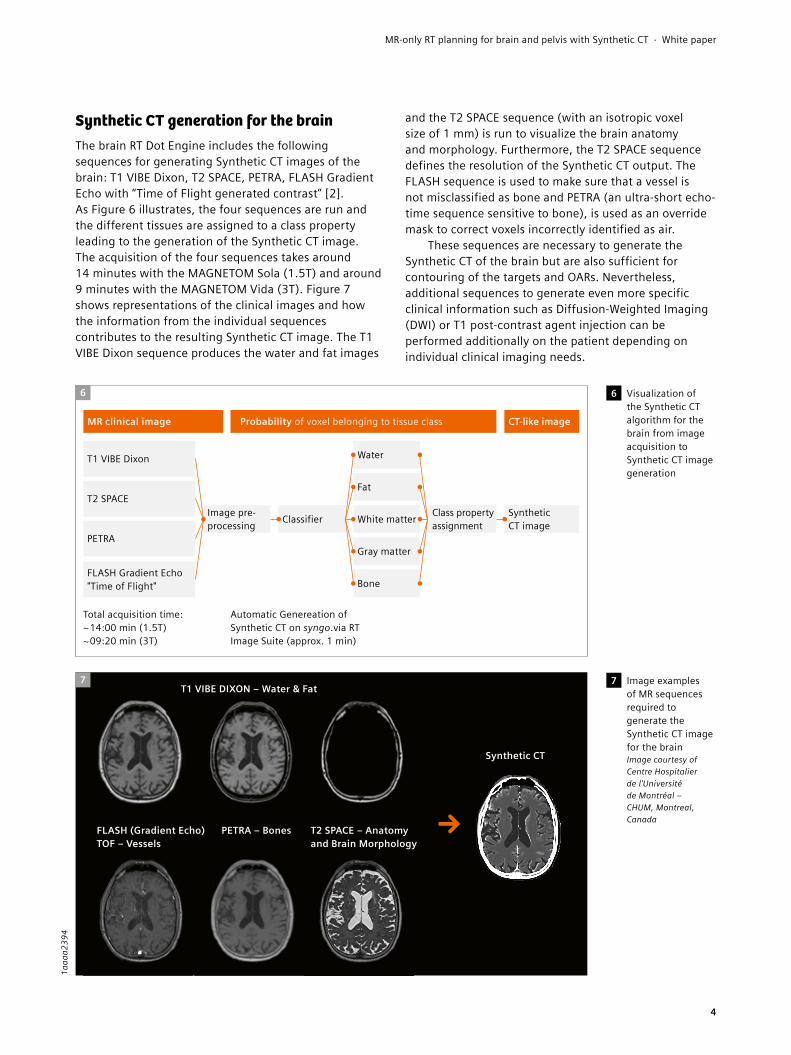
Synthetic CT generation for the brainThe brain RT Dot Engine includes the following sequences for generating Synthetic CT images of the brain: T1 VIBE Dixon, T2 SPACE, PETRA, FLASH Gradient Echo with “Time of Flight generated contrast” [2]. As Figure 6 illustrates, the four sequences are run and the different tissues are assigned to a class property leading to the generation of the Synthetic CT image. The acquisition of the four sequences takes around 14 minutes with the MAGNETOM Sola (1.5T) and around 9 minutes with the MAGNETOM Vida (3T). Figure 7 shows representations of the clinical images and how the information from the individual sequences contributes to the resulting Synthetic CT image. The T1 VIBE Dixon sequence produces the water and fat images
and the T2 SPACE sequence (with an isotropic voxel size of 1 mm) is run to visualize the brain anatomy and morphology. Furthermore, the T2 SPACE sequence defines the resolution of the Synthetic CT output. The FLASH sequence is used to make sure that a vessel is not misclassified as bone and PETRA (an ultra-short echo-time sequence sensitive to bone), is used as an override mask to correct voxels incorrectly identified as air.
These sequences are necessary to generate the Synthetic CT of the brain but are also sufficient for contouring of the targets and OARs. Nevertheless, additional sequences to generate even more specific clinical information such as Diffusion-Weighted Imaging (DWI) or T1 post-contrast agent injection can be performed additionally on the patient depending on individual clinical imaging needs.
6 Visualization of the Synthetic CT algorithm for the brain from image acquisition to Synthetic CT image generation
7 Image examples of MR sequences required to generate the Synthetic CT image for the brain Image courtesy of Centre Hospitalier de l'Université de Montréal – CHUM, Montreal, Canada
6
T1 VIBE Dixon
Total acquisition time:∼14:00 min (1.5T) ∼09:20 min (3T)
Automatic Genereation of Synthetic CT on syngo.via RT Image Suite (approx. 1 min)
Image pre- processing
Synthetic CT imageClassifier Class property
assignment
Water
Fat
White matter
Gray matter
Bone
T2 SPACE
PETRA
FLASH Gradient Echo "Time of Flight"
Probability of voxel belonging to tissue class
T1 VIBE DIXON – Water & Fat
FLASH (Gradient Echo) TOF – Vessels
PETRA – Bones
Synthetic CT
T2 SPACE – Anatomy and Brain Morphology
7
MR clinical image CT-like image
1aaa
a239
4
4
MR-only RT planning for brain and pelvis with Synthetic CT · White paper
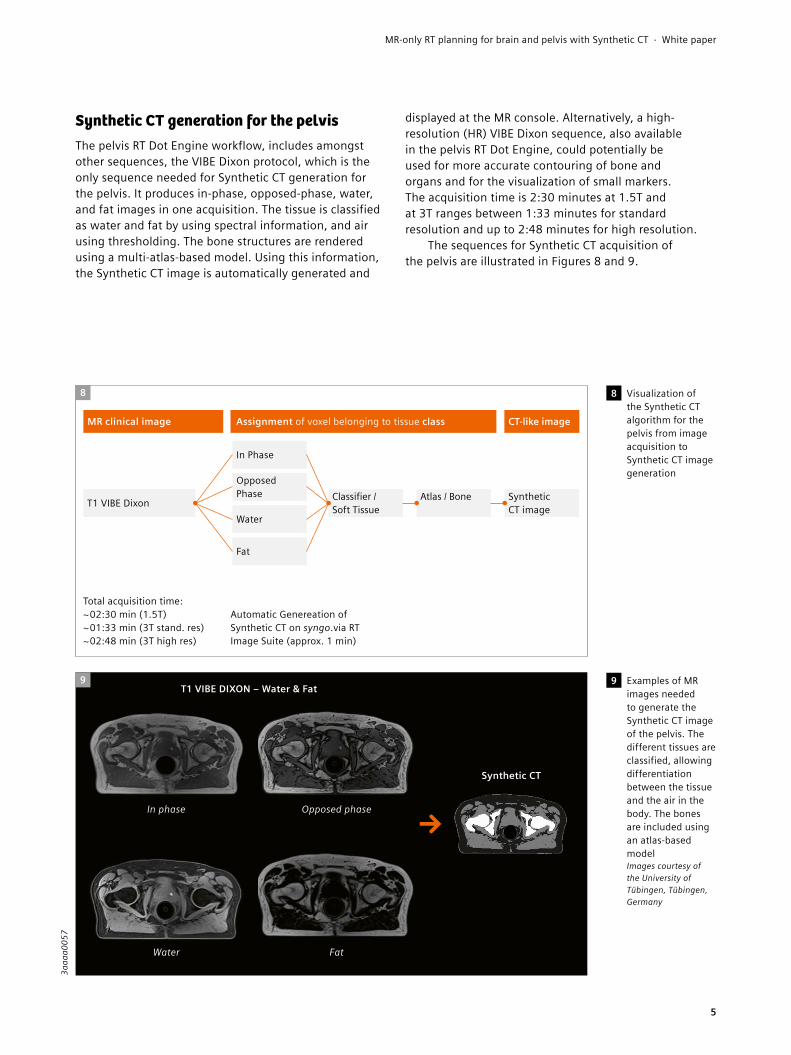
Synthetic CT generation for the pelvisThe pelvis RT Dot Engine workflow, includes amongst other sequences, the VIBE Dixon protocol, which is the only sequence needed for Synthetic CT generation for the pelvis. It produces in-phase, opposed-phase, water, and fat images in one acquisition. The tissue is classified as water and fat by using spectral information, and air using thresholding. The bone structures are rendered using a multi-atlas-based model. Using this information, the Synthetic CT image is automatically generated and
displayed at the MR console. Alternatively, a high-resolution (HR) VIBE Dixon sequence, also available in the pelvis RT Dot Engine, could potentially be used for more accurate contouring of bone and organs and for the visualization of small markers. The acquisition time is 2:30 minutes at 1.5T and at 3T ranges between 1:33 minutes for standard resolution and up to 2:48 minutes for high resolution.
The sequences for Synthetic CT acquisition of the pelvis are illustrated in Figures 8 and 9.
8 Visualization of the Synthetic CT algorithm for the pelvis from image acquisition to Synthetic CT image generation
9 Examples of MR images needed to generate the Synthetic CT image of the pelvis. The different tissues are classified, allowing differentiation between the tissue and the air in the body. The bones are included using an atlas-based model Images courtesy of the University of Tübingen, Tübingen, Germany
In phase
Water
Opposed phase
Fat
9
8
MR clinical image
T1 VIBE Dixon
Total acquisition time:∼02:30 min (1.5T) ∼01:33 min (3T stand. res)∼02:48 min (3T high res)
Automatic Genereation of Synthetic CT on syngo.via RT Image Suite (approx. 1 min)
In Phase
Opposed Phase
Water
Fat
CT-like imageAssignment of voxel belonging to tissue class
Synthetic CT image
Classifier / Soft Tissue
Atlas / Bone
T1 VIBE DIXON – Water & Fat
Synthetic CT
3aaa
a005
7
5
MR-only RT planning for brain and pelvis with Synthetic CT · White paper
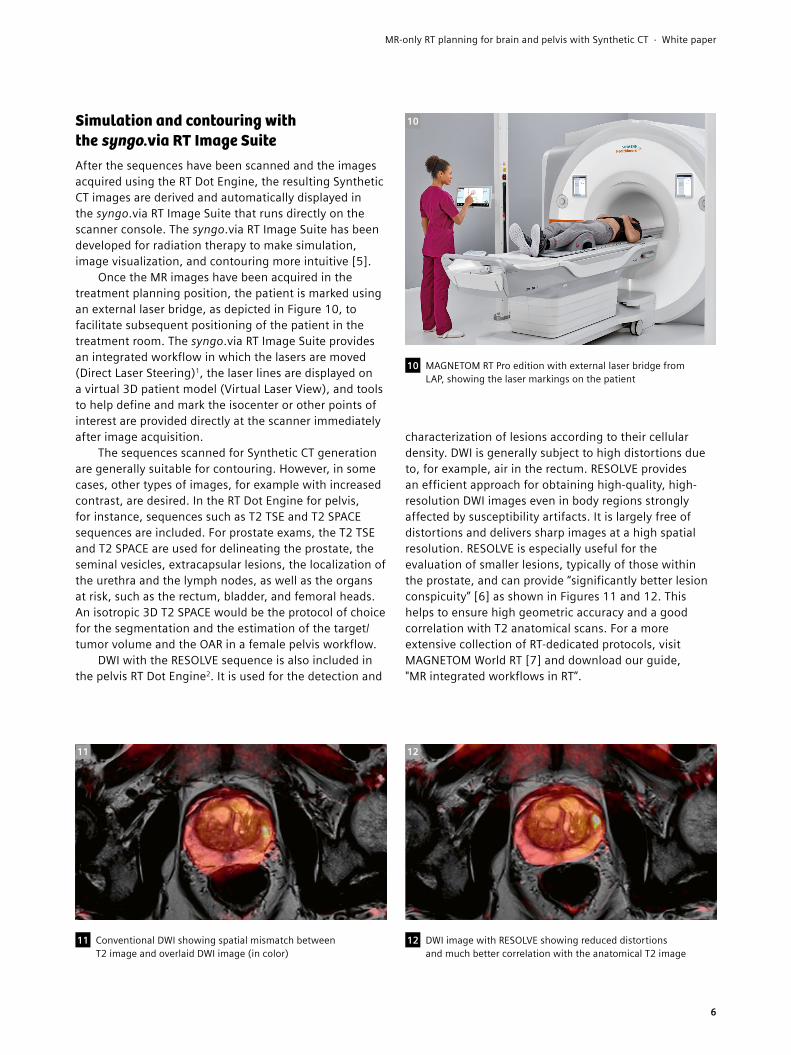
Simulation and contouring with the syngo.via RT Image SuiteAfter the sequences have been scanned and the images acquired using the RT Dot Engine, the resulting Synthetic CT images are derived and automatically displayed in the syngo.via RT Image Suite that runs directly on the scanner console. The syngo.via RT Image Suite has been developed for radiation therapy to make simulation, image visualization, and contouring more intuitive [5].
Once the MR images have been acquired in the treatment planning position, the patient is marked using an external laser bridge, as depicted in Figure 10, to facilitate subsequent positioning of the patient in the treatment room. The syngo.via RT Image Suite provides an integrated workflow in which the lasers are moved (Direct Laser Steering)1, the laser lines are displayed on a virtual 3D patient model (Virtual Laser View), and tools to help define and mark the isocenter or other points of interest are provided directly at the scanner immediately after image acquisition.
The sequences scanned for Synthetic CT generation are generally suitable for contouring. However, in some cases, other types of images, for example with increased contrast, are desired. In the RT Dot Engine for pelvis, for instance, sequences such as T2 TSE and T2 SPACE sequences are included. For prostate exams, the T2 TSE and T2 SPACE are used for delineating the prostate, the seminal vesicles, extracapsular lesions, the localization of the urethra and the lymph nodes, as well as the organs at risk, such as the rectum, bladder, and femoral heads. An isotropic 3D T2 SPACE would be the protocol of choice for the segmentation and the estimation of the target/ tumor volume and the OAR in a female pelvis workflow.
DWI with the RESOLVE sequence is also included in the pelvis RT Dot Engine2. It is used for the detection and
characterization of lesions according to their cellular density. DWI is generally subject to high distortions due to, for example, air in the rectum. RESOLVE provides an efficient approach for obtaining high-quality, high-resolution DWI images even in body regions strongly affected by susceptibility artifacts. It is largely free of distortions and delivers sharp images at a high spatial resolution. RESOLVE is especially useful for the evaluation of smaller lesions, typically of those within the prostate, and can provide “significantly better lesion conspicuity” [6] as shown in Figures 11 and 12. This helps to ensure high geometric accuracy and a good correlation with T2 anatomical scans. For a more extensive collection of RT-dedicated protocols, visit MAGNETOM World RT [7] and download our guide, "MR integrated workflows in RT”.
10
10 MAGNETOM RT Pro edition with external laser bridge from LAP, showing the laser markings on the patient
11 Conventional DWI showing spatial mismatch between T2 image and overlaid DWI image (in color)
11
12 DWI image with RESOLVE showing reduced distortions and much better correlation with the anatomical T2 image
12
6
MR-only RT planning for brain and pelvis with Synthetic CT · White paper
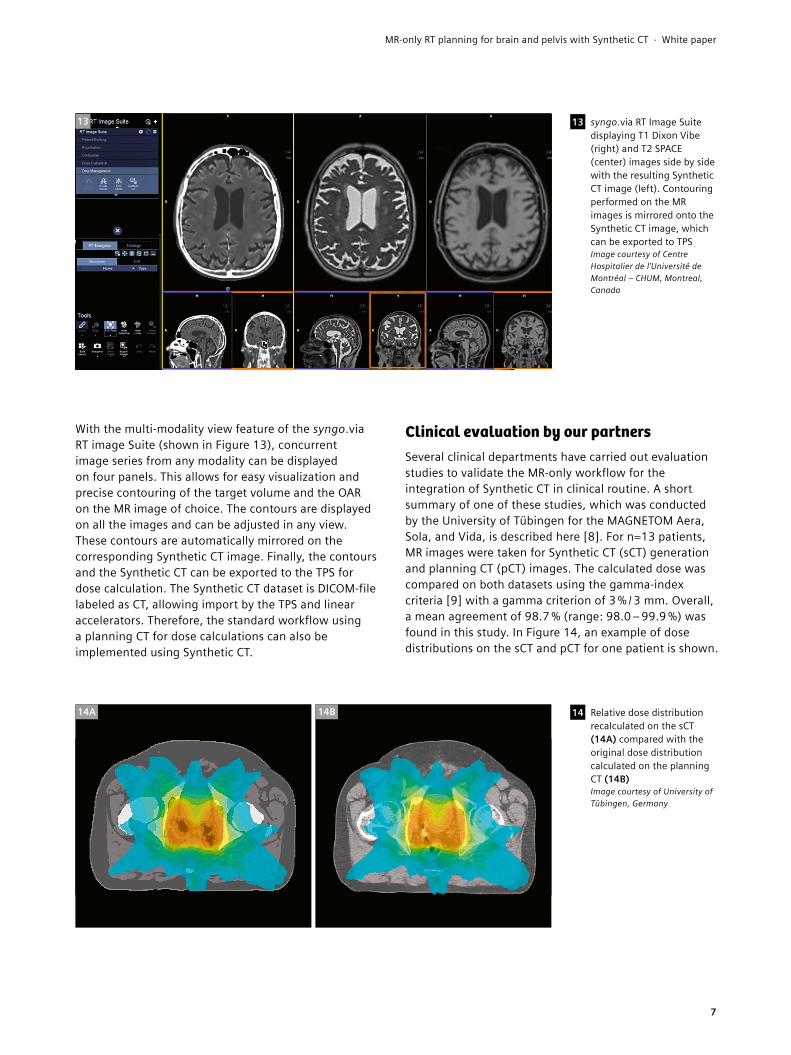
13 syngo.via RT Image Suite displaying T1 Dixon Vibe (right) and T2 SPACE (center) images side by side with the resulting Synthetic CT image (left). Contouring performed on the MR images is mirrored onto the Synthetic CT image, which can be exported to TPS Image courtesy of Centre Hospitalier de l'Université de Montréal – CHUM, Montreal, Canada
13
With the multi-modality view feature of the syngo.via RT image Suite (shown in Figure 13), concurrent image series from any modality can be displayed on four panels. This allows for easy visualization and precise contouring of the target volume and the OAR on the MR image of choice. The contours are displayed on all the images and can be adjusted in any view. These contours are automatically mirrored on the corresponding Synthetic CT image. Finally, the contours and the Synthetic CT can be exported to the TPS for dose calculation. The Synthetic CT dataset is DICOM-file labeled as CT, allowing import by the TPS and linear accelerators. Therefore, the standard workflow using a planning CT for dose calculations can also be implemented using Synthetic CT.
Clinical evaluation by our partnersSeveral clinical departments have carried out evaluation studies to validate the MR-only workflow for the integration of Synthetic CT in clinical routine. A short summary of one of these studies, which was conducted by the University of Tübingen for the MAGNETOM Aera, Sola, and Vida, is described here [8]. For n=13 patients, MR images were taken for Synthetic CT (sCT) generation and planning CT (pCT) images. The calculated dose was compared on both datasets using the gamma-index criteria [9] with a gamma criterion of 3 % / 3 mm. Overall, a mean agreement of 98.7 % (range: 98.0 – 99.9 %) was found in this study. In Figure 14, an example of dose distributions on the sCT and pCT for one patient is shown.
14A 14B 14 Relative dose distribution recalculated on the sCT (14A) compared with the original dose distribution calculated on the planning CT (14B) Image courtesy of University of Tübingen, Germany
7
MR-only RT planning for brain and pelvis with Synthetic CT · White paper
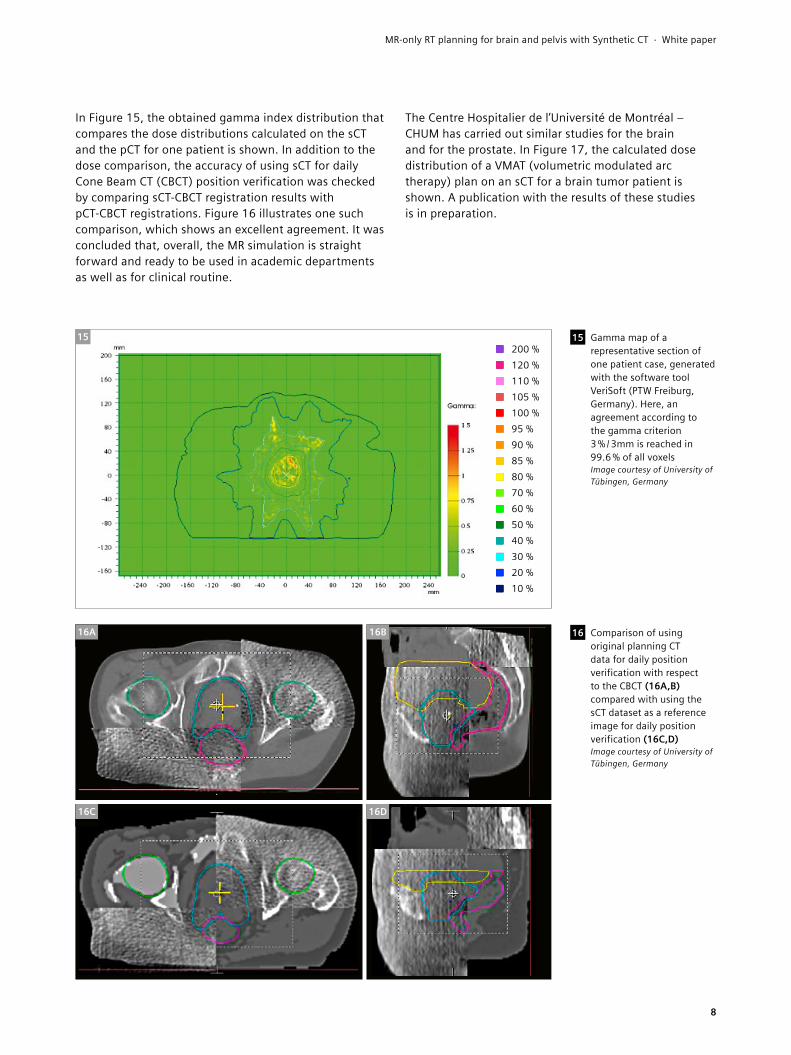
15 Gamma map of a representative section of one patient case, generated with the software tool VeriSoft (PTW Freiburg, Germany). Here, an agreement according to the gamma criterion 3 % / 3mm is reached in 99.6 % of all voxels Image courtesy of University of Tübingen, Germany
In Figure 15, the obtained gamma index distribution that compares the dose distributions calculated on the sCT and the pCT for one patient is shown. In addition to the dose comparison, the accuracy of using sCT for daily Cone Beam CT (CBCT) position verification was checked by comparing sCT-CBCT registration results with pCT-CBCT registrations. Figure 16 illustrates one such comparison, which shows an excellent agreement. It was concluded that, overall, the MR simulation is straight forward and ready to be used in academic departments as well as for clinical routine.
16 Comparison of using original planning CT data for daily position verification with respect to the CBCT (16A,B) compared with using the sCT dataset as a reference image for daily position verification (16C,D) Image courtesy of University of Tübingen, Germany
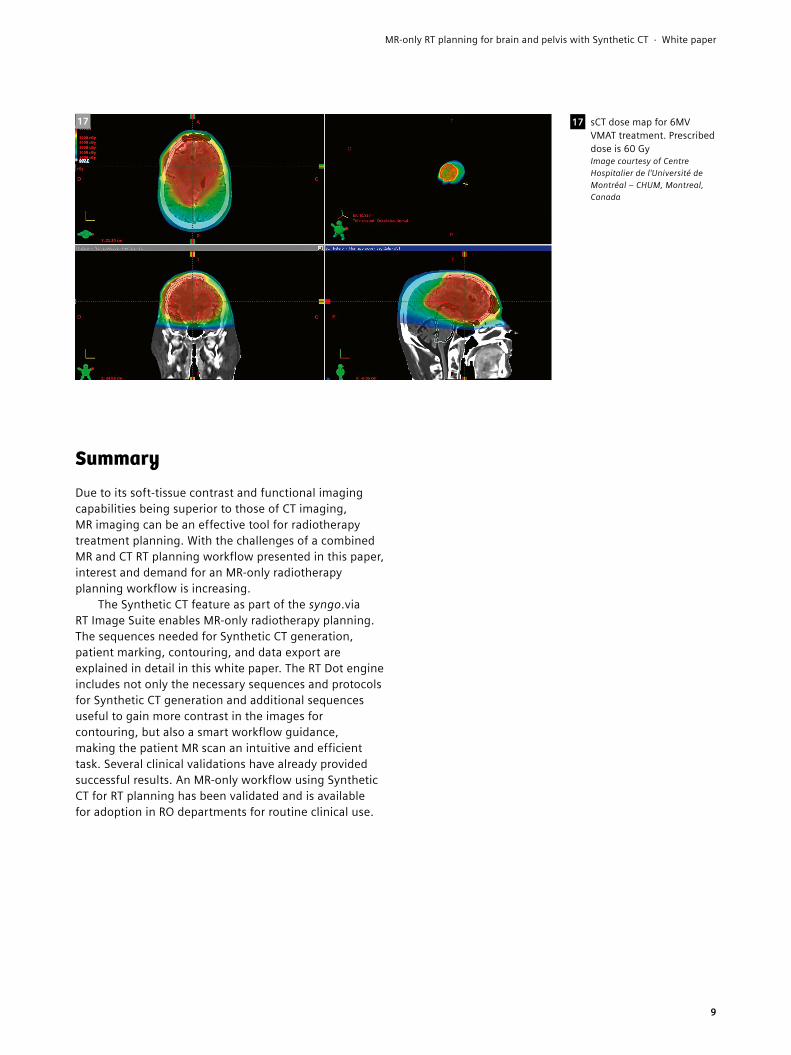
The Centre Hospitalier de l’Université de Montréal – CHUM has carried out similar studies for the brain and for the prostate. In Figure 17, the calculated dose distribution of a VMAT (volumetric modulated arc therapy) plan on an sCT for a brain tumor patient is shown. A publication with the results of these studies is in preparation.
16A
16C
16B
16D
200 %120 %110 %105 %100 %95 %90 %85 %80 %70 %60 %50 %40 %30 %20 %10 %
15
8
MR-only RT planning for brain and pelvis with Synthetic CT · White paper
SummaryDue to its soft-tissue contrast and functional imaging capabilities being superior to those of CT imaging, MR imaging can be an effective tool for radiotherapy treatment planning. With the challenges of a combined MR and CT RT planning workflow presented in this paper, interest and demand for an MR-only radiotherapy planning workflow is increasing.
The Synthetic CT feature as part of the syngo.via RT Image Suite enables MR-only radiotherapy planning. The sequences needed for Synthetic CT generation, patient marking, contouring, and data export are explained in detail in this white paper. The RT Dot engine includes not only the necessary sequences and protocols for Synthetic CT generation and additional sequences useful to gain more contrast in the images for contouring, but also a smart workflow guidance, making the patient MR scan an intuitive and efficient task. Several clinical validations have already provided successful results. An MR-only workflow using Synthetic CT for RT planning has been validated and is available for adoption in RO departments for routine clinical use.
17 sCT dose map for 6MV VMAT treatment. Prescribed dose is 60 Gy Image courtesy of Centre Hospitalier de l'Université de Montréal – CHUM, Montreal, Canada
17
9
MR-only RT planning for brain and pelvis with Synthetic CT · White paper
On account of certain regional limitations of sales rights and service availability, we cannot guarantee that all products included in this brochure are available through the Siemens Healthineers sales organization worldwide.
Availability and packaging may vary by country and are subject to change without prior notice. Some/All of the features and products described herein may not be available in the United States.
The information in this document contains general technical descriptions of specifications and options as well as standard and optional features that do not always have to be present in individual cases.
Siemens Healthineers reserves the right to modify the design, packaging, specifications, and options described herein without prior notice. Please contact your local Siemens Healthineers sales representative for the most current information.
Note: Any technical data contained in this document may vary within defined tolerances. Original images always lose a certain amount of detail when reproduced.
The data acquisition protocols for Synthetic CT are available on Numaris X software with MAGNETOM RT Pro edition for MAGNETOM Sola and MAGNETOM Vida.
Published by Siemens Healthcare GmbH · 8026 0420 online · © Siemens Healthcare GmbH, 2019
Siemens Healthineers HeadquartersSiemens Healthcare GmbH Henkestr. 127 91052 Erlangen, Germany Phone: +49 9131 84-0 siemens-healthineers.com
[1] Lorna Young et al., IMV Radiation Therapy Market Summary Report, Oct 2018
[2] SH Hsu et al., Investigation of a method for generating synthetic CT models from MRI scans of the head and neck for radiation therapy, Phys Med Biol. 2013 Dec 7;58(23):8419-35
[3] E Paradis et al., Assessing the dosimetric accuracy of MR-generated synthetic CT images for focal brain VMAT radiotherapy, Int J Radiat Oncol Biol Phys. 2015 Dec 1;93(5):1154-61
[4] SH Hsu et al., Quantitative Characterization of Ultrashort Echo (UTE) Images for supporting Air-Bone Separation in the Head, Phys Med Biol. 2015 Apr 7;60(7):2869-80
[5] Dr. Stéphane Muraro, Dr. Kinda Anna Saddi, White Paper: Simulation and data analysis in RT with Syngo.via RT Image Suite, 2018
[6] Thian et al. Academic Radiology, 2014:21(4)
[7] https://www.siemens-healthineers.com/de/magnetic-resonance-imaging/magnetom-world
[8] Prof. D. Thorwarth et al., Synthetic CT Generation for the Pelvic Region Based on Dixon-MR Sequences: Workflow, dosimetric Quality and Daily Patient Positioning, 2018, MReadings: MR in RT, 5th Edition
[9] DA Low et al, A technique for the quantitative evaluation of the dose distributions., Med Phys, 1998 May; 25(5):656-61
1 Optional, compatible LAP laser system required for Direct Laser Steering
2 With software version XA11B, and cannot be guaranteed with other software versions