Embed Size (px)
Citation preview
White Flint Sector Plan Casestudy
INFRASTRUCTURE FUNDING
July 18, 2012
www.federalrealty.com
1. FEDERAL REALTY:
A CORPORATE HISTORY OF URBAN MIXED-USE
DEVELOPMENT
www.federalrealty.com
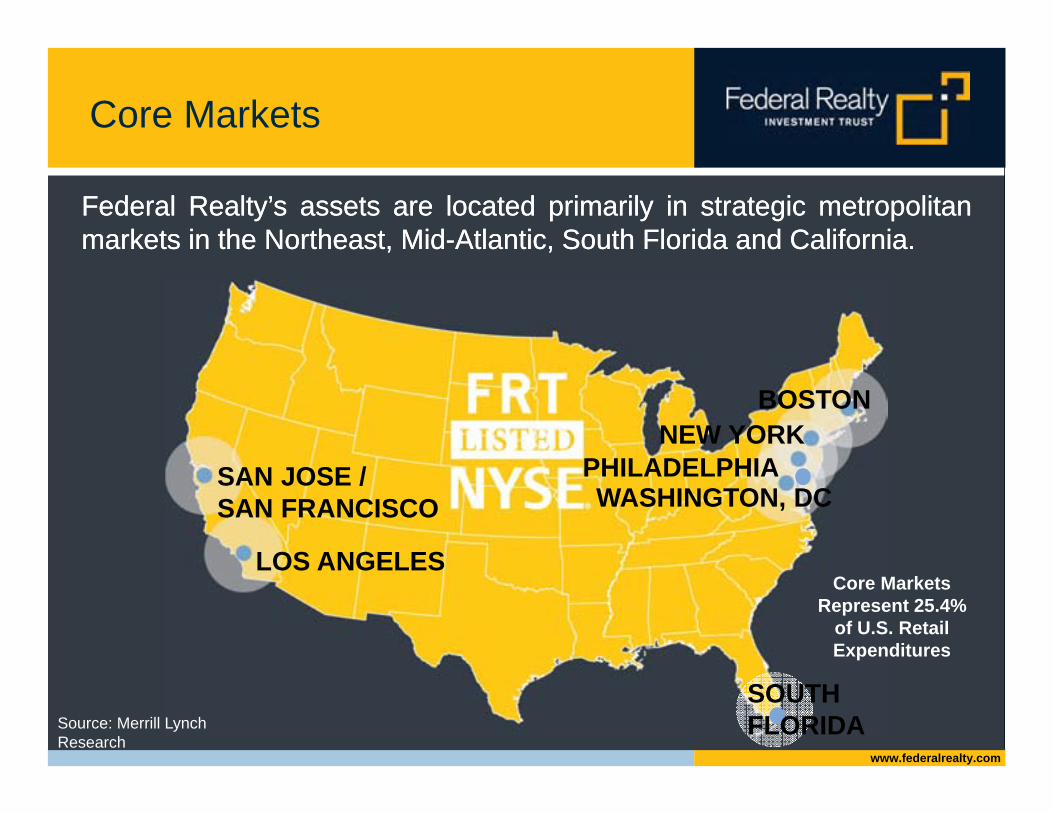
Core Markets
Federal Realty’s assets are located primarily in strategic metropolitanmarkets in the Northeast, Mid-Atlantic, South Florida and California.Federal Realty’s assets are located primarily in strategic metropolitanmarkets in the Northeast, Mid-Atlantic, South Florida and California.
SAN JOSE /SAN FRANCISCO
LOS ANGELES
BOSTONNEW YORK
PHILADELPHIAWASHINGTON, DC
Core Markets Represent 25.4%
of U.S. Retail Expenditures
Source: Merrill Lynch Research
SOUTH FLORIDA
www.federalrealty.com
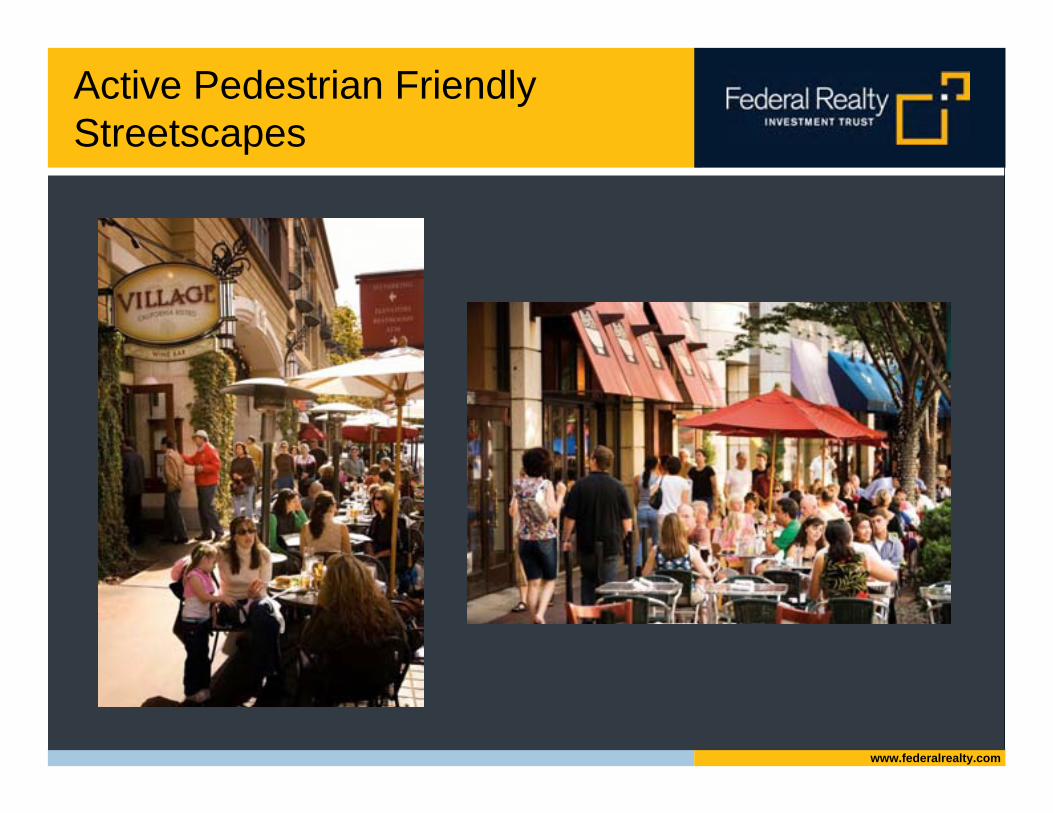
Active Pedestrian Friendly Streetscapes
www.federalrealty.com
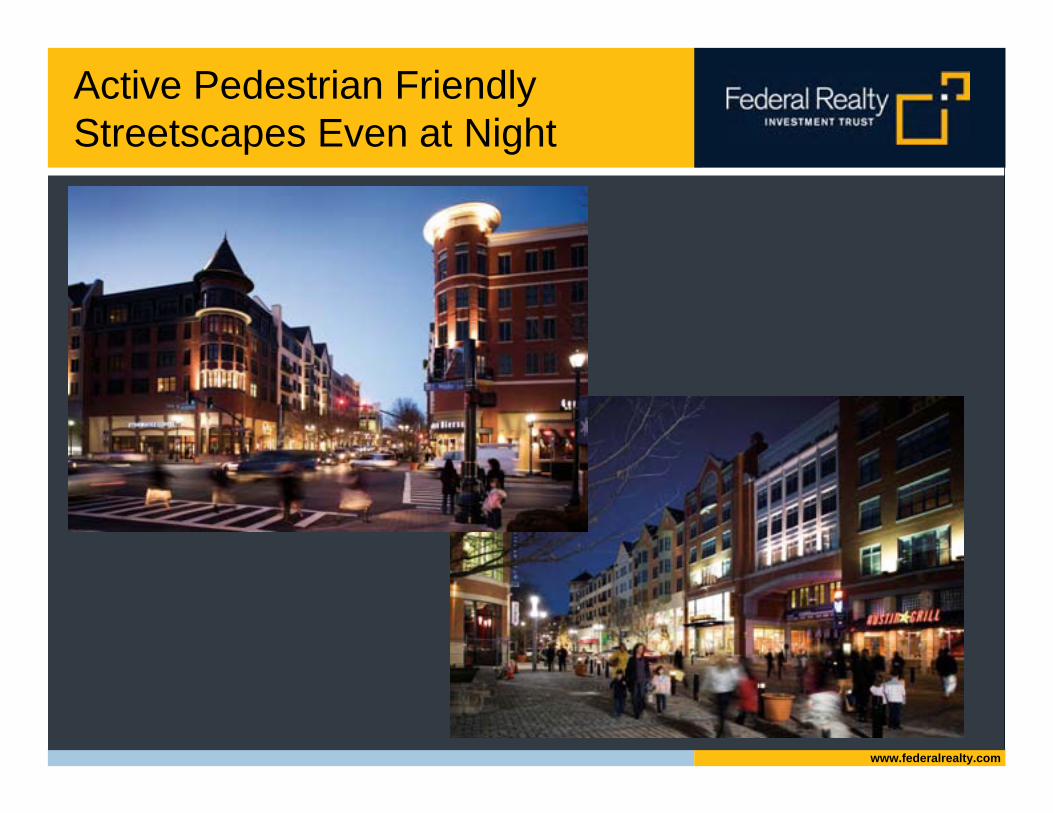
Active Pedestrian Friendly Streetscapes Even at Night
www.federalrealty.com
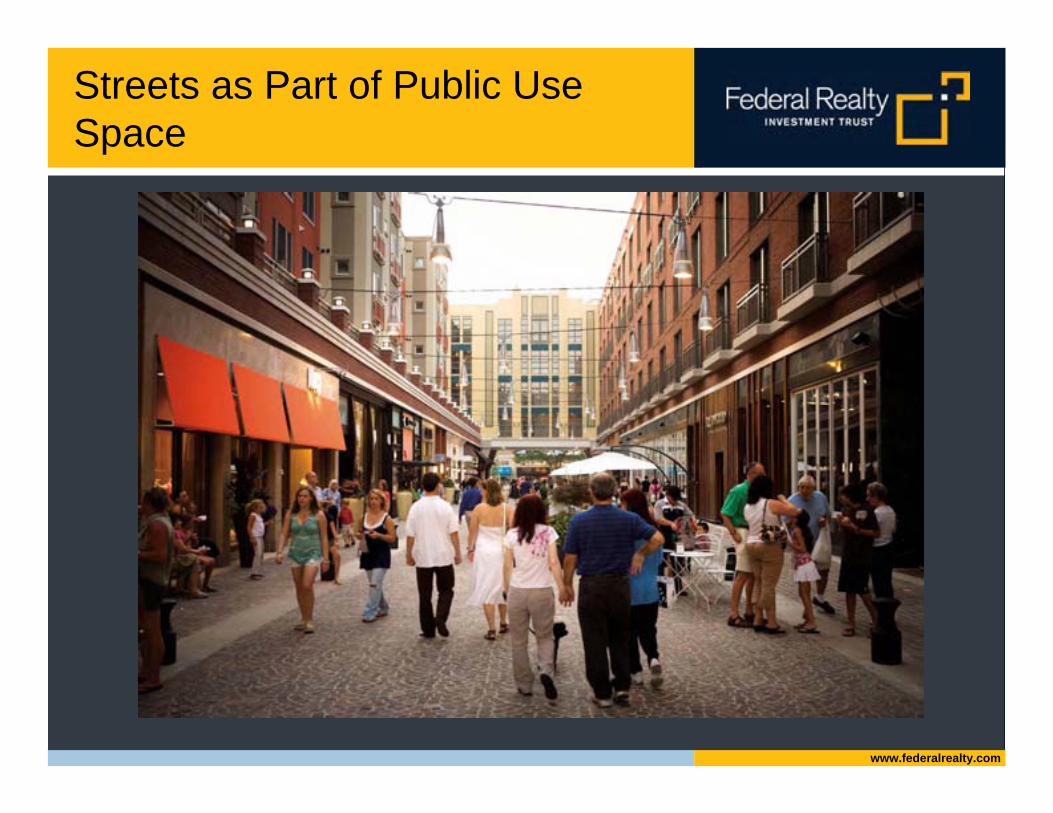
Streets as Part of Public Use Space
www.federalrealty.com
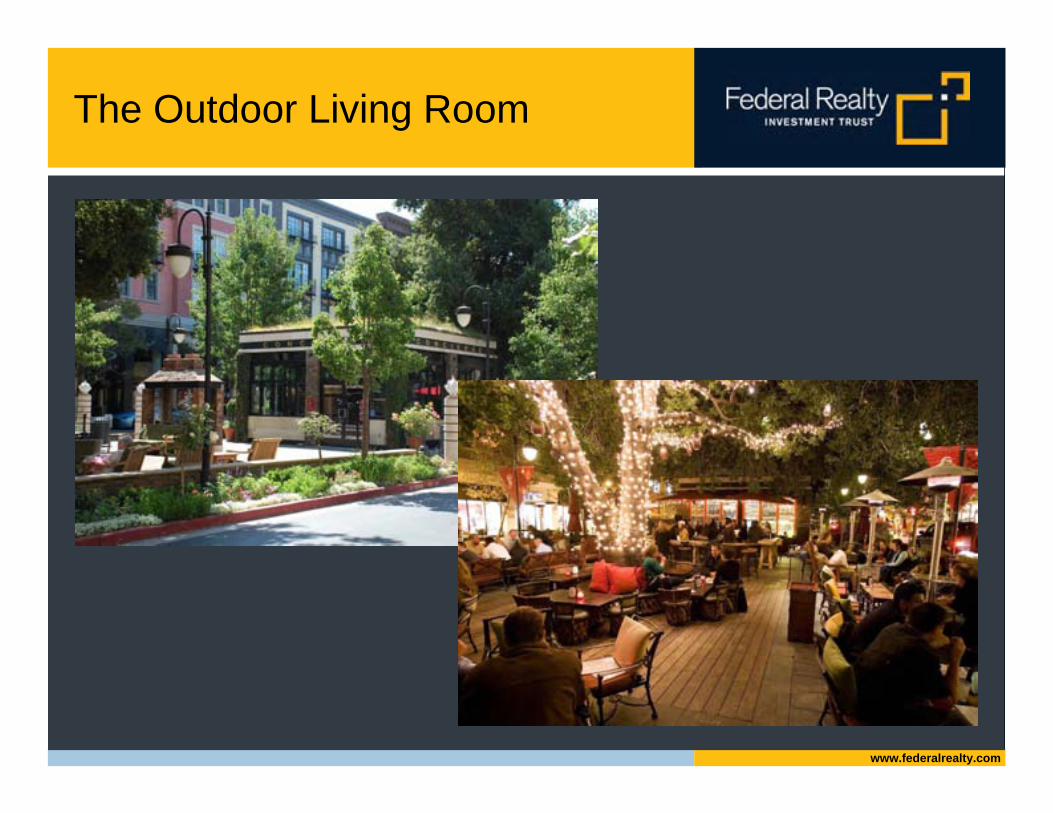
The Outdoor Living Room
www.federalrealty.com
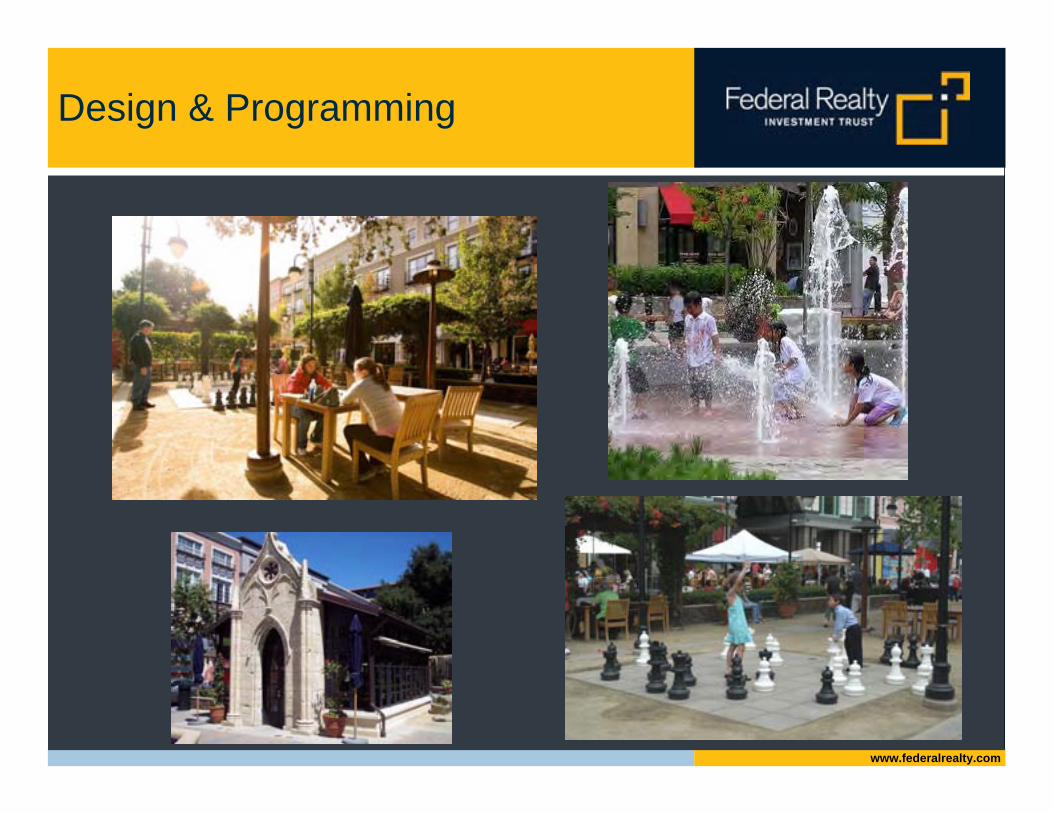
Design & Programming

www.federalrealty.com
Community Events
9
Bethesda Row Arts FestivalRockville Home & Garden Show
Congressional Plaza Mommy & MeThe Front Row The Front Row
www.federalrealty.com
2. SECTOR PLAN OVERVIEW
www.federalrealty.com
whit
e f
lint s
ector p
lan |
2010
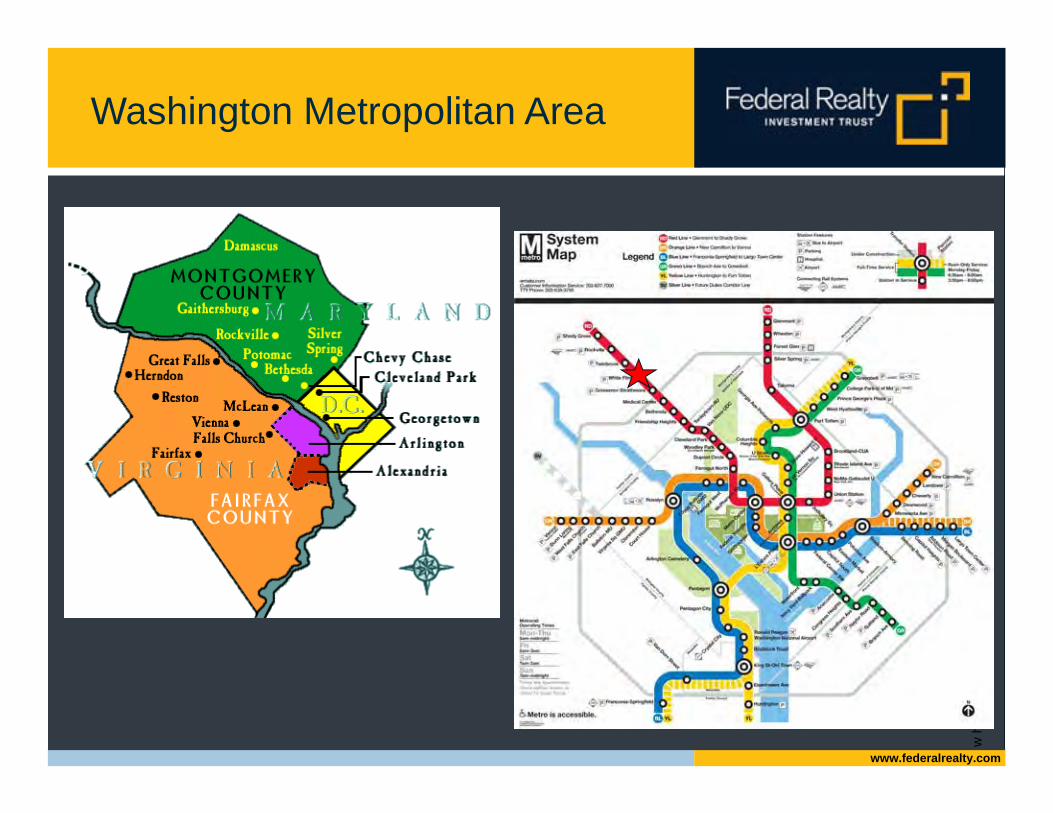
Washington Metropolitan Area
www.federalrealty.com
whit
e f
lint s
ector p
lan |
2010
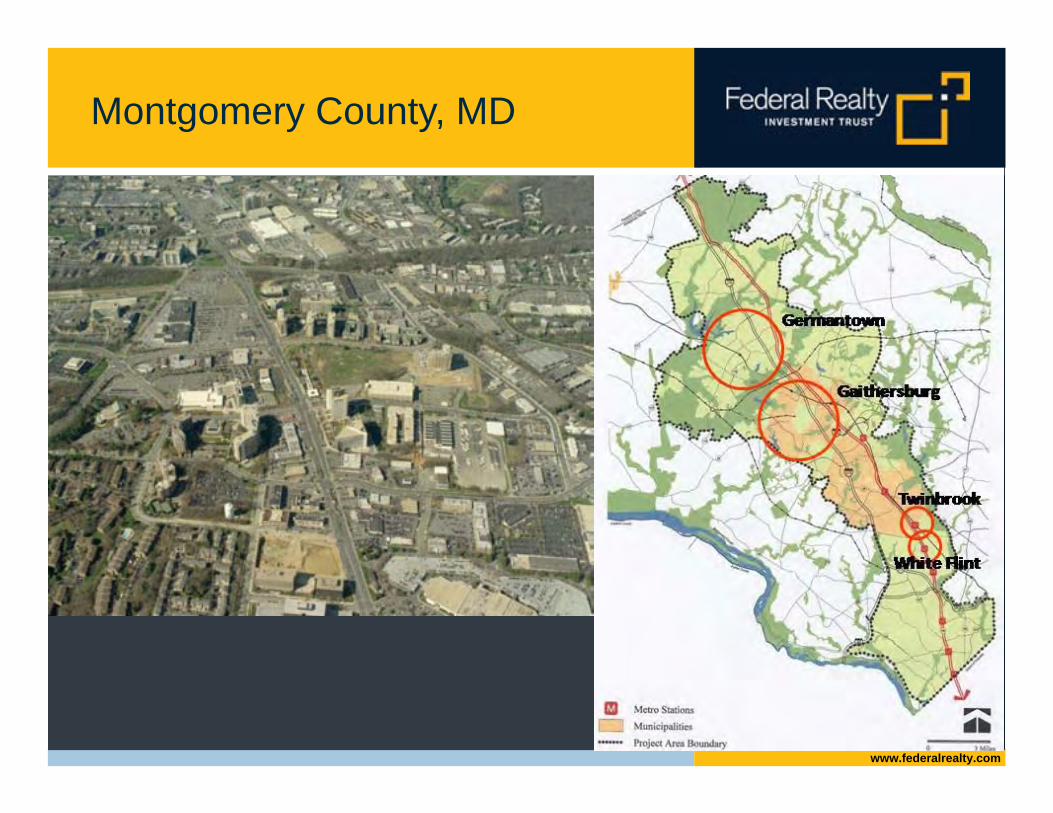
Montgomery County, MD
www.federalrealty.com
whit
e f
lint s
ector p
lan |
2010
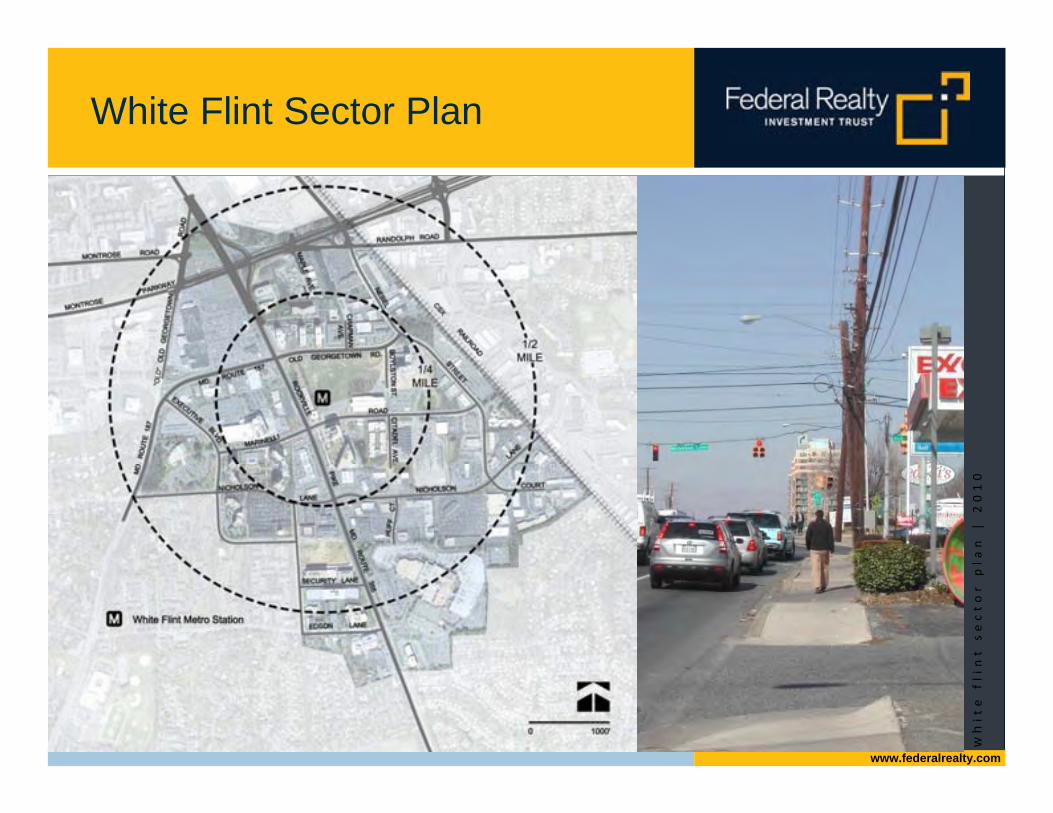
White Flint Sector Plan
www.federalrealty.com
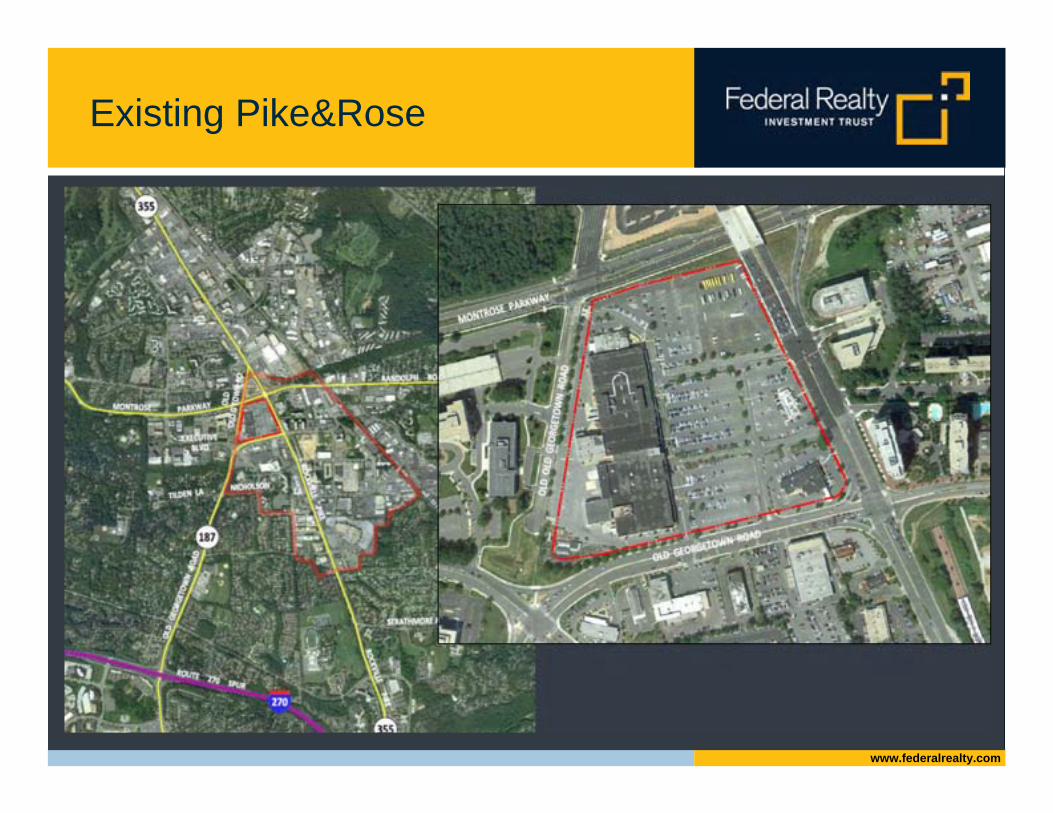
Existing Pike&Rose
www.federalrealty.com
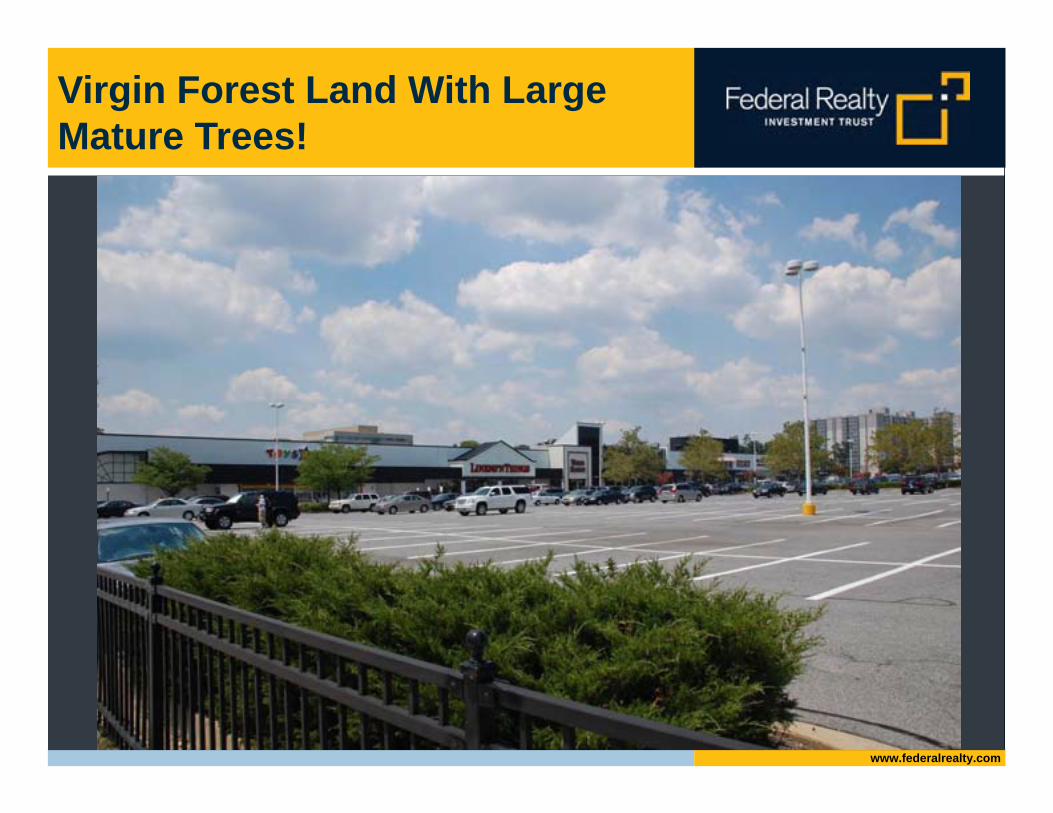
Virgin Forest Land With Large Mature Trees!
www.federalrealty.com
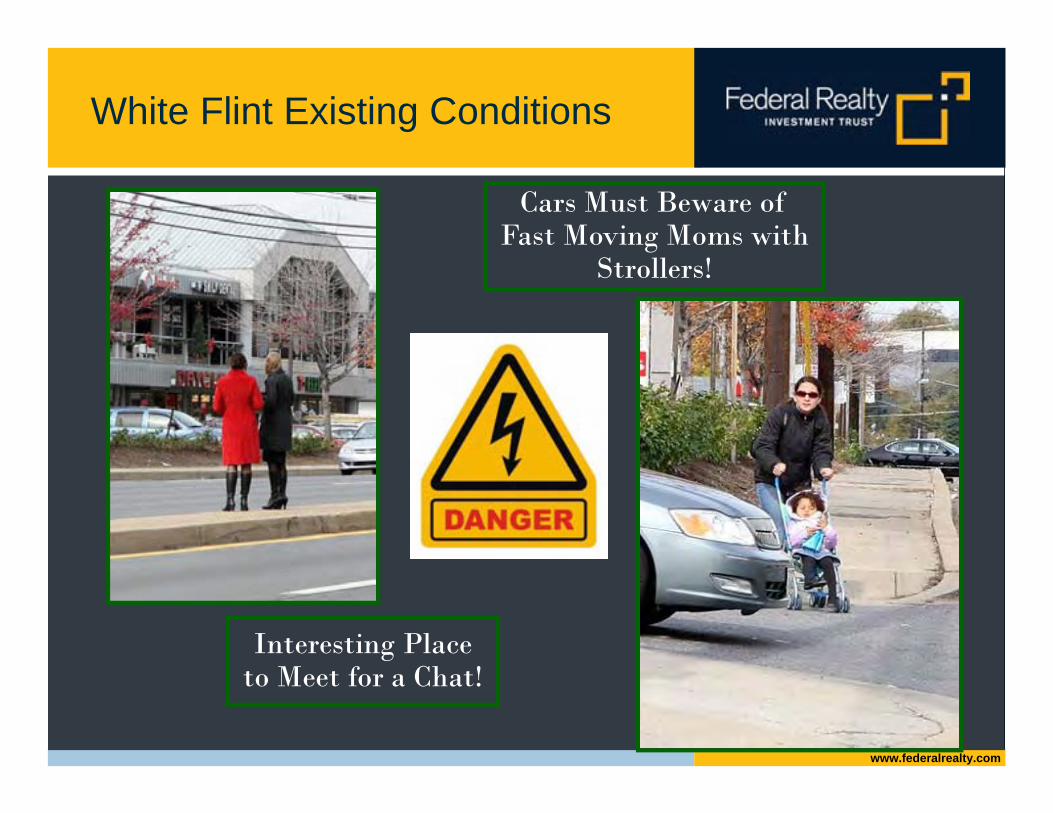
Cars Must Beware of Fast Moving Moms with
Strollers!
Interesting Place to Meet for a Chat!
White Flint Existing Conditions
www.federalrealty.com
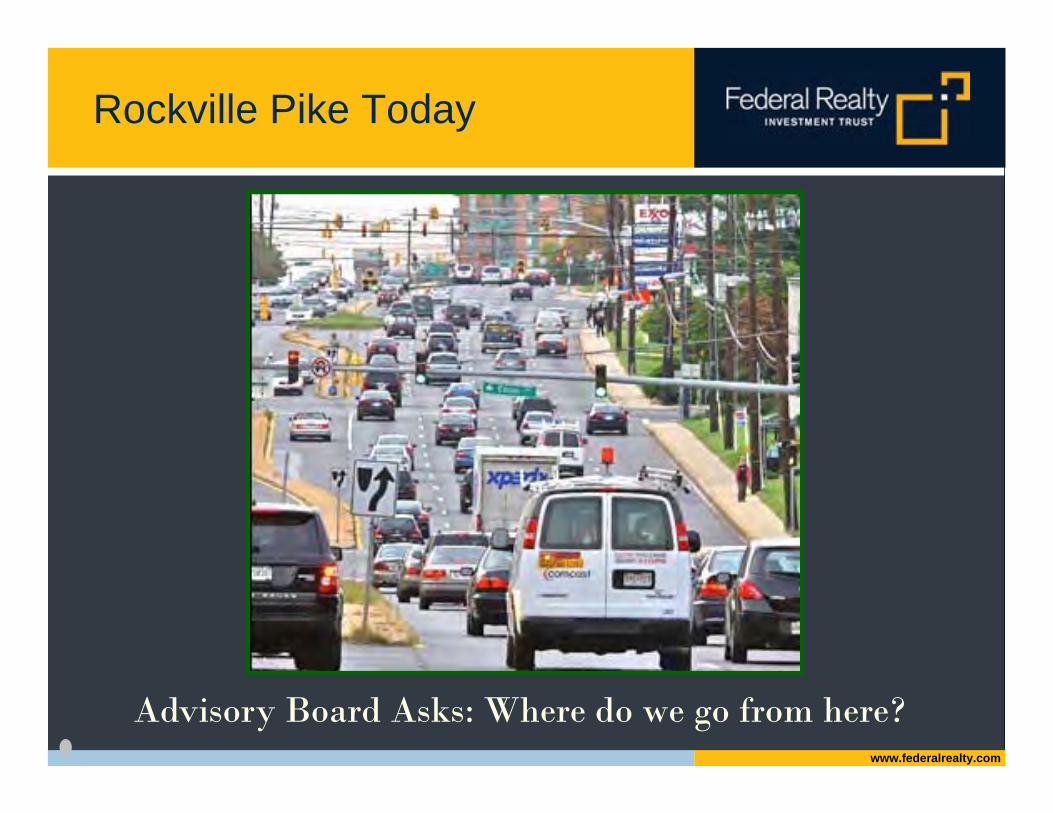
Rockville Pike Today
Advisory Board Asks: Where do we go from here?
www.federalrealty.com
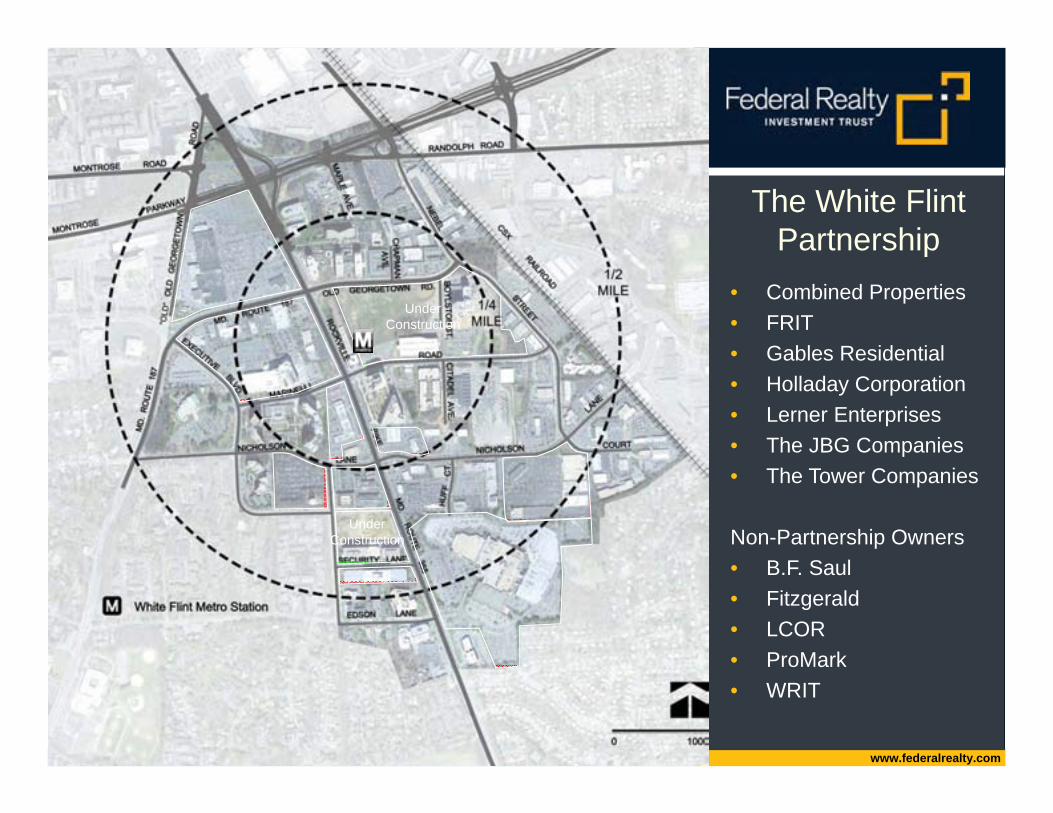
The White Flint Partnership
Under Construction
Under Construction
• Combined Properties• FRIT• Gables Residential• Holladay Corporation• Lerner Enterprises• The JBG Companies• The Tower Companies
Non-Partnership Owners• B.F. Saul• Fitzgerald• LCOR• ProMark• WRIT
www.federalrealty.com
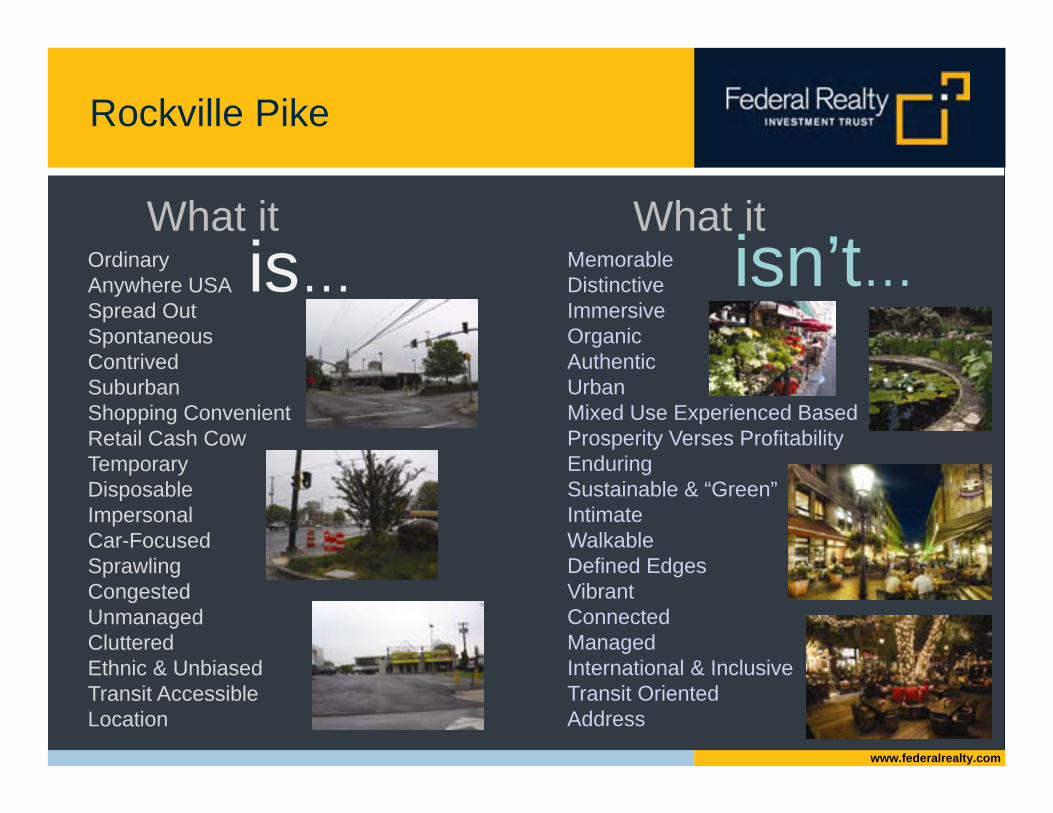
Rockville Pike
OrdinaryAnywhere USASpread OutSpontaneousContrivedSuburbanShopping ConvenientRetail Cash CowTemporaryDisposableImpersonalCar-FocusedSprawlingCongestedUnmanagedClutteredEthnic & UnbiasedTransit AccessibleLocation
MemorableDistinctiveImmersiveOrganicAuthenticUrbanMixed Use Experienced BasedProsperity Verses ProfitabilityEnduringSustainable & “Green”IntimateWalkableDefined EdgesVibrantConnectedManagedInternational & InclusiveTransit OrientedAddress
What it What itis… isn’t…
www.federalrealty.com
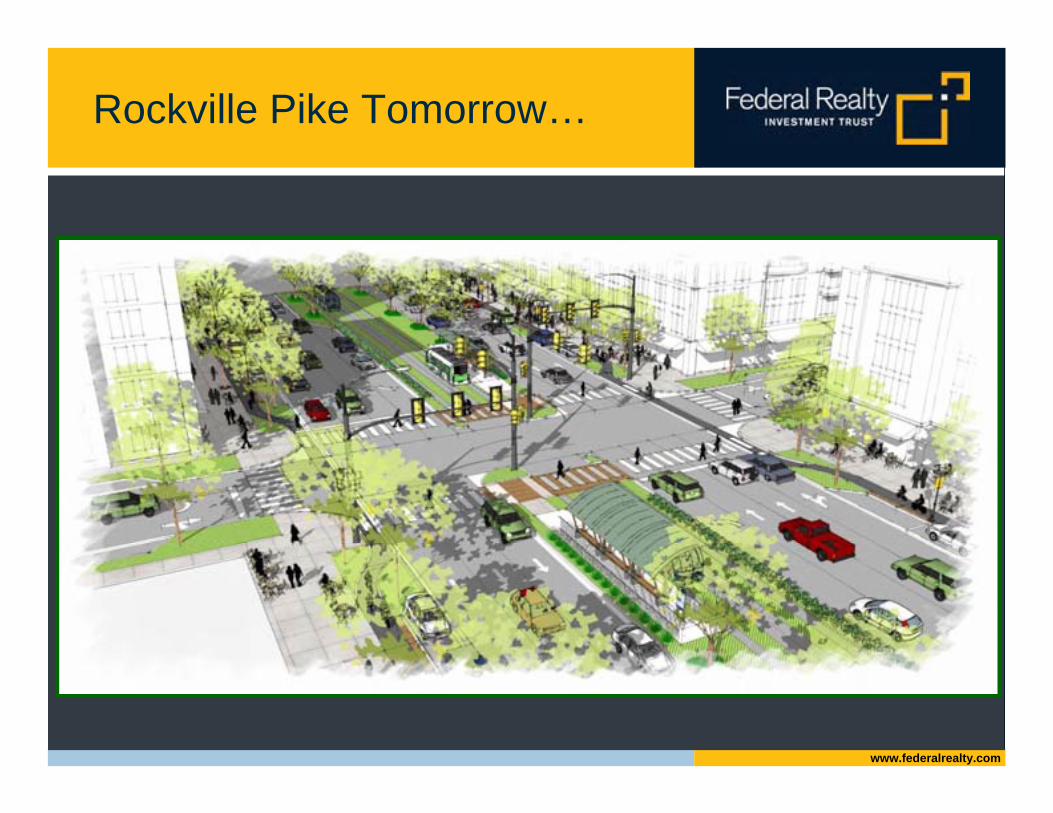
Rockville Pike Tomorrow…
www.federalrealty.com
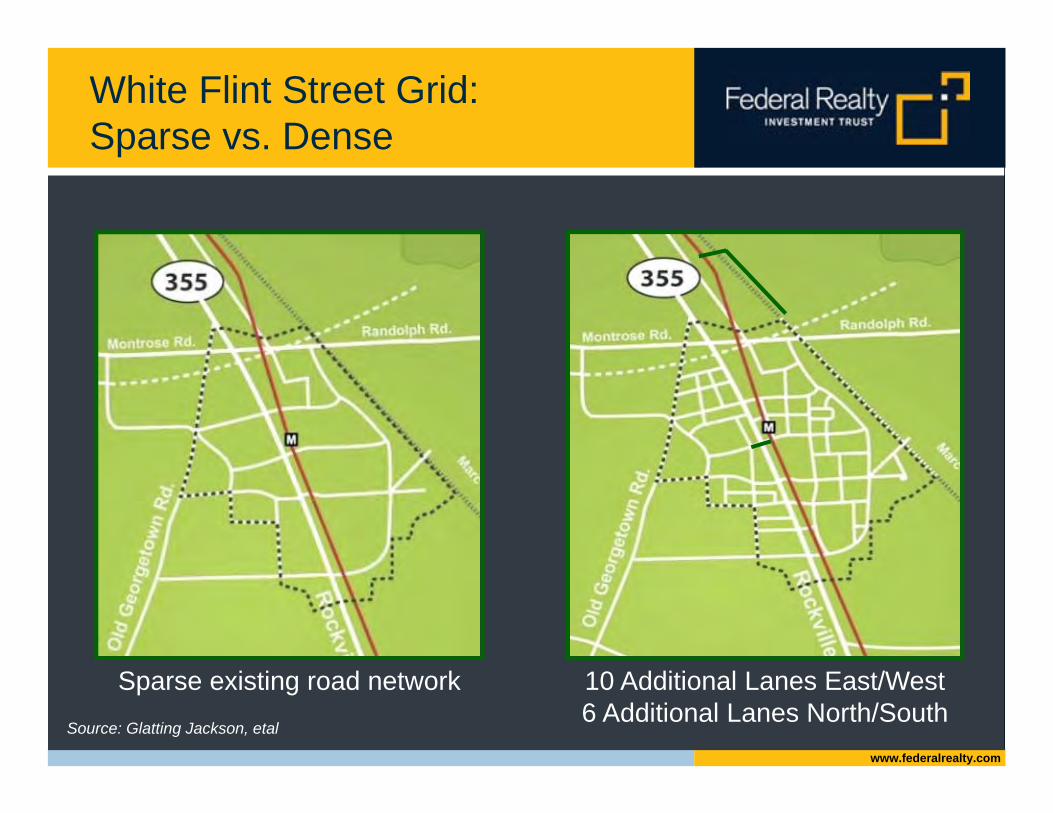
White Flint Street Grid:Sparse vs. Dense
Source: Glatting Jackson, etal
Sparse existing road network 10 Additional Lanes East/West6 Additional Lanes North/South
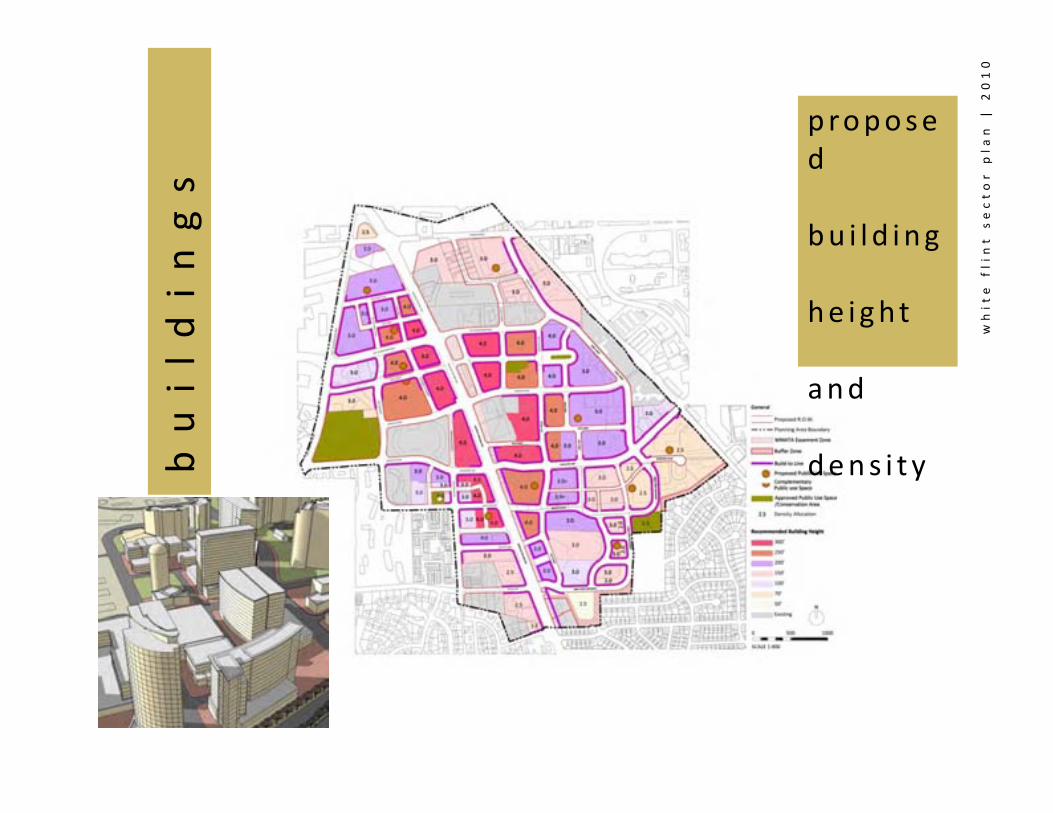
b u il d in g s
proposed
bu i l d ing
he i ght
and
dens i t y
whit
e f
lint s
ector p
lan |
2010
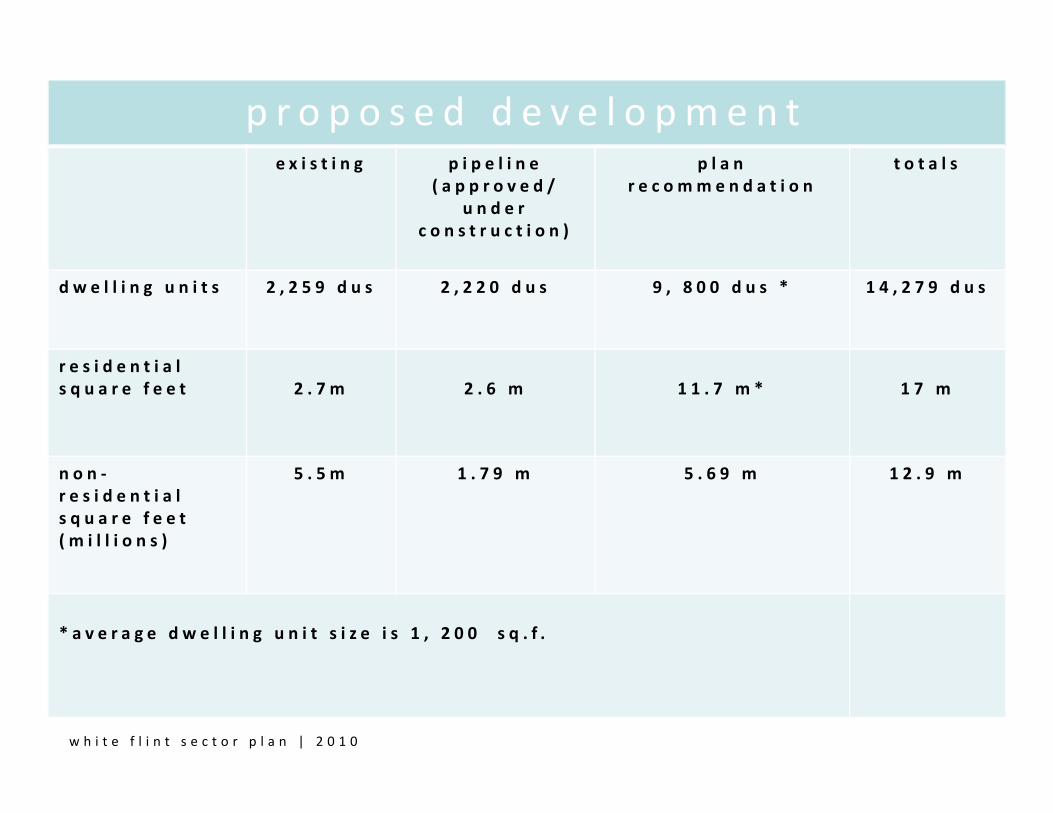
p r o p o s e d d e v e l o pm e n te x i s t i n g p i p e l i n e
( a p p r o v e d /u n d e r
c o n s t r u c t i o n )
p l a n r e c o mm e n d a t i o n
t o t a l s
d w e l l i n g u n i t s 2 , 2 5 9 d u s 2 , 2 2 0 d u s 9 , 8 0 0 d u s * 1 4 , 2 7 9 d u s
r e s i d e n t i a ls q u a r e f e e t 2 . 7 m 2 . 6 m 1 1 . 7 m * 1 7 m
n o n ‐r e s i d e n t i a l s q u a r e f e e t( m i l l i o n s )
5 . 5 m 1 . 7 9 m 5 . 6 9 m 1 2 . 9 m
* a v e r a g e d w e l l i n g u n i t s i z e i s 1 , 2 0 0 s q . f .
w h i t e f l i n t s e c t o r p l a n | 2 0 1 0
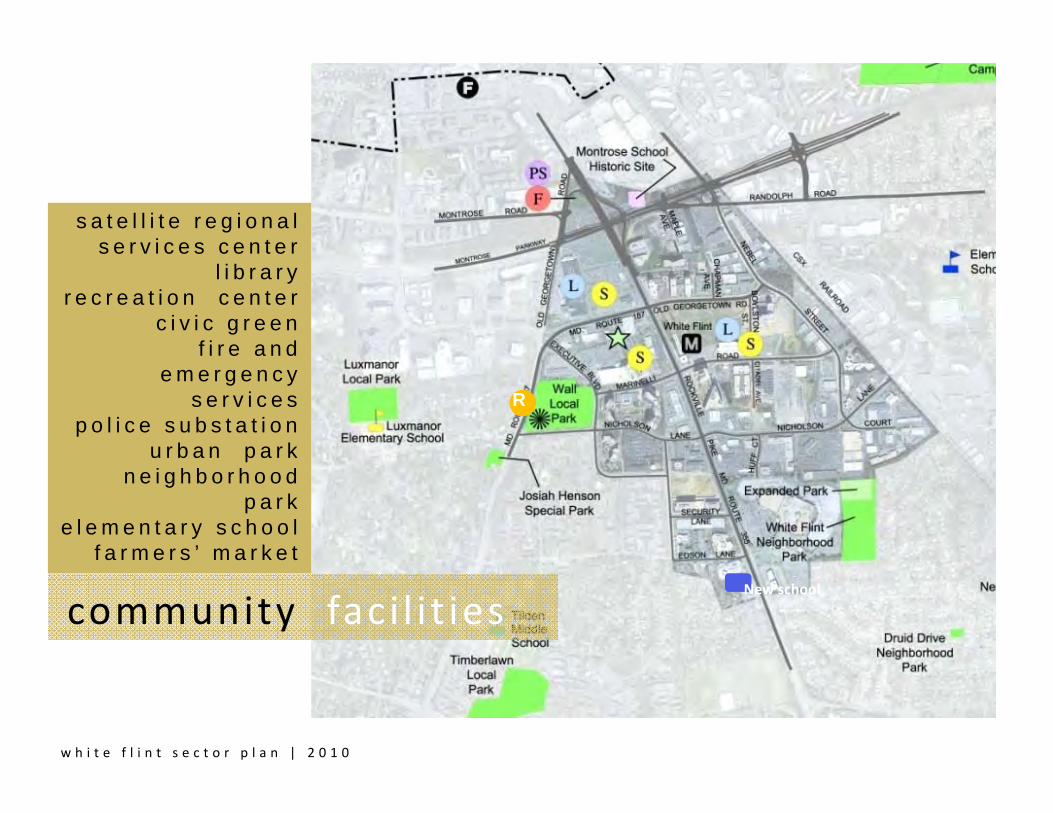
community faci l i t ies
s a t e l l i t e r e g i o n a l s e r v i c e s c e n t e r
l i b r a r yr e c r e a t i o n c e n t e r
c i v i c g r e e n f i r e a n d
e m e r g e n c ys e r v i c e s
p o l i c e s u b s t a t i o nu r b a n p a r k
n e i g h b o r h o o d p a r k
e l e m e n t a r y s c h o o l f a r m e r s ’ m a r k e t
New school
R
w h i t e f l i n t s e c t o r p l a n | 2 0 1 0
www.federalrealty.com
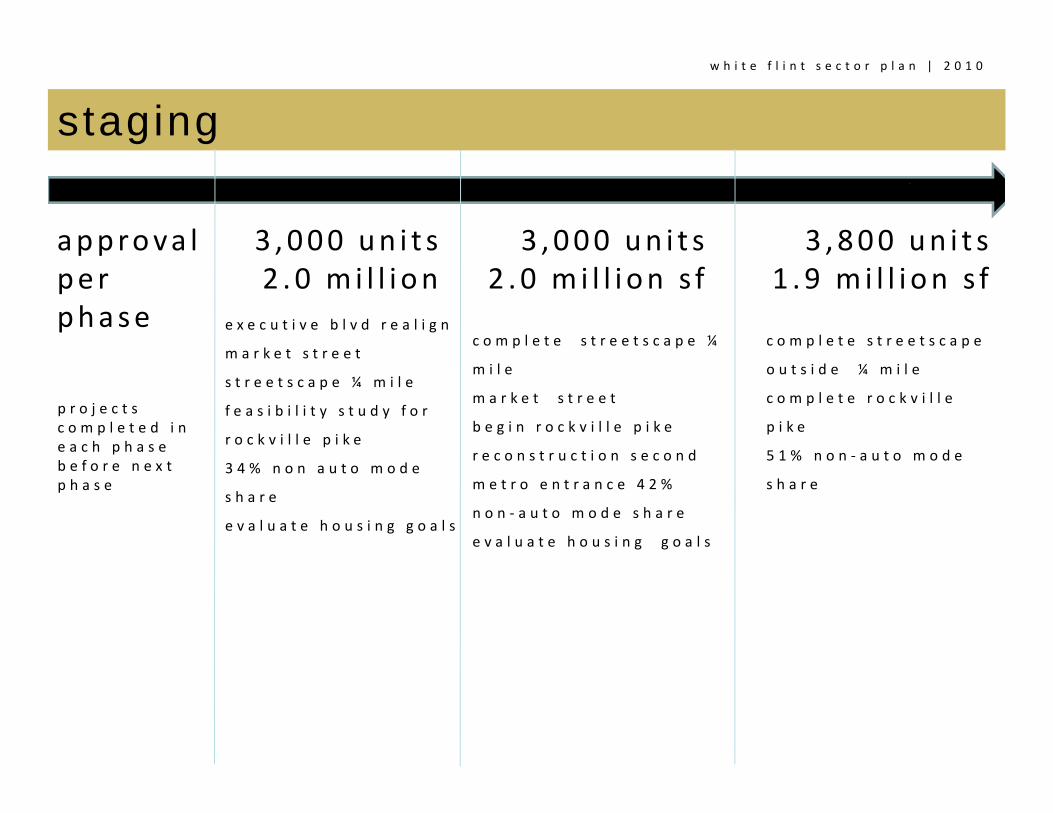
staging
approva lpe r phase e x e c u t i v e b l v d r e a l i g n
m a r k e t s t r e e t
s t r e e t s c a p e ¼ m i l e
f e a s i b i l i t y s t u d y f o r
r o c k v i l l e p i k e
3 4 % n o n a u t o m o d e
s h a r e
e v a l u a t e h o u s i n g g o a l s
c o m p l e t e s t r e e t s c a p e ¼
m i l e
m a r k e t s t r e e t
b e g i n r o c k v i l l e p i k e
r e c o n s t r u c t i o n s e c o n d
m e t r o e n t r a n c e 4 2 %
n o n ‐ a u t o m o d e s h a r e
e v a l u a t e h o u s i n g g o a l s
c o m p l e t e s t r e e t s c a p e
o u t s i d e ¼ m i l e
c o m p l e t e r o c k v i l l e
p i k e
5 1 % n o n ‐ a u t o m o d e
s h a r e
3 , 000 un i t s2 .0 mi l l i on
3 ,000 un i t s2 .0 mi l l i on s f
p r o j e c t s c o m p l e t e d i n e a c h p h a s e b e f o r e n e x tp h a s e
3 ,800 un i t s1 .9 mi l l i on s f
w h i t e f l i n t s e c t o r p l a n | 2 0 1 0
www.federalrealty.com
3. INFRASTRUCTURE FINANCING
www.federalrealty.com
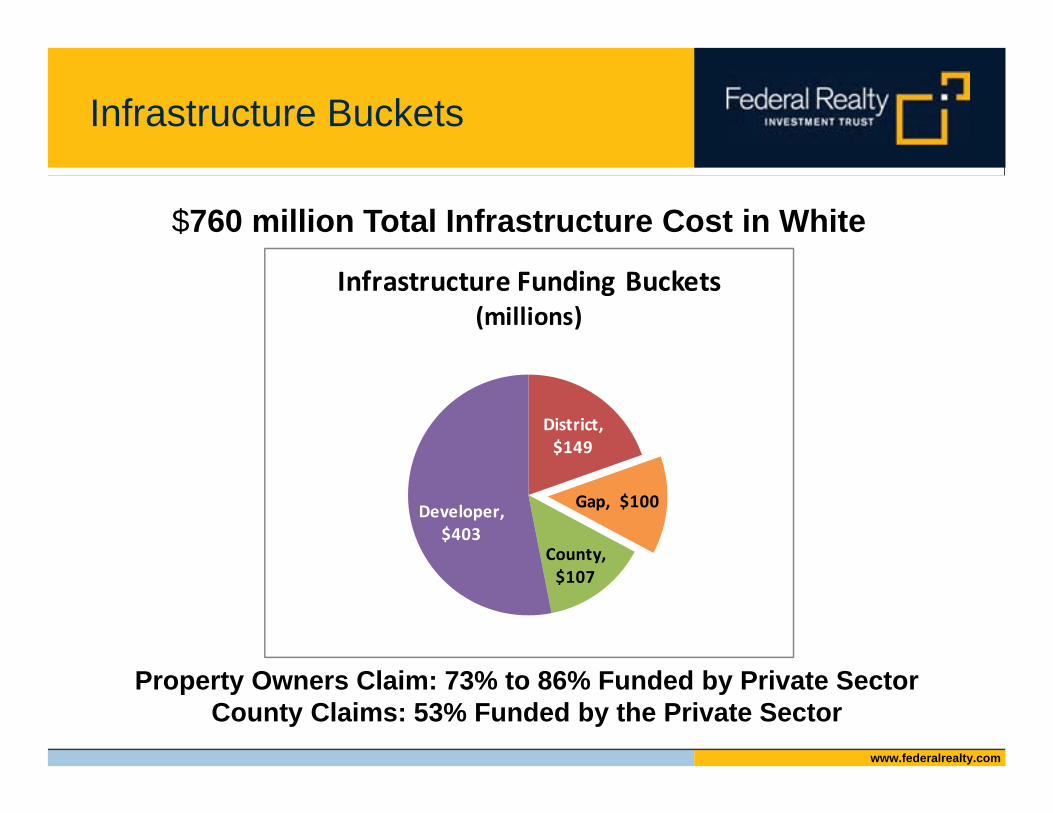
Infrastructure Buckets
$760 million Total Infrastructure Cost in White Flint…
Property Owners Claim: 73% to 86% Funded by Private SectorCounty Claims: 53% Funded by the Private Sector
District, $149
Gap, $100
County, $107
Developer, $403
Infrastructure Funding Buckets(millions)
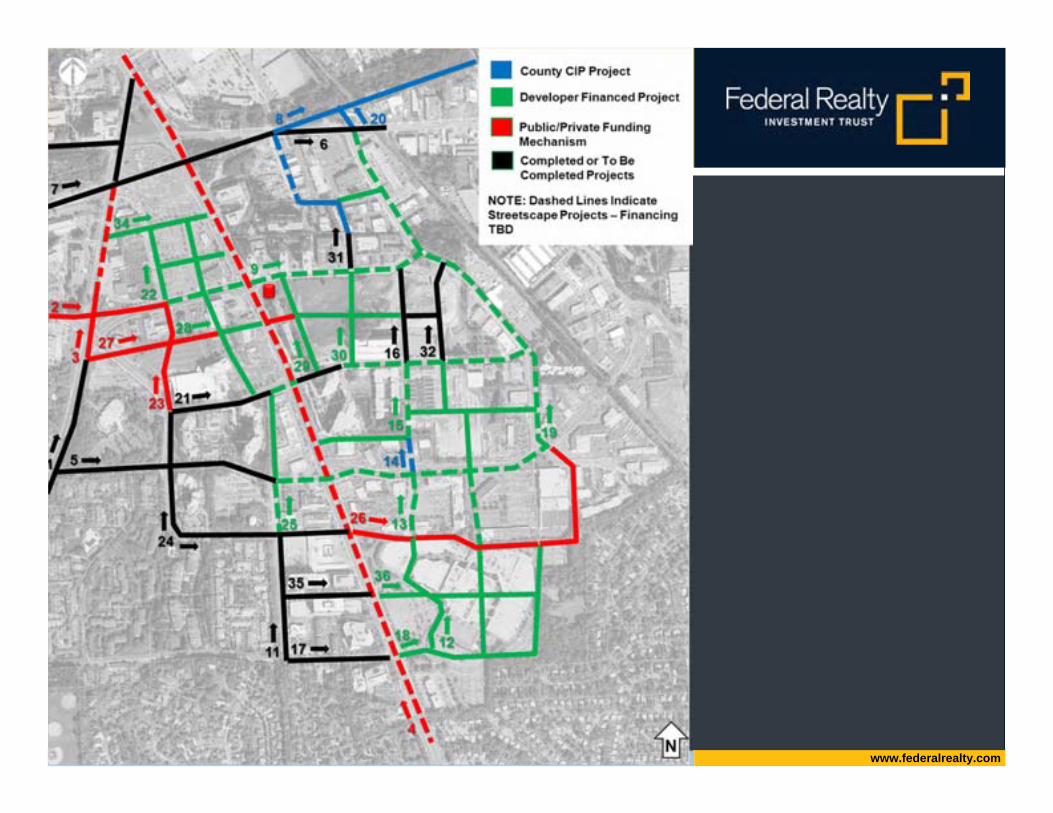
www.federalrealty.com
Western
Workaround
Eastern
Workaround
Ph III
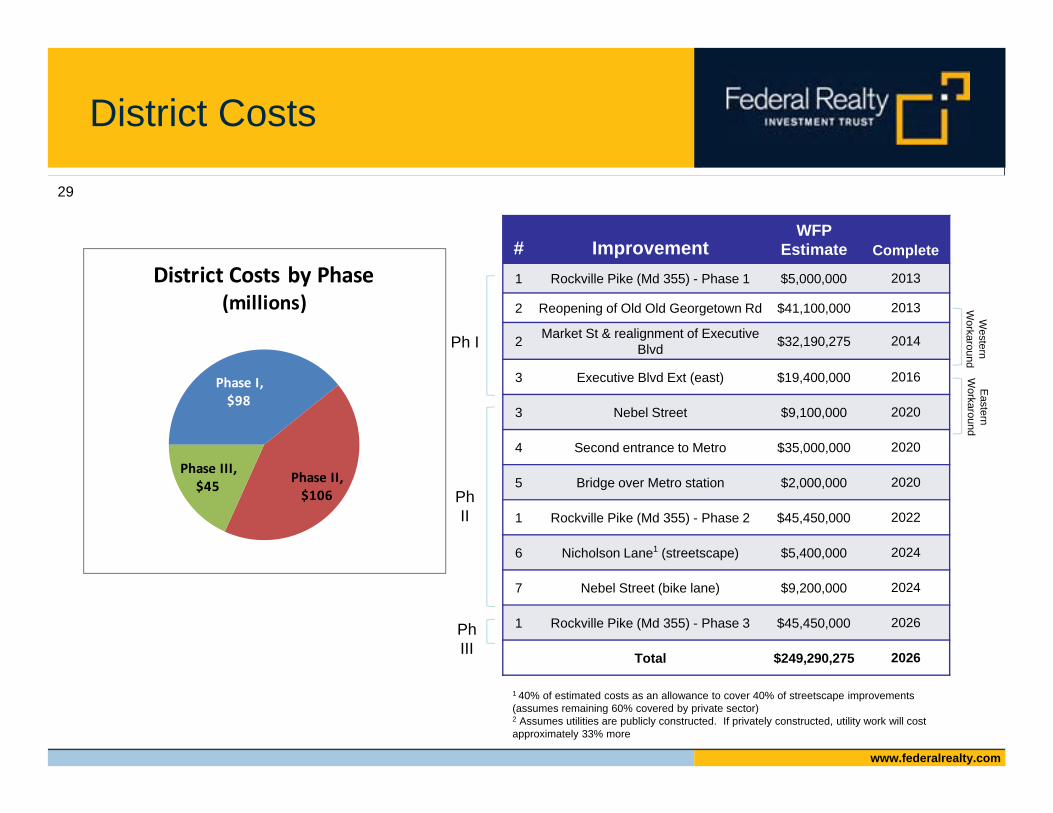
District Costs
# ImprovementWFP
Estimate Complete
1 Rockville Pike (Md 355) - Phase 1 $5,000,000 2013
2 Reopening of Old Old Georgetown Rd $41,100,000 2013
2 Market St & realignment of Executive Blvd $32,190,275 2014
3 Executive Blvd Ext (east) $19,400,000 2016
3 Nebel Street $9,100,000 2020
4 Second entrance to Metro $35,000,000 2020
5 Bridge over Metro station $2,000,000 2020
1 Rockville Pike (Md 355) - Phase 2 $45,450,000 2022
6 Nicholson Lane1 (streetscape) $5,400,000 2024
7 Nebel Street (bike lane) $9,200,000 2024
1 Rockville Pike (Md 355) - Phase 3 $45,450,000 2026
Total $249,290,275 2026
1 40% of estimated costs as an allowance to cover 40% of streetscape improvements (assumes remaining 60% covered by private sector)2 Assumes utilities are publicly constructed. If privately constructed, utility work will cost approximately 33% more
Ph I
Ph II
Phase I, $98
Phase II, $106
Phase III, $45
District Costs by Phase(millions)
29
www.federalrealty.com
$‐
$2
$4
$6
$8
$10
$12
$14
$16
$18
$20
‐
5
10
15
20
25
30
35
Value (billions)
Square Fee
t (millions)
Year
Existing New Development Value
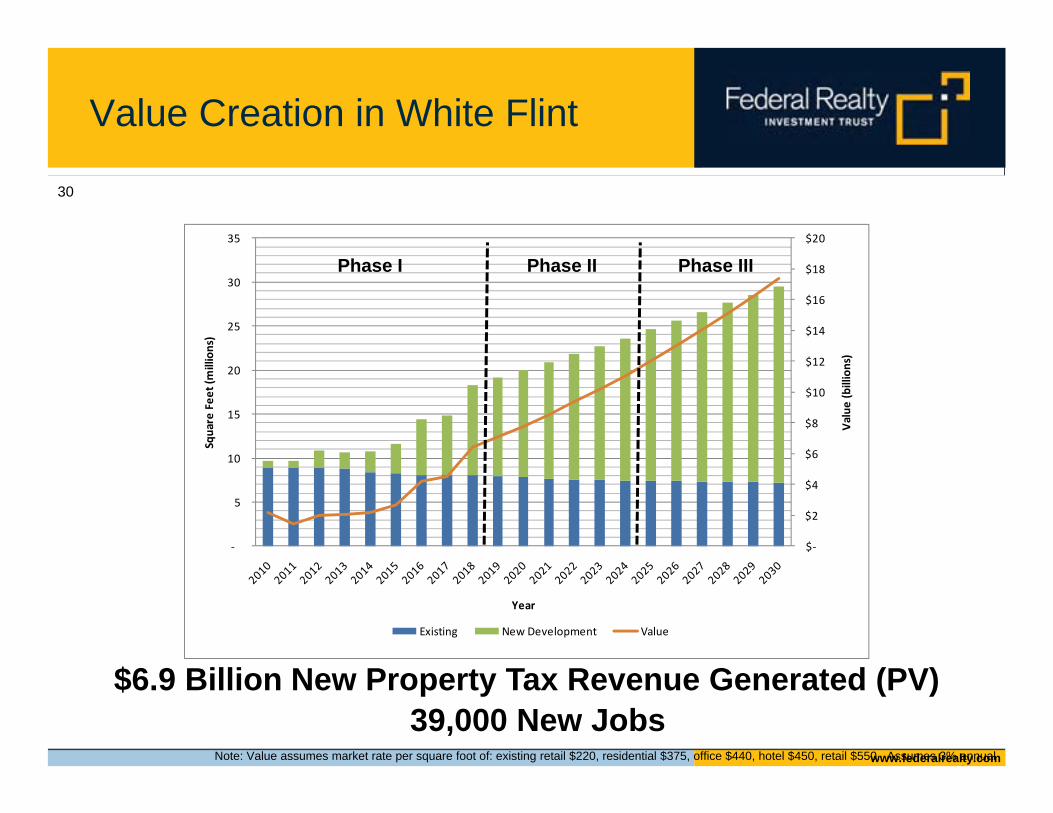
Value Creation in White Flint
Phase I Phase II Phase III
$6.9 Billion New Property Tax Revenue Generated (PV)
Note: Value assumes market rate per square foot of: existing retail $220, residential $375, office $440, hotel $450, retail $550. Assumes 3% annual th t
39,000 New Jobs
30
www.federalrealty.com
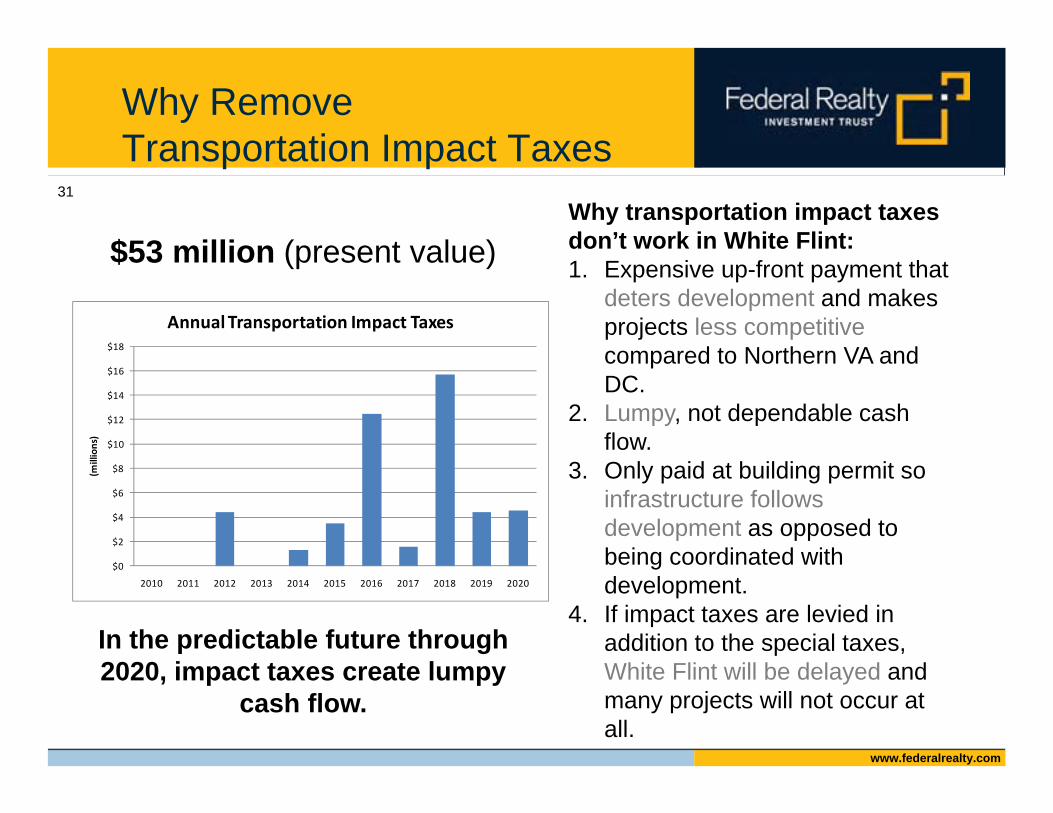
Why Remove Transportation Impact Taxes
In the predictable future through 2020, impact taxes create lumpy
cash flow.
$53 million (present value)
$0
$2
$4
$6
$8
$10
$12
$14
$16
$18
2010 2011 2012 2013 2014 2015 2016 2017 2018 2019 2020
(millions)
Annual Transportation Impact Taxes
Why transportation impact taxes don’t work in White Flint:1. Expensive up-front payment that
deters development and makes projects less competitivecompared to Northern VA and DC.
2. Lumpy, not dependable cash flow.
3. Only paid at building permit so infrastructure follows development as opposed to being coordinated with development.
4. If impact taxes are levied in addition to the special taxes, White Flint will be delayed and many projects will not occur at all.
31
www.federalrealty.com
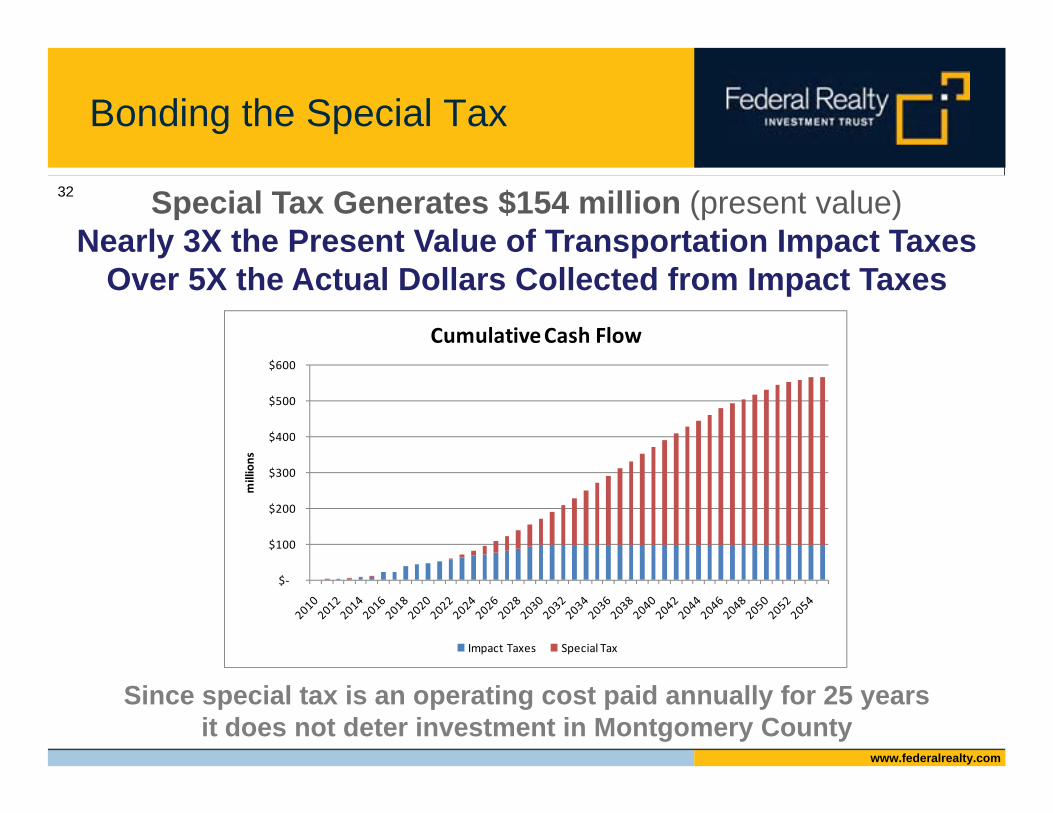
Bonding the Special Tax
Since special tax is an operating cost paid annually for 25 years it does not deter investment in Montgomery County
Special Tax Generates $154 million (present value)Nearly 3X the Present Value of Transportation Impact Taxes
Over 5X the Actual Dollars Collected from Impact Taxes
$‐
$100
$200
$300
$400
$500
$600
millions
Cumulative Cash Flow
Impact Taxes Special Tax
32
www.federalrealty.com
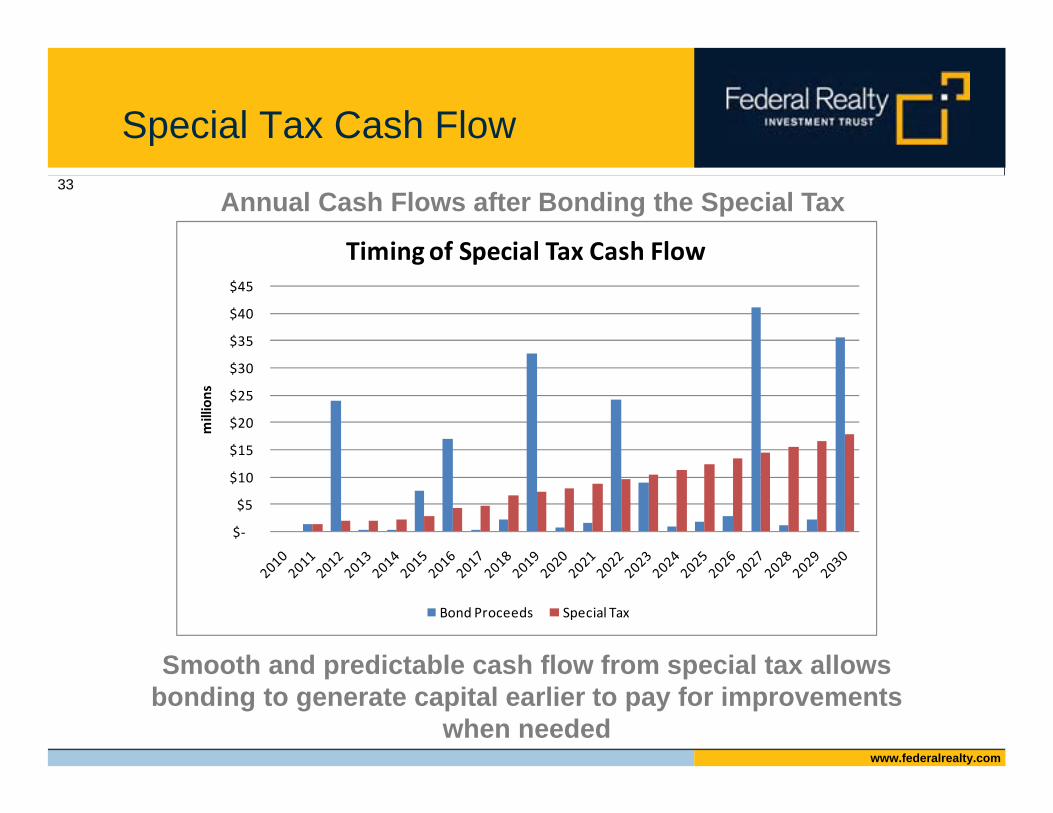
Special Tax Cash Flow
Annual Cash Flows after Bonding the Special Tax
Smooth and predictable cash flow from special tax allows bonding to generate capital earlier to pay for improvements
when needed
$‐
$5
$10
$15
$20
$25
$30
$35
$40
$45
millions
Timing of Special Tax Cash Flow
Bond Proceeds Special Tax
33
www.federalrealty.com
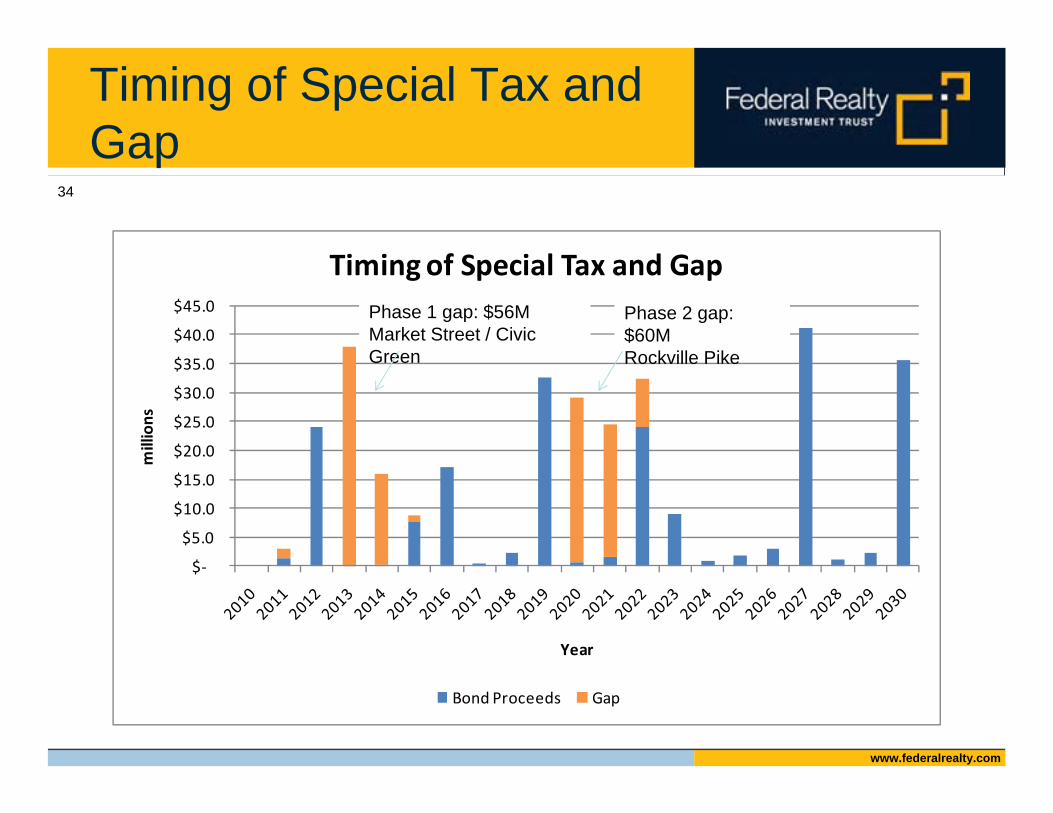
$‐
$5.0
$10.0
$15.0
$20.0
$25.0
$30.0
$35.0
$40.0
$45.0
millions
Year
Timing of Special Tax and Gap
Bond Proceeds Gap
Timing of Special Tax and Gap
Phase 1 gap: $56MMarket Street / Civic Green
Phase 2 gap: $60MRockville Pike
34
www.federalrealty.com
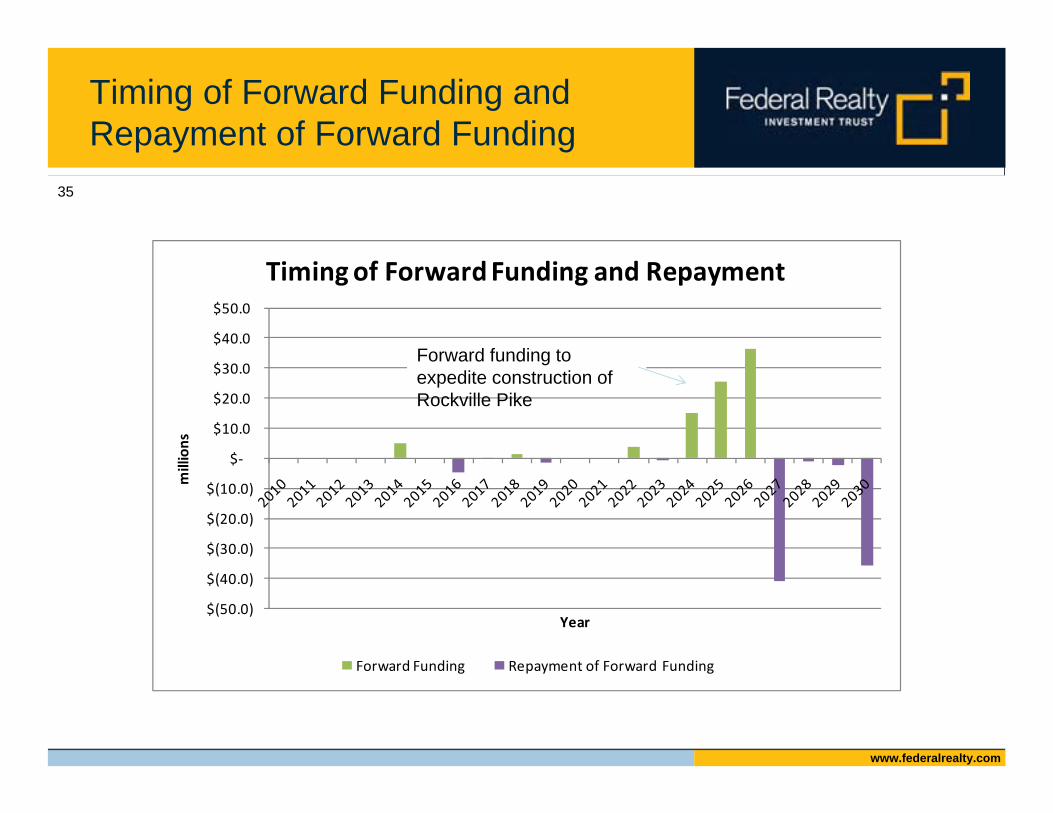
Timing of Forward Funding and Repayment of Forward Funding
$(50.0)
$(40.0)
$(30.0)
$(20.0)
$(10.0)
$‐
$10.0
$20.0
$30.0
$40.0
$50.0
millions
Year
Timing of Forward Funding and Repayment
Forward Funding Repayment of Forward Funding
Forward funding to expedite construction of Rockville Pike
35
www.federalrealty.com
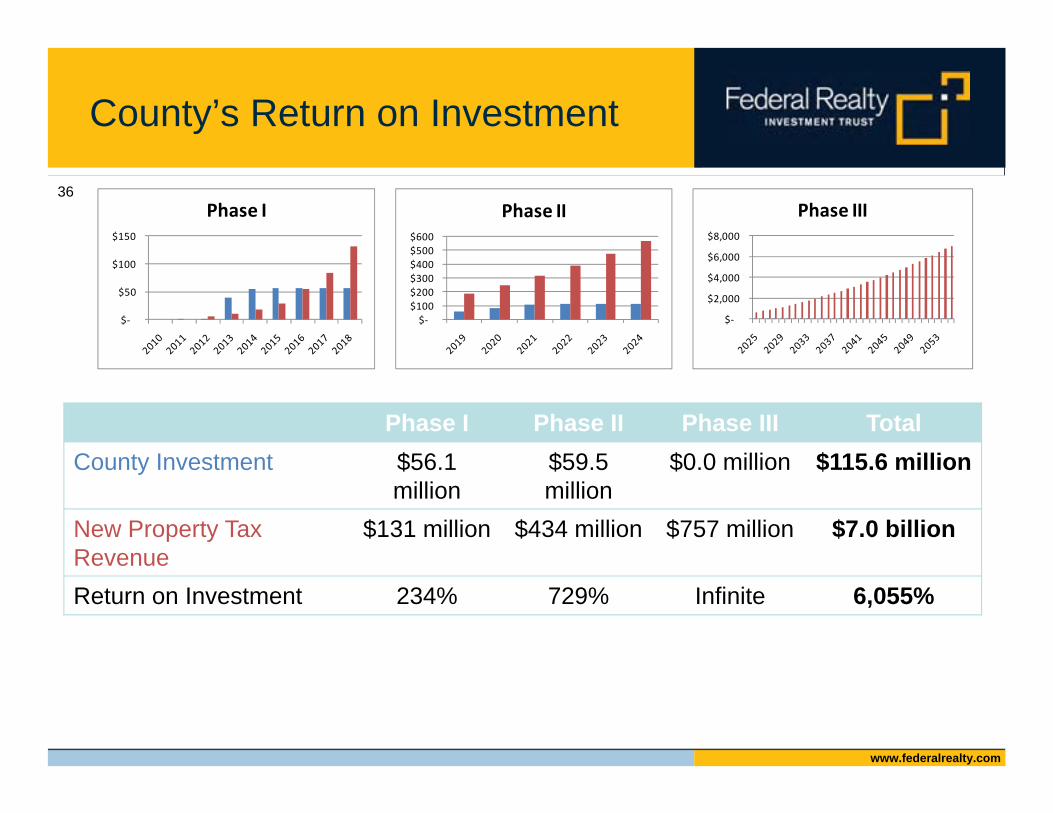
County’s Return on Investment
Phase I Phase II Phase III TotalCounty Investment $56.1
million$59.5 million
$0.0 million $115.6 million
New Property Tax Revenue
$131 million $434 million $757 million $7.0 billion
Return on Investment 234% 729% Infinite 6,055%
$‐
$50
$100
$150
Phase I
$‐$100 $200 $300 $400 $500 $600
Phase II36
$‐
$2,000
$4,000
$6,000
$8,000
Phase III
www.federalrealty.com
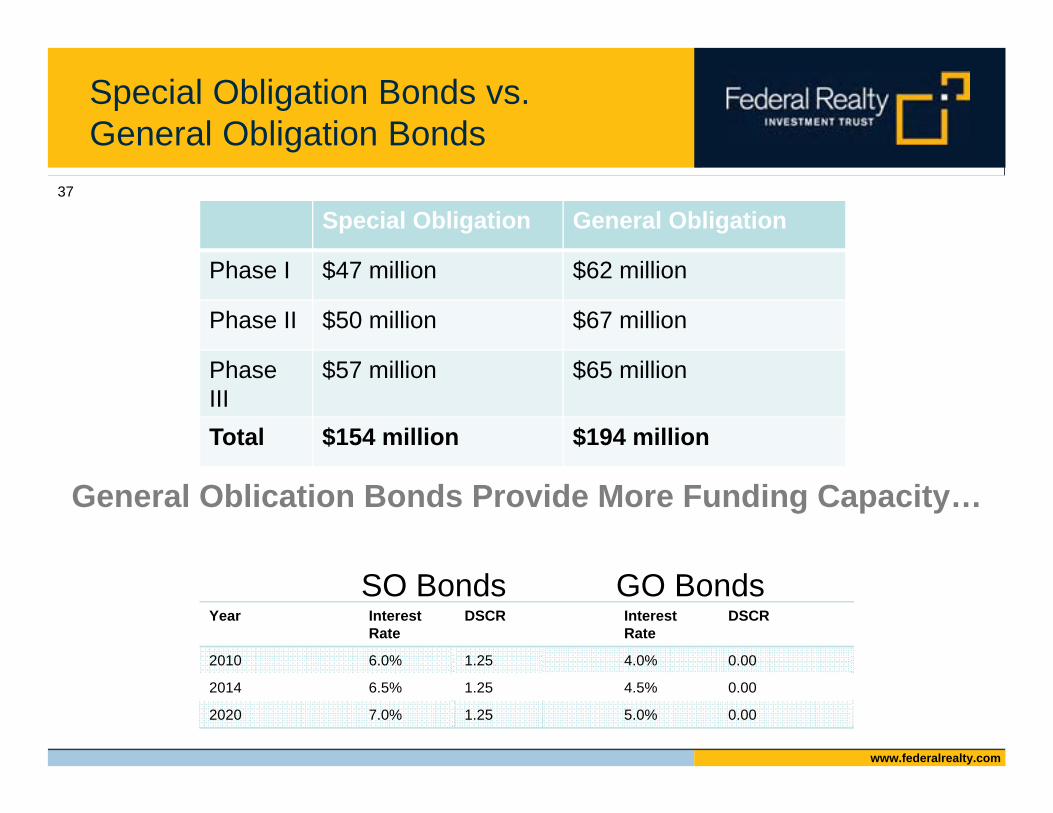
Special Obligation Bonds vs. General Obligation Bonds
General Oblication Bonds Provide More Funding Capacity…
Interest Rate
DSCR
4.0% 0.00
4.5% 0.00
5.0% 0.00
Year Interest Rate
DSCR
2010 6.0% 1.25
2014 6.5% 1.25
2020 7.0% 1.25
SO Bonds GO Bonds
Special Obligation General Obligation
Phase I $47 million $62 million
Phase II $50 million $67 million
Phase III
$57 million $65 million
Total $154 million $194 million
37
www.federalrealty.com
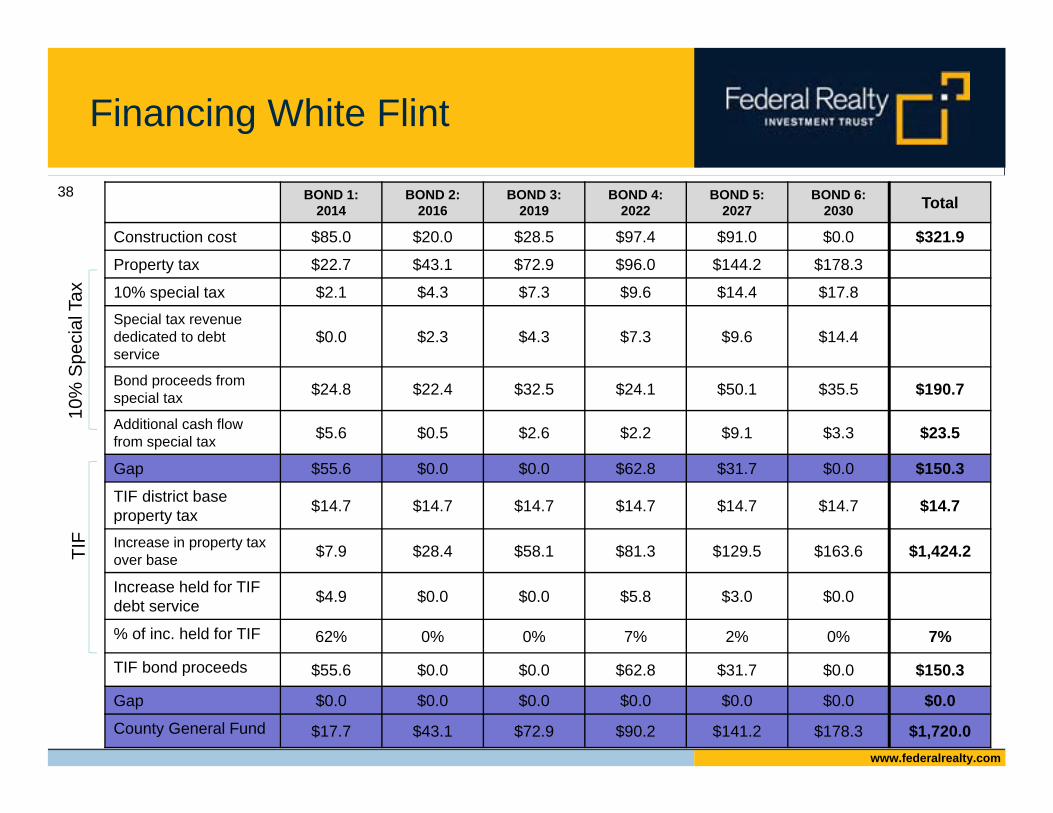
Financing White Flint
38 BOND 1:2014
BOND 2: 2016
BOND 3: 2019
BOND 4: 2022
BOND 5: 2027
BOND 6: 2030 Total
Construction cost $85.0 $20.0 $28.5 $97.4 $91.0 $0.0 $321.9
Property tax $22.7 $43.1 $72.9 $96.0 $144.2 $178.3
10% special tax $2.1 $4.3 $7.3 $9.6 $14.4 $17.8Special tax revenue dedicated to debt service
$0.0 $2.3 $4.3 $7.3 $9.6 $14.4
Bond proceeds from special tax $24.8 $22.4 $32.5 $24.1 $50.1 $35.5 $190.7
Additional cash flow from special tax $5.6 $0.5 $2.6 $2.2 $9.1 $3.3 $23.5
Gap $55.6 $0.0 $0.0 $62.8 $31.7 $0.0 $150.3
TIF district base property tax $14.7 $14.7 $14.7 $14.7 $14.7 $14.7 $14.7
Increase in property tax over base $7.9 $28.4 $58.1 $81.3 $129.5 $163.6 $1,424.2
Increase held for TIF debt service $4.9 $0.0 $0.0 $5.8 $3.0 $0.0
% of inc. held for TIF 62% 0% 0% 7% 2% 0% 7%
TIF bond proceeds $55.6 $0.0 $0.0 $62.8 $31.7 $0.0 $150.3
Gap $0.0 $0.0 $0.0 $0.0 $0.0 $0.0 $0.0
County General Fund $17.7 $43.1 $72.9 $90.2 $141.2 $178.3 $1,720.0
10%
Spe
cial
Tax
TIF
www.federalrealty.com
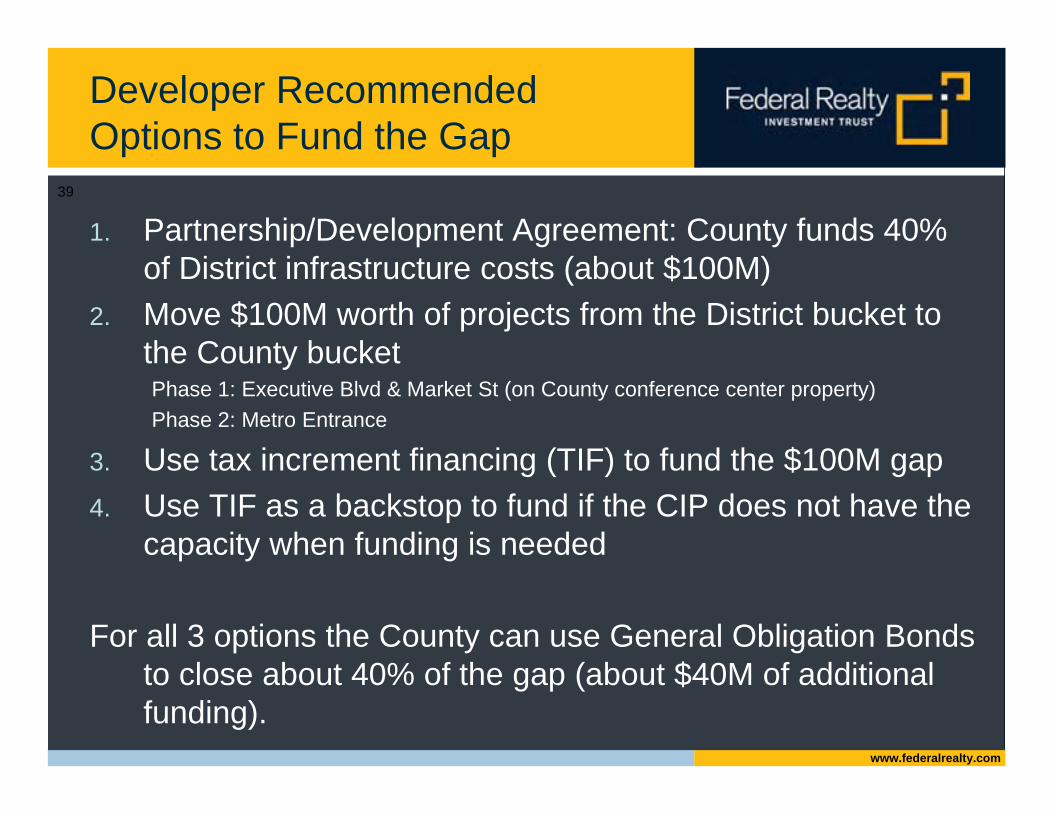
Developer Recommended Options to Fund the Gap
1. Partnership/Development Agreement: County funds 40% of District infrastructure costs (about $100M)
2. Move $100M worth of projects from the District bucket to the County bucketPhase 1: Executive Blvd & Market St (on County conference center property)Phase 2: Metro Entrance
3. Use tax increment financing (TIF) to fund the $100M gap4. Use TIF as a backstop to fund if the CIP does not have the
capacity when funding is needed
For all 3 options the County can use General Obligation Bonds to close about 40% of the gap (about $40M of additional funding).
39
www.federalrealty.com
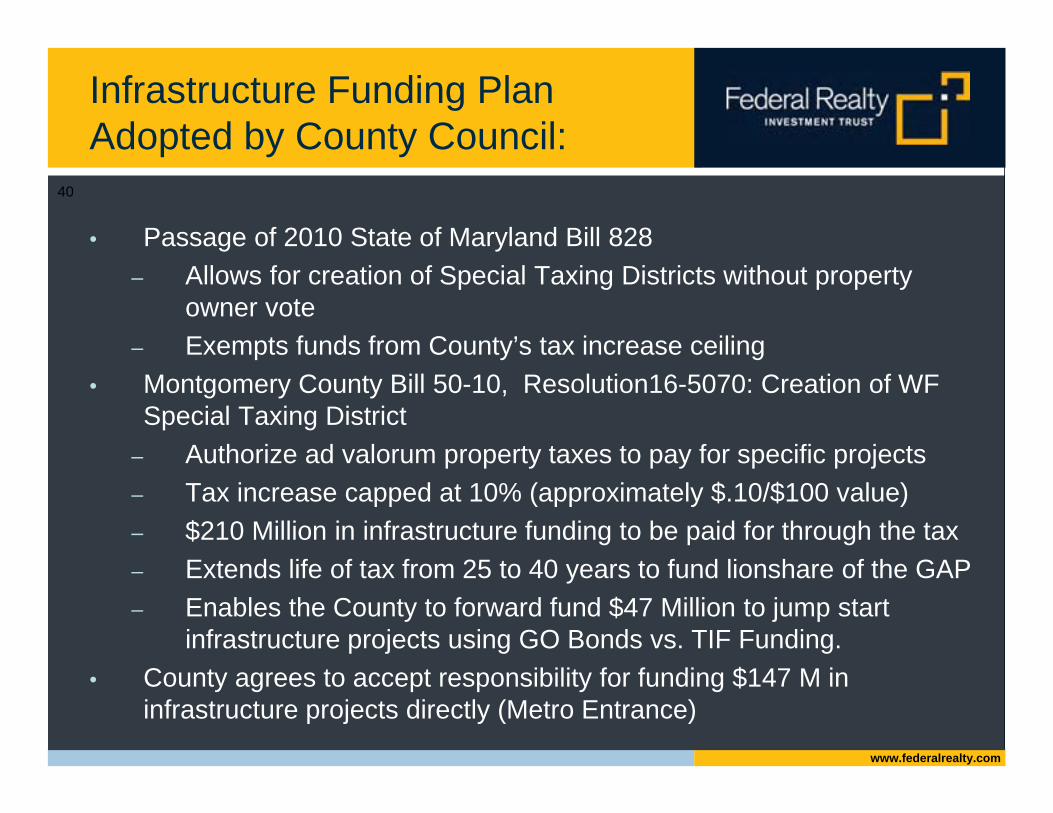
Infrastructure Funding Plan Adopted by County Council:
• Passage of 2010 State of Maryland Bill 828– Allows for creation of Special Taxing Districts without property
owner vote– Exempts funds from County’s tax increase ceiling
• Montgomery County Bill 50-10, Resolution16-5070: Creation of WF Special Taxing District
– Authorize ad valorum property taxes to pay for specific projects– Tax increase capped at 10% (approximately $.10/$100 value) – $210 Million in infrastructure funding to be paid for through the tax– Extends life of tax from 25 to 40 years to fund lionshare of the GAP– Enables the County to forward fund $47 Million to jump start
infrastructure projects using GO Bonds vs. TIF Funding. • County agrees to accept responsibility for funding $147 M in
infrastructure projects directly (Metro Entrance)
40

www.federalrealty.com
4. RESULTS ON THE GROUND:
FUTURE OF WHITE FLINT
www.federalrealty.com
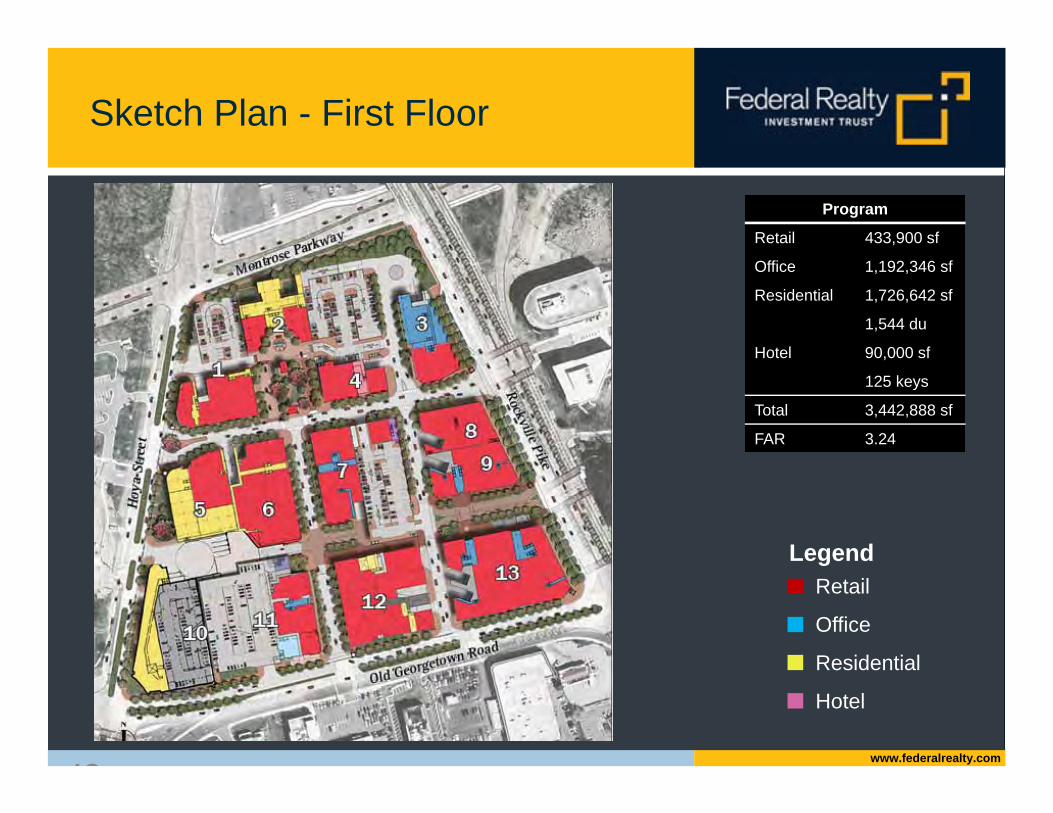
Sketch Plan - First Floor
Program
Retail 433,900 sf
Office 1,192,346 sf
Residential 1,726,642 sf
1,544 du
Hotel 90,000 sf
125 keys
Total 3,442,888 sf
FAR 3.24
Retail
Office
Residential
Hotel
Legend
42
www.federalrealty.com
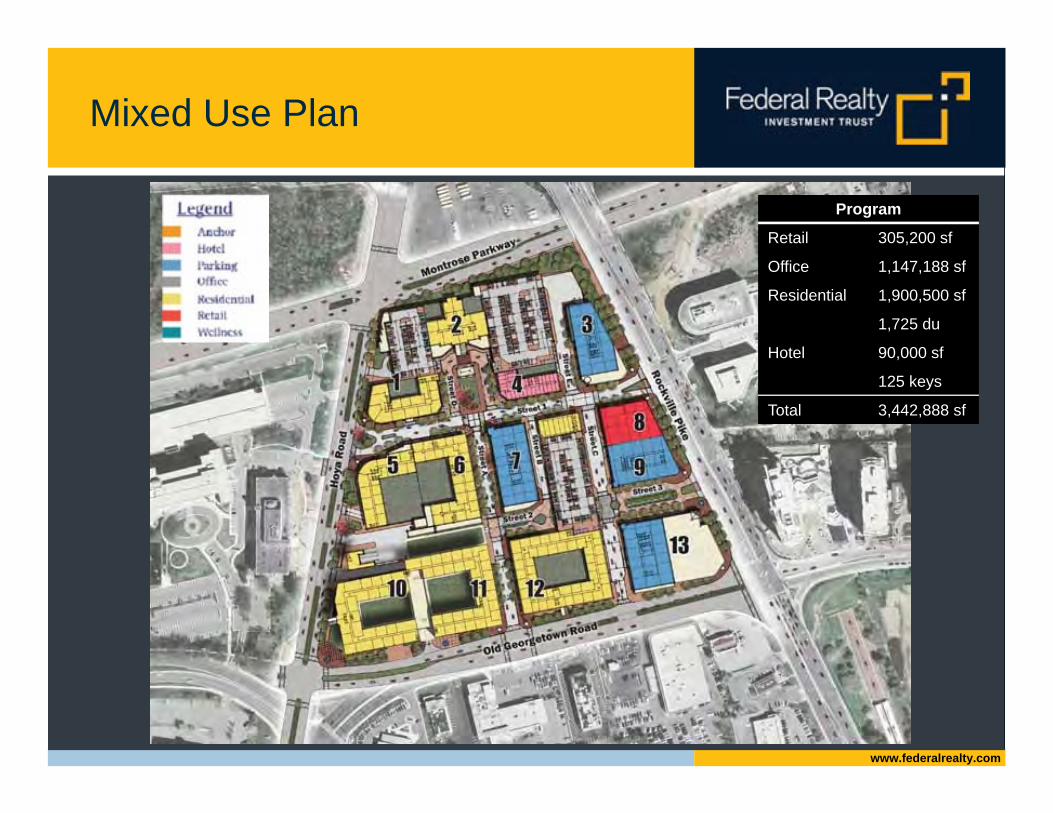
Mixed Use Plan
Program
Retail 305,200 sf
Office 1,147,188 sf
Residential 1,900,500 sf
1,725 du
Hotel 90,000 sf
125 keys
Total 3,442,888 sf
www.federalrealty.com
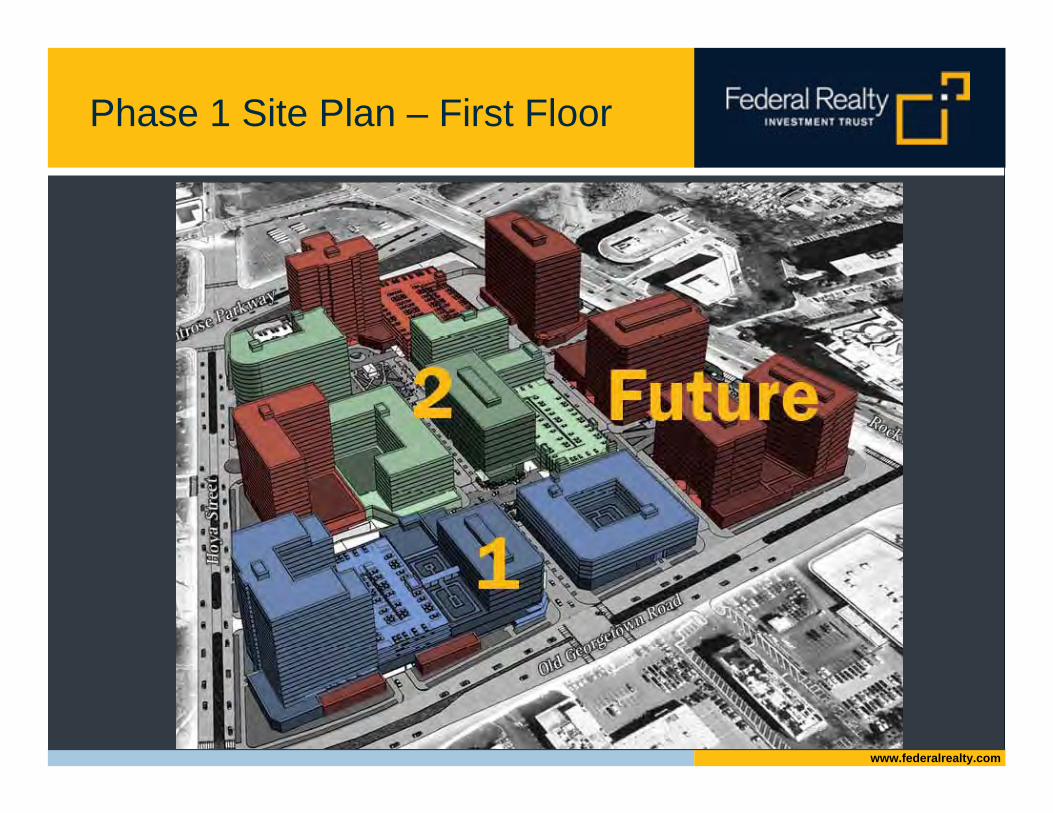
Phase 1 Site Plan – First Floor
www.federalrealty.com
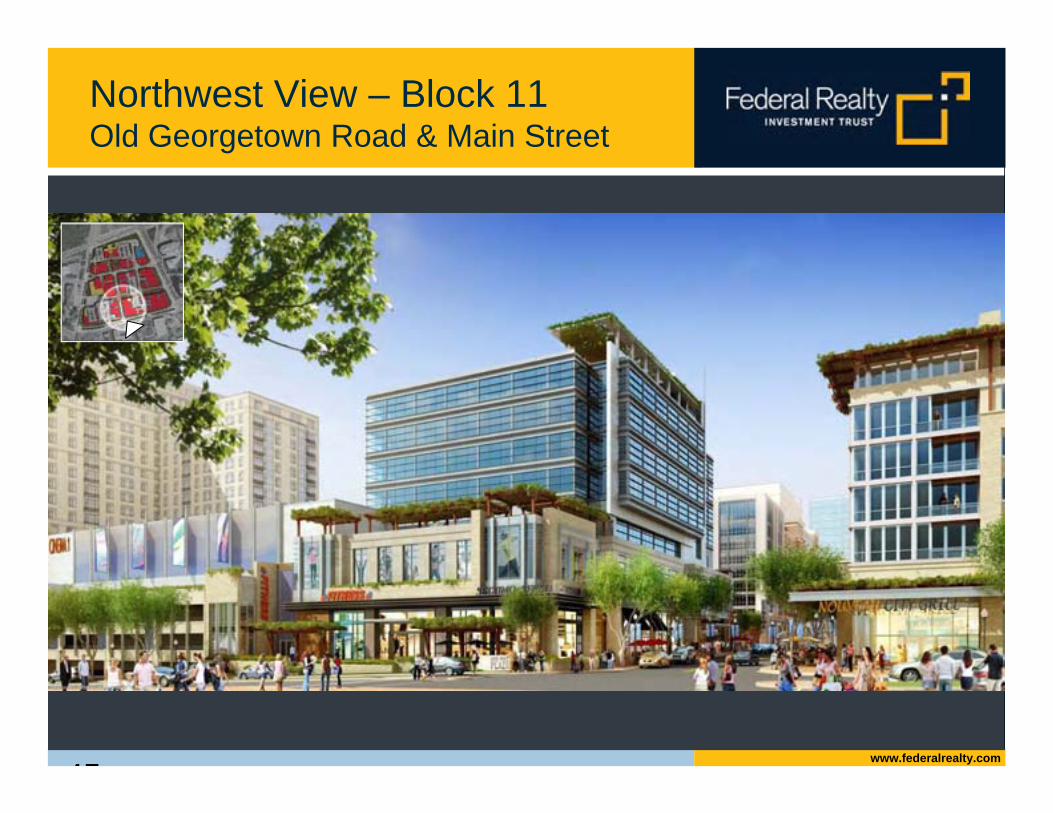
Northwest View – Block 11Old Georgetown Road & Main Street
45
www.federalrealty.com
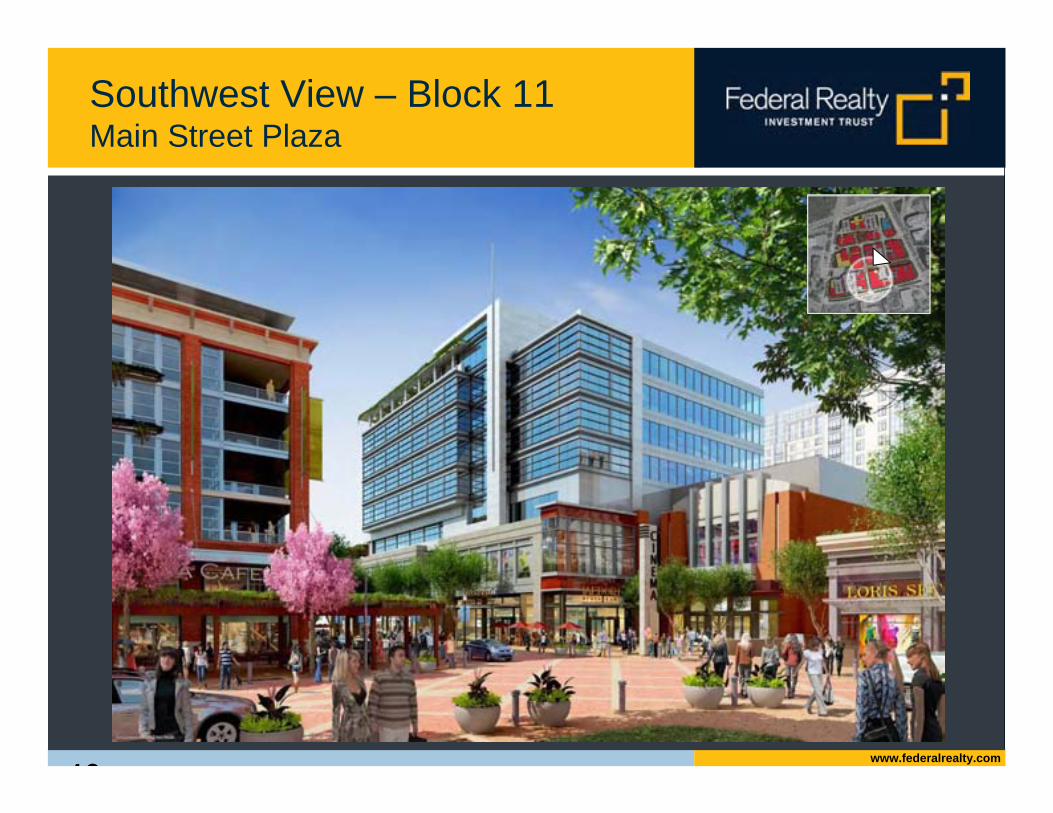
Southwest View – Block 11Main Street Plaza
46
www.federalrealty.com
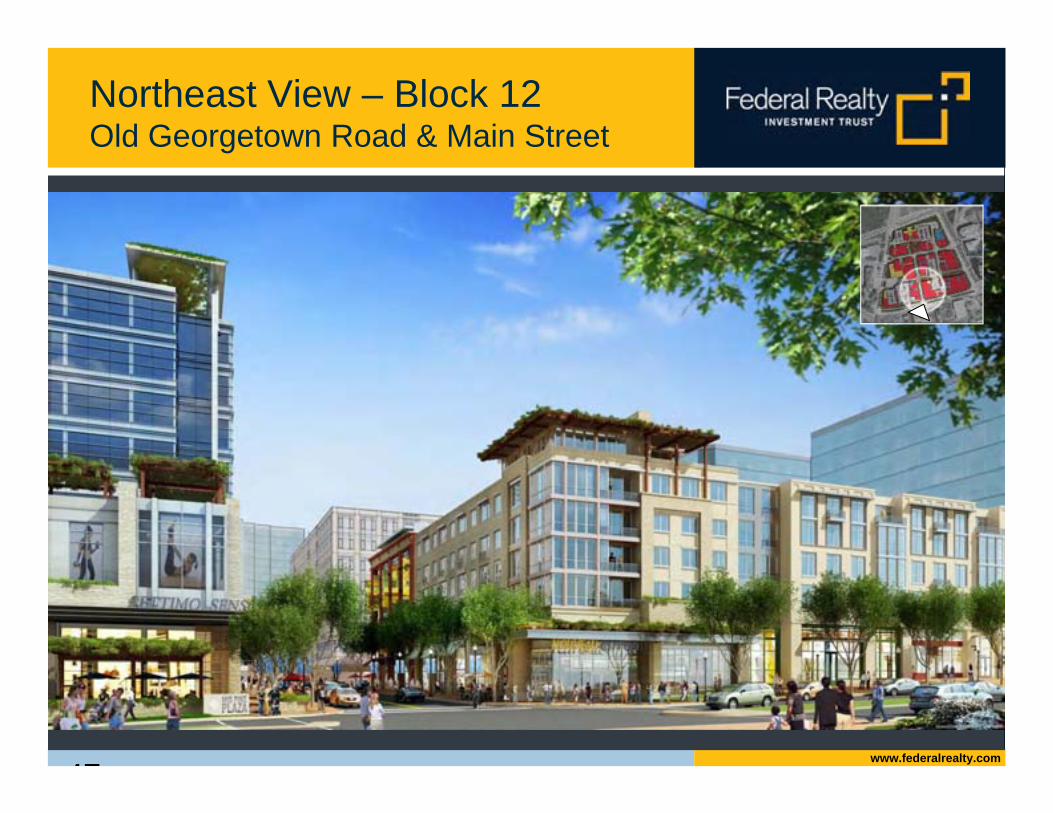
Northeast View – Block 12Old Georgetown Road & Main Street
47
www.federalrealty.com
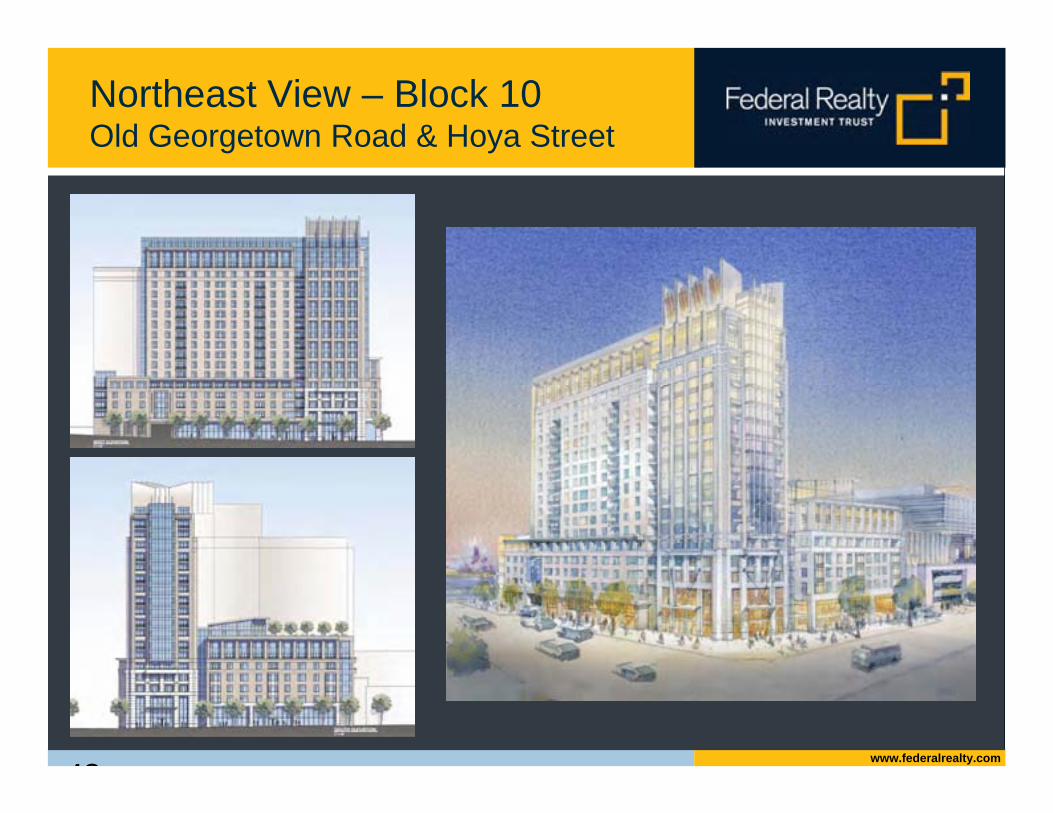
Northeast View – Block 10Old Georgetown Road & Hoya Street
48

www.federalrealty.com
www.federalrealty.com
Feel Free to Contact with Questions:Evan Goldman, Tommy [email protected]
49