Embed Size (px)
Citation preview
RESEARCH PAPER
White adipose tissue reference network: a knowledge resourcefor exploring health-relevant relations
Thomas Kelder • Georg Summer • Martien Caspers • Evert M. van Schothorst •
Jaap Keijer • Loes Duivenvoorde • Susanne Klaus • Anja Voigt • Laura Bohnert •
Catalina Pico • Andreu Palou • M. Luisa Bonet • Aldona Dembinska-Kiec •
Malgorzata Malczewska-Malec • Beata Kiec-Wilk • Josep M. del Bas •
Antoni Caimari • Lluis Arola • Marjan van Erk • Ben van Ommen •
Marijana Radonjic
Received: 24 June 2014 / Accepted: 24 October 2014 / Published online: 3 December 2014
� The Author(s) 2014. This article is published with open access at Springerlink.com
Abstract Optimal health is maintained by interaction of
multiple intrinsic and environmental factors at different
levels of complexity—from molecular, to physiological, to
social. Understanding and quantification of these interac-
tions will aid design of successful health interventions. We
introduce the reference network concept as a platform for
multi-level exploration of biological relations relevant for
metabolic health, by integration and mining of biological
interactions derived from public resources and context-
specific experimental data. A White Adipose Tissue Health
Reference Network (WATRefNet) was constructed as a
resource for discovery and prioritization of mechanism-
based biomarkers for white adipose tissue (WAT) health
status and the effect of food and drug compounds on WAT
health status. The WATRefNet (6,797 nodes and 32,171
edges) is based on (1) experimental data obtained from 10
studies addressing different adiposity states, (2) seven
public knowledge bases of molecular interactions, (3)
expert’s definitions of five physiologically relevant pro-
cesses key to WAT health, namely WAT expandability,
Oxidative capacity, Metabolic state, Oxidative stress and
Tissue inflammation, and (4) a collection of relevant
Electronic supplementary material The online version of thisarticle (doi:10.1007/s12263-014-0439-x) contains supplementarymaterial, which is available to authorized users.
T. Kelder � G. Summer � M. Caspers � M. van Erk �B. van Ommen � M. Radonjic (&)
Microbiology & Systems Biology, TNO, Zeist,
The Netherlands
e-mail: [email protected]
Present Address:
T. Kelder � M. Radonjic
EdgeLeap B.V., Hooghiemstraplein 15, 3514 AX Utrecht,
The Netherlands
G. Summer
CARIM, Maastricht University, Maastricht, The Netherlands
E. M. van Schothorst � J. Keijer � L. Duivenvoorde
Human and Animal Physiology, Wageningen University,
Wageningen, The Netherlands
S. Klaus � A. Voigt � L. Bohnert
Group of Energy Metabolism, German Institute of Human
Nutrition in Potsdam, Nuthetal, Germany
C. Pico � A. Palou � M. L. Bonet
Molecular Biology, Nutrition and Biotechnology
(Nutrigenomics), University of the Balearic Islands (UIB),
Palma de Mallorca, Spain
C. Pico � A. Palou � M. L. Bonet
CIBER Fisiopatologıa de la Obesidad y Nutricion (CIBEROBN),
Palma de Mallorca, Spain
A. Dembinska-Kiec � M. Malczewska-Malec
Department of Clinical Biochemistry, Jagiellonian University
Medical College, Krakow, Poland
B. Kiec-Wilk
Department of Metabolic Disorders, Jagiellonian University
Medical College, Krakow, Poland
J. M. del Bas � A. Caimari � L. Arola
Centre Tecnologic de Nutricio i Salut (CTNS),
TECNIO, Reus, Spain
L. Arola
Rovira i Virgili University, Tarragona, Spain
123
Genes Nutr (2015) 10:439
DOI 10.1007/s12263-014-0439-x
biomarkers of these processes identified by BIOCLAIMS
(http://bioclaims.uib.es). The WATRefNet comprehends
multiple layers of biological complexity as it contains
various types of nodes and edges that represent different
biological levels and interactions. We have validated the
reference network by showing overrepresentation with
anti-obesity drug targets, pathology-associated genes and
differentially expressed genes from an external disease
model dataset. The resulting network has been used to
extract subnetworks specific to the above-mentioned
expert-defined physiological processes. Each of these pro-
cess-specific signatures represents a mechanistically sup-
ported composite biomarker for assessing and quantifying
the effect of interventions on a physiological aspect that
determines WAT health status. Following this principle,
five anti-diabetic drug interventions and one diet inter-
vention were scored for the match of their expression
signature to the five biomarker signatures derived from the
WATRefNet. This confirmed previous observations of
successful intervention by dietary lifestyle and revealed
WAT-specific effects of drug interventions. The WAT-
RefNet represents a sustainable knowledge resource for
extraction of relevant relationships such as mechanisms of
action, nutrient intervention targets and biomarkers and for
assessment of health effects for support of health claims
made on food products.
Keywords Network biology � Systems biology �Data integration � Adipose tissue � Nutrition � Drugs
Introduction
Health is maintained by interplay among multiple intrinsic
and environmental factors, which are interacting at different
complexity levels. For instance, organ functioning is deter-
mined by multiple (psycho)physiological processes, which
can in turn be modified by chemical compounds that act via
molecular networks of genes, proteins or lipid species (Ol-
tvai and Barabasi 2002; Schadt and Bjorkegren 2012; Bar-
abasi et al. 2011). To achieve and maintain optimal health, it
is important to understand such complex biological rela-
tions—from molecular, to physiological, to social—and to
determine elements and paths whose modification will drive
system toward a desired state (Barabasi 2007). This calls for
approaches that can comprehend complex relations and
account for multiple biological levels in order to build a
coherent picture (‘‘a signature’’) of health.
A quest for defining and quantifying health status and
effects of interventions to improve health is facilitated by
technological advances in the last decades. By expansion of
high-throughput screening methods, next-generation
sequencing technology, self-monitoring devices, online
information-sharing platforms and similar technological
breakthroughs, we have now acquired the means to mea-
sure, share, and compute (personal) data and knowledge at
an increasingly large scale (Chen et al. 2012; Murdoch and
Detsky 2013; Field et al. 2009). Network-based methods
provide a platform to integrate and organize such diverse
and abundant (‘‘big’’) data into a knowledge resource by
bridging multiple data silos at multiple biological levels
(Barabasi and Oltvai 2004). For instance, biological net-
works can be built to integrate experimental data with prior
knowledge about molecular interactions (protein–protein,
protein–DNA and ligand–receptor), regulatory aspects
(transcription factor, miRNA targets and epigenetics),
mechanistic context (signalling cascades and metabolic
pathways), tissue specificity, association of molecular
phenotypes and processes with (patho)physiological con-
ditions, outcomes of self-assessment questionnaires, etc.
Such comprehensive relational maps can be mined using
network-based algorithms for associations with specific
health and disease aspects (Langfelder and Horvath 2008;
Carter et al. 2013) and for extraction of features of interest,
such as key submodules (Mitra et al. 2013) and regulators,
intervention targets and biomarkers (Hofree et al. 2013;
Dudley and Butte 2009; Wang and Chen 2011). It is
becoming evident that this approach facilitates discovery of
more robust biomarkers and intervention targets compared
to solely correlation-based feature selection methods
(Roukos 2010), namely it allows identification of features
whose mechanistic context implies their key role in phys-
iologically relevant processes, which in turn drive the
functioning of (systems of) organs, consolidating the
cause–effect relationship between molecular changes and a
health effect.
Approaches that include all relevant parameters and
interactions of the biological system are particularly rele-
vant in deciphering metabolic health and disease, as
imbalance in metabolic homeostasis can be triggered by
multiple, heterogeneous and often subtle intrinsic and
environmental changes (Corthesy-Theulaz et al. 2005). To
maintain metabolic health, many organs and systems need
to function synchronously and within their optimal func-
tioning range. Important metabolic health determinants
include: liver substrate handling, white adipose tissue
energy storage capacity, pancreatic insulin production,
muscle metabolic response to exercise, vasculature hemo-
dynamics and adequate immune response (Leviston 2011).
The complete metabolic system strives to maintain
homeostasis in continuously changing metabolic condi-
tions. Yet, this comes at a cost during chronic metabolic
stress, inducing adaptive mechanisms that may lead to
pathologies. Until the resilience limits of these systems are
reached, metabolic imbalance can be largely reversed,
often by appropriate lifestyle intervention such as diet and/
439 Page 2 of 18 Genes Nutr (2015) 10:439
123
or exercise (Radonjic et al. 2013; Van Ommen et al. 2014).
Nevertheless, the compliance to lifestyle interventions is a
major problem, and it is not equally effective for all per-
sons (Fappa et al. 2008). Therefore, understanding the
molecular network controlling processes required for the
maintenance of metabolic health and effects of interven-
tions on this network is of interest for designing effective
lifestyle intervention programs tailored to fit person-spe-
cific (psycho)physiological makeup, as well as for the
development of drugs that will mimic broad systems effi-
cacy and minimal adverse effects of lifestyle interventions.
The case of adipose tissue is particularly interesting as it
is constituted by different depots distributed in different
parts of the body, the so-called adipose organ (Cinti 2005).
What matters is not only the fat but where it is in the body,
what type of fat and nonfat cells complement the depot and
the notion that healthy fat is when functionality to accu-
mulate fat is working to protects the body by providing a
‘‘safe home’’ for lipids, which can be toxic to other tissues
such as muscle or the liver (Owens 2014). The inappro-
priate accumulation of lipids in fat depots and, conse-
quently, in tissues that are not equipped to handle them
results in continued low-grade inflammation and, ulti-
mately, in metabolic disease, insulin resistance and type 2
diabetes (Owens 2014).
To facilitate multi-level exploration of biological rela-
tions relevant for metabolic health, we introduce the ref-
erence network concept as a platform for integration and
mining of biological interactions derived from public
resources and context-specific experimental data. Within
the FP7 BIOCLAIMS project (http://bioclaims.uib.es/),
which focuses on discovery of biomarkers for assessing the
benefits of health-promoting food compounds, we have
built a reference network using white adipose tissue
(WAT) health as an endpoint of interest. The White Adi-
pose Tissue Health Reference Network (WATRefNet) is
based on (1) experimental data obtained from 10 studies
addressing different adiposity states, (2) seven public
knowledge bases of molecular interactions, (3) expert’s
definitions of physiologically relevant processes key to
WAT health and (4) collection of relevant biomarkers of
these processes identified by BIOCLAIMS. The WAT-
RefNet comprehends multiple layers of biological com-
plexity as it contains various types of nodes and edges that
represent different biological levels (genes, clinical chem-
istry and physiological parameters measured in either
WAT, peripheral blood mononuclear cells (PBMCs), or
blood) and interactions (protein–protein interactions, pro-
tein–metabolite interactions, transcription factor targets,
microRNA targets, pathway interactions and protein–drug
interactions). The resulting network has been used to
extract subnetworks specific to physiological processes key
to WAT health, namely WAT expandability, Oxidative
capacity, Metabolic state, Oxidative stress and Tissue
inflammation. Each of these signatures represents a
mechanistically sustained composite biomarker for
assessment and quantification of the effect of interventions
on a physiological aspect that determines WAT health
status. In addition, the WATRefNet is currently being
(re)used in associated projects (Bobeldijk et al. 2014) as a
knowledge resource for extraction of relevant relationships
such as mechanisms of action, nutrient intervention targets
and assessment of health status.
Results
Definition of physiological processes determining
WAT health
To set a framework for building a reference network of
biological relations relevant for WAT health, the FP7
BIOCLAIMS consortium identified five most relevant
physiological processes determining WAT health status:
WAT (referred to as ‘‘Adipose’’) expandability (Slawik and
Vidal-Puig 2007), Oxidative capacity (De Pauw et al.
2009), Metabolic state (Klaus 2004), Oxidative stress
(Furukawa et al. 2004) and Tissue inflammation (Wellen
and Hotamisligil 2003). Subsequently, for each of these
processes, biomarkers were assigned, defined as a known
assay readout parameters that best represent or are asso-
ciated with the given physiological process. These expert-
defined biomarkers were further used as ‘‘anchor nodes’’
for connecting molecular part of the reference network to
the physiological endpoints determining WAT health. The
list of expert’s knowledge-based processes and associated
markers is provided in Table 1.
Context-specific experimental data for the WAT health
reference network
Publicly available experimental data and data from pro-
prietary FP7 BIOCLAIMS studies addressing different
adiposity states in mice, rats, monkeys or humans were
used as a context-specific input for building the reference
network. The source studies collection included 10 studies
comparing control and diet-induced obesity experimental
groups and showing statistically significant differences in
subject’s adiposity level between the two groups. The
assays included gene expression, clinical chemistry and
physiological data, measured in either WAT, PBMCs, or
blood (Table 2). The experimental data were subjected to
integrative statistical analysis, and the resulting set of
variables differentiating lean from obese groups (aggre-
gated FDR corrected p \ 0.01) was used as seed nodes
for building the reference network (n = 1,026,
Genes Nutr (2015) 10:439 Page 3 of 18 439
123
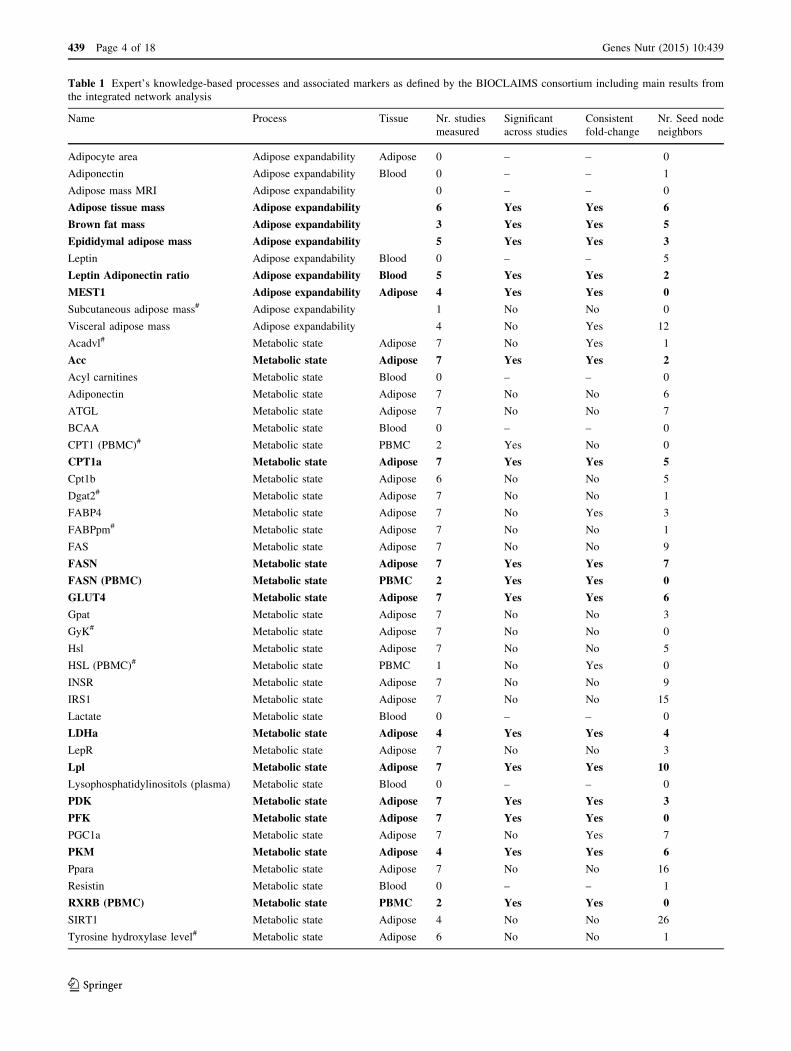
Table 1 Expert’s knowledge-based processes and associated markers as defined by the BIOCLAIMS consortium including main results from
the integrated network analysis
Name Process Tissue Nr. studies
measured
Significant
across studies
Consistent
fold-change
Nr. Seed node
neighbors
Adipocyte area Adipose expandability Adipose 0 – – 0
Adiponectin Adipose expandability Blood 0 – – 1
Adipose mass MRI Adipose expandability 0 – – 0
Adipose tissue mass Adipose expandability 6 Yes Yes 6
Brown fat mass Adipose expandability 3 Yes Yes 5
Epididymal adipose mass Adipose expandability 5 Yes Yes 3
Leptin Adipose expandability Blood 0 – – 5
Leptin Adiponectin ratio Adipose expandability Blood 5 Yes Yes 2
MEST1 Adipose expandability Adipose 4 Yes Yes 0
Subcutaneous adipose mass# Adipose expandability 1 No No 0
Visceral adipose mass Adipose expandability 4 No Yes 12
Acadvl# Metabolic state Adipose 7 No Yes 1
Acc Metabolic state Adipose 7 Yes Yes 2
Acyl carnitines Metabolic state Blood 0 – – 0
Adiponectin Metabolic state Adipose 7 No No 6
ATGL Metabolic state Adipose 7 No No 7
BCAA Metabolic state Blood 0 – – 0
CPT1 (PBMC)# Metabolic state PBMC 2 Yes No 0
CPT1a Metabolic state Adipose 7 Yes Yes 5
Cpt1b Metabolic state Adipose 6 No No 5
Dgat2# Metabolic state Adipose 7 No No 1
FABP4 Metabolic state Adipose 7 No Yes 3
FABPpm# Metabolic state Adipose 7 No No 1
FAS Metabolic state Adipose 7 No No 9
FASN Metabolic state Adipose 7 Yes Yes 7
FASN (PBMC) Metabolic state PBMC 2 Yes Yes 0
GLUT4 Metabolic state Adipose 7 Yes Yes 6
Gpat Metabolic state Adipose 7 No No 3
GyK# Metabolic state Adipose 7 No No 0
Hsl Metabolic state Adipose 7 No No 5
HSL (PBMC)# Metabolic state PBMC 1 No Yes 0
INSR Metabolic state Adipose 7 No No 9
IRS1 Metabolic state Adipose 7 No No 15
Lactate Metabolic state Blood 0 – – 0
LDHa Metabolic state Adipose 4 Yes Yes 4
LepR Metabolic state Adipose 7 No No 3
Lpl Metabolic state Adipose 7 Yes Yes 10
Lysophosphatidylinositols (plasma) Metabolic state Blood 0 – – 0
PDK Metabolic state Adipose 7 Yes Yes 3
PFK Metabolic state Adipose 7 Yes Yes 0
PGC1a Metabolic state Adipose 7 No Yes 7
PKM Metabolic state Adipose 4 Yes Yes 6
Ppara Metabolic state Adipose 7 No No 16
Resistin Metabolic state Blood 0 – – 1
RXRB (PBMC) Metabolic state PBMC 2 Yes Yes 0
SIRT1 Metabolic state Adipose 4 No No 26
Tyrosine hydroxylase level# Metabolic state Adipose 6 No No 1
439 Page 4 of 18 Genes Nutr (2015) 10:439
123
Supplemental Table 5). In addition, experimental data
were correlated with data on expert’s knowledge-defined
markers of key physiological processes, and features
showing statistically significant correlations (|r| [ 0.7)
were added to the list of seed nodes for building the
reference network (m = 75).
Prior knowledge-based molecular interaction network
To improve completeness of biological relations relevant to
WAT health status, experimental findings were extended
with prior knowledge of molecular interactions derived
from public databases. The information included protein–
protein interactions, protein–metabolite interactions, tran-
scription factor targets, microRNA targets, pathway
interactions and protein–drug interactions (Table 3,
‘‘Methods’’ section). The complete prior knowledge inter-
action network (27,667 nodes and 447,174 edges) was used
as the molecular context for seed nodes derived from
experimental data and correlation analysis.
Construction of WAT health reference network
To construct the WATRefNet, the seed nodes derived from
experimental data were integrated with molecular interac-
tion context of the prior knowledge network. The subgraph
based on the seed nodes was expanded by their first-order
neighborhood, followed by a pruning step where all seed
node neighbors that connected to only a single seed node
were removed (‘‘Methods’’ section). This resulted in the
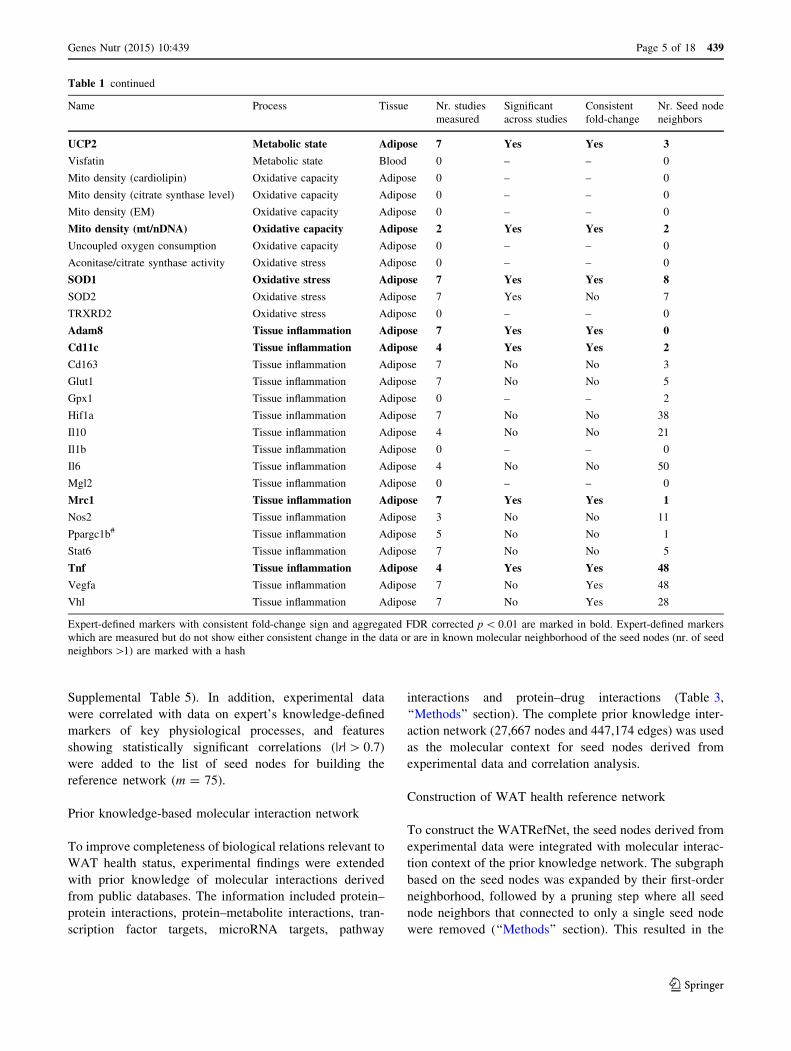
Table 1 continued
Name Process Tissue Nr. studies
measured
Significant
across studies
Consistent
fold-change
Nr. Seed node
neighbors
UCP2 Metabolic state Adipose 7 Yes Yes 3
Visfatin Metabolic state Blood 0 – – 0
Mito density (cardiolipin) Oxidative capacity Adipose 0 – – 0
Mito density (citrate synthase level) Oxidative capacity Adipose 0 – – 0
Mito density (EM) Oxidative capacity Adipose 0 – – 0
Mito density (mt/nDNA) Oxidative capacity Adipose 2 Yes Yes 2
Uncoupled oxygen consumption Oxidative capacity Adipose 0 – – 0
Aconitase/citrate synthase activity Oxidative stress Adipose 0 – – 0
SOD1 Oxidative stress Adipose 7 Yes Yes 8
SOD2 Oxidative stress Adipose 7 Yes No 7
TRXRD2 Oxidative stress Adipose 0 – – 0
Adam8 Tissue inflammation Adipose 7 Yes Yes 0
Cd11c Tissue inflammation Adipose 4 Yes Yes 2
Cd163 Tissue inflammation Adipose 7 No No 3
Glut1 Tissue inflammation Adipose 7 No No 5
Gpx1 Tissue inflammation Adipose 0 – – 2
Hif1a Tissue inflammation Adipose 7 No No 38
Il10 Tissue inflammation Adipose 4 No No 21
Il1b Tissue inflammation Adipose 0 – – 0
Il6 Tissue inflammation Adipose 4 No No 50
Mgl2 Tissue inflammation Adipose 0 – – 0
Mrc1 Tissue inflammation Adipose 7 Yes Yes 1
Nos2 Tissue inflammation Adipose 3 No No 11
Ppargc1b# Tissue inflammation Adipose 5 No No 1
Stat6 Tissue inflammation Adipose 7 No No 5
Tnf Tissue inflammation Adipose 4 Yes Yes 48
Vegfa Tissue inflammation Adipose 7 No Yes 48
Vhl Tissue inflammation Adipose 7 No Yes 28
Expert-defined markers with consistent fold-change sign and aggregated FDR corrected p \ 0.01 are marked in bold. Expert-defined markers
which are measured but do not show either consistent change in the data or are in known molecular neighborhood of the seed nodes (nr. of seed
neighbors [1) are marked with a hash
Genes Nutr (2015) 10:439 Page 5 of 18 439
123
WATRefNet containing 6,797 nodes and 32,316 edges
(Table 3; Fig. 1). The resulting network shows typical
topology properties of biological networks (Barabasi and
Oltvai 2004; Albert 2005), such as scale-freeness (power
law fit of degree distribution R2 = 0.805) and hierarchical
organization (power law fit of clustering coefficient dis-
tribution R2 = 0.541) (Supplemental Table 1).
Validation of WAT health reference network
by enrichment with disease-associated gene sets
The WATRefNet was based on information originating
from both human and animal model studies. To assess the
relevance of the reference network for human disease, we
have performed enrichment analysis of genes/proteins in
the WATRefNet among known disease-associated genes.
The disease-associated genes included 103 genes annotated
as obesity-associated in the Gene2MeSH database
(‘‘Methods’’ section). In total, 70 disease genes were
present in the reference network, representing a significant
enrichment of reference network genes in this gene set
(p = 1.09E-46). This finding supports the robustness of
WATRefNet and its validity for assessing health effects in
human intervention studies.
The reference network was also found to be enriched
with known anti-obesity drug targets (Table 4,
p = 7.46E-14), confirming that reference network repre-
sents a useful knowledge resource for finding molecular
paths to be targeted by health interventions.
In addition, the WATRefNet was also found to be
enriched with differentially expressed gene sets from an
independent study comparing chow versus high-fat feeding
conditions in LDLr-/- mice (Radonjic et al. 2013). Dif-
ferentially expressed genes in either gonadal, visceral or
subcutaneous fat depots were significantly enriched in the
WATRefNet (475 out of 1,228 differentially expressed
genes present in the reference network, Fisher exact test
p = 5.75E-171, for enrichment in individual depots, see
Table 4), confirming its robustness.
Functional annotation of WAT health reference
network
The WATRefNet can be clustered in 192 topological
modules (Fig. 1; Supplemental Table 2). Functional
annotation of these modules reveals that key biological
categories determining health status of WAT involve:
Transcription factor activity, Phosphatidylcholine meta-
bolic process, Intracellular signal transduction, G protein-
coupled receptor activity, Chromosome organization, Tri-
glyceride metabolic process, Mitotic cell cycle, Antigen
processing and presentation and RNA splicing. Interest-
ingly, regulatory modules (with GO annotation
transcription factor activity and intracellular signal trans-
duction) are among the modules with the largest number of
nodes and are central to the entire network. In contrast,
modules annotated with mitochondrial processes, metabo-
lism (e.g., Triglyceride metabolic cluster), immune process
(e.g., Antigen processing and presentation cluster), cell
division and structural remodeling are located at the
periphery of the network and are connected to the central,
regulatory part by several ‘‘bridging’’ nodes (Supplemental
Table 3, ‘‘Methods’’ section).
For instance, LPL, DGAT2, LIPE, PNPLA2 and
PNPLA3 are bridging nodes for the Triglyceride metabolic
process cluster (cluster 96). The Antigen processing and
presentation cluster (cluster 9) is linked through hsa-miR-
16, multiple HLA class II histocompatibility antigens
chains (HLA-DRB1, HLA-DRB5, HLA-DMB, HLA-DMA
and CD74) and other immune response players like IRF5
or RNASEL. Leptin, Resistin and Adiponectin form the
entry points into the Response to hormone stimulus cluster
(cluster 21). These bridging molecules may be considered
as mediators for the given biological functions, and tar-
geting these molecules by intervention may result in pro-
found effects on associated processes. In addition, bridging
nodes that are not part of the functionally annotated mod-
ules, but are top-ranked molecules based on their
betweenness centrality (i.e., KLF15 and WT1), may be
interesting candidates for further research.
Network signatures of physiological processes key
to WAT health
To identify parts of the WATRefNet that can be used as
composite biomarker signatures for specific physiological
processes key to WAT health, we have (1) extracted sub-
networks constituting molecular neighborhood of the
expert-defined markers and (2) pruned these subnetworks
to include only molecules that show statistically significant
changes in experimental data (aggregated FDR corrected
p \ 0.01) and their direct neighbors. This resulted in five
process-specific network signatures, containing a priori-
tized list of key molecules that can together be used as
robust indicators of the status of a given physiological
process in intervention studies (Supplementary Table 4).
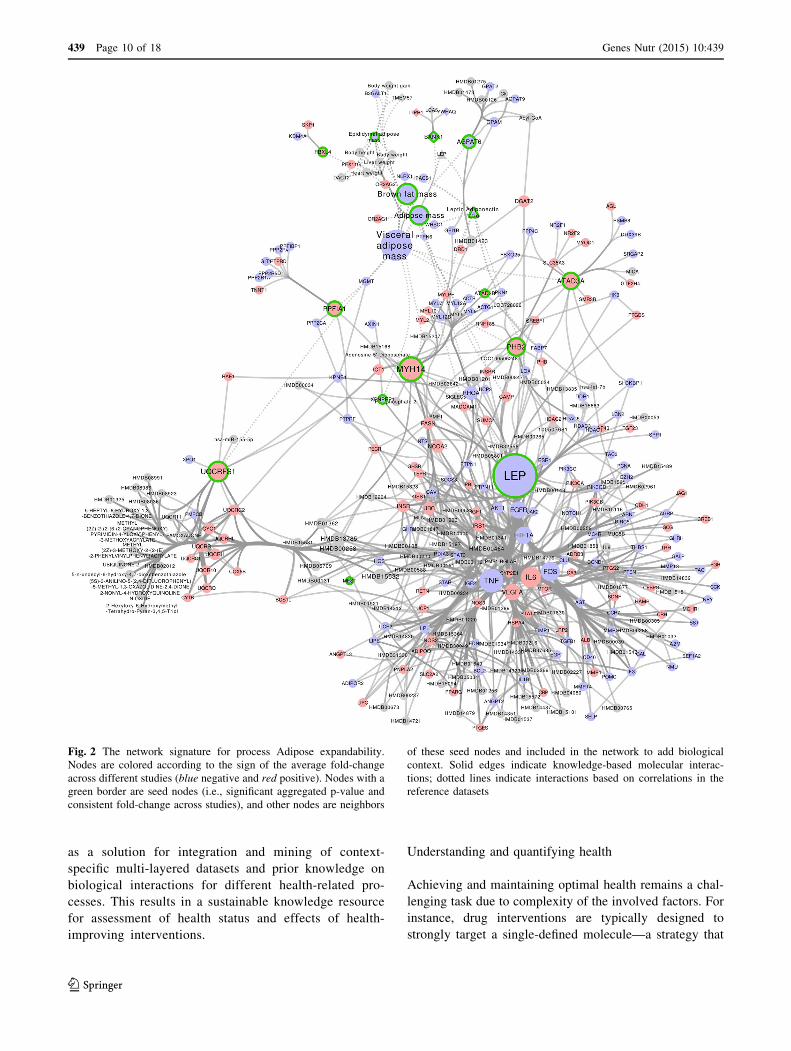
Figure 2 shows a network visualization of the Adipose
expandability signature, where the molecular interactions
are visualized together with different relevant criteria, such
as direction of gene expression, significance of differential
expression and centrality of each marker in the network. As
molecules constituting the network signatures are mecha-
nistically linked to the physiological process of interest,
their change upon intervention may suggest a cause–effect
relationship between molecular changes and a health
effect.
439 Page 6 of 18 Genes Nutr (2015) 10:439
123
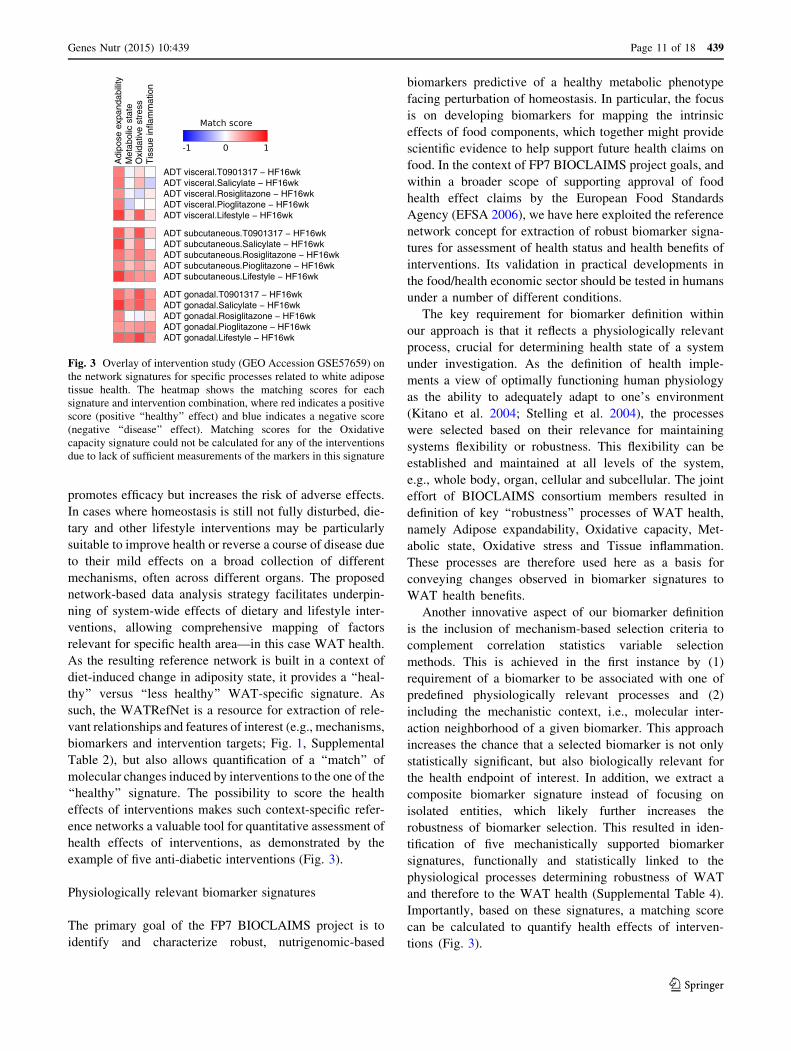
Using network signatures for evaluating health effects
of interventions
To assess the potential of the network signatures to be used
as robust biomarkers mechanistically linked to physiolog-
ical processes, which in turn determine WAT health, we
have analyzed data of five intervention studies for their
profile match with the network signatures. Gene expression
changes in WAT of LDLr-/- mice upon one dietary and
four drug interventions (Radonjic et al. 2013) were overlaid
over the signatures, and the matching scores were calcu-
lated. The matching score was based on the correlation
between fold-changes of differentially expressed genes in
the network signature and the corresponding fold-changes
resulting from the control versus intervention comparison
(‘‘Methods’’ section). A positive score represents a good
correlation of the intervention with the reference expres-
sion, indicating that the intervention resulted in a healthy
profile. A negative score indicates that the intervention
resulted in an unhealthy profile. Figure 3 shows a heatmap
of the matching scores for each signature and intervention
combination. In line with previously reported ability of
dietary lifestyle intervention to revert disease parameters
(Radonjic et al. 2013), the matching scores indicate a
healthy signature for this intervention for all network sig-
natures. The signatures also reveal adipose depot-specific
responses to the drug interventions. The response in
gonadal and subcutaneous WAT results in a positive score,
while the scores in visceral WAT are mixed and closer to
zero indicating a weaker and/or less consistent effect of the
intervention. The effect of salicylate intervention on Tissue
inflammation signature results in particularly diverse
matching scores in the three WAT depots (positive in
gonadal, neutral in subcutaneous and negative in visceral),
suggesting an interaction between drug mechanism of
action and specific metabolic role of the three WAT depots.
To test the statistical significance of difference between
three depots, we have performed a one-way ANOVA test
on scores for drug interventions (within each signature)
comparing the three depots. In summary, significant dif-
ference among depots is observed for the Oxidative stress
(p value 0.045), Metabolic state (p value 0.007) and Tissue
inflammation (p value 0.01) network signatures. In con-
trast, the Adipose expandability signature is rather
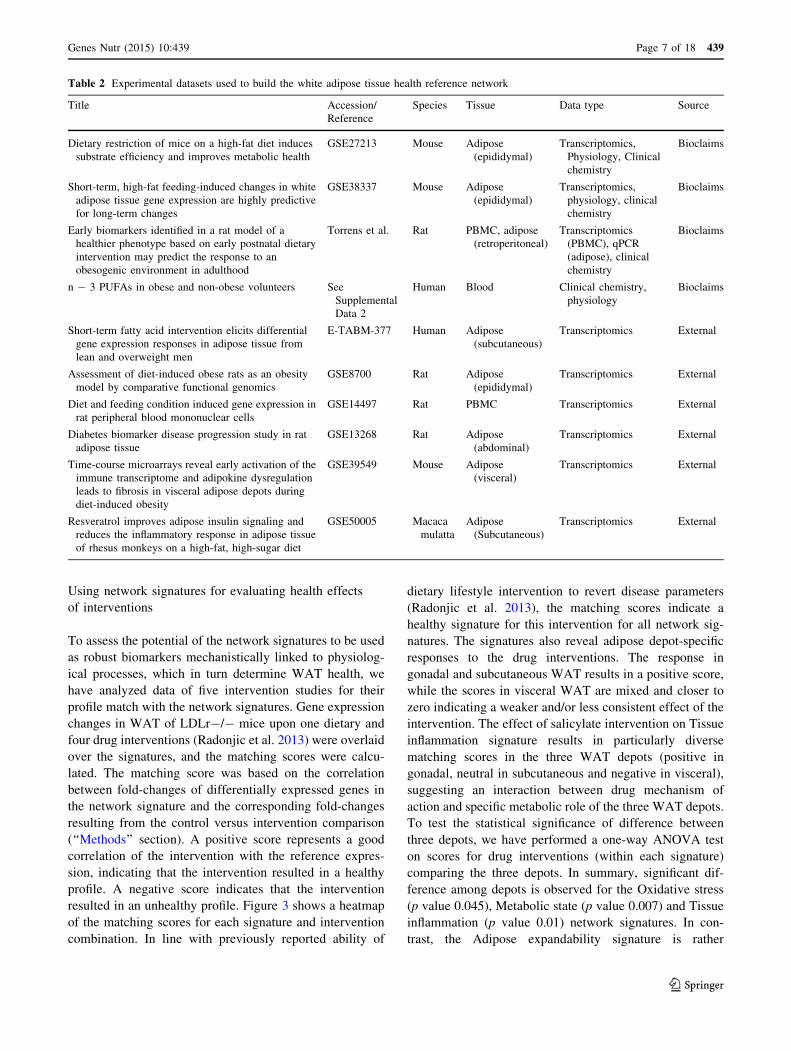
Table 2 Experimental datasets used to build the white adipose tissue health reference network
Title Accession/
Reference
Species Tissue Data type Source
Dietary restriction of mice on a high-fat diet induces
substrate efficiency and improves metabolic health
GSE27213 Mouse Adipose
(epididymal)
Transcriptomics,
Physiology, Clinical
chemistry
Bioclaims
Short-term, high-fat feeding-induced changes in white
adipose tissue gene expression are highly predictive
for long-term changes
GSE38337 Mouse Adipose
(epididymal)
Transcriptomics,
physiology, clinical
chemistry
Bioclaims
Early biomarkers identified in a rat model of a
healthier phenotype based on early postnatal dietary
intervention may predict the response to an
obesogenic environment in adulthood
Torrens et al. Rat PBMC, adipose
(retroperitoneal)
Transcriptomics
(PBMC), qPCR
(adipose), clinical
chemistry
Bioclaims
n - 3 PUFAs in obese and non-obese volunteers See
Supplemental
Data 2
Human Blood Clinical chemistry,
physiology
Bioclaims
Short-term fatty acid intervention elicits differential
gene expression responses in adipose tissue from
lean and overweight men
E-TABM-377 Human Adipose
(subcutaneous)
Transcriptomics External
Assessment of diet-induced obese rats as an obesity
model by comparative functional genomics
GSE8700 Rat Adipose
(epididymal)
Transcriptomics External
Diet and feeding condition induced gene expression in
rat peripheral blood mononuclear cells
GSE14497 Rat PBMC Transcriptomics External
Diabetes biomarker disease progression study in rat
adipose tissue
GSE13268 Rat Adipose
(abdominal)
Transcriptomics External
Time-course microarrays reveal early activation of the
immune transcriptome and adipokine dysregulation
leads to fibrosis in visceral adipose depots during
diet-induced obesity
GSE39549 Mouse Adipose
(visceral)
Transcriptomics External
Resveratrol improves adipose insulin signaling and
reduces the inflammatory response in adipose tissue
of rhesus monkeys on a high-fat, high-sugar diet
GSE50005 Macaca
mulatta
Adipose
(Subcutaneous)
Transcriptomics External
Genes Nutr (2015) 10:439 Page 7 of 18 439
123
comparable among three depots (p value 0.49). In addition,
in the gonadal depot, rosiglitazone intervention is markedly
different than the other interventions. Although both ros-
iglitazone and pioglitazone act as PPARy agonists, they
lead to different clinical outcomes (Deeg and Tan 2008),
and differences in their specific signatures may help to
elucidate the mechanisms responsible for this difference
(Supplemental Table 6).
Evaluation of predefined expert-based biomarkers
in the context of WATRefNet and network signatures
Finally, we have evaluated novel insights emerging from
the WATRefNet and network signatures, compared to
previously known, expert-defined biomarkers of WAT
health. We first investigated expert-defined markers for
their relevance according to the data-driven approach
(Table 1). Out of 75 expert-defined markers, 56 were
measured in at least one of the experimental datasets and
23 of these showed consistent change across all datasets
(consistent fold-change sign and aggregated FDR corrected
p \ 0.01). Thus, only one-third of expert-defined bio-
markers are reconfirmed as eligible biomarkers by a purely
data-driven approach. If we include additional markers
based on their molecular context (i.e., being direct neigh-
bor of at least 2 data-driven seed nodes), additional 24
expert-defined biomarkers can be included in the network
as relevant, based on indirect association. The remaining
nine expert-defined biomarkers which have been measured
but do not show either consistent change in the data or are
in known molecular neighborhood of the seed nodes are—
according to our analysis—of questionable relevance as
biomarkers of adiposity state (Table 1).
Added value of network signatures as biomarkers
of WAT health
The expert-defined biomarkers are per definition included
in the network signatures for WAT health. We next asked
whether other, newly discovered biomarkers within these
signatures may in fact offer a more reliable picture of the
adipose state than the expert-defined ones. Inspection of
individual nodes in the network signatures identifies novel
molecules, which outperform expert-based ones (Supple-
mentary Table 4). For instance, in the ‘‘Oxidative stress’’
network signature, there are 20 novel markers with lower
aggregated p value then expert-defined biomarkers LPL
and LDHA. Investigation of biological functions of these
20 markers as a group suggests that changes in extracel-
lular matrix organization and leukocyte migration may be
a good indicator of oxidative stress in WAT. In turn, the
‘‘Metabolic state’’ signature confirms the relevance of
expert-defined biomarkers ACACA, FASN and PDK1 (all
within top four markers based on aggregated p value).
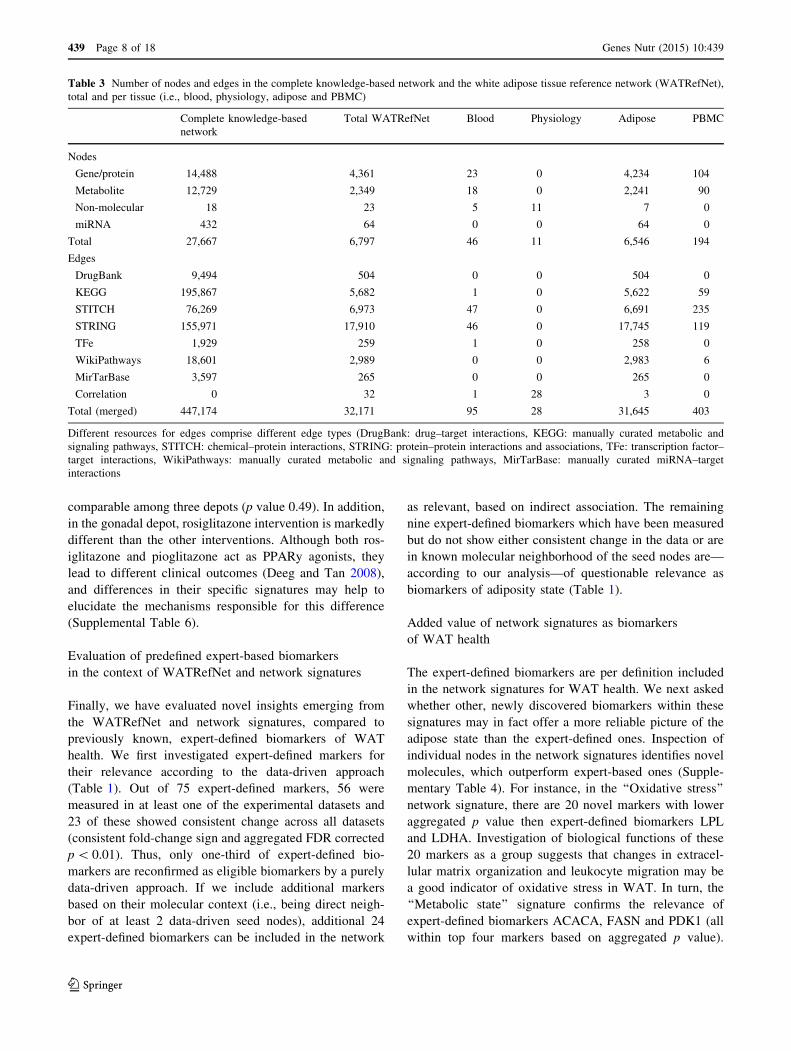
Table 3 Number of nodes and edges in the complete knowledge-based network and the white adipose tissue reference network (WATRefNet),
total and per tissue (i.e., blood, physiology, adipose and PBMC)
Complete knowledge-based
network
Total WATRefNet Blood Physiology Adipose PBMC
Nodes
Gene/protein 14,488 4,361 23 0 4,234 104
Metabolite 12,729 2,349 18 0 2,241 90
Non-molecular 18 23 5 11 7 0
miRNA 432 64 0 0 64 0
Total 27,667 6,797 46 11 6,546 194
Edges
DrugBank 9,494 504 0 0 504 0
KEGG 195,867 5,682 1 0 5,622 59
STITCH 76,269 6,973 47 0 6,691 235
STRING 155,971 17,910 46 0 17,745 119
TFe 1,929 259 1 0 258 0
WikiPathways 18,601 2,989 0 0 2,983 6
MirTarBase 3,597 265 0 0 265 0
Correlation 0 32 1 28 3 0
Total (merged) 447,174 32,171 95 28 31,645 403
Different resources for edges comprise different edge types (DrugBank: drug–target interactions, KEGG: manually curated metabolic and
signaling pathways, STITCH: chemical–protein interactions, STRING: protein–protein interactions and associations, TFe: transcription factor–
target interactions, WikiPathways: manually curated metabolic and signaling pathways, MirTarBase: manually curated miRNA–target
interactions
439 Page 8 of 18 Genes Nutr (2015) 10:439
123
Interestingly, the next four top-ranked molecules are
newly discovered, and all involved in cholesterol bio-
synthesis (G6PD, CYP51A1, PMVK and FDPS). In
addition to using network signatures as a biomarker of
health, they may be explored in a multitude of ways and
hint to underlying mechanisms. This may lead to devel-
opment of mechanism-driven, noninvasive assays for
assessment of WAT health (e.g., leukocyte status for
oxidative stress or plasma cholesterol levels as indicator
of WAT metabolic status).
Discussion
We have constructed a WATRefNet as a resource for
discovery and prioritization of mechanistically sup-
ported biomarkers for health benefits of food com-
pounds. The presented work provides a step forward in
understanding and quantifying health by shifting the
focus from single, correlation-based biomarkers toward
composite, mechanistically supported biomarker signa-
tures. Also, the reference network concept can be used
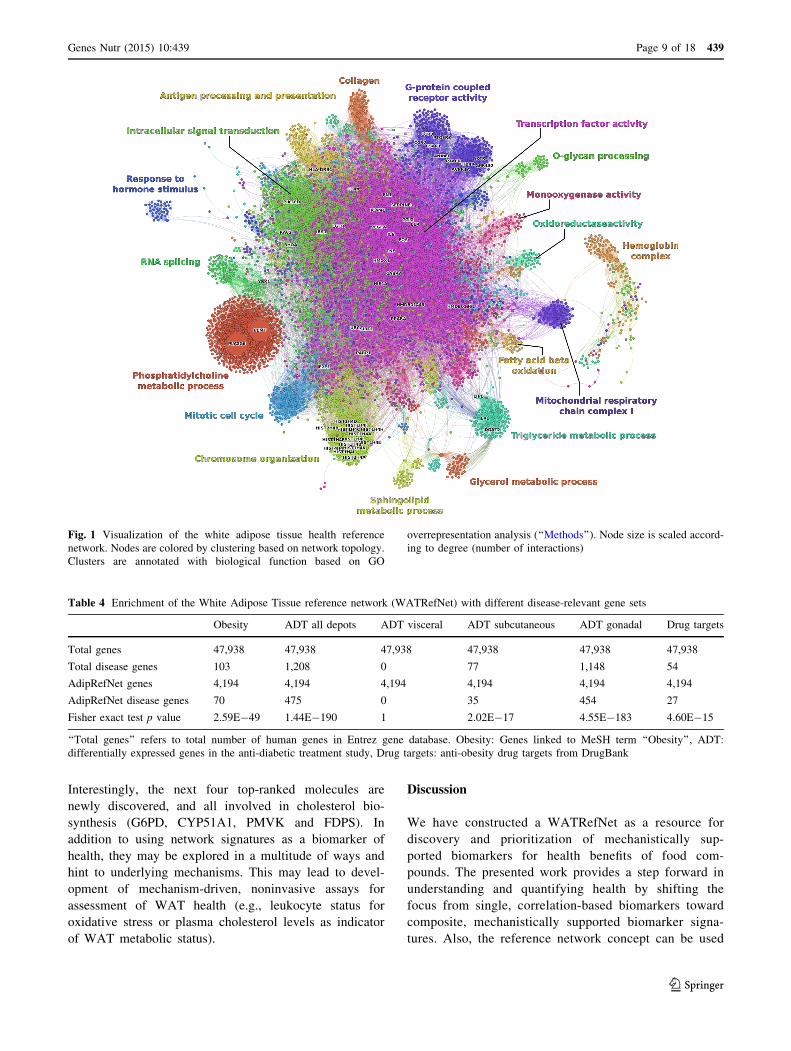
Fig. 1 Visualization of the white adipose tissue health reference
network. Nodes are colored by clustering based on network topology.
Clusters are annotated with biological function based on GO
overrepresentation analysis (‘‘Methods’’). Node size is scaled accord-
ing to degree (number of interactions)
Table 4 Enrichment of the White Adipose Tissue reference network (WATRefNet) with different disease-relevant gene sets
Obesity ADT all depots ADT visceral ADT subcutaneous ADT gonadal Drug targets
Total genes 47,938 47,938 47,938 47,938 47,938 47,938
Total disease genes 103 1,208 0 77 1,148 54
AdipRefNet genes 4,194 4,194 4,194 4,194 4,194 4,194
AdipRefNet disease genes 70 475 0 35 454 27
Fisher exact test p value 2.59E-49 1.44E-190 1 2.02E-17 4.55E-183 4.60E-15
‘‘Total genes’’ refers to total number of human genes in Entrez gene database. Obesity: Genes linked to MeSH term ‘‘Obesity’’, ADT:
differentially expressed genes in the anti-diabetic treatment study, Drug targets: anti-obesity drug targets from DrugBank
Genes Nutr (2015) 10:439 Page 9 of 18 439
123
as a solution for integration and mining of context-
specific multi-layered datasets and prior knowledge on
biological interactions for different health-related pro-
cesses. This results in a sustainable knowledge resource
for assessment of health status and effects of health-
improving interventions.
Understanding and quantifying health
Achieving and maintaining optimal health remains a chal-
lenging task due to complexity of the involved factors. For
instance, drug interventions are typically designed to
strongly target a single-defined molecule—a strategy that
Fig. 2 The network signature for process Adipose expandability.
Nodes are colored according to the sign of the average fold-change
across different studies (blue negative and red positive). Nodes with a
green border are seed nodes (i.e., significant aggregated p-value and
consistent fold-change across studies), and other nodes are neighbors
of these seed nodes and included in the network to add biological
context. Solid edges indicate knowledge-based molecular interac-
tions; dotted lines indicate interactions based on correlations in the
reference datasets
439 Page 10 of 18 Genes Nutr (2015) 10:439
123
promotes efficacy but increases the risk of adverse effects.
In cases where homeostasis is still not fully disturbed, die-
tary and other lifestyle interventions may be particularly
suitable to improve health or reverse a course of disease due
to their mild effects on a broad collection of different
mechanisms, often across different organs. The proposed
network-based data analysis strategy facilitates underpin-
ning of system-wide effects of dietary and lifestyle inter-
ventions, allowing comprehensive mapping of factors
relevant for specific health area—in this case WAT health.
As the resulting reference network is built in a context of
diet-induced change in adiposity state, it provides a ‘‘heal-
thy’’ versus ‘‘less healthy’’ WAT-specific signature. As
such, the WATRefNet is a resource for extraction of rele-
vant relationships and features of interest (e.g., mechanisms,
biomarkers and intervention targets; Fig. 1, Supplemental
Table 2), but also allows quantification of a ‘‘match’’ of
molecular changes induced by interventions to the one of the
‘‘healthy’’ signature. The possibility to score the health
effects of interventions makes such context-specific refer-
ence networks a valuable tool for quantitative assessment of
health effects of interventions, as demonstrated by the
example of five anti-diabetic interventions (Fig. 3).
Physiologically relevant biomarker signatures
The primary goal of the FP7 BIOCLAIMS project is to
identify and characterize robust, nutrigenomic-based
biomarkers predictive of a healthy metabolic phenotype
facing perturbation of homeostasis. In particular, the focus
is on developing biomarkers for mapping the intrinsic
effects of food components, which together might provide
scientific evidence to help support future health claims on
food. In the context of FP7 BIOCLAIMS project goals, and
within a broader scope of supporting approval of food
health effect claims by the European Food Standards
Agency (EFSA 2006), we have here exploited the reference
network concept for extraction of robust biomarker signa-
tures for assessment of health status and health benefits of
interventions. Its validation in practical developments in
the food/health economic sector should be tested in humans
under a number of different conditions.
The key requirement for biomarker definition within
our approach is that it reflects a physiologically relevant
process, crucial for determining health state of a system
under investigation. As the definition of health imple-
ments a view of optimally functioning human physiology
as the ability to adequately adapt to one’s environment
(Kitano et al. 2004; Stelling et al. 2004), the processes
were selected based on their relevance for maintaining
systems flexibility or robustness. This flexibility can be
established and maintained at all levels of the system,
e.g., whole body, organ, cellular and subcellular. The joint
effort of BIOCLAIMS consortium members resulted in
definition of key ‘‘robustness’’ processes of WAT health,
namely Adipose expandability, Oxidative capacity, Met-
abolic state, Oxidative stress and Tissue inflammation.
These processes are therefore used here as a basis for
conveying changes observed in biomarker signatures to
WAT health benefits.
Another innovative aspect of our biomarker definition
is the inclusion of mechanism-based selection criteria to
complement correlation statistics variable selection
methods. This is achieved in the first instance by (1)
requirement of a biomarker to be associated with one of
predefined physiologically relevant processes and (2)
including the mechanistic context, i.e., molecular inter-
action neighborhood of a given biomarker. This approach
increases the chance that a selected biomarker is not only
statistically significant, but also biologically relevant for
the health endpoint of interest. In addition, we extract a
composite biomarker signature instead of focusing on
isolated entities, which likely further increases the
robustness of biomarker selection. This resulted in iden-
tification of five mechanistically supported biomarker
signatures, functionally and statistically linked to the
physiological processes determining robustness of WAT
and therefore to the WAT health (Supplemental Table 4).
Importantly, based on these signatures, a matching score
can be calculated to quantify health effects of interven-
tions (Fig. 3).
Adi
pose
exp
anda
bilit
yM
etab
olic
sta
teO
xida
tive
stre
ssT
issu
e in
flam
mat
ion
ADT gonadal.Lifestyle − HF16wkADT gonadal.Pioglitazone − HF16wkADT gonadal.Rosiglitazone − HF16wkADT gonadal.Salicylate − HF16wkADT gonadal.T0901317 − HF16wk
ADT subcutaneous.Lifestyle − HF16wkADT subcutaneous.Pioglitazone − HF16wkADT subcutaneous.Rosiglitazone − HF16wkADT subcutaneous.Salicylate − HF16wkADT subcutaneous.T0901317 − HF16wk
ADT visceral.Lifestyle − HF16wkADT visceral.Pioglitazone − HF16wkADT visceral.Rosiglitazone − HF16wkADT visceral.Salicylate − HF16wkADT visceral.T0901317 − HF16wk
Fig. 3 Overlay of intervention study (GEO Accession GSE57659) on
the network signatures for specific processes related to white adipose
tissue health. The heatmap shows the matching scores for each
signature and intervention combination, where red indicates a positive
score (positive ‘‘healthy’’ effect) and blue indicates a negative score
(negative ‘‘disease’’ effect). Matching scores for the Oxidative
capacity signature could not be calculated for any of the interventions
due to lack of sufficient measurements of the markers in this signature
Genes Nutr (2015) 10:439 Page 11 of 18 439
123
Each individual biomarker within a signature can be
prioritized based on different relevance criteria, e.g., cen-
trality (importance) in the network, magnitude of changes
in experimental data, annotation, the ability of the mole-
cule to be secreted and cellular localization. (Supplemental
Table 4). While such ranking of individual markers allows
flexibility in designing scope of validation experiments
(e.g., if only a limited number of biomarkers can be mea-
sured in a clinical study), the availability of the complete
molecular context facilitates exploration of data and
knowledge to generate novel hypotheses and drive devel-
opment of improved interventions (Kelder et al. 2010).
An important characteristic of a biomarker is its feasi-
bility to be measured in human clinical studies. Therefore,
biomarkers which are indicative of tissue health status but
which can be measured by noninvasive methods (e.g., in
plasma or urine samples) are of great practical value. The
WATRefNet can be exploited for this purpose for identi-
fication of markers derived from PBMC or plasma samples
and which are located in the network neighborhood of five
biomarker signatures. This concept would ideally be
expanded to include other types of noninvasive assays or
measurement platforms, such as molecular imaging or
metabolomics and (epi)genetics in accessible tissues or
body fluids.
Reference network as a sustainable knowledge resource
for assessment of health status and effects
of interventions
To meet the challenge of comprehending complex bio-
logical relations relevant for health, we introduce here the
concept of reference networks as a mean for multi-level
mapping of systems components and interactions between
them. We use reference networks as a platform for inte-
gration and mining of biological interactions derived from
public resources and context-specific experimental data.
This enables understanding of the high-level organization
of processes that are required for maintenance of WAT
health, bridging information at the level of organs or tissue,
to physiological processes to molecular interactions. Spe-
cifically, the reference network platform facilitates the
following functionalities.
Integration of diverse and abundant data
To warrant comprehensiveness and robustness of the
WATRefNet, we have integrated biological information
originating from multiple experimental evidences (i.e., 10
studies, five species, three assay platforms and four tis-
sues), multiple prior knowledge resources of molecular
interactions (7 public knowledge databases) and domain
knowledge within BIOCLAIMS.
Mining of features and relations
Relying on a graph-based theory and prior knowledge
integration, network biology facilitates extraction of fea-
tures (biomarkers and intervention targets) and relations
(mechanisms, codependencies and causality), which are
not only statistically significant but also biologically rele-
vant. Involving biology context into data mining is espe-
cially relevant in nutritional research, as typically mild and
broad effects can be overlooked by stringent pure statistical
methods (Ideker et al. 2011). In addition, accounting for
molecular context (e.g., pathway cross talk) provides
valuable information for understanding mechanisms
underlying health status and intervention effects and is
important to consider when designing or benchmarking
novel interventions. Good examples of this concept are
Leptin and Adiponectin, known indicators of WAT health
status (Guerre-Millo 2004). The WATRefNet confirms an
important role for these molecules, as Leptin, Adiponectin
and Resistin represent key nodes linking peripheral
Response to hormone stimulus cluster to the central regu-
latory cluster of the WATRefNet. Similarly, we discover
PNPLA2 and PNPLA3, for which genetic variations have
previously been associated with obesity (Johansson et al.
2008) and non-alcoholic fatty liver disease (Romeo et al.
2008), as the key nodes bridging Triglyceride metabolic
process cluster with central regulatory mechanisms. In
addition, we found Hsa-miR-16 as key node linking the
antigen processing and presentation cluster to the reference
network. This is a relatively unknown miRNA that has
been mostly associated with various cancers (Calin et al.
2008), and our results indicate relevance in context of the
inflammatory process in WAT health as well. Finally,
KLF15 and WT1 emerge from our analysis as bridging
nodes, top ranked according to betweenness centrality, but
not constituting functionally annotated modules. KLF15
has previously been associated with glucose-induced
insulin secretion in adipocytes, confirming its relevance for
adiposity and WAT health (Nagare et al. 2011). In turn,
WT1 is involved in development and tumorigenesis (Toska
and Roberts 2014), and it may be an attractive novel can-
didate for further analysis in the context of WAT health.
Organizing and storing of knowledge (instead of data)
in form of relations
Instead of dispersed data (i.e., dozens of data files con-
taining tens of thousands data points, scattered across six
BIOCLAIMS institutes and different public repositories, in
different formats and annotations), we have generated a
traceable, transparent, annotated and accessible resource of
knowledge about WAT health, documented in a form of
entities and their relations. This resource is available in a
439 Page 12 of 18 Genes Nutr (2015) 10:439
123
computer readable formats (Supplementary Dataset 1),
ready for efficient mining for different aspects of interest
[i.e., by applying network-based path finding (Kelder et al.
2011)], prioritization or clustering algorithms (Warde-
Farley et al. 2010), cross-reference with other network
signatures (Wang et al. 2012), or querying specific parts of
interest], as information layers and relations can be flexibly
extracted.
Sustainability of generated data and knowledge
The reference networks concept provides a sustainable
solution for use and reuse of data that has been incorpo-
rated into the network. Reference networks can be stored in
a dedicated infrastructure (i.e., network library), allowing
research question-driven mining at any future time point
(NDEx 2014). In addition, multiple reference networks can
be readily integrated, for instance, to address several rela-
ted health aspects (Shannon et al. 2003). Importantly,
network architecture allows expansion and refinement of
the existing model upon incorporation of novel informa-
tion, meaning that if more or better evidence becomes
available, the network model will improve.
Together, these properties imply that the value of a
reference network will increase as the knowledge increa-
ses, which will in turn facilitate novel discovery, hypoth-
esis forming and validation—therefore reinforcing each
other. This concept holds a promise of growth in scientific
value, where newly initiated research will optimally build
upon prior experience—our own and that of others. Within
the FP7 BIOCLAIMS project, we have demonstrated the
viability of this concept by integration of data and
knowledge across six different European institutes, pub-
licly available experimental datasets and knowledge on
molecular interactions. The obtained biomarker signatures
for five key physiological processes determining health of
WAT are already being used as an input for analysis in
other related projects focusing on metabolic health (Bob-
eldijk et al. 2014).
Application of this and similar data management models
allows cross talk between different (parts of) projects and
will therefore generate an enhanced output. This helps to
improve our understanding of the causes and mechanisms
underlying health and disease and obtain insight in treat-
ment effectiveness. Hereby, we demonstrate the impor-
tance of availability of open data and joint data/knowledge
mining efforts for successful implementation of such
models.
Limitations and future perspectives
The undertaken approach is intrinsically limited by avail-
ability and quality of data used for the analysis. Despite a
fairly comprehensive mapping of relations relevant for
WAT health, the bias in, e.g., data and/or tissue types, is
unavoidable. For instance, transcriptome data availability
overrules other omics assay platforms, and WAT tran-
scriptome data obtained from rodent models are more
abundant than such data from human studies. In addition, it
has been shown that different fat depots, such as subcuta-
neous, visceral or gonadal fat, have different roles and
metabolic properties (Caesar et al. 2010), and their trans-
lational value is also questionable due to different spatial
distribution in human and animal models. Ideally, these
differences would be accounted for by defining adipose
depot-specific layers in the WATRefNet. Currently, the
available depot-specific data are insufficient to properly
address this aspect. Apart from limitation in experimental
data, sources of prior knowledge of molecular interactions
have different reliability (Von Mering et al. 2002). For
instance, protein–protein interactions derived from in-
depth mechanistic protein interaction analysis will likely
yield less false-positive findings than high-throughput
screens, such as yeast two-hybrid system. To account for
these different confidence levels, elements in the network
may be assigned different weights, based on reliability of
the evidence source. Another approach to correct for
relations that could potentially be found by chance—
especially when used as a series of associations constitut-
ing the analysis workflow—is to compare the resulting
network to the randomized network starting form an
equivalent set of nodes (Aittokallio and Schwikowski
2006). In addition, to improve sensitivity of the network
signature scores, nodes could be weighted based on their
biological/mechanistic relevance. One possible method of
weighting individual parameters would be to manually
define higher weights for established physiological readout
parameters. A more unbiased model of assigning relevance
weights could be made using network topology features—
assuming that our knowledge on underlying molecular
network is sufficiently complete. This is an emerging field,
and, to the best of our knowledge, this approach has not yet
been extensively benchmarked to be routinely included in
our current analysis. We envision that resources and
models (including signatures provided in this work) will be
refined in parallel with growth of available knowledge,
experimental evidence and network models. Ultimately,
the optimal solution to refinement of network models is to
incorporate statistically sound and biologically supported
checkpoints at each workflow step, and where possible,
experimentally validate anticipated relations. The pre-
requisite for successful reference network analysis is a
deep understanding of both technological requirements and
the biological context, allowing careful selection of data
and knowledge resources. To achieve this, a joint effort and
multi-disciplinary approach are a pro, possibly involving
Genes Nutr (2015) 10:439 Page 13 of 18 439
123
network scientists, mathematicians, statisticians, bioinfor-
maticians, biologists, nutritionists, medical doctors and
policy makers. There is a need to establish a bridge
between the prioritized biomarkers and the adaptation of
the practical requirements currently established for bio-
markers and risk factors in the context of health claims
made on food in Europe (EFSA Panel on Dietetic Products
N and A (NDA) 2011). The application of the present
method may provide important information to show the
biological plausibility of specific effects of foods on health,
which acceptability under the current European Regulation
(EC) N8 1924/2006 on health claims made on food, will be
difficult to be based only on a few systematic well-con-
trolled human intervention studies.
Although the method has been developed focusing on
diet-induced changes in WAT health, the concept is gen-
eric and applicable to the broader area of (metabolic)
health and disease. This provides opportunities for sup-
porting a wide range of applications, such as design of
improved food or drug interventions, substantiation of
health claims of food products, efficacy/safety analysis of
drug therapies and pinpointing health effects of combina-
tion therapies. Finally, the relevant implications of refer-
ence network approach are a potential to apply it in a
‘‘n = 1’’ approach, leading to extraction of person-specific
health signatures and quantification of person-specific
health effects compared to, for example, a population pool
(Chen et al. 2012). This will facilitate development of
personalized interventions and more efficient, subgroup-
specific intervention protocols in clinical trials. Together,
the health reference network concept as a sustainable
knowledge resource and associated robust health biomarker
signatures open numerous new avenues for assessing and
quantifying health and the effect of interventions on
thereof.
Methods
Collection and formatting of experimental data
Experimental data across 10 studies (Table 2) were col-
lected from public repositories [GEO: GSE27213 (Dui-
venvoorde et al. 2011), GSE8700 (Li et al. 2008),
GSE14497 (Caimari et al. 2010), GSE13268 (Xue et al.
2011), GSE39549, GSE38337 (Voigt et al. 2013),
GSE50005 (Jimenez-Gomez et al. 2013), ArrayExpress:
E-TABM-377 (Van Erk et al. 2008)] and BIOCLAIMS
consortium members [(Torrens et al. 2014) and Supple-
mental Data 2]. All data were annotated to unified identi-
fiers (Entrez Gene for genes/proteins, HMDB for
metabolites) where possible, and names of physiological
parameters were normalized to be consistent across
different studies and match the expert’s defined markers
(Table 1).
Within-study statistics
For each dataset, a control (healthy and lean) and disease
(high-fat diet and obese) group was defined, and a group-
wise comparison was performed between these groups
within each dataset. For transcriptomics data, the R pack-
age limma (Smyth 2004) was used to test for differential
expression between the groups. For non-transcriptomics
markers, a Student’s t test was applied.
Integration of statistics across studies
To combine the within-study statistics across the different
datasets, an aggregated p was calculated for each marker
using Fisher’s method (Mosteller and Fisher 1948). The
resulting p values were corrected for multiple testing using
the Benjamini–Hochberg method for controlling the FDR
(Benjamini and Hochberg 1995).
Correlation analysis
Each expert’s defined marker was correlated within each
study with all other markers measured in that study.
Spearman’s rank correlation coefficient was calculated for
all subjects of the healthy and disease groups, and corre-
lations with an absolute correlation coefficient above 0.7
were included in construction of the reference network.
Selection of seed nodes
A set of seed nodes relevant for WAT health was defined
based on expert’s defined markers (Table 1) and markers
derived from the analysis of the datasets. Seed nodes based
on data analysis were selected based on the following
criteria:
1. Aggregated p \ 0.01.
2. Fold-change between health and disease group should
be equal for all studies where the changes for the
marker are significant according to criteria 1, i.e., the
marker should change in the same direction consis-
tently across all datasets.
Seed nodes based on correlations are included by selecting
all markers that correlate with one or more of the expert’s
defined markers (absolute correlation coefficient [0.7).
439 Page 14 of 18 Genes Nutr (2015) 10:439
123
Building the prior knowledge-based molecular
interaction network
An integrated molecular interaction network was built by
integrating the following network resources:
1. Protein–protein functional interactions from STRING
(version 9.05) (Jensen et al. 2009), including all
interactions with score [0.4 and excluding NLP-
derived interactions.
2. Protein–metabolite interactions from STITCH (version
3.1) (Kuhn et al. 2010), including all interactions with
score [0.4.
3. Transcription factor targets from the Transcription
Factor Encyclopedia (version 2014-02-13) (Yusuf
et al. 2012).
4. WikiPathways human pathways (Analysis collection,
version 2013-08-14) (Kelder et al. 2012).
5. Gene–miRNA interactions from MirTarBase (from
CyTargetLinker collection, version 2012-10-12) (Kut-
mon et al. 2013; Hsu et al. 2011).
6. Protein–drug interactions from DrugBank (from Cy-
TargetLinker collection, version 2012-10-12) (Kutmon
et al. 2013; Wishart et al. 2006).
Nodes were annotated to Entrez Gene (for genes/
proteins) and HMDB (for metabolites) whenever possi-
ble using the BridgeDb library (Van Iersel et al. 2010).
If no mapping to these identifier systems could be
found, the original annotation was retained (e.g., for
miRNAs). Edges were considered undirected, and edges
were merged whenever an interaction was defined in
multiple resources. Information regarding datasource of
origin for each edge was retained in the network and is
available in the network as edge attributes (Supple-
mentary Data 1).
Construction of WAT health reference network
The adipose health reference network (WATRefNet) was
constructed from the combination of the integrated
knowledge-based molecular interaction network and the
significant correlations, resulting from the integrated data
analysis. The WATRefNet was extracted from this network
by taking the subgraph defined by the seed nodes and their
first-order neighborhood. After extracting the subgraph, a
pruning step was performed in which all seed node
neighbors that connected to only a single seed node were
removed. This step was performed to ensure that nodes
added based on the neighborhood to the seed nodes provide
relevant biological context and contribute to connecting
different seed nodes. Topology parameters of the WAT-
RefNet were calculated using the Network Analyzer App
in Cytoscape (Assenov et al. 2008).
Topology-based clustering and functional annotation
The WATRefNet was clustered into topological modules
using the WalkTrap community detection algorithm (Pons
and Latapy 2005). For each resulting cluster, overrepre-
sentation analysis of the genes in the cluster with Gene
Ontology terms from the Biological Process, Molecular
Function and Cellular Location ontologies was performed
using the GO enrichment Analysis in the WGCNA R
library (Langfelder and Horvath 2008). All significantly
overrepresented GO terms (p \ 0.0001) were selected and
listed in Supplemental Table 2.
Validation with external gene sets
To validate the relevance of the WATRefNet, it was tested
for enrichment with different external list of genes relevant
to adipose health. Enrichment was tested using the Fisher
exact test, with as reference set the complete collection of
human Entrez Genes. The set of genes related to obesity
was queried from the Gene2MeSH tool (Ade et al. 2007),
resulting in 103 genes associated with the MeSH term
‘‘Obesity.’’ The sets of differentially expressed genes (FDR
corrected p \ 0.05) in an independent transcriptomics
dataset were defined based on transcriptomics measure-
ments in different adipose depots (subcutaneous, visceral
and gonadal) for the comparison of chow versus high-fat
feeding conditions in LDLr-/- mice (Radonjic et al.
2013) (GEO Accession GSE57659). Although we are of
the opinion that nutritional studies should make use of
comparative purified diets to dissect effects of diets
(Hoevenaars et al. 2012), we think that inclusion of a study
that uses chow as comparator is warranted in this case,
because the analysis focuses on contrast rather than on
specific effects of a diet. The analysis resulted in 1,228
differentially expressed unique genes across all depots
(Visceral: 2, Subcutaneous: 79 and Gonadal: 1,167). The
set of 55 anti-obesity drug targets was obtained from
DrugBank (Wishart et al. 2006).
Identification of nodes bridging peripheral and central
network clusters
The two central clusters in the network with GO annotation
transcription factor activity and intracellular signal trans-
duction were grouped and collapsed into singular nodes
representing all module members. The module node retains
all edges of its members. After collapsing the clusters, the
betweenness centrality was calculated using the Network
Analyzer App in Cytoscape (Assenov et al. 2008). The
betweenness centrality was calculated based on all shortest
paths in an undirected, unweighted network. This allows
for the case that nodes can have the same betweenness. The
Genes Nutr (2015) 10:439 Page 15 of 18 439
123
betweenness centrality was normalized based on the
number of nodes: 1/(n-1) 9 (n-2) and independent from
the betweenness calculated, allowing for having nodes of
equal betweenness even after normalization. Nodes with a
betweenness centrality larger the 90 % quantile (2.86E-4)
for each module were identified as bridging nodes.
Extraction of process-specific network signatures
A network signature was extracted from the WATRefNet
for each of the five physiological processes (Table 1). First,
a subgraph was extracted based on first-order neighborhood
of all expert’s defined markers associated with the process.
Next, this subgraph was pruned by excluding all nodes that
are not direct neighbors of a marker that was part of the
data-driven seed nodes (shows statistically significant
changes in the experimental data, aggregated FDR cor-
rected p \ 0.01).
Matching network signatures with interventions
Signatures were matched to gene expression changes in
WAT of LDLr-/- mice upon one dietary and four drug
interventions (Radonjic et al. 2013) to assess the health
effect of the interventions. A matching score was calcu-
lated for each signature and intervention, defined as the
Spearman correlation of fold-changes of the significantly
changed markers in the signature and the fold-changes
resulting from the intervention. Correlations were calcu-
lated only if data for at least three significantly changed
markers were available for both the signature and the
intervention dataset.
Network analysis and visualization
Network analysis was performed in igraph (Csardi and
Nepusz 2006) and Cytoscape (Shannon et al. 2003). Net-
work visualizations were performed in Gephi (Gephi et al.
2014) (Fig. 1) and Cytoscape (Fig. 2). The WATRefNet is
available in computer readable format as RData file and
Cytoscape session file (Supplemental Dataset 1).
Acknowledgments We thank Francesc Puiggros for his contribu-
tion to definition of relevant physiological processes determining
WAT health status, critical assessment of the manuscript and support
of collaboration logistics from CTNS partner institute. The research
leading to these results has received funding from the European
Union’s Seventh Framework Programme FP7 2007–2013 under grant
agreement n8 244995 (BIOCLAIMS Project).
Conflict of interest Authors declare that they have no conflict of
interest.
Ethical standard All procedures followed were in accordance with
the ethical standards of the responsible committee on human
experimentation (institutional and national) and with the Helsinki
Declaration of 1975, as revised in 2000 (5). Informed consent was
obtained from all patients for being included in the study.
Open Access This article is distributed under the terms of the
Creative Commons Attribution License which permits any use, dis-
tribution, and reproduction in any medium, provided the original
author(s) and the source are credited.
References
Ade AS, Wright ZC, States DJ (2007) Gene2MeSH. http://
gene2mesh.ncibi.org/. Accessed 12 May 2014
Aittokallio T, Schwikowski B (2006) Graph-based methods for
analysing networks in cell biology. Brief Bioinform 7:243–255.
doi:10.1093/bib/bbl022
Albert R (2005) Scale-free networks in cell biology. J Cell Sci
118:4947–4957. doi:10.1242/jcs.02714
Assenov Y, Ramırez F, Schelhorn S-E et al (2008) Computing
topological parameters of biological networks. Bioinformatics
24:282–284. doi:10.1093/bioinformatics/btm554
Barabasi A-L (2007) Network medicine–from obesity to the ‘‘disea-
some’’. N Engl J Med 357:404–407. doi:10.1056/NEJMe078114
Barabasi A-L, Oltvai ZN (2004) Network biology: understanding the
cell’s functional organization. Nat Rev Genet 5:101–113. doi:10.
1038/nrg1272
Barabasi A-L, Gulbahce N, Loscalzo J (2011) Network medicine: a
network-based approach to human disease. Nat Rev Genet
12:56–68. doi:10.1038/nrg2918
Benjamini Y, Hochberg Y (1995) Controlling the false discovery rate:
a practical and powerful approach to multiple testing. J R Stat
Soc Ser B 57(1):289–300
Bobeldijk I, Verheij E, Boorsma A, et al. (2014) Nutrition Researcher
Cohort: Metabolomics In Dry Blood Spot Samples. doi:10.6084/
m9.figshare.1036551
Caesar R, Manieri M, Kelder T et al (2010) A combined transcri-
ptomics and lipidomics analysis of subcutaneous, epididymal
and mesenteric adipose tissue reveals marked functional differ-
ences. PLoS one 5:e11525. doi:10.1371/journal.pone.0011525
Caimari A, Oliver P, Keijer J, Palou A (2010) Peripheral blood
mononuclear cells as a model to study the response of energy
homeostasis-related genes to acute changes in feeding condi-
tions. OMICS 14:129–141. doi:10.1089/omi.2009.0092
Calin GA, Cimmino A, Fabbri M et al (2008) MiR-15a and miR-16-1
cluster functions in human leukemia. Proc Natl Acad Sci USA
105:5166–5171. doi:10.1073/pnas.0800121105
Carter H, Hofree M, Ideker T (2013) Genotype to phenotype via
network analysis. Curr Opin Genet Dev 23:611–621. doi:10.
1016/j.gde.2013.10.003
Chen R, Mias GI, Li-Pook-Than J et al (2012) Personal omics
profiling reveals dynamic molecular and medical phenotypes.
Cell 148:1293–1307. doi:10.1016/j.cell.2012.02.009
Cinti S (2005) The adipose organ. Prostaglandins Leukot Essent Fatty
Acids 73:9–15. doi:10.1016/j.plefa.2005.04.010
Corthesy-Theulaz I, den Dunnen JT, Ferre P et al (2005) Nutrige-
nomics: the impact of biomics technology on nutrition research.
Ann Nutr Metab 49:355–365. doi:10.1159/000088315
Csardi G, Nepusz T (2006) The igraph software package for complex
network research. InterJournal Complex Syst 1695:1695
De Pauw A, Tejerina S, Raes M et al (2009) Mitochondrial
(dys)function in adipocyte (de)differentiation and systemic
metabolic alterations. Am J Pathol 175:927–939. doi:10.2353/
ajpath.2009.081155
439 Page 16 of 18 Genes Nutr (2015) 10:439
123
Deeg MA, Tan MH (2008) Pioglitazone versus rosiglitazone: effects
on lipids, lipoproteins, and apolipoproteins in head-to-head
randomized clinical studies. PPAR Res 2008:520465. doi:10.
1155/2008/520465
Dudley JT, Butte AJ (2009) Identification of discriminating biomark-
ers for human disease using integrative network biology. In:
Pacific Symposium on Biocomputing, p 27
Duivenvoorde LPM, van Schothorst EM, Bunschoten A, Keijer J
(2011) Dietary restriction of mice on a high-fat diet induces
substrate efficiency and improves metabolic health. J Mol
Endocrinol 47:81–97. doi:10.1530/JME-11-0001
EFSA (2006) Regulation (EC) No. 1924/2006 of the European
Parliament and of the Council of 20 December 2006 on nutrition
and health claims made on foods. http://eur-lex.europa.eu/legal-
content/EN/TXT/PDF/?uri=CELEX:32006R1924&from=EN.
Accessed 12 May 2014
EFSA Panel on Dietetic Products N and A (NDA) (2011) Scientific
and technical guidance for the preparation and presentation of an
application for authorisation of a health claim (revision 1). EFSA
J. 2011 9:
Fappa E, Yannakoulia M, Pitsavos C et al (2008) Lifestyle
intervention in the management of metabolic syndrome: could
we improve adherence issues? Nutrition 24:286–291. doi:10.
1016/j.nut.2007.11.008
Field D, Sansone S-A, Collis A et al (2009) Megascience.’Omics data
sharing. Science 326:234–236. doi:10.1126/science.1180598
Furukawa S, Fujita T, Shimabukuro M et al (2004) Increased
oxidative stress in obesity and its impact on metabolic syndrome.
J Clin Invest 114:1752–1761. doi:10.1172/JCI21625
Gephi, an open source graph visualization and manipulation software.
https://gephi.org/. Accessed 14 May 2014
Guerre-Millo M (2004) Adipose tissue and adipokines: for better or
worse. Diabetes Metab 30:13–19. doi:10.1016/S1262-
3636(07)70084-8
Hoevenaars FPM, van Schothorst EM, Horakova O et al (2012)
BIOCLAIMS standard diet (BIOsd): a reference diet for
nutritional physiology. Genes Nutr 7:399–404. doi:10.1007/
s12263-011-0262-6
Hofree M, Shen JP, Carter H et al (2013) Network-based stratification
of tumor mutations. Nat Methods 10:1108–1115. doi:10.1038/
nmeth.2651
Hsu S-D, Lin F-M, Wu W-Y et al (2011) miRTarBase: a database
curates experimentally validated microRNA-target interactions.
Nucleic Acids Res 39:D163–D169. doi:10.1093/nar/gkq1107
Ideker T, Dutkowski J, Hood L (2011) Boosting signal-to-noise in
complex biology: prior knowledge is power. Cell 144:860–863.
doi:10.1016/j.cell.2011.03.007
Jensen LJ, Kuhn M, Stark M et al (2009) STRING 8–a global view on
proteins and their functional interactions in 630 organisms.
Nucleic Acids Res 37:D412–D416. doi:10.1093/nar/gkn760
Jimenez-Gomez Y, Mattison JA, Pearson KJ et al (2013) Resveratrol
improves adipose insulin signaling and reduces the inflammatory
response in adipose tissue of rhesus monkeys on high-fat, high-
sugar diet. Cell Metab 18:533–545. doi:10.1016/j.cmet.2013.09.
004
Johansson LE, Lindblad U, Larsson CA et al (2008) Polymorphisms
in the adiponutrin gene are associated with increased insulin
secretion and obesity. Eur J Endocrinol 159:577–583. doi:10.
1530/EJE-08-0426
Kelder T, Conklin BR, Evelo CT, Pico AR (2010) Finding the right
questions: exploratory pathway analysis to enhance biological
discovery in large datasets. PLoS Biol 8:e1000472. doi:10.1371/
journal.pbio.1000472
Kelder T, Eijssen L, Kleemann R et al (2011) Exploring pathway
interactions in insulin resistant mouse liver. BMC Syst Biol
5:127. doi:10.1186/1752-0509-5-127
Kelder T, van Iersel MP, Hanspers K et al (2012) WikiPathways:
building research communities on biological pathways. Nucleic
Acids Res 40:D1301–D1307. doi:10.1093/nar/gkr1074
Kitano H, Oda K, Kimura T et al (2004) Metabolic syndrome and
robustness tradeoffs. Diabetes 53(Suppl 3):S6–S15
Klaus S (2004) Adipose tissue as a regulator of energy balance. Curr
Drug Targets 5:241–250
Kuhn M, Szklarczyk D, Franceschini A et al (2010) STITCH 2: an
interaction network database for small molecules and proteins.
Nucleic Acids Res 38:D552–D556. doi:10.1093/nar/gkp937
Kutmon M, Kelder T, Mandaviya P et al (2013) CyTargetLinker: a
cytoscape app to integrate regulatory interactions in network
analysis. PLoS one 8:e82160. doi:10.1371/journal.pone.0082160
Langfelder P, Horvath S (2008) WGCNA: an R package for weighted
correlation network analysis. BMC Bioinformatics 9:559. doi:10.
1186/1471-2105-9-559
Leviston R (2011) Metabolic syndrome eposter. Nat. Med. e-poster
Vol. 17
Li S, Zhang H-Y, Hu CC et al (2008) Assessment of diet-inducedobese rats as an obesity model by comparative functional
genomics. Obesity (Silver Spring) 16:811–818. doi:10.1038/oby.
2007.116
Mitra K, Carvunis A-R, Ramesh SK, Ideker T (2013) Integrative
approaches for finding modular structure in biological networks.
Nat Rev Genet 14:719–732. doi:10.1038/nrg3552
Mosteller F, Fisher RA (1948) Questions and answers. Am Stat 2:30.
doi:10.2307/2681650
Murdoch TB, Detsky AS (2013) The inevitable application of big data
to health care. JAMA 309:1351–1352. doi:10.1001/jama.2013.
393
Nagare T, Sakaue H, Matsumoto M et al (2011) Overexpression of
KLF15 transcription factor in adipocytes of mice results in
down-regulation of SCD1 protein expression in adipocytes and
consequent enhancement of glucose-induced insulin secretion.
J Biol Chem 286:37458–37469. doi:10.1074/jbc.M111.242651
NDEx: The Network Data Exchange. http://www.ndexbio.org/.
Accessed 12 May 2014
Oltvai ZN, Barabasi A-L (2002) Systems biology. Life’s complexity
pyramid. Science 298:763–764. doi:10.1126/science.1078563
Owens B (2014) Cell physiology: the changing colour of fat. Nature
508:S52–S53. doi:10.1038/508S52a
Pons P, Latapy M (2005) Computing communities in large networks
using random walks (long version). ArXiv 20
Radonjic M, Wielinga PY, Wopereis S et al (2013) Differential
effects of drug interventions and dietary lifestyle in developing
type 2 diabetes and complications: a systems biology analysis in
LDLr-/- Mice. PLoS one 8:e56122. doi:10.1371/journal.pone.
0056122
Romeo S, Kozlitina J, Xing C et al (2008) Genetic variation in
PNPLA3 confers susceptibility to nonalcoholic fatty liver
disease. Nat Genet 40:1461–1465. doi:10.1038/ng.257
Roukos DH (2010) Systems medicine: a real approach for future
personalized oncology? Pharmacogenomics 11:283–287. doi:10.
2217/pgs.10.36
Schadt EE, Bjorkegren JLM (2012) NEW: network-enabled wisdom
in biology, medicine, and health care. Sci Transl Med 4:115rv1.
doi:10.1126/scitranslmed.3002132
Shannon P, Markiel A, Ozier O et al (2003) Cytoscape: a Software
Environment for Integrated Models of Biomolecular Interaction
Networks. Genome Res 13:2498–2504. doi:10.1101/gr.1239303
Slawik M, Vidal-Puig AJ (2007) Adipose tissue expandability and the
metabolic syndrome. Genes Nutr 2:41–45. doi:10.1007/s12263-
007-0014-9
Smyth GK (2004) Linear models and empirical bayes methods for
assessing differential expression in microarray experiments. Stat
Appl Genet Mol Biol 3:1. doi:10.2202/1544-6115.1027
Genes Nutr (2015) 10:439 Page 17 of 18 439
123
Stelling J, Sauer U, Szallasi Z et al (2004) Robustness of cellular
functions. Cell 118:675–685. doi:10.1016/j.cell.2004.09.008
Torrens JM, Konieczna J, Palou M et al (2014) Early biomarkers
identified in a rat model of a healthier phenotype based on early
postnatal dietary intervention may predict the response to an
obesogenic environment in adulthood. J Nutr Biochem
25:208–218. doi:10.1016/j.jnutbio.2013.10.009
Toska E, Roberts SGE (2014) Mechanisms of transcriptional
regulation by WT1 (Wilms’ tumour 1). Biochem J 461:15–32.
doi:10.1042/BJ20131587
Van Erk MJ, Pasman WJ, Wortelboer HM et al (2008) Short-term
fatty acid intervention elicits differential gene expression
responses in adipose tissue from lean and overweight men.
Genes Nutr 3:127–137. doi:10.1007/s12263-008-0096-z
Van Iersel M, Pico A, Kelder T et al (2010) The BridgeDb
framework: standardized access to gene, protein and metabolite
identifier mapping services. BMC Bioinformatics 11:5. doi:10.
1186/1471-2105-11-5
Van Ommen B, Greef J van der, Ordovas JM, Daniel H (2014)
Phenotypic flexibility as key factor in the human nutrition and
health relationship. Genes Nutr 9(5):1–9
Voigt A, Agnew K, van Schothorst EM et al (2013) Short-term, high
fat feeding-induced changes in white adipose tissue gene
expression are highly predictive for long-term changes. Mol
Nutr Food Res 57:1423–1434. doi:10.1002/mnfr.201200671
Von Mering C, Krause R, Snel B et al (2002) Comparative assessment
of large-scale data sets of protein–protein interactions. Nature
417:399–403. doi:10.1038/nature750
Wang Y-C, Chen B-S (2011) A network-based biomarker approach
for molecular investigation and diagnosis of lung cancer. BMC
Med Genomics 4:2. doi:10.1186/1755-8794-4-2
Wang I-M, Zhang B, Yang X et al (2012) Systems analysis of eleven
rodent disease models reveals an inflammatome signature and
key drivers. Mol Syst Biol 8:594. doi:10.1038/msb.2012.24
Warde-Farley D, Donaldson SL, Comes O et al (2010) The
GeneMANIA prediction server: biological network integration
for gene prioritization and predicting gene function. Nucleic
Acids Res 38:W214–W220. doi:10.1093/nar/gkq537
Wellen KE, Hotamisligil GS (2003) Obesity-induced inflammatory
changes in adipose tissue. J Clin Invest 112:1785–1788. doi:10.
1172/JCI20514
Wishart DS, Knox C, Guo AC et al (2006) DrugBank: a comprehen-
sive resource for in silico drug discovery and exploration.
Nucleic Acids Res 34:D668–D672. doi:10.1093/nar/gkj067
Xue B, Sukumaran S, Nie J et al (2011) Adipose tissue deficiency and
chronic inflammation in diabetic Goto-Kakizaki rats. PLoS one
6:e17386. doi:10.1371/journal.pone.0017386
Yusuf D, Butland SL, Swanson MI et al (2012) The transcription
factor encyclopedia. Genome Biol 13:R24. doi:10.1186/gb-
2012-13-3-r24
439 Page 18 of 18 Genes Nutr (2015) 10:439
123


![Induction of Sphk1 activity in obese adipose tissue ...White adipose tissue (WAT) acts as the major body storage for fat from which free fatty acids (FFAs) can be mobilized [1]. FFAs](https://img.pdfslide.us/doc/110x75/5e839c2b2d50881c665b5b58/induction-of-sphk1-activity-in-obese-adipose-tissue-white-adipose-tissue-wat.jpg)