Embed Size (px)
Citation preview
An analysis of spatial patterns in nutrient concentration in a constructed wastewater wetland system at Oberlin College: While Nitrate Remainsconcentration is Constantuniform, Phosphate Concentration in
a Constructed Wetland at Oberlin College is Dependent on Depth and the Presence of Physical Barriers
[Great job of including results in title. Could be stronger if you found a way to start title with statement that emphasizes broad context. E.g. as above
Greta G. Bradford, Kate M. Coury, Emily C. Minerath
Systems Ecology (ENVS 316) 2008
I. AbstractNatural and constructed wetlands process nutrients and labile organic matter which in excess
might damage downstream ecosystems through eutrophication. Little research focuses on the spatial heterogeneity of nutrients within wetlands or what causes this variability [would be nice to include citation here. Did you find any literature on this?]. The Living Machine (LM) is an engineered wetland ecosystem designed to treat and internally recycle wastewater from the Lewis Center at Oberlin College. Previous studies have examined the competence of gravel to adsorb and remove phosphate adsorption in the LM marsh as well as nutrient and water flow in relation to plant communities. We studied the spatial distribution of phosphate and nitrate concentration in the gravel bed of the marsh,: the last stage of LM water filtration. Nitrate is a limiting factor for plant growth and a key component of the nitrogen cycle; any removal of nitrate in the marsh could be due to denitrification, which is expected to occur near plant growth, which provides organic matter. The low level of organic matter limits the amount of denitrification in the marsh (Haineswood & Morse, 2003). Plant uptake could also account for nitrate removal. Phosphate is another limiting nutrient in freshwater plant systems; studies indicate that the marsh is responsible for the majority of LM phosphate removal through adsorption to gravel (Cernac et al, 2004). Our goal was to assess patterns in nutrient concentrations horizontally and vertically throughout the marsh [why? Explain why this is important]. We found that nitrate is not being processed and does not significantly vary across different points and depths. However, phosphate concentration increases significantly with depth, which we attribute to faster flow at the bottom of the bed caused by the larger gravel present at that level, allowing less time for adsorption by gravel [note that there are two complementary mechanisms here – larger size particles means faster flow, but it also means less surface area for adsorption] . In light of these results we suggest future research considering designs that allow for slower flow, investigating the possibility of adding deep-rooted plants, using smaller gravel throughout, or curving the pathway through which the water flows to provide it with additional time for contact.
II. Introduction
Wetlands and the Living MachineConstructed wetlands are becoming integral to riparian zone protection, municipal water
treatment, agricultural wastewater systems and other applications (Sim et al. 2008). Recent engineered ecosystem research has explored the effectiveness of constructed wetlands as wastewater treatment facilities (Sim et al. 2008, Olguin et al. 2008, Meers et al. 2008, Sindilariu et al. 2008). For example, a study concerning wetland processing of organic rich sugarcane molasses stillage focuses on wetlands and wetland plant efficiency (Olguin et al. 2008). In another study, researchers monitored the ability of wetland cells to remove nitrate and phosphate from rural, urban, and municipal sewage in riparian zones. However, few studies have considered wetland nutrient spatial heterogeneity and its causes. [Why might this be important? You need to explain as part of defining a gap in knowledge. Seems to me that the obvious case to make is that if you treat a marsh systems as a black box, in which you only
study what goes in and what goes out (sa other studies have apparently done), you may have a good sense of what happens, but you don’t have a good sense of HOW or WHY it happens; spatial data is necessary in order to understand mechanisms an din order to develop information that would allow for optimization of desirable removal functions]. Studies focusing on this subject have the potential to improve management and future design of constructed wetlands.
The Living Machine (LM) is one such engineered wetland ecosystem that utilizes a series of tanks and a gravel marsh to purify waste water for reuse in the Lewis Center at Oberlin College. The LM is housed in a solarium in the building, allowing light to reach the plants in the LM's open aerobic tanks and marsh bed. Water first enters the LM via a series of closed anaerobic tanks to decompose and settle most solid waste. The largely solid-free water continues through closed aerobic tanks to allow for bacterial processing of organic matter and nutrients. The water then flows into open aerobic tanks, which resemble hydroponic plant tanks and are built into the gravel marsh. In the open aerobic tanks more nutrient processing occurs and nutrients are absorbed into suspended plant roots. Water passes into the floor of the solarium, a meter deep gravel marsh, home to a myriad of plant species [vague. How dense are these plants?], which acts as a final nutrient filtration stage. Lastly, water is treated with UV light to kill bacteria before it is reused as toilet water. [Your figure of the marsh would be useful here]
Living Machine MarshThe marsh is a rectangular basin (11.58m x 5.16 m x 0.98 m) filled with gravel ranging in
diameter from 4cm -10cm which acts as the floor of the LM. Water entering the marsh still contains elevated levels of nitrogen and phosphorus. The gravel at the base of the marsh is larger than the gravel visible at the surface, which causes water in the bottom of the marsh to travel at a higher velocity (McConaghie, 2003). The water drains east to west due to a 2.0% gradient. Set into the marsh are the open aerobic tanks, the bases of which go all the way to the floor of the marsh, causing water to meander through the marsh at varying velocities. Though other waste processing systems do not necessarily contain a gravel marsh stage, other facilities use similar structures to facilitate phosphate adsorption and denitrification, making a study of the LM marsh applicable for comparison [cite examples of other such treatment plants that you are discussing here].
Nutrient DynamicsAs a key nutrient for flora and fauna, nitrogen is an important element to consider when
studying ecosystem dynamics. The nitrogen cycle is a biogeochemical cycle via which nitrogen passes through solid, aqueous, and gaseous phases. It involves a complex series of transformations between that occur under both aerobic and anaerobic conditions, organic and inorganic forms of nitrogen, mostly mediated by microbes in the soil, water and sediments. Elevated nitrogen levels cause eutrophication in aquatic systems (Ricklefs, 2007).
In the case of the LM, nitrogen enters the anaerobic tanks in the form of labile organic material from toilets and, through ammonification, is transformed into dissolved ammonium (NH4
+) ion. Subsequently it is converted into nitrite and then to nitrate through the processes of nitrification in the aerobic tanks (2NH4
+ + 3O2 2NO2- + 2H2O + 4H+ + Energy; 2NO2-+O2 2NO3
- + Energy). In tThe marsh is designed so that, water diffuses slowly enough through the gravel bed to maintain the anaerobic conditions conducive to denitrification [If you are going to include the reactions for nitrification, seems like you would want to also include reactions for denitrification]. However, low levels of labile organic matter in the LM march limit denitrification, the process via which nitrates and nitrites are reduced to nitrogen gas (Haineswood & Morse, 2003).
The phosphorous cycle, though simpler than the nitrogen cycle, is equally important for ecosystem balance [what does “ecosystem balance” mean?]. For organisms, phosphorous is a key element of ATP and ADP, nucleic acids, cell membranes, bones, and teeth, making it readily present in organic waste (Ricklefs, 2007). Weathering of soil parent material releases phosphorus for root uptake by plants [not clear what weathering of parent material has to do with your particular study; try to focus information so that only info that bears directly on your work is included]. Phosphorus does not have a gaseous phase, so it will remain in the plant body until decomposition, at which point it is returned into the soil in the form of soil organic matter [OK, but what does this have to do with the LM, a system in which decomposition takes place in the water? In what form does P occur as a dissolved inorganic ion?]. Phosphorus also acts as a limiting factor in aquatic systems. Anthropogenic sources of phosphorus and nitrogen, such as chemical fertilizers or unprocessed human and animal waste have led to an overabundance of limiting nutrients which can lead to algal blooms and extreme disturbance regimes in aquatic ecosystems, contributing to harm of fisheries (Herdendorf, 1987), and endangering human health. For this reason, waste processing and removal of both phosphate and nitrate has a direct impact on the health of downstream ecosystems, and has attracted scientific attention. Though the LM does not have a 'downstream' due to water recycling within the building [in the introduction, you have not indicated that water is recycled yet], knowledge of how phosphate behaves in the marsh is applicable to similar systems where water is not recycled, (de-Bashan, 2003). Our research has thus focused on finding analogous stages [what do you mean by stages?] within the LM for aquatic ecosystem nutrient processing. Freshwater systems, like the LM marsh, act as sinks for phosphorous and nitrogen. Phosphorus concentration drops when it passes through the marsh, as reflected by regular influent and effluent testing conducted by the Living Machine Crew [citation?].
III. Goals and HypothesesOur goal is to determine spatial patterns of phosphate and nitrate distribution by studying water
samples taken at diverse points and depths throughout the marsh. We [future tense does not make sense since the study is completed] will measured concentrations of phosphate and nitrate both horizontally and vertically. The study will provides a cohesive and detailed view of how nitrate and phosphate are being processed, which has not yet been produced [does it accomplish this?]. This will yield insight into marsh management and may suggest locations for additional plant growth most conducive to increasing nutrient removal as well as decreasing water flow. Spatial patterns in the marsh have been researched in depth by James McConaghie in relation to water flow and nutrient dynamics. Our study of nutrient accumulation and spatial heterogeneity within a wetland system may ultimately lead to more efficiently constructed wetlands, improve management practices, and present a basis for future LM studies. [I sense that this last paragraph is taken from your proposal, which is fine, but you need to recast the text to report on what was done rather than what you plan to do]
As water is pumped into the marsh from the clarifier we hypothesized that the phosphate concentration will would consistently decrease toward the effluent as it is adsorbed onto the gravel. In areas of high flow we predict there will be higher phosphate concentrations relative to areas of low flow (Mitsch et al. 1995). Towards the bottom of the marsh bed the gravel increases in size, allowing for a faster flow. This larger gravel has a smaller surface area to mass ratio than the smaller gravel at the top of the marsh. These characteristics of the deep marsh level will tend to decrease phosphate adsorption and cause the water at the bottom to have a higher concentration of phosphate. Behind the open aerobic tanks, which retard water flow, we predict that phosphate concentrations will be significantly lower than areas in front of the tanks, where flow velocity is higher.
A small decrease in nitrogen levels throughout the marsh could be caused by denitrification. Though the marsh is anoxic, denitrification will be limited by the low level of labile organic matter (Haineswood & Morse, 2003).
IV. Materials and MethodsWe attempted to quantify spatial nutrient patterns in the LM marsh through a single collection
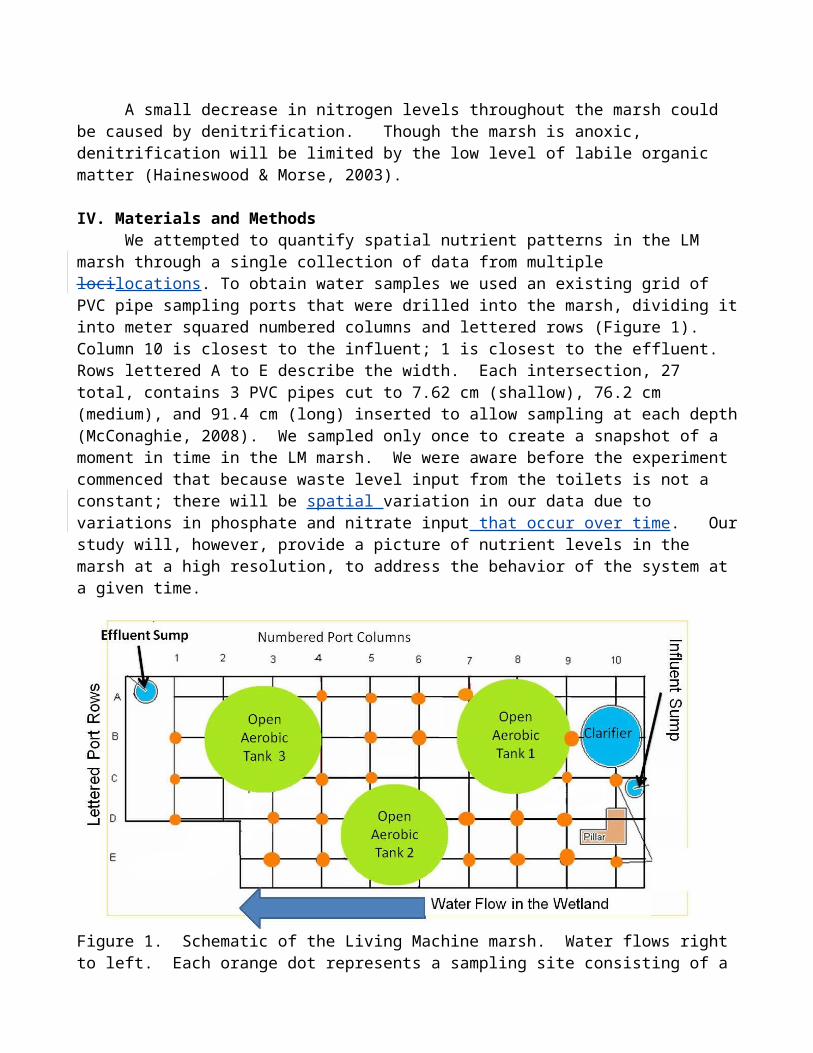
of data from multiple locilocations. To obtain water samples we used an existing grid of PVC pipe sampling ports that were drilled into the marsh, dividing it into meter squared numbered columns and lettered rows (Figure 1). Column 10 is closest to the influent; 1 is closest to the effluent. Rows lettered A to E describe the width. Each intersection, 27 total, contains 3 PVC pipes cut to 7.62 cm (shallow), 76.2 cm (medium), and 91.4 cm (long) inserted to allow sampling at each depth (McConaghie, 2008). We sampled only once to create a snapshot of a moment in time in the LM marsh. We were aware before the experiment commenced that because waste level input from the toilets is not a constant; there will be spatial variation in our data due to variations in phosphate and nitrate input that occur over time. Our study will, however, provide a picture of nutrient levels in the marsh at a high resolution, to address the behavior of the system at a given time.
Figure 1. Schematic of the Living Machine marsh. Water flows right to left. Each orange dot represents a sampling site consisting of a long, medium, and shallow tube and identified by column (number) and row (letter). The open aerobic tanks and the clarifier reach down to the bottom of the marsh, obstructing water flow. [Very nice diagram]
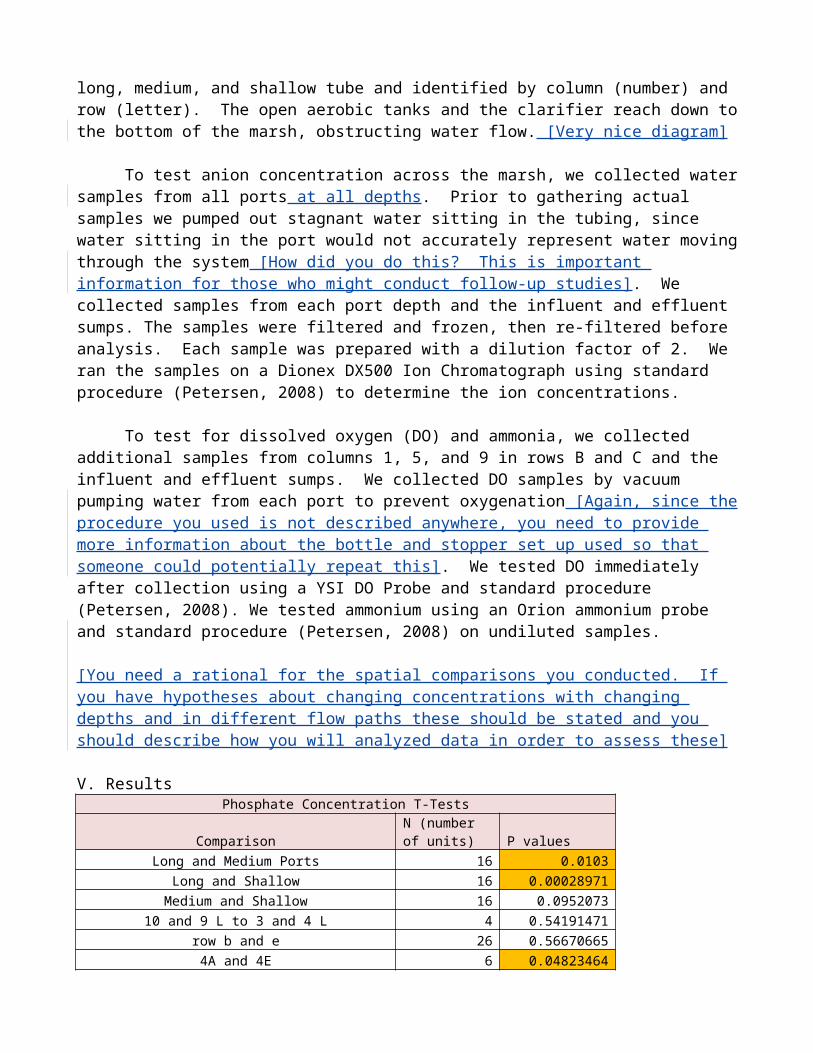
To test anion concentration across the marsh, we collected water samples from all ports at all depths. Prior to gathering actual samples we pumped out stagnant water sitting in the tubing, since water sitting in the port would not accurately represent water moving through the system [How did you do this? This is important information for those who might conduct follow-up studies]. We collected samples from each port depth and the influent and effluent sumps. The samples were filtered and frozen, then re-filtered before analysis. Each sample was prepared with a dilution factor of 2. We ran the samples on a Dionex DX500 Ion Chromatograph using standard procedure (Petersen, 2008) to determine the ion concentrations.
To test for dissolved oxygen (DO) and ammonia, we collected additional samples from columns 1, 5, and 9 in rows B and C and the influent and effluent sumps. We collected DO samples by vacuum pumping water from each port to prevent oxygenation [Again, since the procedure you used is not described anywhere, you need to provide more information about the bottle and stopper set up used so that someone could potentially repeat this]. We tested DO immediately after collection using a YSI DO Probe and standard procedure (Petersen, 2008). We tested ammonium using an Orion ammonium probe and standard procedure (Petersen, 2008) on undiluted samples.
[You need a rational for the spatial comparisons you conducted. If you have hypotheses about changing concentrations with changing depths and in different flow paths these should be stated and you should describe how you will analyzed data in order to assess these]
V. Results Phosphate Concentration T-Tests
ComparisonN (number of units) P values
Long and Medium Ports 16 0.0103Long and Shallow 16 0.00028971
Medium and Shallow 16 0.095207310 and 9 L to 3 and 4 L 4 0.54191471
row b and e 26 0.566706654A and 4E 6 0.04823464
4A to 4E and 4D 9 0.008252161B to 1D 6 0.47816262
5A and 5B to 5C 9 0.14386231columns (10 9 8) to (7,6,5) 49 0.181960388columns (10 9 8) to (4,3,1) 49 0.834092454columns (7,6,5) to (4,3,1) 54 0.31391755
areas of high flow versus low flow 40 0.065372461Nitrate Concentration T-Tests
ComparisonN (number of units) P values
Long and Medium 16 0.25187812Long and Shallow 16 0.77980601
Shallow and Medium 16 0.18084613Concentration in Columns (7,6,5) to (1,3,4) 54 0.040925627
Concentration in Columns (10,9,8) to (1,3,4) 49 0.081970374Concentration in Columns (10,9,8) to (7,6,5) 49 0.957035878
Dissolved Oxygen T-Tests
ComparisonN (number of units) P values
Column 1 to Column 5 12 0.608913289Column 1 to Column 9 12 0.758145459Column 5 to Column 9 12 0.727441588
Table 1. Explanation of each comparison made and the results of the T-tests. Statistically significant results have a p value less than 0.05 and are highlighted in orange. [This needs further explanation; it is not obvious to the reader what you are comparing and why you are comparing it. For example, in
yoru first comparison, are you comparing all P data in long versus medium ports? Do you have eight of each? You have included too many significant figures for P values - 100ths is plenty. The text needs to make clear why theses comparisons were made. Another column might help that indicates the kinds of effects you were looking to test, i.e. depth, obstruction to flow, distance from influent, etc.. “areas of high flow vs. low flow” is vague – what defines these?]
[Best to start with text that explains findings and that refers to tables. Explain in words the statistical comparisons you conducted and why you conducted them.]
To analyze nutrient concentration we used a statistical significance T-test. To test nutrient concentration variability from influent to effluent, we averaged all lengths and ports for each column and did a T-test to compare the values [the values of what? each column against each other column or groups of columns against other groups?]. We found no significant variation for nitrate or phosphate. To test for a relationship between depth and nutrient concentration we ran a T-test comparing all long values to all medium depth values, finding statistical significance. We ran the same test comparing medium depth to shallow depth, and long depth to shallow depth (Figure 3). Phosphate is statically higher in the long ports, but nitrate is not significantly different. To test the correlation between physical barriers and nutrient concentration we ran a T-test comparing ports behind a barrier with those that are not, all in the same column. We found significantly higher phosphate in ports not blocked than in those behind barriers [interesting].
We analyzed a subset of samples for ammonium [what subset, how were they chosen?]. Because most samples had concentrations of ammonium below the limit of detection of the probe, the data is not reliable for analysis.
We found that phosphate in our snapshot [important caveat] does not significantly vary from influent to effluent in the marsh. We performed T-tests comparing the averages of columns 8-10, 5-7, and 1-4 to each other (Table 1). All tests showed no significant difference as water travels horizontally across the marsh. There is a trend in the data that indicates that phosphate levels are actually increasing in the marsh. However, the differences in those concentrations are not statistically significant.
0
2
4
6
8
10
12
14
16
18
Influent 9 7 5 3 1
[PO
43-]
(mg/
l)
Column
Phosphate concentration from influent to effluent in the Living Machine
LongMediumShallow
Effluent
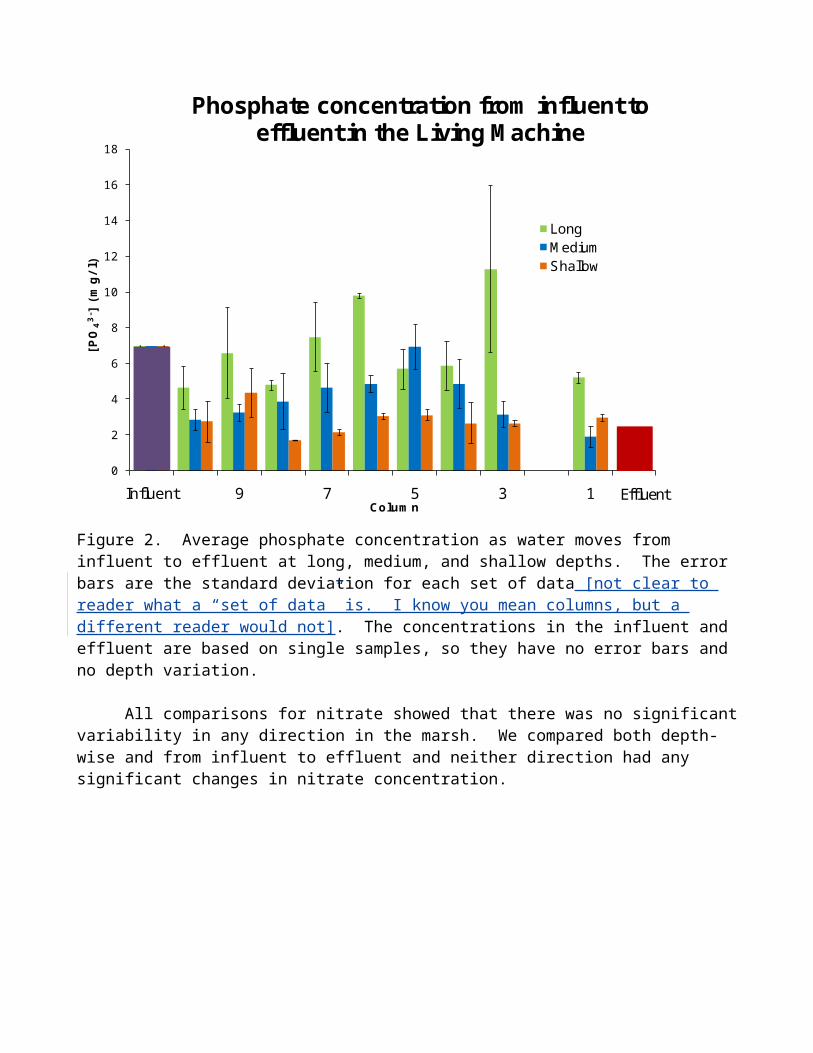
Figure 2. Average phosphate concentration as water moves from influent to effluent at long, medium, and shallow depths. The error bars are the standard deviation for each set of data [not clear to reader what a “set of data” is. I know you mean columns, but a different reader would not]. The concentrations in the influent and effluent are based on single samples, so they have no error bars and no depth variation.
All comparisons for nitrate showed that there was no significant variability in any direction in the marsh. We compared both depth-wise and from influent to effluent and neither direction had any significant changes in nitrate concentration.
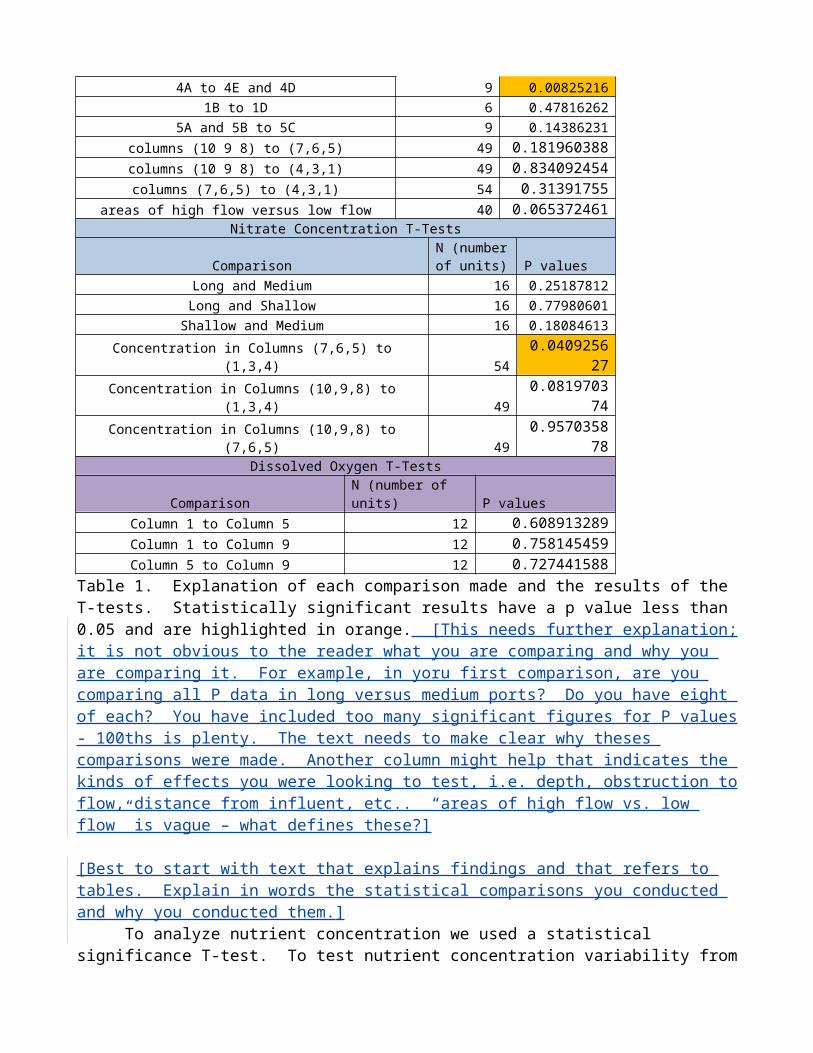
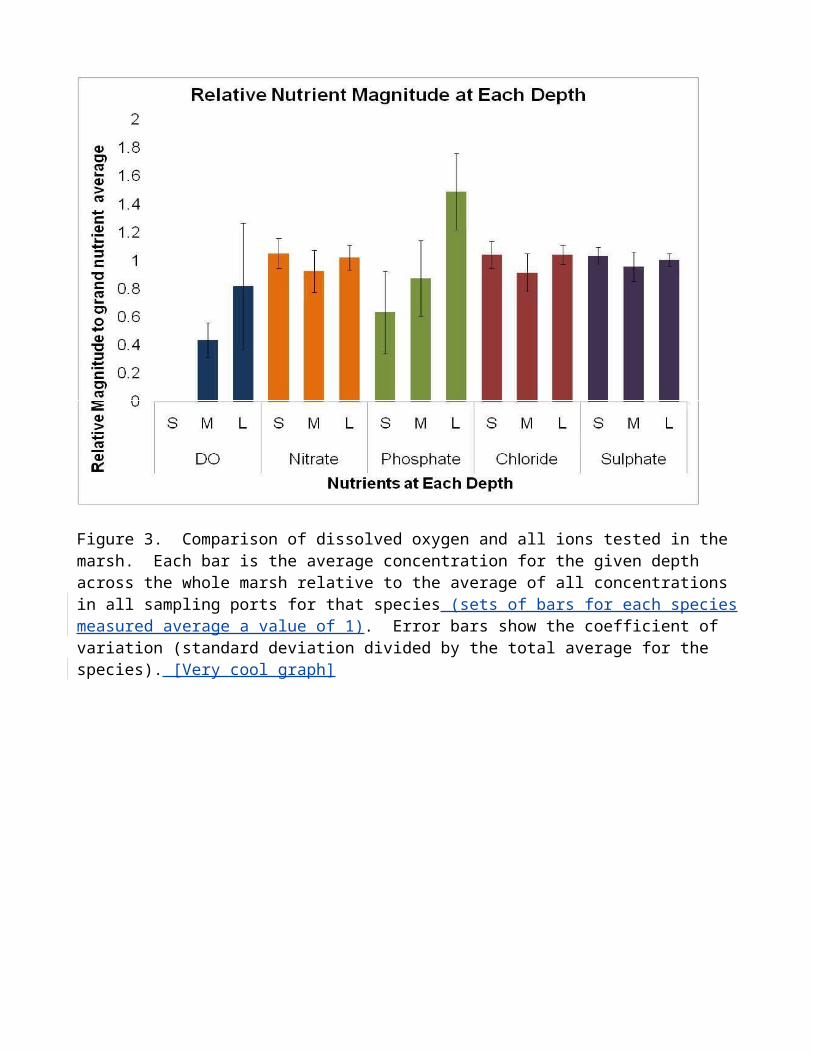
Figure 3. Comparison of dissolved oxygen and all ions tested in the marsh. Each bar is the average concentration for the given depth across the whole marsh relative to the average of all concentrations in all sampling ports for that species (sets of bars for each species measured average a value of 1). Error bars show the coefficient of variation (standard deviation divided by the total average for the species). [Very cool graph]
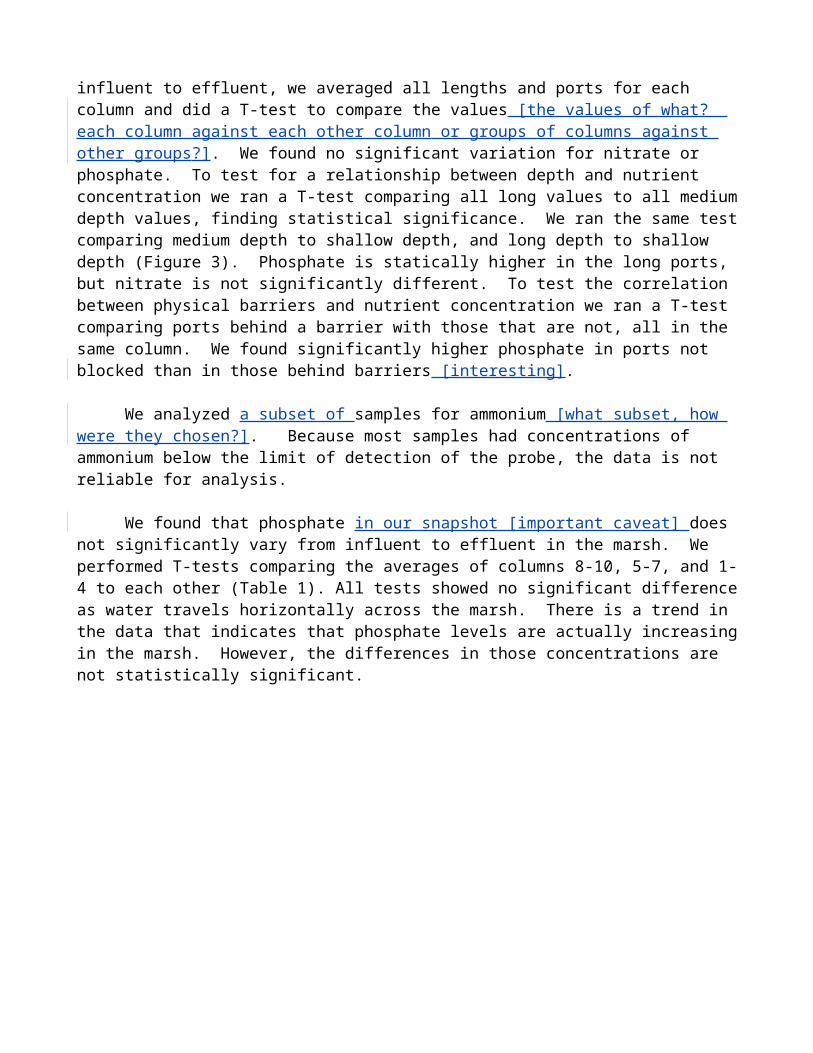
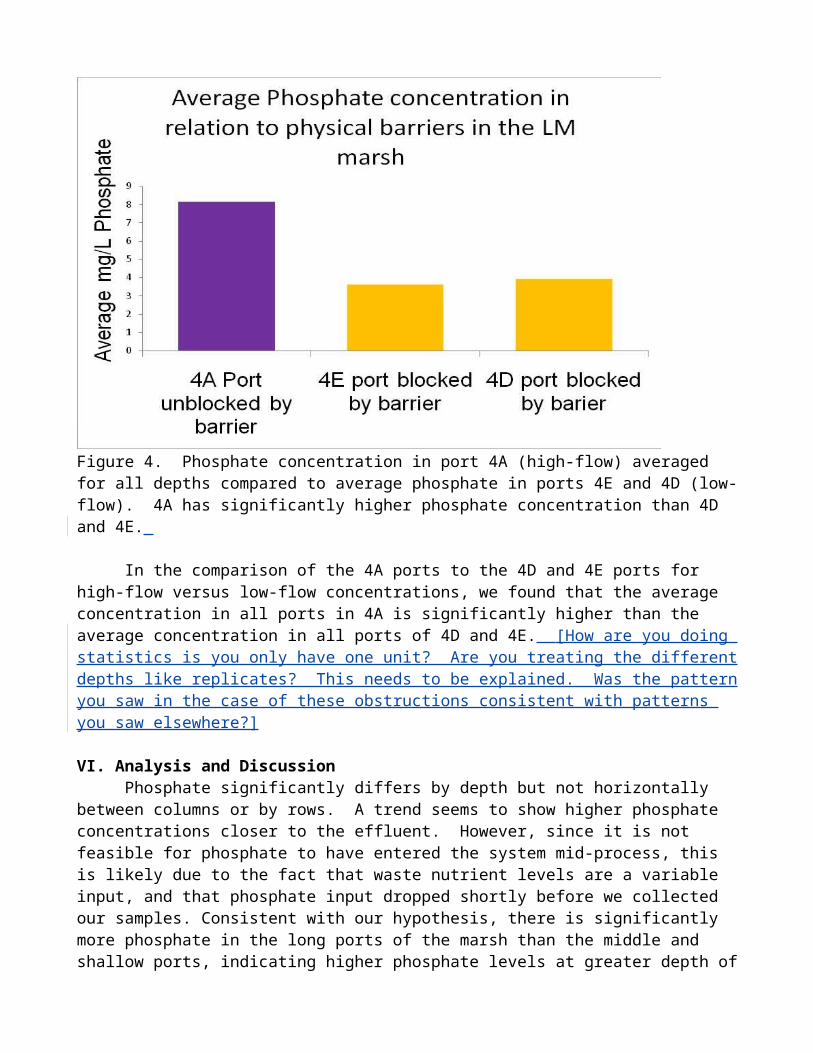
Figure 4. Phosphate concentration in port 4A (high-flow) averaged for all depths compared to average phosphate in ports 4E and 4D (low-flow). 4A has significantly higher phosphate concentration than 4D and 4E.
In the comparison of the 4A ports to the 4D and 4E ports for high-flow versus low-flow concentrations, we found that the average concentration in all ports in 4A is significantly higher than the average concentration in all ports of 4D and 4E. [How are you doing statistics is you only have one unit? Are you treating the different depths like replicates? This needs to be explained. Was the pattern you saw in the case of these obstructions consistent with patterns you saw elsewhere?]
VI. Analysis and DiscussionPhosphate significantly differs by depth but not horizontally between columns or by rows. A
trend seems to show higher phosphate concentrations closer to the effluent. However, since it is not feasible for phosphate to have entered the system mid-process, this is likely due to the fact that waste nutrient levels are a variable input, and that phosphate input dropped shortly before we collected our samples. Consistent with our hypothesis, there is significantly more phosphate in the long ports of the marsh than the middle and shallow ports, indicating higher phosphate levels at greater depth of the marsh. The higher flow at the bottom of the marsh could lead to a lower residence time of water, allowing less time for phosphate to be removed. Furthermore, plant roots exist in higher density towards the top of the marsh, and would increase this gradient. This factor, combined with lower surface area to mass ratio in the area containing larger gravel, explains these findings.
Physical barriers to flow seem to inconsistently affect phosphate concentration. In port 4A, which has high flow, we found significantly higher phosphate concentrations than in 4D and 4E, which have low flow (Figure 4). However, we could not find significant patterns elsewhere [OK]. We attribute this to limited data samples since the sampling grid was not originally designed to test for variability in relation to barriers. In the future, we suggest the addition of sampling ports placed strategically around tanks to study the effects of barriers to flow in greater detail. [Good suggestion]
In both vertical and horizontal dimensions we found no statistical variability in dissolved oxygen. Shallow ports were not always below the water surface, meaning that it was not possible to collect samples without introducing air, oxygenating the sample. The results for the shallow ports have been omitted for that reason (Figure 3). Subsurface conditions in the marsh were overall anoxic. While an anaerobic environment is necessary for denitrification to occur, it is not sufficient [good]. Labile organic matter is also required, and the small amount present in the marsh limits the extent to which denitrification can occur (Haineswood & Morse, 2003).
Our results agree with previous findings that nitrate is not significantly removed by the marsh. We were able to conclude from the results of our T-tests (Table 1) that denitrification is not occurring. One significant decrease in nitrate occurred between the column groups 5-7 and 1-4. However, since there was no significant decrease in nitrate between column groups 8-10 and 1-4, this result cannot be considered reliable. We can also attribute this to variations in input of nitrate to the marsh.
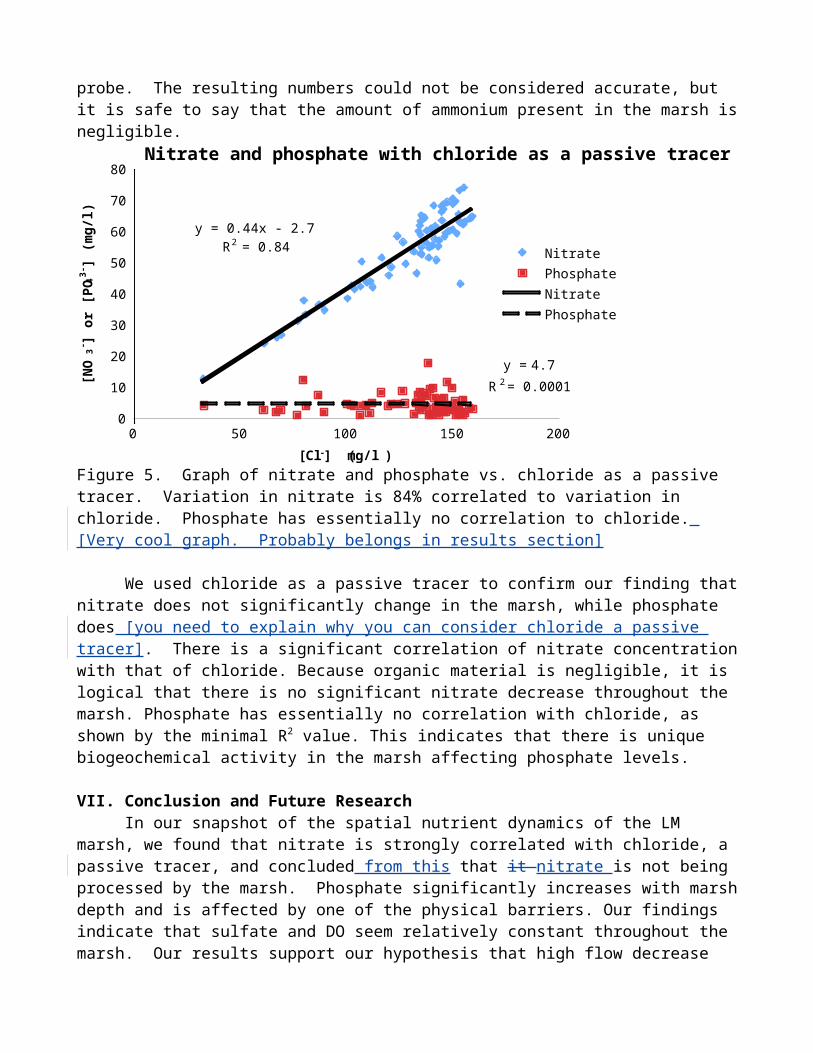
We also wanted to test the possibility that some nitrogen was present in the form of ammonium. However most of our ammonium samples had concentrations that were below the detection limit of the probe. The resulting numbers could not be considered accurate, but it is safe to say that the amount of ammonium present in the marsh is negligible.
Nitrate and phosphate with chloride as a passive tracer
y = 0.44x - 2.7R2 = 0.84
y = 4.7R 2 = 0.0001
0
10
20
30
40
50
60
70
80
0 50 100 150 200[Cl-] (mg/l )
[NO
3- ] or
[PO
43-]
(mg/
l)
NitratePhosphateNitratePhosphate
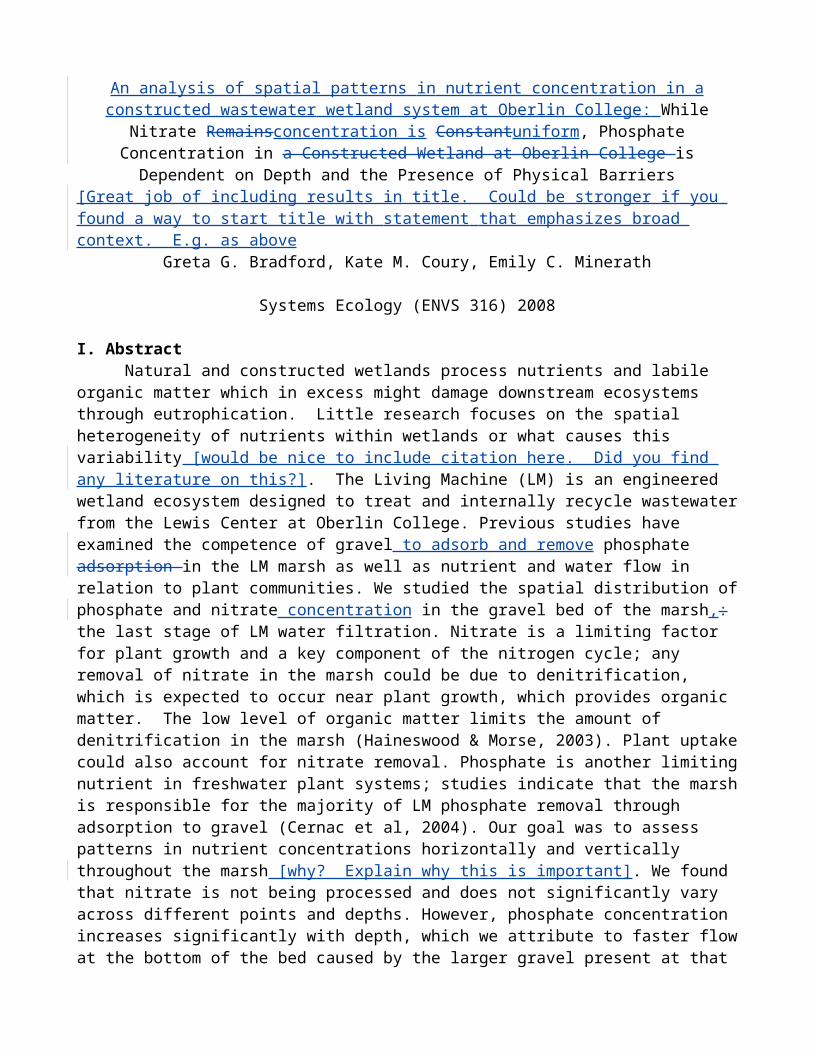
Figure 5. Graph of nitrate and phosphate vs. chloride as a passive tracer. Variation in nitrate is 84% correlated to variation in chloride. Phosphate has essentially no correlation to chloride. [Very cool graph. Probably belongs in results section]
We used chloride as a passive tracer to confirm our finding that nitrate does not significantly change in the marsh, while phosphate does [you need to explain why you can consider chloride a passive tracer]. There is a significant correlation of nitrate concentration with that of chloride. Because organic material is negligible, it is logical that there is no significant nitrate decrease throughout the marsh. Phosphate has essentially no correlation with chloride, as shown by the minimal R2 value. This indicates that there is unique biogeochemical activity in the marsh affecting phosphate levels.
VII. Conclusion and Future Research
In our snapshot of the spatial nutrient dynamics of the LM marsh, we found that nitrate is strongly correlated with chloride, a passive tracer, and concluded from this that it nitrate is not being processed by the marsh. Phosphate significantly increases with marsh depth and is affected by one of the physical barriers. Our findings indicate that sulfate and DO seem relatively constant throughout the marsh. Our results support our hypothesis that high flow decrease the amount of phosphate adsorbed by gravel and results in higher phosphate concentrations.
Our experiment was limited in determining the effects of physical barriers to flow on nutrient concentrations. The grid that we used was laid down by previous student researchers and was not intended to address our question regarding flow rates and nutrient removal around physical barriers. There are few ports located directly in front of and behind tanks, meaning we are unable to make general conclusions on the correlation of barriers and phosphate levels. In the interest of fostering future research on the subject, we recommend installing ports at strategic points around the tanks to more accurately measure the effect of physical barriers to flow on phosphate concentration.
We recommend that future studies measure the change in nutrient spatial dynamics over time, due to the varied loading of nutrients into the system [good]. Temporal information may help researchers reaffirm our hypotheses about where nutrients are building up, being processed, or remaining unchanged through the marsh over time. Such trends in nutrient spatial layout would prove fruitful for indicating when the gravel marsh will reach phosphorus saturation and require replacement.
Our findings support our hypothesis of phosphate concentrations correlating positively with depth and negatively with flow rate. We recommend that future Living Machine research explore designs which can slow down water flow through the marsh. This research could be directed at future designs of constructed marshes where the shape of the bed meanders back and forth rather than in a linear formation. More physical barriers could be sunk into the marsh to mimic a winding bed and decrease flow rate. Future research should explore the possibility of planting water-tolerant species with deep root systems in the marsh to lower phosphate levels at the bottom. Appropriate deep water tolerant species include Phragmites australis, Typha orientalis, and Typha domingensis (Mitsch, 2007) [nice recommendations]. Plants roots would slow water flow, absorb nutrients, and contribute organic matter necessary for denitrification. Alternatively, future research might entail developing ways to train plant roots to penetrate deeper into the marsh bed, such as sinking more PVC piping into the marsh to force roots to penetrate deeper into the marsh [also interesting].
In conclusion, it is important to study not only input and output but also internal spatial dynamics of constructed wetlands over time, in order to continue to design and implement more effective water treatment systems [good].
VIII. Literature Cited
Cernac, Pennino and Dyankov. 2004. Measuring Phosphorus Retention Capacity in the Marsh Substrate of an Ecologically Engineered Wastewater Treatment Facility at Oberlin College. ENVS 316 Research Project.
de-Bashan, L, Bashan, Y. 2003. Recent advances in removing phosphorus from wastewater and its future use as fertilizer. WATER RESEARCH 38: 4222-4246.
Haineswood & Morse. 2003. Low Organic Carbon Limits Denitrification in the Marsh of an Ecologically Engineered Wastewater Treatment Facility at Oberlin College. ENVS 316 Research Project.
Herdendorf, C.E., 1987. Chapter 14. Recovering from Phosphorus Enrichment. Pages 127-135 in R.W. Fortner and V.J. Mayer, eds. The great Lake Erie: A reference text for educators and communicators. Ohio Sea Grant Publications, Columbus, OH.
McConaghie. 2003. Biotic regulation of water flow and nutrient dynamics in a constructed wastewater treatment wetland. Oberlin senior honors thesis.
Meers, E., et al. 2008. Application of a full-scale constructed wetland for tertiary treatment of piggery manure: Monitoring results. WATER AIR AND SOIL POLLUTION. 193 15-24.
Mitsch, W.J., Cronk, J.K, Wu, X.Y. et al. 1995. Phosphorus retention in constructed fresh-water riparian marshes. Ecological Applications: 5:830-845.
Mitsch, W.J., Gosselink, J.G. 2007. Chapter 6. Biological Adaptations to the Wetland Environment. Pages 207-231 in Wetlands. 4th edition. John Wiley and Sons. NJ.
Olguin, E.J., et al. 2008. Constructed wetland mesocosms for the treatement of diluted sugarcane molasses stillage from ethanol production using Pontederia sagittata. WATER RESEARCH 42 (14): 3659-3666.
Sim, C.H., et al. 2008. Nutrient removal in a pilot and full scale constructed wetland, Putrajaya city, Malaysia. JOURNAL OF ENVIRONMENTAL MANAGEMENT. 88 (2) 307-317.
Sindilariu, P.D., C. Wolter, R. Reiter. 2008. Constructed wetlands as a treatment method for effluents; from intensive trout farms. AQUACULTURE. 227 170-184.
Petersen. 2008. Methods for Analyzing Aquatic Ecosystems. ENVS316 Manual.
Ricklefs, R.E., 2007. Chapter 8. Nutrient regeneration in terrestrial and aquatic ecosystems. pages 161-179 (173) in The Economy of Nature. 5th edition. W.H. Freeman, New York.
IX. Distribution of labor
We used google documents to collaborate on all assignments, which allowed us to work around our own schedule and put in equal work for each component of the project [good idea]. We each were able to consider each section of each part of the poster and paper and critique it. We rotated editing each section of the paper to equally divide up work and assure that we addressed problem spots. [How did you divide work with respect to the data collection?]
X. Honor Code
We have adhered to the honor code in this assignment
Greta Bradford Kate CouryEmily Minerath
(word count = 3,702)
1. Title & Names of investigators>Clearly indicates what you did and ideally what you found. [yes, but see comments]2. Abstract (250 word max)>Summarizes what you did, how you did it, what you found, and why it is important. Y3. Introduction/Background>Sets context by describing the overall problem that research addresses and appropriately situates this in larger ecological and societal context. [organization a bit hard to follow, particularly with use of future tense associated with project. You also include extraneous information about N and P dynamics in soils. Your introduction should be designed to synchronize with and to completely parallel methods, results and discussion sections; information in the introduction that is not directly used in these other sections should be reomoved.]>Cites relevant primary and secondary literature to support arguments (minimum of four citations).Y>Problem statement establishes gap in knowledge, need for research, and describes how your research fills gap. Y, see comments>Clearly states mechanistic hypotheses explaining what you expected to observe and why. [need more on why space is important]4. Methods (revised from proposal)>Describes what you did in sufficient detail that someone could repeat your experiment. [see comments on sampling – you need to describe your procedures more clearly, particularly how you ensured that you were not sampling from the tubes and specifically how you extracted water for DO analysis in such a way that you avoided oxygenating the water]>Answers what, where, when, and how you made your measurements. Y>Includes diagrams, maps of sampling, tables, timelines as appropriate (only if appropriate). Y, nice diagram>References literature where appropriate (who’s procedure did you follow?).5. Results:>Includes text, tables, graphs & figures that describe but do not explain results. Y, see comments on table>Explains calculations. OK>Indicates statistical significance. Y>Does not present same data in both tables and graphs. Y6. Analysis & Discussion:>Interprets and critically analyzes your findings. Y>Explores connections between your findings and those of other studies (agreement, disagreement, relevance).Y, but more reference back to original literature would be useful>Addresses the usefulness and limitations of the methods you used. N>Addresses limitations of findings and suggests further research that might extend or more conclusively addresses your initial hypotheses and findings. Y7. Literature cited:>Uses the same format described in the “How to write ecological site assessments” handout.>Does not use footnotes. Y
8. Figures and figure legends: (tables, graphs, conceptual models, etc. that appear in introduction, results, and analysis & discussion sections) Y, see comments>Text legend below each figure describes content in sufficient detail that reader can understand what the figure represents without reference to text in manuscript. See comments >Symbol legend within the frame of each graphic indicates what different color bars, lines or shapes represent. OK>Figures are numbered sequentially in the order in which they appear in the paper. Y>Every figure that appears in paper is directly referenced within the paper. Y>Units are indicated either within the figures (often in the x and y axis labels) or in the text legend. Y9. Appendix 1: Division of labor: Y>Describes role of each group member in developing and implementing the project. [writing yes, not data collection]10. General comments:
Greta, Kate and Emily:
Yours was a very successful research project in that you asked questions about spatial heterogeneity for which answers were not known and came up with some interesting results that genuinely improve our understanding about what is happening and what is NOT happening in the LM. The pattern of PO4 with depth and the relationship between Cl and NO3 and PO4 are certainly the big take homes points for me. These are findings that represent an important contribution to future researchers on Oberlin’s LM system. Please see my extensive comments within your report. As I indicate, although you include a variety of important and useful information as context, in general the introduction is a bit disorganized. It also contains extraneous information that makes it difficult to clearly follow the gap in knowledge you create. The results section would benefit from a clearer explanation of your statistical findings (again, see comments in your text).
You clearly rehearsed your poster presentation. All of you provided nice clear explanations of the work conducted and the lessons learned. Transitions between members were also solid. As in the paper, you need to provide a clearer explanation of how/why you can consider Cl to be a passive tracer. The poster itself, though a bit text heavy, is nicely laid out and easy to follow.
Nice work!