Embed Size (px)
Citation preview

JOURNAL OF SMART ECONOMIC GROWTH
www.jseg.ro ISSN: 2537-141X Volume 3, Number 3, Year 2018
95
WHICH IS BETTER FOR ECONOMIC GROWTH IN SRI
LANKA, TRADE WITH SAARC OR TRADE WITH ASEAN?
M. G. C. N. Madadeniya1 and S. Sivarajasingham2
1 Department of Economics and Statistics, University of Peradeniya, Sri Lanka
E-mail: [email protected]
2 Department of Economics and Statistics, University of Peradeniya, Sri Lanka
E-mail: [email protected]
Abstract: Should Sri Lanka trade with SAARC or ASEAN, in order to promote its economic
growth? This is a question of interest, given the country’s recent trade agreement with
Singapore and its prospects of bilateral trade with Bangladesh, Indonesia, Malaysia, Thailand
and Vietnam. Starting from SAPTA in 1995, Sri Lanka has signed the most of its bilateral and
regional trade agreements with its South Asian neighbours. However, the country is developing
a new interest in trading with ASEAN countries. Given Sri Lanka’s present low economic
growth performance, it is important to analyse whether the prospective trade agreements can
accelerate the country’s economic growth. In this context, this study followed the Neoclassical
growth theory to conduct a time series analysis in addressing the problem, ‘which is better for
economic growth in Sri Lanka, trade with SAARC or trade with ASEAN?’, considering the
period from 1990 to 2016. The main objectives of the study were to analyse the growth
contribution of SAARC-Sri Lanka trade and ASEAN-Sri Lanka trade, and thereby draw policy
implications of the findings. The results showed that trade with both regions promote economic
growth in Sri Lanka in the long run. It was concluded that the prospective FTAs with ASEAN
countries can be more beneficial for Sri Lanka’s economic growth because even with no FTAs
signed during the period considered, trade with ASEAN showed a positive impact on Sri
Lanka’s economic growth.
JEL classification: F11, F14, F43
Key words: Economic Growth, Sri Lanka, Trade
JOURNAL OF SMART ECONOMIC GROWTH
www.jseg.ro ISSN: 2537-141X Volume 3, Number 3, Year 2018
96
1. INTRODUCTION
1.1. Background
One of the most important arguments in favour of trade is its contribution to the growth of an
economy. World Bank (2017: 8) says, “In advanced economies (AEs) as well as emerging and
developing economies (EMDEs), the rising living standards that came with greater trade
openness lent widespread support to the view of trade as a key engine of economic growth”.
Thus, although with both benefits and drawbacks, trade is generally identified as an important
source of economic growth. Therefore, countries around the world continuously attempt to
develop trade relationships with each other.
In order to promote multilateral trade between countries, the World Trade Organization (WTO)
is conducting Doha round negotiations since 2001. However, due to various disagreements
among its 164 member countries, the negotiations are deadlocked. As a result, countries around
the world have turned to regionalism in order to develop their trade. Today, almost every
country in the world belongs to a certain regional trade bloc.
Since the formation of the South Asian Association for Regional Cooperation (SAARC) in
1985, the eight South Asian countries, including Sri Lanka, are also organized as a regional
bloc to improve trade among each other. Sri Lanka has signed many of its trade agreements
with other SAARC countries. In addition to the South Asian Free Trade Agreement (SAFTA -
signed in 2006) and bilateral trade agreements with India (signed in 2000) and Pakistan (signed
in 2005), another FTA is expected to be signed with Bangladesh. Apart from its continuing
interest in trading with SAARC countries, Sri Lanka is also exploring possibilities for trade
beyond SAARC.
In fact, the country is currently more interested in developing its bilateral trade relationships
with countries in the Association of the Southeast Asian Nations (ASEAN). Sri Lanka’s first
ever FTA with an ASEAN member was signed in January 2018, with Singapore. It is also
planning to sign trade agreements with four other ASEAN countries which are Indonesia,
Malaysia, Thailand and Vietnam.
According to World Bank data, in 2012, real Gross Domestic Product (GDP) of Sri Lanka
reached an all-time high level of 9.14 percent. However, in 2013, real GDP growth fell
drastically to 3.40 percent and since then, it has witnessed a declining trend. In 2017, real GDP

JOURNAL OF SMART ECONOMIC GROWTH
www.jseg.ro ISSN: 2537-141X Volume 3, Number 3, Year 2018
97
growth was 3.37 percent. Thus, the country is critically in need of ways to accelerate its
economic growth. As a source of economic growth, trade can play a vital role in this context.
Hence, this paper aims to analyse whether it is trade with SAARC or trade with ASEAN which
can promote economic growth in Sri Lanka.
1.2. Literature Review
Many theories have been developed to explain the relationship between trade and economic
growth. The following is a summary of some of the major theories on trade-growth
relationship.
The Classical theories of absolute advantage and comparative advantage mark the origins of
the theory behind trade-growth relationship. However, these theories basically focus on welfare
gains from international trade and therefore, they do not discuss much on the impact of trade
on growth. Nevertheless, they bring out some important growth implications of trade. In fact,
these theories mostly emphasized the importance of trade for wealth and welfare of nations,
which are two aspects that have strong links with economic growth.
The theory of absolute advantage states that when a country can produce a good more
efficiently than others, i.e. with lower marginal cost, that country will have the absolute
advantage in the production of the particular good. The theory postulates that trade will
maximize gains if the countries produce and export those goods in which they have absolute
advantage. This was introduced by Adam Smith in 1776, through his magnum opus, “An
Inquiry into the Nature and Causes of the Wealth of Nations”. This publication brought forward
the contemporary mercantilist ideas which postulated that the amount of wealth in the world is
static and that a nation can increase its wealth only at the expense of another nation. Favourable
trade balance with more and more exports and less and less imports was identified as a key
way of accumulating wealth of a nation. Hence, trade was not considered mutually beneficial
for all the participants. Further, trade was not considered beneficial for those countries that do
not have absolute advantage in the production of any good.
Opposing Smith’s view of trade, comparative advantage theory developed by David Ricardo
in 1817, showed the possibilities for mutually beneficial trade. When a country can produce a
particular good or service at a lower opportunity cost relative to others, the particular country
is said to have a comparative advantage in producing that good. Thus, even if one country has

JOURNAL OF SMART ECONOMIC GROWTH
www.jseg.ro ISSN: 2537-141X Volume 3, Number 3, Year 2018
98
the absolute advantage in the production of all goods, all the countries will gain if each country
exports the good with comparative advantage and import the good with comparative
disadvantage. Ricardo’s theory of comparative advantage thus showed the possibilities for
mutually beneficial trade in developing countries that rarely have absolute advantages in
production.
However, according to the neoclassical theory of trade, as countries specialize in the goods in
which they have the comparative advantage, the production of the good in which it has the
comparative disadvantage will be sacrificed in increasing amounts. This will gradually increase
the opportunity costs of production and ultimately, the comparative advantage will be lost.
It should be noted that the theories of trade do not always explain trade as a drive for economic
growth. The Infant-industry argument of Friedrich List (1841) explained that nascent industries
in the developing sectors of the domestic economy should be protected from international
competitors until they are able to attain economies of scale. For this, the governments are
expected to restrict trade through import duties, tariffs, quotas and exchange rate controls etc.
This theory implies that trade can procure negative consequences in the domestic economy.
The Heckscher-Ohlin (H-O) theorem introduced by Heckscher (1919) and Ohlin (1933), is also
based on the theory of comparative advantage, but adds more meaning to it. It states that under
certain assumptions, a nation will export the commodity whose production requires the
intensive use of the nation’s relatively abundant and cheap factor and import the commodity
whose production requires the intensive use of the nation’s relatively scarce and expensive
factor. This maximizes gains from trade for all nations as they are able to consume more goods
than under autarky. The factor-price equalization theorem, which is a corollary of the H-O
theorem, states that international trade will bring about equalization in relative and absolute
returns to homogenous factors across nations. Therefore, trade can improve welfare and
income, while changing the income distribution across countries through optimum allocation
of factors. Hence, the H-O theory implies a great deal of facts on how trade can bring about
economic growth.
The Rybczynski theorem developed by Tadeusz Rybczynski (1955), showed that in the context
of the H-O model of international trade, trade between two nations often leads to changes in
relative factor supplies between the nations. The Rybczynski theorem explains how changes in
factor endowment affect the outputs of the goods when full employment is sustained. Assuming

JOURNAL OF SMART ECONOMIC GROWTH
www.jseg.ro ISSN: 2537-141X Volume 3, Number 3, Year 2018
99
that a country produces only two goods, the theory postulates that at constant commodity
prices, an increase in the endowment of one factor will increase the output of the commodity
intensive in that factor by a greater proportion and reduce the output of the other commodity.
Thus, Rybczynski sheds light upon the fact that trade can procure growth in one sector of the
economy, while procuring decline in another.
Jagdish Bhagwati, introduced the Immersing Growth theory in 1958, which showed that if
growth is heavily export biased, it might lead to a fall in the terms of trade of the exporting
country. Sometimes, this fall in the terms of trade can be so large as to outweigh the gains from
growth. In such cases, trade would bring about just a temporary increase in economic growth
and eventually, the country would be worse off after growth than before. This theory implies
that opening up to trade in the presence of distortions can decrease the growth and welfare of
an economy.
In 1960s, two theories were developed as a result of the failure of the H-O model to explain
the actual pattern of international trade. Technological gap theory developed by Posner in 1961
explained trade, based on a dynamic sequence of technological innovation and diffusion.
Technologically advanced countries with a high capacity to innovate achieve high profits in
the world market by innovating sophisticated products which are initially untraceable to other
countries. Over time, the technology is diffused and adopted by other countries, which are then
able to produce and supply the product, better than the original innovator. This innovation and
diffusion takes place again and again as a cycle.
The Product Life Cycle Theory developed by Raymond Vernon in 1966 suggests that in early
stages of a product's life-cycle, all the factors of production associated with that product come
from the country where it was invented. After the product is adopted and used in the world
markets, production gradually moves away from the point of origin. In some situations, the
inventor ultimately becomes an importer of that product. These two theories show that trade
can provide more opportunities for developing countries to absorb new ideas and technology,
and to benefit from them.
The New Trade Theory (NTT) is an economic theory that was developed in the 1970s to predict
international trade patterns. NTT are mainly based on the concepts of monopolistic
competition and increasing returns to scale. It is said that these concepts are significant to such
an extent that they outweigh the more traditional theory of comparative advantage. Because of

JOURNAL OF SMART ECONOMIC GROWTH
www.jseg.ro ISSN: 2537-141X Volume 3, Number 3, Year 2018
100
the scale economies earned by those who capture the market earlier than the others, world
markets become imperfectly competitive. The resulting monopolistic competition suggests that
firms often compete not only in terms of price, but also in terms of branding and quality etc. It
explains why countries can both export and import the same good. Thus, NTT explains why
countries become trade partners even when they are exporting similar goods and services. NTT
further explains that nations can benefit from trade even when they do not differ much in terms
of resource endowments and technology. These ideas fit well to the South Asian context where
the countries in the region do not differ much in production, exports and technology.
In addition to the above theories, there are many empirical studies that have investigated the
relationship between trade and economic growth. These studies provide important indications
for future studies on trade-growth relationship.
Harrison (1995) draws together a variety of measures to test the association between trade
openness and growth. The results indicate that generally, there is a positive association between
growth and different measures of openness. In other words, greater trade openness is associated
with higher growth.
Frankel, Romer, and Cyrus (1996) investigate the cause and effect relationship between trade
openness and growth using a sample of over 100 countries, along with special emphasis on
East Asian countries. Through the estimates of growth equations, they find that trade openness
plays a major role particularly in explaining rapid growth among East Asian countries. Further,
the effect of openness on growth is found to be even stronger when corrected for the
endogeneity of openness. They conclude that trade openness has contributed to East Asian
growth through the geographical component of openness and also through the policy
component of openness.
Amstrong and Read (1998) explain the implications of trade liberalization on growth of small
states. They show that international trade provides the means for small states to overcome the
inherent diseconomies of small size by extending their market. They emphasize that the small
states have the potential to be among the largest gainers from global trade liberalization. This
highlights the importance of trade for South Asia which mostly consists of small economies.
However, the authors also mention that the small countries can remain highly sensitive to
possible, large adverse effects. “While a high degree of openness may have very desirable
growth effects, it also exacerbates the inherent vulnerability of a small state to exogenous

JOURNAL OF SMART ECONOMIC GROWTH
www.jseg.ro ISSN: 2537-141X Volume 3, Number 3, Year 2018
101
shocks in the global economy and/or its principal trading partners.” (Amstrong and Read 1998:
571). Briefly, international trade cannot completely offset the absolute size effects of a small
state. Thus, small and developing economies like Sri Lanka, should be careful when selecting
their trade partners from around the world.
Wacziarg and Welch (2008) investigate the relationship between trade liberalization and
economic growth, extending the Sachs and Warner study of this relationship. They find that
liberalization has, on average, robust positive effects on growth, openness and investment rates
within countries.
Assuming a causal linkage between trade and income, Busse and Koniger (2012) argue that
changes in trade (volume) over time would always cause corresponding changes in income.
According to them, the dynamic properties of this causal relationship is not accounted for by
the trade openness ratio. However, the particular dynamic properties will be accounted for by
the volume of exports and imports as a share of lagged total GDP. The study finds that this
trade measure has a positive and highly significant impact on economic growth in 108 countries
during the period 1971-2005. Likewise, it is highlighted that the observations on trade precede
growth effects. This helps to prove the positive impact of trade on economic growth.
Thus, trade is generally identified as a source of economic growth in most of the studies.
However, some researchers show that developing countries can improve economic growth by
trading with developed economies rather than by trading with other developing countries.
Vamvakidis (1998) examines whether the openness, market size, and level of development of
countries in the same region foster growth in the home country. The study presents empirical
evidence that countries with open, large, and more developed neighbouring economies grow
faster than those with closed, smaller, and less developed neighbouring economies. The study
suggests that small economies would grow faster when they form regional trade agreements
with large and more developed economies. “Given that no country has zero trade barriers, if an
RTA increases the openness of the large and more developed economies toward less developed
member countries, it will promote their growth.” (Vamvakidis 1998: 265). It is worthwhile
conducting an analysis to check whether this argument is valid for South Asia where all the
neighbouring economies are still developing. In such a case, ASEAN would have more
potential to improve economic growth in Sri Lanka, as in includes some large, high income
economies.
JOURNAL OF SMART ECONOMIC GROWTH
www.jseg.ro ISSN: 2537-141X Volume 3, Number 3, Year 2018
102
Vamvakidis (1999) examines whether it is regional trade or broad liberalization that leads to
faster growth. Based on time series evidence, the study shows that economies grew faster after
broad liberalization, both in the short and long run, but slower after participation in a regional
trade agreement. This suggests that closed economies that want to open up their market to free
trade should choose the global path. When a small developing economy joins an RTA, the
agreement will mainly include small developing economies by definition. This is because more
often the neighbouring countries have similar economies. As a result, intra-trade shares will
also be small among developing economies. This might suggest the reason for small intra-
regional trade shares in South Asia. However, a considerable amount of Sri Lanka’s trade take
place with South Asian countries, especially with India and Pakistan.
Arora and Vamvakidis (2004) empirically examine the extent to which a country’s economic
growth is influenced by its trading partner economies. According to panel estimation results
based on four decades of data for over 100 countries, they find that the trading partners’ growth
and relative income levels have a strong effect on domestic growth, even after controlling for
the influence of common global and regional trends. The results seem to be stronger for open
economies and for more recent decades. The study suggests that “… industrial countries benefit
from trading with developing countries, which can be expected to grow rapidly because of
convergence effects; and at the same time, developing countries benefit from trading with
industrial countries, which have higher relative incomes.” (Arora and Vamvakidis 2004: 12).
Although there is hardly any research analysing the positive and negative effects of trade with
ASEAN for Sri Lanka, many studies have investigated issues related to trade among SAARC
countries. Most of them shed light upon the problem of trade diversion. These studies are
crucial in understanding the extent to which SAARC can contribute to Sri Lanka’s economic
growth.
According to Ahmed and Ghani (2007), it is justifiable to say that regional integration alone
will not generate growth effects for South Asia. This is due to South Asia’s small regional
market relative to the world and its high level of protection. They say that, “When external
protection is high, trade diversion is likely to dominate trade creation, and so the risks that
regional integration will be a drag on growth in South Asia is high.” (Ahmed and Ghani 2007:
40). However, they also point out that regional integration is desirable from other perspectives

JOURNAL OF SMART ECONOMIC GROWTH
www.jseg.ro ISSN: 2537-141X Volume 3, Number 3, Year 2018
103
such as addressing energy shortage, ensuring that no country is left behind, improving access
of landlocked countries to markets, and promoting peace and stability.
There is a plenty of other studies which examine the desirability of South Asia’s regional and
preferential trade agreements. Most of them points out the negativities of these agreements.
Bandara and Yu (2001) explore whether it is better for South Asian countries to promote non-
discriminatory trade liberalisation rather than promote SAFTA. Using trade data and a global
computable general equilibrium (CGE) model, they find that unilateral liberalisation would
benefit South Asian countries much more than preferential liberalisation. They too argue that
under preferential liberalisation, small countries in the region would gain little or even lose.
Panagariya (2003) addresses the issue of trade liberalization, comparing two broad approaches
to trade liberalization: non-discriminatory and preferential. They highlight an important source
of trade diversion caused by regional trade in South Asia. Business lobbies that are relatively
powerful in most of the countries in the South Asian region are likely to exploit the rules of
origin and sectoral exceptions in regional arrangements in ways that will maximize trade
diversion and minimize trade creation. It is stated that all trade diversion can be avoided if the
countries in the region were to liberalize on a non-discriminatory basis.
Ali and Talukder (2009) find that, with the existing low level of intra-regional trade shares, the
gains from free trade arrangements in the South Asian region are likely to be minimal. They
highlight the possibility that small countries may lose and large countries may gain from an
FTA in such a region. This study concludes that due to the insignificant share of world trade
and persistent high levels of tariff barriers, the preferential liberalization in South Asia is more
likely to bring about trade diversion than trade creation.
Te Velde (2011) says that the mere reduction or elimination of tariffs on intra-regional trade
will have fewer effects if the potential for intra-regional trade is small. They too say that trade
with regional partners would lead to trade diversion rather than trade creation in South Asia.
This is because compared to the rest of the world, the South Asian region is small both in terms
of economic size as measured by GDP (and per capita income) and the share in the world trade.
On the contrary, Burki (2012) offers a more optimistic view of preferential trade in South Asia.
This particular study uses a simple econometric model to estimate the benefits that can accrue
to the countries in the South Asian region if more trade were directed towards South Asia. It
shows that greater intra-regional trade in South Asia will have a significant impact on the

JOURNAL OF SMART ECONOMIC GROWTH
www.jseg.ro ISSN: 2537-141X Volume 3, Number 3, Year 2018
104
structure of the economies of the smaller countries in the region as they develop linkages with
large enterprises in India.
Sultana and Asrat (2014) who perform an in-depth assessment of the potential of SAFTA in
SAARC countries find that SAFTA can be a strong source of economic development and it
can also enhance socio-economic opportunities throughout the region. Larger and
economically stronger countries in the region are considered to be important in achieving better
bargaining power on trade negotiations by utilizing existing competitive advantages and
regional expertise of the region as a unit. They further assert that preferential trade can help
less developed countries to develop their economies and to ensure the best possible use of the
existing resources.
Only few studies have analysed the possible impacts of trade on economic growth in Sri Lanka
with special reference to both SAARC and ASEAN. Weerakoon and Wijayasiri (2001) show
that the technology, investment and trade needs of Sri Lanka are more closely aligned to those
of its East Asian neighbours than to Bangladesh, Bhutan, Nepal or the Maldives. Therefore,
under the current economic and political circumstances, trading with other countries is better
for economic growth in Sri Lanka than trading with SAARC members.
However, Weerakoon and Perera (2014) show that Sri Lanka can benefit from greater
connectivity with South and Southeast Asia by pursuing closer economic integration with its
neighbours. They show that Sri Lanka should expand the current bilateral free trade agreement
with India because many of the country’s competitors in the Asian region have gained access
to markets through such beneficial deals. Thus, developing trade relationships especially with
India is important for Sri Lanka to gain access to Southeast Asia. Bhattacharyay (2014) also
shows that integrating India, and through India other major South Asian economies such as
Bangladesh, Pakistan, and Sri Lanka, to the South East Asian production network will create
win-win situations for both regions. Through this, it is expected to reduce the excessive
dependence of South Asia on advanced countries in the West. However, this leads to a new
question whether the small countries in South Asia will then start to depend on India.
Although the above studies reveal important facts on the opportunities and potential benefits
of Sri Lanka’s trade with SAARC and ASEAN, all of them are descriptive. Moreover, there is
no clear-cut comparison made between the growth contribution of trade with those two regions.

JOURNAL OF SMART ECONOMIC GROWTH
www.jseg.ro ISSN: 2537-141X Volume 3, Number 3, Year 2018
105
Therefore, an empirical study on the particular issue is a research gap identified through the
review of literature.
1.3. Research Problem/Questions
Considering Sri Lanka’s new turn towards trade with ASEAN as well as its attempt to continue
trading with SAARC amidst the existing economic and political impediments, the problem
arises whether it is trade with SAARC or trade with ASEAN which can promote economic
growth in Sri Lanka. To that end, this study attempts to answer the following questions.
- What is the impact of trade with SAARC and trade with ASEAN on economic growth
in Sri Lanka?
- With whom should Sri Lanka trade in order to promote the country’s economic growth?
Accordingly, the two objectives of this study are,
- To analyse the growth contribution of SAARC-Sri Lanka trade and ASEAN-Sri Lanka
trade
- To draw policy implications of the findings
The importance of this analysis is that it would provide a guideline for the trade policy of Sri
Lanka. It will show whether the existing trade policy regarding the selection of trade partners,
as well as the prospective changes in it would be beneficial or not, for a trade-led economic
growth in the country.
2. METHODOLOGY
There is an abundance of empirical literature on the relationship between trade and economic
growth. However, empirical studies on the growth contribution of trade with SAARC and
ASEAN for Sri Lanka are hardly available. Therefore, this study has attempted to provide a
foundation to conduct an empirical analysis on the particular issue.
This study conducted a time series analysis on the impact of trade with SAARC and ASEAN
on economic growth in Sri Lanka, for the period, 1990-2016. In constructing the model, the
Neo-classical growth theory was used, which explains what part of growth in total output is
due to growth in different factors of production.
The production function expresses the quantitative relationship between inputs and outputs.
Output grows through increases in inputs and through increases in productivity that occur due
JOURNAL OF SMART ECONOMIC GROWTH
www.jseg.ro ISSN: 2537-141X Volume 3, Number 3, Year 2018
106
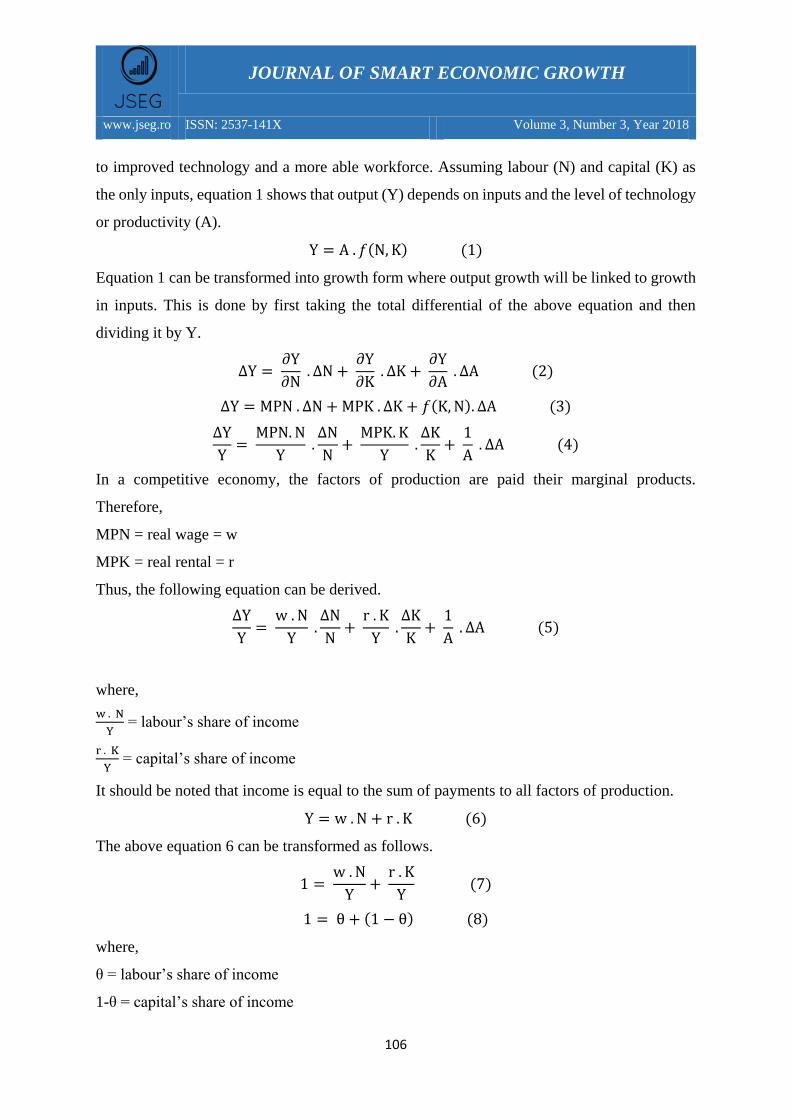
to improved technology and a more able workforce. Assuming labour (N) and capital (K) as
the only inputs, equation 1 shows that output (Y) depends on inputs and the level of technology
or productivity (A).
Y = A . 𝑓(N, K) (1)
Equation 1 can be transformed into growth form where output growth will be linked to growth
in inputs. This is done by first taking the total differential of the above equation and then
dividing it by Y.
∆Y = ∂Y
∂N . ∆N +
∂Y
∂K . ∆K +
∂Y
∂A . ∆A (2)
∆Y = MPN . ∆N + MPK . ∆K + 𝑓(K, N). ∆A (3)
∆Y
Y=
MPN. N
Y .
∆N
N+
MPK. K
Y .
∆K
K+
1
A . ∆A (4)
In a competitive economy, the factors of production are paid their marginal products.
Therefore,
MPN = real wage = w
MPK = real rental = r
Thus, the following equation can be derived.
∆Y
Y=
w . N
Y .
∆N
N+
r . K
Y .
∆K
K+
1
A . ∆A (5)
where,
w . N
Y = labour’s share of income
r . K
Y = capital’s share of income
It should be noted that income is equal to the sum of payments to all factors of production.
Y = w . N + r . K (6)
The above equation 6 can be transformed as follows.
1 = w . N
Y+
r . K
Y (7)
1 = θ + (1 − θ) (8)
where,
θ = labour’s share of income
1-θ = capital’s share of income
JOURNAL OF SMART ECONOMIC GROWTH
www.jseg.ro ISSN: 2537-141X Volume 3, Number 3, Year 2018
107
Substituting equations 7 and 8 in 5, the growth accounting equation can be derived as follows.
∆Y
Y= θ .
∆N
N+ (1 − θ).
∆K
K+
∆A
A (9)
Thus, labour and capital, each contributes an amount equal to their individual growth rates
multiplied by the input’s share of total income. The last term of the equation is the rate of
improvement in technology. This is also called total factor productivity growth.
According to the existing theories on trade-growth relationship, trade is considered a part of
total factor productivity, and therefore, based on the above mathematical model, the following
statistical model was constructed.
LNGDPt = β0 + β1 LNGCFt + β2 LFPRt + β3 SAARCt + β4 ASEANt + εt (10)
where LNGDP is the log of real GDP, LNGCF is the log of real gross capital formation, LFPR
is the labour force participation rate, SAARC is the log of total trade with SAARC (due to the
lack of data, Bhutan and Nepal were excluded), ASEAN is the log of total trade with ASEAN
(due to the lack of data, Brunei, Cambodia and Laos were excluded), ε is the error term and the
subscript t indicates time. All the variables are relevant to Sri Lanka and secondary data were
collected from two online databases which are World Development Indicators1 and ARIC
Integration Indicators2.
Augmented Dickey Fuller and Philips Perron unit root tests were used to check whether the
variables are stationary. Auto Regressive Distributed Lag (ARDL) Bounds Testing approach
was used to study the long run equilibrium relationship between variables. ARDL Error
Correction Model was estimated to study the short run relationship between variables. The
ARDL method yields consistent and robust results for both long run and short run relationship
between variables even the sample size is small. Moreover, this method can be employed when
there is a combination of both I (0) and I (1) variables.
Schwarz criterion was used as the lag selection criterion. The level of significance considered
in the analysis is 5 percent. Diagnostic Tests were conducted to check whether the results are
robust. The tests conducted are, Jarque-Bera test (to check whether the residuals are normally
1 Available at: http://databank.worldbank.org/data/reports.aspx?source=world-development-indicators
2 Available at: https://aric.adb.org/integrationindicators

JOURNAL OF SMART ECONOMIC GROWTH
www.jseg.ro ISSN: 2537-141X Volume 3, Number 3, Year 2018
108
distributed), Lagrange Multiplier – LM test (to detect serial correlation among residuals),
Breusch-Pagan-Godfrey test (to detect heteroscedasticity in the model), Ramsey RESET test
(to check whether the model is specified correctly), Cumulative Sum (CUSUM) test and
Cumulative Sum Squares (CUSUMSQ) test (to check the stability of the model).
3. RESULTS AND DISCUSSION
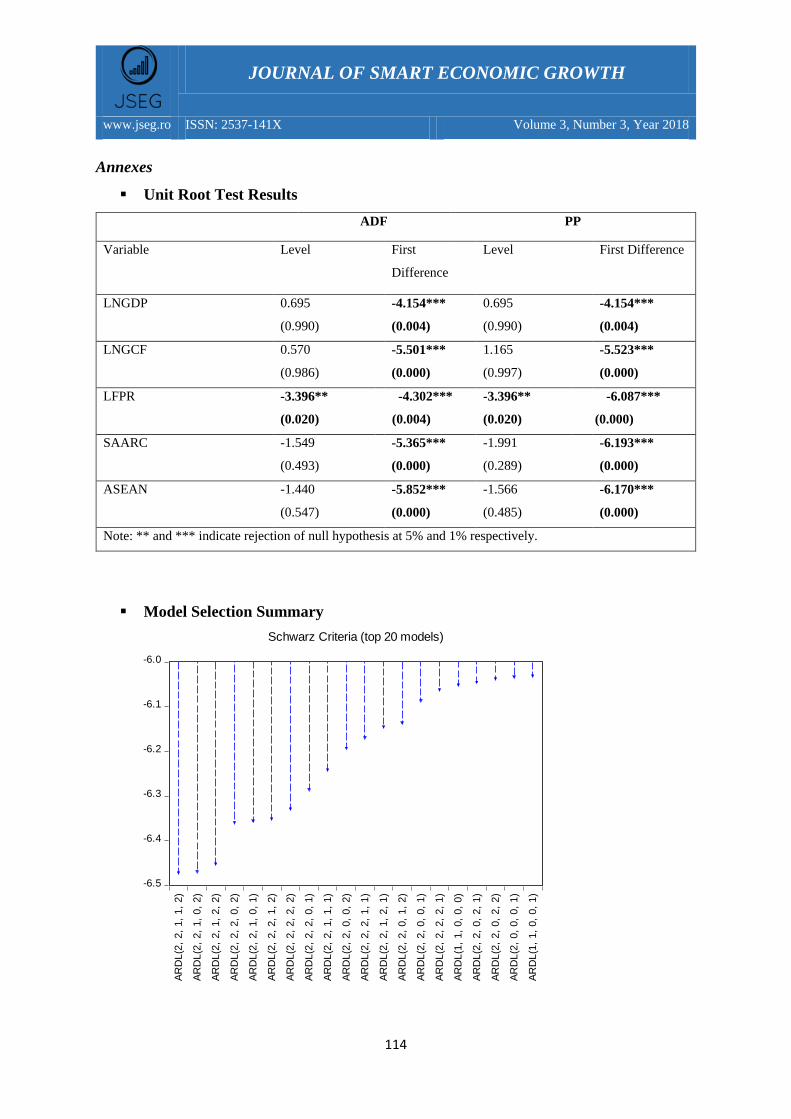
According to the unit root test results, Labour Force Participation Rate (LFPR) was stationary
at level, while all other variables in the model were stationary in the first difference at 5 percent
level of significance. After confirming that there is cointegration among variables in the model
through the ARDL bounds test, ARDL long run and short run estimations were derived as
shown below.
Long Run Form
Variable Coefficient Std. Error t-Statistic Prob.
LNGCF 0.391*** 0.040 9.695 0.000
LFPR -0.011* 0.006 -1.916 0.079
SAARC 0.136*** 0.023 5.993 0.000
ASEAN 0.089** 0.037 2.389 0.034
Error Correction Model Results
D(LNGDP(-1)) -0.761*** 0.139 -5.459 0.000
D(LNGCF) 0.183*** 0.012 14.556 0.000
D(LNGCF(-1)) 0.131*** 0.024 5.446 0.000
D(LFPR) 0.000 0.001 0.361 0.724
D(SAARC) 0.014* 0.007 1.965 0.073
D(SAARC(-1)) -0.023*** 0.007 -3.348 0.006
D(ASEAN) 0.017* 0.009 1.805 0.096
CointEq(-1) -0.380*** 0.035 -10.818 0.000
R-squared 0.957 Mean dependent var 0.052
Adjusted R-squared 0.939 S.D. dependent var 0.020
S.E. of regression 0.005 Akaike info criterion -7.505
Sum squared resid 0.000 Schwarz criterion -7.115
Log likelihood 101.813 Hannan-Quinn criter. -7.397
Durbin-Watson stat 2.265 Source: EViews
(Note: *, ** and *** indicate rejection of null hypothesis at 10%, 5% and 1% respectively.)
Table 1: ARDL Model
Estimations

JOURNAL OF SMART ECONOMIC GROWTH
www.jseg.ro ISSN: 2537-141X Volume 3, Number 3, Year 2018
109
Trade with SAARC as well as with ASEAN has a positive and significant impact on the GDP
of Sri Lanka in the long run. When trade with SAARC increases by 1 percent, the GDP of Sri
Lanka increases by 13.6 percent, ceteris paribus. When trade with ASEAN increases by 1
percent, the GDP of Sri Lanka increases by 8.9 percent, ceteris paribus. However, in the short
run, trade with SAARC has a negative impact on Sri Lanka’s GDP. When trade with SAARC
increases by 1 percent, GDP decreases by 2.3 percent in the short run, ceteris paribus. In the
short run, trade with ASEAN is not significant. Gross capital formation has a positive and
significant impact on the GDP of Sri Lanka both in the long run and short run. However, labour
force participation rate has no impact on the GDP of Sri Lanka either in the long run or short
run. The Error Correction Term which is negative and significant, shows that the model is
stable in the long run and there is long run adjustment. GDP growth moves back to equilibrium
path and the disequilibrium error is corrected by 38% each year, following an exogenous shock.
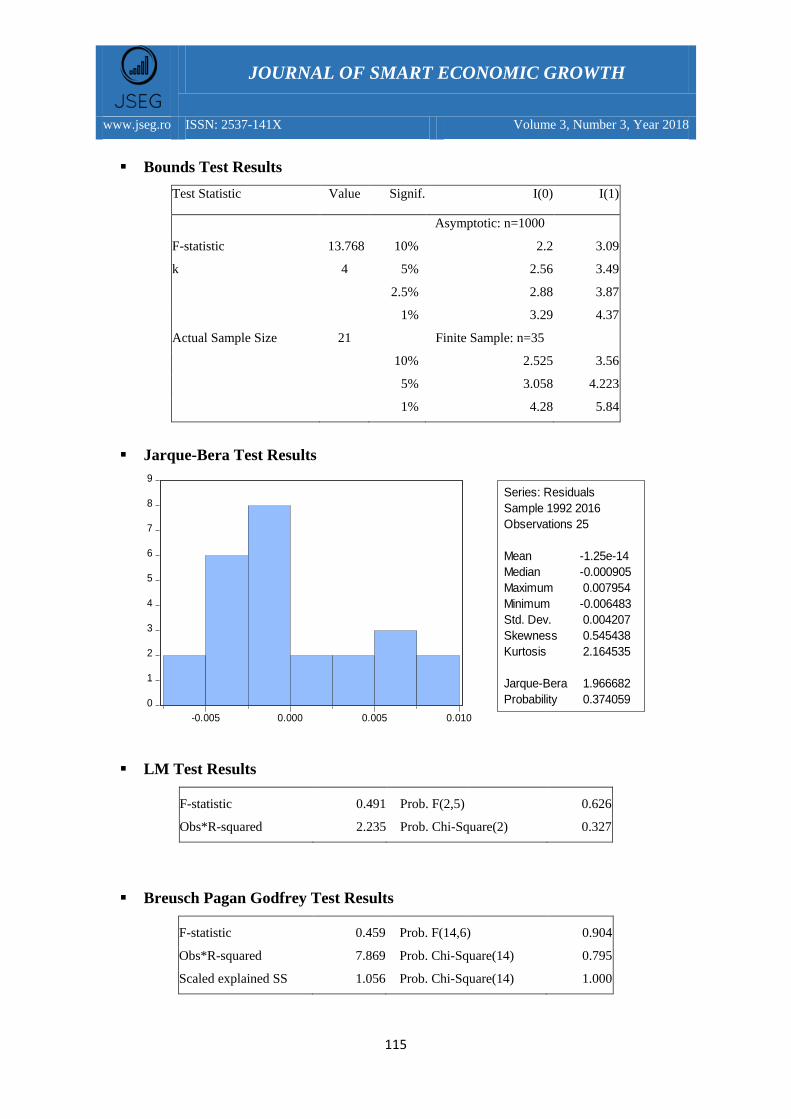
All the diagnostic tests proved that there are no diagnostic errors and the results are robust.
According to the above findings, trading with both SAARC and ASEAN promotes economic
growth in Sri Lanka in the long run. It should be noted that in 2016, SAARC accounted for 10
percent of Sri Lanka’s exports and 22 percent of the country’s imports. Even without any trade
agreements between the two parties, ASEAN accounted for only 3 percent of Sri Lanka’s
exports and 15 percent of the country’s imports.3 Therefore, the findings of this study indicate
the growth potential of trade with ASEAN, if it is increased through the prospective trade
agreements of Sri Lanka.
Sri Lanka’s trade with SAARC is mainly dominated by India. In 2016, India accounted for
around 72 percent of Sri Lanka’s exports to SAARC and 90 percent of its imports from
SAARC. In fact, India is Sri Lanka’s largest import origin after China.
Sri Lanka imports from Singapore, Malaysia, Thailand and Indonesia more than from any
SAARC country except for India. It should be noted that, except for Bangladesh and Singapore
all other countries in SAARC and ASEAN (without India) account for less than 1 percent of
Sri Lanka’s exports.
3 Source: ITC Trade Map. Available at: https://www.trademap.org

JOURNAL OF SMART ECONOMIC GROWTH
www.jseg.ro ISSN: 2537-141X Volume 3, Number 3, Year 2018
110
According to figure 1, considering overall trade with both exports and imports, Singapore,
Malaysia, Thailand, and Indonesia are the top four trade partners in the list respectively after
India.
Source: ITC Trade Map
0
1
2
3
4
5
6
% i
n t
ota
l im
po
rts
Import Origins of Sri Lanka
Figure 1
Import origins and export destinations of Sri Lanka in SAARC and
ASEAN (excluding India) in 2016
0
0.2
0.4
0.6
0.8
1
1.2
% i
n t
ota
l ex
po
rts
Export Destinations of Sri Lanka

JOURNAL OF SMART ECONOMIC GROWTH
www.jseg.ro ISSN: 2537-141X Volume 3, Number 3, Year 2018
111
Thus, India has played a significant role behind the impact of trade with SAARC on economic
growth in Sri Lanka whereas among ASEAN countries, Singapore has played the most
significant role.
4. CONCLUSION AND POLICY RECOMMENDATIONS
This study followed the Neoclassical growth theory in a time series analysis conducted to
address the problem, ‘which is better for economic growth in Sri Lanka, trade with SAARC or
trade with ASEAN?’, considering the period from 1990 to 2016. The main objectives of the
study were to analyse the growth contribution of SAARC-Sri Lanka trade and ASEAN-Sri
Lanka trade, and thereby draw policy implications of the findings. The results showed that both
ways of trading promote economic growth in Sri Lanka in the long run. Therefore, Sri Lanka
should expand its trade with countries in both regions in order to reap growth benefits in the
long run. In fact, the country should improve its trade relationships, especially with India and
Singapore.
It is likely that trading with SAARC promotes economic growth in Sri Lanka, especially
because of free trade agreements with India and Pakistan. However, although with no trade
agreements signed during the period considered, trade with ASEAN has also contributed
significantly to the economic growth in Sri Lanka. Given that, ASEAN is a region with some
high income economies with a considerable population and exporting high technology
products, this region can have more growth potential than SAARC. Therefore, it can be
concluded that Sri Lanka’s FTAs with ASEAN countries can be beneficial for the future
economic growth in the country. However, policy makers should make sure that the prospective
agreements are designed so as to give the maximum possible benefit to Sri Lanka.
CONFLICTS OF INTEREST AND PLAGIARISM: The authors declare no conflict of
interest and plagiarism.

JOURNAL OF SMART ECONOMIC GROWTH
www.jseg.ro ISSN: 2537-141X Volume 3, Number 3, Year 2018
112
5. REFERENCES
1. Ahmed, S. and Ghani, E. (2007). ‘South Asia’s Growth and Regional Integration: An
Overview’. In Ahmed, S.and Ghani, E. (eds.). South Asia: Growth and Regional
Integration. Delhi: Macmillan India Ltd. pp. 3-42.
2. Ali, E. and Talukder, D.K. (2009). ‘Preferential trade among the SAARC countries:
Prospects and challenges of regional integration in South Asia’. Joaag, 4(1), 47-59.
3. Armstrong, H.W. and Read R. (1998).‘Trade and growth in small states: the impact of
global trade liberalisation’. The World Economy, 21(4), 563-585.
4. Arora, V. and Vamvakidis, A. (2005). ‘How much do trading partners matter for
economic growth?’. IMF staff papers, 52(1), 24-40.
5. Bandara, J.S. and Yu, W. (2003). ‘How desirable is the South Asian Free Trade Area?
A quantitative economic assessment’. The World Economy, 26(9), 1293-1323.
6. Bhattacharyay, B. (2014). ‘Prospects and Challenges of Integrating South and
Southeast Asia’. International Journal of Development and Conflict, 4(2014), 40-66.
7. Burki, S.J. (2012). ‘South Asia’s Economic Future with or without Economic
Integrations’. ISAS Working Paper, No.110. Available at:
http://www.css.ethz.ch/content/specialinterest/gess/cis/center-for-securities-
studies/en/services/digital-library/publications/publication.html/118962
8. Busse, M. and Königer, J. (2012). ‘Trade and economic growth: A re-examination of
the empirical evidence’. HWWI Research paper, No.12. Available at:
https://papers.ssrn.com/sol3/papers.cfm?abstract_id=20099393
9. Frankel, J.A., Romer, D. and Cyrus, T. (1996). ‘Trade and growth in East Asian
countries: cause and effect?’.NBER Working Paper, No. 5732. Available at:
http://www.nber.org/papers/w5732
10. Harrison, A. (1996). ‘Openness and growth: A time-series, cross-country analysis for
developing countries’. Journal of Development Economics, 48(2),419-447.
11. Panagariya, A. (2003). ‘South Asia: does preferential trade liberalisation make
sense?’. The World Economy, 26(9), 1279-1291.
12. Sultana, S. and Asrat, J. (2015). ‘South Asian Countries in Regional Integration
Perspective: A Critical Review’. Journal of Business and Technology (Dhaka), 9(2),
43-59.

JOURNAL OF SMART ECONOMIC GROWTH
www.jseg.ro ISSN: 2537-141X Volume 3, Number 3, Year 2018
113
13. Te Velde, D.W. (2011). ‘Regional integration, growth and convergence’. Journal of
Economic Integration, 26(1), 1-28.
14. Vamvakidis, A. (1998). ‘Regional integration and economic growth’. World Bank
Economic Review, 12, 251-270.
15. Vamvakidis, A. (1999). ‘Regional trade agreements or broad liberalization: which path
leads to faster growth?’. IMF Staff papers, 46(1), 42-68.
16. Wacziarg, R. and Welch, K.H. (2008). ‘Trade liberalization and growth: New
evidence’. NBER Working Paper, No. 10152. Available at:
http://www.nber.org/papers/w10152
17. Weerakoon, D. and Perera, N. (2014). ‘The Role of Sri Lanka in Enhancing
Connectivity between South Asia and Southeast Asia’. ADBI Working paper series,
No. 487. Available at: https://www.adb.org/sites/default/files/publication/154321/adbi-
wp487.pdf
18. Weerakoon, D. and Wijayasiri, J. (2001). ‘Regional Economic Cooperation in South
Asia: A Sri Lankan Perspective’. IPS Research Studies: International Economic Series,
No.6.
19. World Bank (2017). ‘Making trade an engine of growth for all: the case for trade and
for policies to facilitate adjustment’. World Bank Group Working Paper. Available at:
http://documents.worldbank.org/curated/en/318651491579082111/Making-trade-an-
engine-of-growth-for-all-the-case-for-trade-and-for-policies-to-facilitate-adjustment
JOURNAL OF SMART ECONOMIC GROWTH
www.jseg.ro ISSN: 2537-141X Volume 3, Number 3, Year 2018
114
Annexes
Unit Root Test Results
ADF PP
Variable Level
First
Difference
Level First Difference
LNGDP 0.695
(0.990)
-4.154***
(0.004)
0.695
(0.990)
-4.154***
(0.004)
LNGCF 0.570
(0.986)
-5.501***
(0.000)
1.165
(0.997)
-5.523***
(0.000)
LFPR -3.396**
(0.020)
-4.302***
(0.004)
-3.396**
(0.020)
-6.087***
(0.000)
SAARC -1.549
(0.493)
-5.365***
(0.000)
-1.991
(0.289)
-6.193***
(0.000)
ASEAN -1.440
(0.547)
-5.852***
(0.000)
-1.566
(0.485)
-6.170***
(0.000)
Note: ** and *** indicate rejection of null hypothesis at 5% and 1% respectively.
Model Selection Summary
-6.5
-6.4
-6.3
-6.2
-6.1
-6.0
AR
DL
(2,
2,
1,
1,
2)
AR
DL
(2,
2,
1,
0,
2)
AR
DL
(2,
2,
1,
2,
2)
AR
DL
(2,
2,
2,
0,
2)
AR
DL
(2,
2,
1,
0,
1)
AR
DL
(2,
2,
2,
1,
2)
AR
DL
(2,
2,
2,
2,
2)
AR
DL
(2,
2,
2,
0,
1)
AR
DL
(2,
2,
1,
1,
1)
AR
DL
(2,
2,
0,
0,
2)
AR
DL
(2,
2,
2,
1,
1)
AR
DL
(2,
2,
1,
2,
1)
AR
DL
(2,
2,
0,
1,
2)
AR
DL
(2,
2,
0,
0,
1)
AR
DL
(2,
2,
2,
2,
1)
AR
DL
(1,
1,
0,
0,
0)
AR
DL
(2,
2,
0,
2,
1)
AR
DL
(2,
2,
0,
2,
2)
AR
DL
(2,
0,
0,
0,
1)
AR
DL
(1,
1,
0,
0,
1)
Schwarz Criteria (top 20 models)
JOURNAL OF SMART ECONOMIC GROWTH
www.jseg.ro ISSN: 2537-141X Volume 3, Number 3, Year 2018
115
Bounds Test Results
Test Statistic Value Signif. I(0) I(1)
Asymptotic: n=1000
F-statistic 13.768 10% 2.2 3.09
k 4 5% 2.56 3.49
2.5% 2.88 3.87
1% 3.29 4.37
Actual Sample Size 21 Finite Sample: n=35
10% 2.525 3.56
5% 3.058 4.223
1% 4.28 5.84
Jarque-Bera Test Results
0
1
2
3
4
5
6
7
8
9
-0.005 0.000 0.005 0.010
Series: Residuals
Sample 1992 2016
Observations 25
Mean -1.25e-14
Median -0.000905
Maximum 0.007954
Minimum -0.006483
Std. Dev. 0.004207
Skewness 0.545438
Kurtosis 2.164535
Jarque-Bera 1.966682
Probability 0.374059
LM Test Results
F-statistic 0.491 Prob. F(2,5) 0.626
Obs*R-squared 2.235 Prob. Chi-Square(2) 0.327
Breusch Pagan Godfrey Test Results
F-statistic 0.459 Prob. F(14,6) 0.904
Obs*R-squared 7.869 Prob. Chi-Square(14) 0.795
Scaled explained SS 1.056 Prob. Chi-Square(14) 1.000

JOURNAL OF SMART ECONOMIC GROWTH
www.jseg.ro ISSN: 2537-141X Volume 3, Number 3, Year 2018
116
Ramsey RESET Test Results
Value df Probability
t-statistic 1.124 11 0.903
F-statistic 0.015 (1, 11) 0.903
Cumulative Sum and Cumulative Sum of Squares Tests Results
-12
-8
-4
0
4
8
12
05 06 07 08 09 10 11 12 13 14 15 16
CUSUM 5% Significance
-0.4
0.0
0.4
0.8
1.2
1.6
05 06 07 08 09 10 11 12 13 14 15 16
CUSUM of Squares 5% Significance