Embed Size (px)
Citation preview
European Journal of Taxonomy 271: 1–19 ISSN 2118-9773 http://dx.doi.org/10.5852/ejt.2017.271 www.europeanjournaloftaxonomy.eu 2017 · Ohler A. & Nicolas V.
This work is licensed under a Creative Commons Attribution 3.0 License.
D N A L i b r a r y o f L i f e , r e s e a r c h a r t i c l e
urn:lsid:zoobank.org:pub:20E56A57-BACA-44F3-B310-5D5BC91DE040
1
Which frog’s legs do froggies eat? The use of DNA barcoding for identifi cation of deep frozen frog legs
(Dicroglossidae, Amphibia) commercialized in France
Annemarie OHLER 1,* & Violaine NICOLAS 21,2 Institut de Systématique, Évolution, Biodiversité, ISYEB_UMR7205_CNRS, MNHN, UPMC,
EPHE, Muséum national d’Histoire naturelle, Sorbonne Universités, Paris, France.
* Corresponding author: [email protected] Email: [email protected]
1 urn:lsid:zoobank.org:author:FC72F206-744C-4BA9-A609-1C604AC1AF6A2 urn:lsid:zoobank.org:author:FA1B1FA8-CB99-4CE8-B87A-F9B329E5DF07
Abstract. Several millions frogs captured in the wild in Indonesia are sold for food yearly in French supermarkets, as deep frozen frog legs. They are commercialized as Rana macrodon, but up to 15 look-alike species might also be concerned by this trade. From December 2012 to May 2013, we bought 209 specimens of deep frozen frog legs, and identifi ed them through a barcoding approach based on the 16S gene. Our results show that 206 out of the 209 specimens belong to Fejervarya cancrivora, two to Limnonectes macrodon and one to F. moodiei. Thus only 0.96 % of the frogs were correctly identifi ed. Unless misclassifi cation was intentional, it seems that Indonesian frog leg exporters are not able to discriminate between the species. The quasi absence of L. macrodon in our samples might be an indication of its rarity, confi rming that its natural populations are declining rapidly, in agreement with its “vulnerable” status according to the IUCN Red List. Our results show that the genetic and morphological diversity of the frogs in trade is much higher than the genetic and morphological diversity measured so far by scientifi c studies. These results underline the need for large scale studies to assess the status of wild populations.
Key words. Fejervarya cancrivora, Limnonectes macrodon, frog leg trade, barcoding, identifi cation, conservation, Red List.
Ohler A. & Nicolas V. 2017. What frog’s leg do froggies eat? The use of DNA barcoding for identifi cation of deep frozen frog legs (Dicroglossidae, Amphibia) commercialized in France. European Journal of Taxonomy 271: 1–19. http://dx.doi.org/10.5852/ejt.2017.271
IntroductionThe international traffi c of wild animals is considered an important threat to many animal species and is subject to international regulations. From 1998 to 2007 (10 years), 35 million animals and plants registered on the CITES lists have been exported from South-East Asian countries (Nijman 2010). For
European Journal of Taxonomy 271: 1–19 (2017)
2
the same period, between 180 million and 1 billion specimens of frogs were collected every year in the wild in Indonesia, and one eighth of these frogs were then exported to Europe (Kusrini 2005; Kusrini & Alfold 2006). For the ten-year period from 2000 to 2009, 46 400 tonnes of frog legs were imported into Europe, which corresponds to approximately 928 million to 2.3 billion frogs (Altherr et al. 2011).
The main European countries that import frog legs from Indonesia are France and Belgium (Kusrini & Alfold 2006; Altherr et al. 2011). The consumption of frogs is a tradition in French cuisine, causing the French to be called “froggies” by their neighbours, and in former days private people and restaurants would collect local frog specimens at certain periods of the year. However, in the 1970s deep freezing technology was developed, which allowed long term storage and large scale transport of frog legs, and large numbers of frogs were collected by commercial enterprises (Dubois 1983; Neveu 2004). This modifi ed the conditions of traditional local sustainable collection and drove some local frog populations to extinction. A wildlife protection law was voted in 1979 to protect the French frog species (Le Serrec 1988). The market turned to tropical countries, mainly Bangladesh, India and Indonesia, but India and Bangladesh quickly stopped frog exports: the main species concerned (Hoplobatrachus tigerinus (Daudin, 1802)) was put on CITES lists and very protective laws for the local anuran species were enacted. Thus, in 1987 Indonesia became the main exporter of frogs and more than 80% of European frog leg imports now come from this country (Altherr et al. 2011).
From 1973 to 1987, 830 to 2659 tonnes of frog legs were imported to France from Indonesia (Le Serrec 1988). This import was 5600 tonnes in 1992 (Kusrini & Alford 2006), 4600 tonnes per year in 2000–2009 (Altherr et al. 2011), and 2906 to 3275 tonnes per year in 2009–2011 (French Customs 2012). Frog legs from Indonesia are sold in supermarkets, particularly in those specialised in deep frozen food, or in Asian food markets.
Kusirini & Alford (2006) showed that three species are predominantly collected in Indonesia for consumption: the giant Javan frog Limnonectes macrodon (Duméril & Bibron, 1841), the crab-eating frog Fejervarya cancrivora (Gravenhorst, 1829) and the common grass frog Fejervarya limnocharis (Gravenhorst, 1829), the latter probably representing a mixture of F. limnocharis and F. iskandari Veith, Kosuch, Ohler & Dubois, 2001 (Djong 2007). About fi fteen look-alike species of large size might also be involved in collection for international trade (Altherr et al. 2011; Ohler unpubl. report), and they all belong to the genera Fejervarya Bolkay, 1915 and Limnonectes Fitzinger, 1843. Some of these species are common in the wild (e.g., F. cancrivora) while others are uncommon and listed as vulnerable in the IUCN Red List (e.g., L. macrodon, see Iskandar et al. 2004). Nonetheless, the European regulation no. 2065/2001 (Anonymous 2001) asks that the labels of fi shery products show the common and scientifi c names on pre-packed, non-transformed fresh products in order to assure traceability of specimens. In France, deep frozen frog legs are usually sold in the supermarkets in plastic bags of 500 g or 1 kg and bear labels with a Latin species name and their country of origin.
Monitoring and management of harvested populations require accurate species identifi cation; yet, high error rates are likely (Warkentin et al. 2009). Frog species can often be distinguished on various morphological characters such as body proportions, foot morphology and coloration pattern. Because exported frogs are skinned and the bodies cut off before packing, the characters allowing a morphological identifi cation cannot be observed on deep frozen legs and thus identifi cation is diffi cult (Warkentin et al. 2009). In this paper we explore the use of DNA barcoding as an identifi cation tool to identify deep frozen frog legs commercialized in France. DNA barcoding is a technique that uses a short DNA sequence from a standard locus as a species identifi cation tool (Hebert et al. 2003).
From December 2012 to May 2013, we bought 209 frogs in different supermarkets in France that were labeled as Rana macrodon (a variant of the valid name Limnonectes macrodon). These frogs were sold under three different brands but all come from the same importer. The samples were identifi ed through a barcoding approach based on the 16S gene. The 16S gene was previously recognized as one of the
OHLER A. & NICOLAS V., DNA barcoding for identifi cation of frog legs
3
most effective genes for molecular amphibian species identifi cation (Vences et al. 2005; Grosjean et al. 2015). Moreover, 16S reference sequences were available in the GenBank database for the 15 species potentially collected in Indonesia for commercialization.
A diminution in size of adult frogs due to overharvesting has been suggested (Iskandar, cited in Anonymous 2007). As snout-vent length and tibia length are highly correlated in frogs (Emerson 1978; Vidal-García et al. 2014), we used tibia length to obtain an estimate for the body size of commercialized frogs.
Material and methodsBiological samples, DNA extractions, PCR conditions, DNA sequencingIn this study, a total of 209 biological samples of commercialized frogs were bought in different French supermarkets from December 2012 to May 2013 (Table 1, Appendix). All these samples were sold as frozen frog legs in bags of 500 or 1000 g. They came from Indonesia and were sold as Rana macrodon. All these samples are stored in the collections of the National Museum of Natural History, Paris, France (Appendix).
DNA extracts were prepared from muscle tissue using the NucleoSpin Tissue Core kit (Macherey Nagel). 16S amplifi cation and sequencing were obtained using the primer pair 16SA-L (5’-CGCCTGTTTATCAAAAACAT-3’) and 16SB-H (5’-CCGGTCTGAACTCAGATCACGT-3’) (Palumbi et al. 1991). The thermal profi le consisted of 38 cycles at 94°C for 45 s, 55°C for 45 s and 72°C for 1 min. The amplicons obtained were about 550 bp long. PCR products were purifi ed and sequenced using Abi technology at the Genoscope (Evry, France). Sequences were checked by eye in CodonCode v. 5.1. The sequences obtained were deposited in the GenBank database under accession numbers KX055940−KX055957.
Molecular species identifi cation of samplesTo identify all our samples we fi rst determined the number of haplotypes in our dataset using TCS (Clement et al. 2000). Each haplotype was then assigned to a species through a nucleotide BLAST approach conducted in GenBank (http://blast.ncbi.nlm.nih.gov) and through a phylogenetic method (Bayesian tree).
BLAST species identifi cation was accomplished following three different criteria (Meier et al. 2006): Best Match (BM), Best Close Match (BCM) and All Species Barcode (ASB). The BM criterion assigns
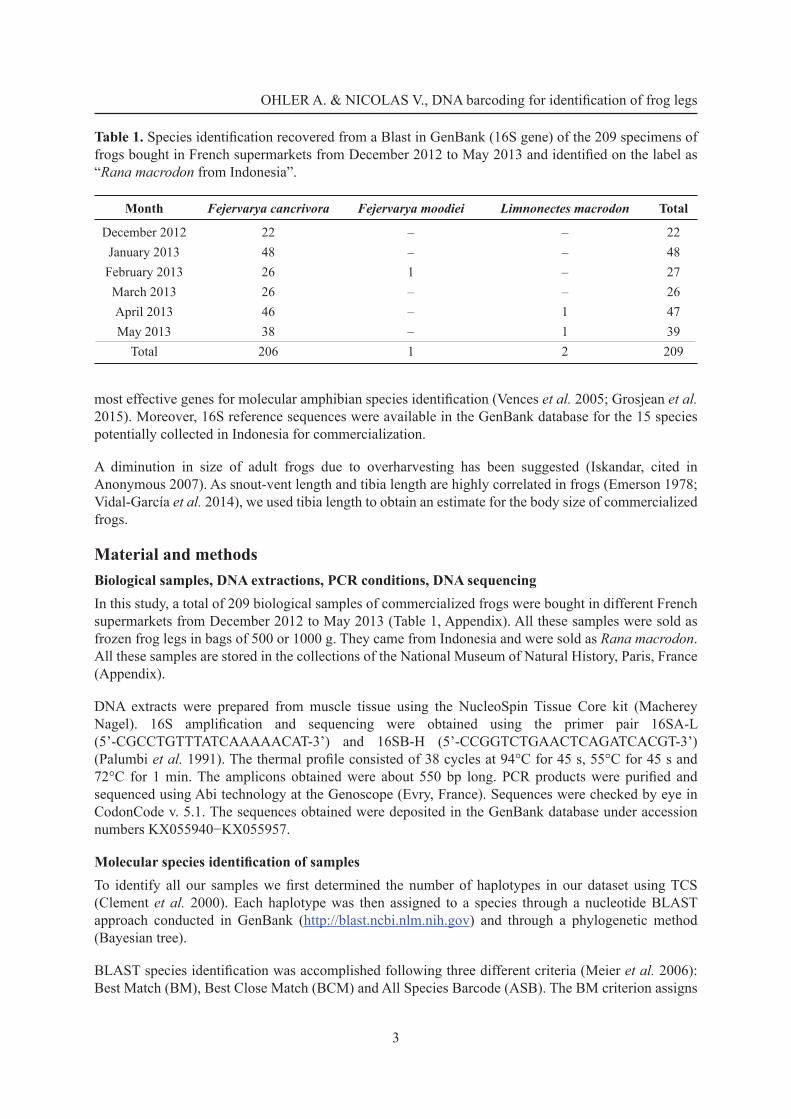
Table 1. Species identifi cation recovered from a Blast in GenBank (16S gene) of the 209 specimens of frogs bought in French supermarkets from December 2012 to May 2013 and identifi ed on the label as “Rana macrodon from Indonesia”.
Month Fejervarya cancrivora Fejervarya moodiei Limnonectes macrodon Total
December 2012 22 – – 22January 2013 48 – – 48February 2013 26 1 – 27March 2013 26 – – 26April 2013 46 – 1 47May 2013 38 – 1 39
Total 206 1 2 209
European Journal of Taxonomy 271: 1–19 (2017)
4
identifi cations to the closest match regardless of genetic distance. The BCM criterion is similar to BM, but the query is identifi ed by the closest match with a distance below a defi ned threshold. Finally, the ASB criterion is similar to the BCM by applying a threshold but it returns all the sequences within it. A query is identifi ed when all the matching sequences below the threshold are conspecifi c. For BCM and ASB, a query may provide ambiguous results if sequence divergences of different species are below the threshold (ASB) or sequences from different species are the closest match below the threshold (BCM).
A tree-based approach of species delimitation was also used. The tree-based criterion of reciprocal monophyly was used to defi ne species boundaries. In our analysis we included: 1) all the haplotypes recovered in our deep frozen frog legs, 2) all species of the genera Fejervarya and Limnonectes known from Indonesia (except Limnonectes dammermani (Mertens, 1929), L. kenepaiensis (Inger, 1966), L. rhacodus (Inger, Boedi & Taufi k, 1996), L. sinuatodorsalis Matsui, 2015, L. timorensis (Smith, 1927) and Fejervarya schlueteri (Werner, 1893) for which no 16S gene sequences are currently available in GenBank), and 3) one sequence of Hoplobatrachus rugulosus (Wiegmann, 1834) and one sequence of Occidozyga laevis (Günther, 1858) included as outgroups. Depending on 16S gene sequence availability in GenBank, we included one to four individuals per species in our analysis. Sequences were aligned with ClustalW (Thompson et al. 1994). In order to minimize the number of missing data we kept 553 sites in our fi nal analyses. Evolutionary relationships among sequences were estimated by conducting Bayesian Markov chain Monte Carlo phylogenetic analyses (MCMC) with MrBayes v. 3.1.2 (Huelsenbeck & Ronquist 2001). MrModeltest v. 3.04 (Nylander 2004) was used to evaluate the fi t of 24 nested models of nucleotide substitution to the data. According to the Akaike information criterion, MrModeltest recommended the GTR + I + G model. This model was used in the Bayesian analysis. Three heated chains and one single cold chain were employed, and runs were initiated with random trees. Two independent MCMC runs were conducted with fi ve million generations per run; trees (and parameters) were sampled every 100 generations. Stationarity was assessed by examining the average standard deviation of split frequencies and the Potential Scale Reduction Factor (Ronquist et al. 2005). For each run, the fi rst 25% of sampled trees were discarded as burn-in.
Geographical origin of commercialized frogsFor the species Fejervarya cancrivora, 16S sequences of specimens from different geographical regions are available in GenBank (Table 2). We conducted a phylogeographic analysis to see if there is any phylogeographic signal within this species and whether the geographical origin of the commercialized frogs could thus be determined based on 16S gene sequences. To this aim, 16S gene sequences of F. cancrivora for which the geographical origin was known were retrieved from GenBank. To minimize the number of missing data, 257 sequences of 494 bp were retained in fi nal analyses (206 sequences of commercialized frogs + 51 specimens from GenBank). Relationships among haplotypes were inferred by constructing a network using the median-joining method available in Network v. 5.0.0.0 (Bandelt et al. 1999).
Morphometry Snout vent length (SVL) and tibia length (TL) of Fejervarya cancrivora were obtained from Boulenger (1920) and from measurements of adult specimens from Borneo, Java and Sumatra stored at the Field Museum of Natural History, Chicago (FMNH 256671, 256688, 256690, 256692–97, 256709–14). Tibia length of frog legs was measured with a slide caliper (Appendix). The Pearson correlation coeffi cient showed a highly signifi cant correlation between snout vent length and tibia length (r = 0.973; p < 0.001***). For all specimens measured we calculated the ratio r = TL/SVL. We used R = mean of all r to estimate body size depending on TL. We obtained the value R = 0.48177; n = 28; standard deviation = 0.197. Thus, we could use the following formula to calculate an estimate for snout vent length for the frog legs: SVL = TL / 0.48177.
OHLER A. & NICOLAS V., DNA barcoding for identifi cation of frog legs
5
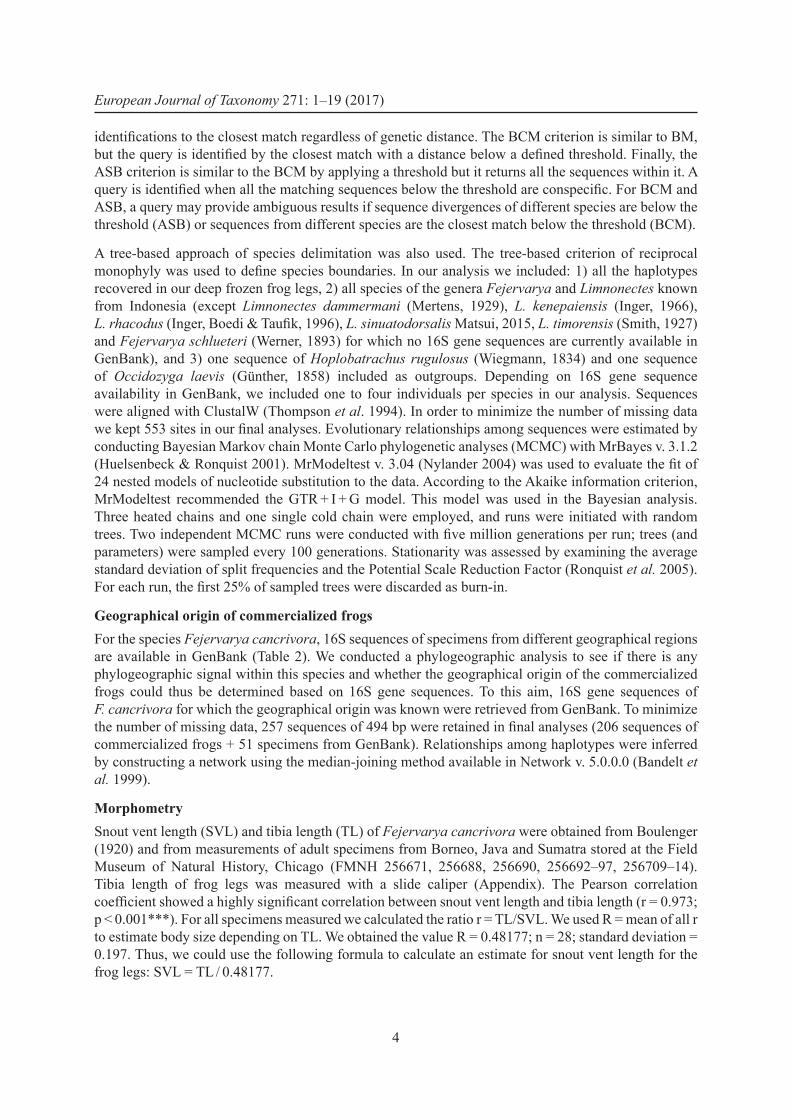
Table 2. List of specimens of Fejervarya cancrivora used in our phylogeographic analysis.
GenBank no. Source Country Island Locality No. of individuals
KX055940 this study Indonesia – – 1KX055941 this study Indonesia – – 54KX055942 this study Indonesia – – 7KX055943 this study Indonesia – – 66KX055944 this study Indonesia – – 1KX055945 this study Indonesia – – 6KX055946 this study Indonesia – – 1KX055947 this study Indonesia – – 5KX055948 this study Indonesia – – 1KX055949 this study Indonesia – – 8KX055950 this study Indonesia – – 49KX055951 this study Indonesia – – 1KX055952 this study Indonesia – – 1KX055953 this study Indonesia – – 1KX055954 this study Indonesia – – 1KX055955 this study Indonesia – – 3AB570273 Kurniawan et al. 2014 Indonesia Bali Denpasar 6AB570274 Kurniawan et al. 2014 Indonesia Bali Denpasar 1AB570275 Kurniawan et al. 2014 Indonesia Bali Denpasar 1AB570276 Kurniawan et al. 2014 Indonesia Bali Denpasar 1AB570277 Kurniawan et al. 2014 Indonesia Bali Denpasar 1AB444684 Kurniawan et al. 2010 Indonesia Bangka Tempilang 1AB570273 Kurniawan et al. 2014 Indonesia Java Banyumas 1AB570273 Kurniawan et al. 2014 Indonesia Java Banyuwangi 1AB444684 Kurniawan et al. 2010 Indonesia Java Bogor 1AB570273 Kurniawan et al. 2014 Indonesia Java Cilacap 9AB570273 Kurniawan et al. 2014 Indonesia Java Kediri 2AB570273 Kurniawan et al. 2014 Indonesia Java Malang 2AB444684 Kurniawan et al. 2010 Indonesia Sumatra Padang 1AB570273 Kurniawan et al. 2010 Indonesia Java Pelabuhan ratu 1AB570273 Kurniawan et al. 2014 Indonesia Kalimantan Pontianak 6AB570273 Kurniawan et al. 2014 Indonesia Sumatra Jamb 1AB444684 Kurniawan et al. 2014 Indonesia Sumatra Jamb 1AB570273 Kurniawan et al. 2014 Indonesia Sumatra Lampung 1AB444684 Kurniawan et al. 2010 Indonesia Sumatra Langkat 3AB444685 Kurniawan et al. 2010 Indonesia Sumatra Padang 1AB570273 Kurniawan et al. 2014 Indonesia Sumatra Palembang 1AB444685 Kurniawan et al. 2010 Indonesia Sumatra Panti 1AB444685 Kurniawan et al. 2010 Indonesia Sumatra Payakumbuh 1AB444684 Kurniawan et al. 2010 Malaysia Selangor Selangor 1EU435279 Kung et al. unpubl. Taiwan Donggang Donggang 1EU435280 Kung et al. unpubl. Taiwan Fangliao Fangliao 1
EU365387 Hsu et al. unpubl. Taiwan Jiadong Jiadong 3EU365389 Hsu et al. unpubl. Taiwan Sinpi Sinpi 1
European Journal of Taxonomy 271: 1–19 (2017)
6
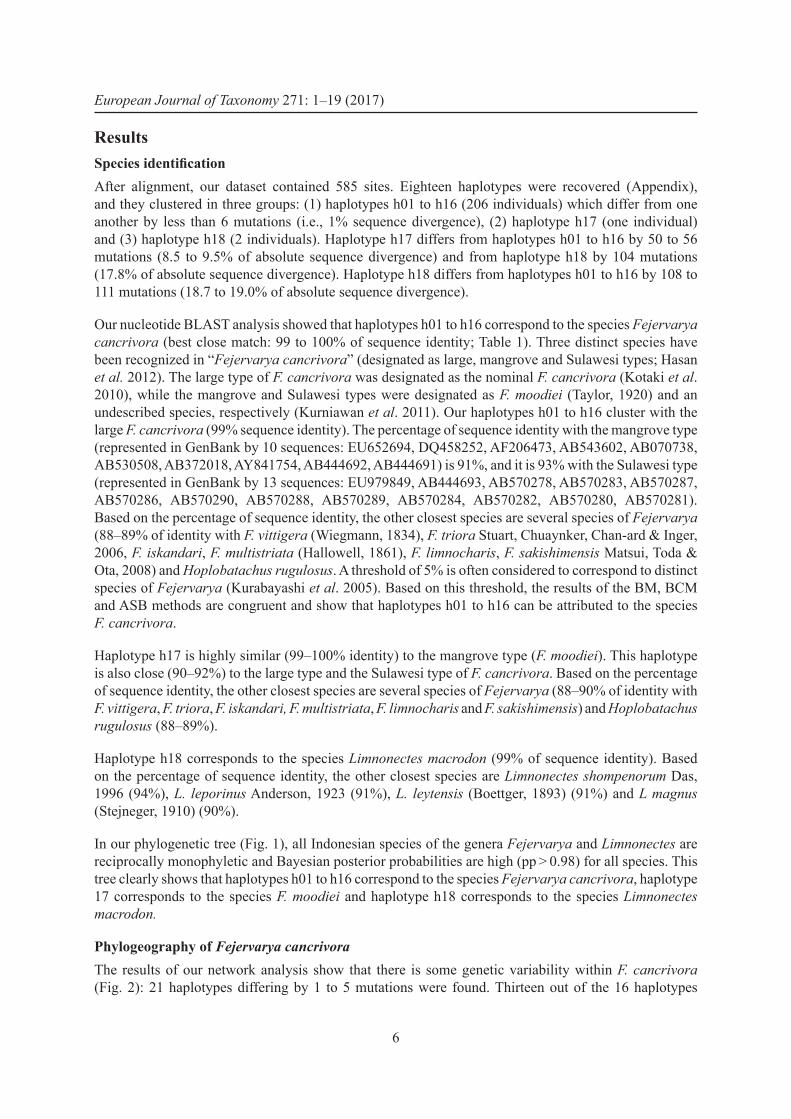
ResultsSpecies identifi cationAfter alignment, our dataset contained 585 sites. Eighteen haplotypes were recovered (Appendix), and they clustered in three groups: (1) haplotypes h01 to h16 (206 individuals) which differ from one another by less than 6 mutations (i.e., 1% sequence divergence), (2) haplotype h17 (one individual) and (3) haplotype h18 (2 individuals). Haplotype h17 differs from haplotypes h01 to h16 by 50 to 56 mutations (8.5 to 9.5% of absolute sequence divergence) and from haplotype h18 by 104 mutations (17.8% of absolute sequence divergence). Haplotype h18 differs from haplotypes h01 to h16 by 108 to 111 mutations (18.7 to 19.0% of absolute sequence divergence).
Our nucleotide BLAST analysis showed that haplotypes h01 to h16 correspond to the species Fejervarya cancrivora (best close match: 99 to 100% of sequence identity; Table 1). Three distinct species have been recognized in “Fejervarya cancrivora” (designated as large, mangrove and Sulawesi types; Hasan et al. 2012). The large type of F. cancrivora was designated as the nominal F. cancrivora (Kotaki et al. 2010), while the mangrove and Sulawesi types were designated as F. moodiei (Taylor, 1920) and an undescribed species, respectively (Kurniawan et al. 2011). Our haplotypes h01 to h16 cluster with the large F. cancrivora (99% sequence identity). The percentage of sequence identity with the mangrove type (represented in GenBank by 10 sequences: EU652694, DQ458252, AF206473, AB543602, AB070738, AB530508, AB372018, AY841754, AB444692, AB444691) is 91%, and it is 93% with the Sulawesi type (represented in GenBank by 13 sequences: EU979849, AB444693, AB570278, AB570283, AB570287, AB570286, AB570290, AB570288, AB570289, AB570284, AB570282, AB570280, AB570281). Based on the percentage of sequence identity, the other closest species are several species of Fejervarya (88–89% of identity with F. vittigera (Wiegmann, 1834), F. triora Stuart, Chuaynker, Chan-ard & Inger, 2006, F. iskandari, F. multistriata (Hallowell, 1861), F. limnocharis, F. sakishimensis Matsui, Toda & Ota, 2008) and Hoplobatachus rugulosus. A threshold of 5% is often considered to correspond to distinct species of Fejervarya (Kurabayashi et al. 2005). Based on this threshold, the results of the BM, BCM and ASB methods are congruent and show that haplotypes h01 to h16 can be attributed to the species F. cancrivora.
Haplotype h17 is highly similar (99–100% identity) to the mangrove type (F. moodiei). This haplotype is also close (90–92%) to the large type and the Sulawesi type of F. cancrivora. Based on the percentage of sequence identity, the other closest species are several species of Fejervarya (88–90% of identity with F. vittigera, F. triora, F. iskandari, F. multistriata, F. limnocharis and F. sakishimensis) and Hoplobatachus rugulosus (88–89%).
Haplotype h18 corresponds to the species Limnonectes macrodon (99% of sequence identity). Based on the percentage of sequence identity, the other closest species are Limnonectes shompenorum Das, 1996 (94%), L. leporinus Anderson, 1923 (91%), L. leytensis (Boettger, 1893) (91%) and L magnus (Stejneger, 1910) (90%).
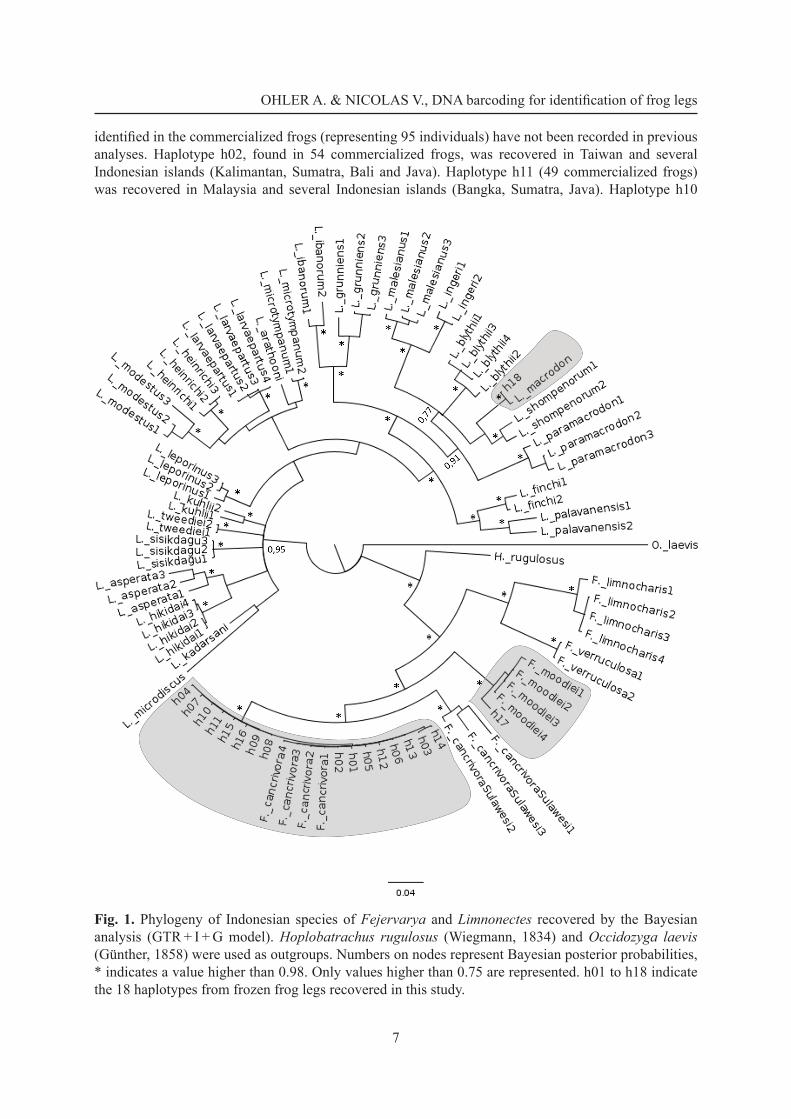
In our phylogenetic tree (Fig. 1), all Indonesian species of the genera Fejervarya and Limnonectes are reciprocally monophyletic and Bayesian posterior probabilities are high (pp > 0.98) for all species. This tree clearly shows that haplotypes h01 to h16 correspond to the species Fejervarya cancrivora, haplotype 17 corresponds to the species F. moodiei and haplotype h18 corresponds to the species Limnonectes macrodon.
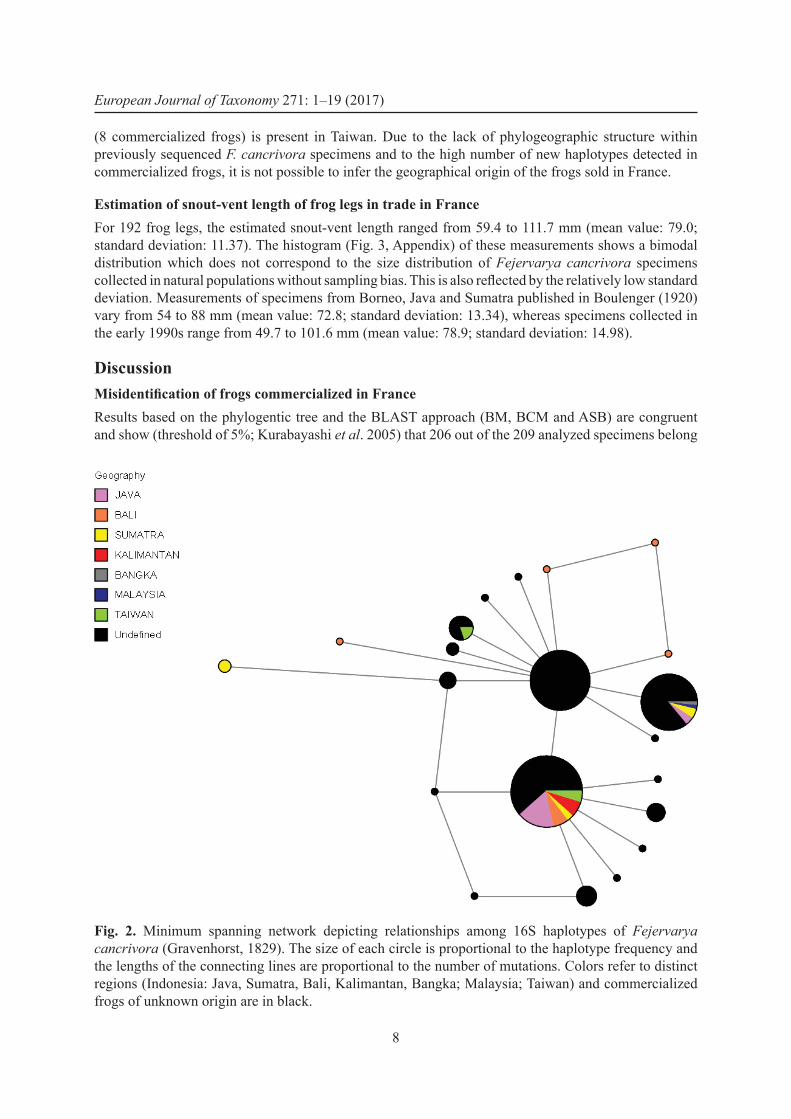
Phylogeography of Fejervarya cancrivoraThe results of our network analysis show that there is some genetic variability within F. cancrivora (Fig. 2): 21 haplotypes differing by 1 to 5 mutations were found. Thirteen out of the 16 haplotypes
OHLER A. & NICOLAS V., DNA barcoding for identifi cation of frog legs
7
identifi ed in the commercialized frogs (representing 95 individuals) have not been recorded in previous analyses. Haplotype h02, found in 54 commercialized frogs, was recovered in Taiwan and several Indonesian islands (Kalimantan, Sumatra, Bali and Java). Haplotype h11 (49 commercialized frogs) was recovered in Malaysia and several Indonesian islands (Bangka, Sumatra, Java). Haplotype h10
Fig. 1. Phylogeny of Indonesian species of Fejervarya and Limnonectes recovered by the Bayesian analysis (GTR + I + G model). Hoplobatrachus rugulosus (Wiegmann, 1834) and Occidozyga laevis (Günther, 1858) were used as outgroups. Numbers on nodes represent Bayesian posterior probabilities, * indicates a value higher than 0.98. Only values higher than 0.75 are represented. h01 to h18 indicate the 18 haplotypes from frozen frog legs recovered in this study.
European Journal of Taxonomy 271: 1–19 (2017)
8
(8 commercialized frogs) is present in Taiwan. Due to the lack of phylogeographic structure within previously sequenced F. cancrivora specimens and to the high number of new haplotypes detected in commercialized frogs, it is not possible to infer the geographical origin of the frogs sold in France.
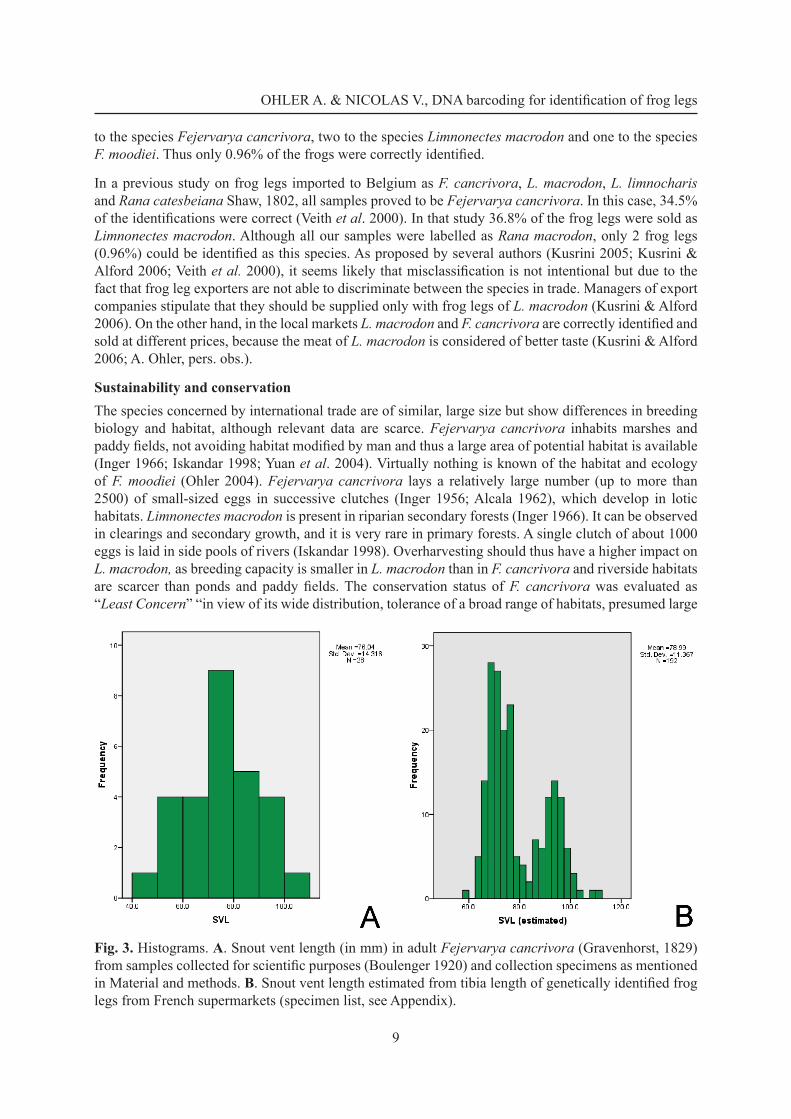
Estimation of snout-vent length of frog legs in trade in FranceFor 192 frog legs, the estimated snout-vent length ranged from 59.4 to 111.7 mm (mean value: 79.0; standard deviation: 11.37). The histogram (Fig. 3, Appendix) of these measurements shows a bimodal distribution which does not correspond to the size distribution of Fejervarya cancrivora specimens collected in natural populations without sampling bias. This is also refl ected by the relatively low standard deviation. Measurements of specimens from Borneo, Java and Sumatra published in Boulenger (1920) vary from 54 to 88 mm (mean value: 72.8; standard deviation: 13.34), whereas specimens collected in the early 1990s range from 49.7 to 101.6 mm (mean value: 78.9; standard deviation: 14.98).
DiscussionMisidentifi cation of frogs commercialized in FranceResults based on the phylogentic tree and the BLAST approach (BM, BCM and ASB) are congruent and show (threshold of 5%; Kurabayashi et al. 2005) that 206 out of the 209 analyzed specimens belong
Fig. 2. Minimum spanning network depicting relationships among 16S haplotypes of Fejervarya cancrivora (Gravenhorst, 1829). The size of each circle is proportional to the haplotype frequency and the lengths of the connecting lines are proportional to the number of mutations. Colors refer to distinct regions (Indonesia: Java, Sumatra, Bali, Kalimantan, Bangka; Malaysia; Taiwan) and commercialized frogs of unknown origin are in black.
OHLER A. & NICOLAS V., DNA barcoding for identifi cation of frog legs
9
to the species Fejervarya cancrivora, two to the species Limnonectes macrodon and one to the species F. moodiei. Thus only 0.96% of the frogs were correctly identifi ed.
In a previous study on frog legs imported to Belgium as F. cancrivora, L. macrodon, L. limnocharis and Rana catesbeiana Shaw, 1802, all samples proved to be Fejervarya cancrivora. In this case, 34.5% of the identifi cations were correct (Veith et al. 2000). In that study 36.8% of the frog legs were sold as Limnonectes macrodon. Although all our samples were labelled as Rana macrodon, only 2 frog legs (0.96%) could be identifi ed as this species. As proposed by several authors (Kusrini 2005; Kusrini & Alford 2006; Veith et al. 2000), it seems likely that misclassifi cation is not intentional but due to the fact that frog leg exporters are not able to discriminate between the species in trade. Managers of export companies stipulate that they should be supplied only with frog legs of L. macrodon (Kusrini & Alford 2006). On the other hand, in the local markets L. macrodon and F. cancrivora are correctly identifi ed and sold at different prices, because the meat of L. macrodon is considered of better taste (Kusrini & Alford 2006; A. Ohler, pers. obs.).
Sustainability and conservationThe species concerned by international trade are of similar, large size but show differences in breeding biology and habitat, although relevant data are scarce. Fejervarya cancrivora inhabits marshes and paddy fi elds, not avoiding habitat modifi ed by man and thus a large area of potential habitat is available (Inger 1966; Iskandar 1998; Yuan et al. 2004). Virtually nothing is known of the habitat and ecology of F. moodiei (Ohler 2004). Fejervarya cancrivora lays a relatively large number (up to more than 2500) of small-sized eggs in successive clutches (Inger 1956; Alcala 1962), which develop in lotic habitats. Limnonectes macrodon is present in riparian secondary forests (Inger 1966). It can be observed in clearings and secondary growth, and it is very rare in primary forests. A single clutch of about 1000 eggs is laid in side pools of rivers (Iskandar 1998). Overharvesting should thus have a higher impact on L. macrodon, as breeding capacity is smaller in L. macrodon than in F. cancrivora and riverside habitats are scarcer than ponds and paddy fi elds. The conservation status of F. cancrivora was evaluated as “Least Concern” “in view of its wide distribution, tolerance of a broad range of habitats, presumed large
Fig. 3. Histograms. A. Snout vent length (in mm) in adult Fejervarya cancrivora (Gravenhorst, 1829) from samples collected for scientifi c purposes (Boulenger 1920) and collection specimens as mentioned in Material and methods. B. Snout vent length estimated from tibia length of genetically identifi ed frog legs from French supermarkets (specimen list, see Appendix).
European Journal of Taxonomy 271: 1–19 (2017)
10
population, and because it is unlikely to be declining to qualify for listing in a more threatened category” (Yuan et al. 2004). Fejervarya moodiei is listed as “Data defi cient in view of continuing doubts as to its extent of occurrence, status and ecological requirements” (Ohler 2004). Limnonectes macrodon is listed as “Vulnerable because it depends on streams in lowland forest, and so its Area of Occupancy is probably less than 2000 km2, its distribution is severely fragmented, and there is continuing decline in the extent and quality of its habitat, the number of locations, and the number of mature individuals” (Iskandar et al. 2004). These evaluations are not based on population studies that might measure the impact of the heavy harvesting ongoing for decades. However, the quasi absence of L. macrodon in our samples might be an indication of its rarity in the fi eld and the fact that its natural populations are declining rapidly.
In the 1990s, researchers already considered that large-sized frogs had completely disappeared in many parts of Java and Sumatra (Manthey & Grossmann 1997; Inger & Stuebing 1997). In 2006, 18.8% of the frogs captured by harvesters in West Java and East Java belonged to the species L. macrodon (Kuzrini & Alford 2006). In 2012–2013, only 0.96% of the samples from trade sold in France belonged to this species.
A diminution in size of adult frogs due to overharvesting has been suggested (Iskandar, cited in Anonymous 2007). The estimated size of the frogs from deep frozen specimens of F. cancrivora is not smaller than specimens collected 20 or a hundred years ago. The frogs measured in Boulenger (1920) are slightly smaller in size than the frogs collected in the early 1990s and in 2012–2013. However, the body size of the frogs in trade is clearly biased. After collection, frogs are separated into size categories and only large specimens are chosen for export (Kusrini & Alford 2006). In samples studied by Church (1960) and Kusrini & Alford (2006) that had been collected for trade, very large-sized frogs were present (maximum size of 132 mm for 1325 frogs, and of 162 mm for 555 frogs, respectively). In the samples bought in the supermarkets in France imported by the same company, two size classes of frogs are present, but very large frogs have not been observed in our sample. The absence of small-sized frogs is due to the sorting out of larger specimens for export (Kusrini & Alford 2006). Nevertheless, the presence of numerous large frogs means that such large specimens can be found in the fi eld. Based on our genetic results, we could not allocate our samples to precise geographic origins. The absence of an effect of overharvesting on body size can only be studied when the precise geographic origin of specimens is known, because body size varies geographically (Kurniawan et al. 2011). The specimens studied in the present work may well come from newly harvested populations. In fact, the presence of F. moodiei in our samples, a species which has a known range outside Java and Sumatra, a range that includes the Philippines, the northern coasts of the Gulf of Thailand, Bangladesh and Orissa (Kurniawan et al. 2010), indicates that the specimens studied here may have come from other islands than Java and south-eastern Sumatra.
“At present, nothing is known about the impact of extensive frog harvesting on Indonesian frog populations and agricultures.” This phrase of Veith et al. (2000) can be cited as such, as there has been no change in the last 15 years. There are still no studies on the effects of frog harvesting on natural populations. Our results show that the genetic and morphological diversity of the frogs in trade is much higher than the genetic and morphological diversity measured so far by scientifi c studies (Kurniawan et al. 2010, 2011). These results underline the need for large-scale studies on the taxonomy, population structure, reproductive data and ecology of the species concerned in international trade. In 2000, Veith et al. concluded that the development of a “quick and cheap test for management authorities” was necessary to monitor the international trade in frog legs. Such a test is already available through DNA sequencing, and the price is decreasing rapidly with the development of next generation sequencing techniques. The lack of any progress in the development of identifi cation tools and assessing the status of wild populations is not due to an absence of convenient methodology but it refl ects the fact that conservation is focused on fl agship species, such as tigers and pandas, or species that qualify for rarity.
OHLER A. & NICOLAS V., DNA barcoding for identifi cation of frog legs
11
The edible frogs of Indonesia, although billions of individuals are killed annually, are the scarcely visible part of the bulk of species that are disappearing.
AcknowledgementsThis project was supported by the network ‘Bibliothèque du Vivant’ funded by the CNRS, the Muséum national d’Histoire naturelle (MNHN), the Institut national de Recherche agronomique (INRA) and the Commissariat à l'Energie atomique (CEA, Genoscope). This work was also supported by the ‘Action Transversale du Muséum: Taxonomie moléculaire, DNA Barcode & gestion durable des collections’ and the ‘Service de Systématique moléculaire’ of the MNHN (UMS 2700, Paris, France). We are grateful to Tesceline Tremaud and Dario Zuccon for their help in molecular lab work. The Action thématique du Muséum (ATM) ‘Biodiversité actuelle et fossile. Crises, stress, restaurations et panchronisme: le message systématique’ funded the launching of this project, in particular travel costs. Alain Dubois made useful comments on the manuscript.
ReferencesAlcala A.C. 1962. Breeding behaviour and early development of frogs of Negros, Philippine Islands. Copeia 1962: 679–726.Altherr S., Goyenechea A. & Schubert D. 2011. Canapés to Extinction—the International Trade in Frogs’ Legs and its Ecological Impact. Pro Wildlife, Defenders of Wildlife and Animal Welfare Institute, Munich and Washington DC.Anonymous. 2001. Commission Regulation (EC) No. 2065/2001 of 22 October 2001 Laying Down Detailed Rules for the Application of Council Regulation (EC) No. 104/2000 as Regards Informing Consumers about Fishery and Aquaculture Products. Available from http://eur-lex.europa.eu/legal-content/EN/ALL/?uri=CELEX%3A32001R2065 [accessed 13 Jan. 2016].Anonymous. 2007. Review of Non-CITES Amphibia Species that are Known or Likely to be in International Trade. Version edited for public release. Prepared for the European Commission Directorate General E – Environment ENV.E.2. – Development and Environment. UNEP World Conservation Monitoring Centre, Cambridge.Bandelt H. J., Forster P. & Rohl A. 1999. Median-joining networks for inferring intraspecifi c phylogenies. Molecular Biology and Evolution 16: 37–48. http://dx.doi.org/10.1093/oxfordjournals.molbev.a026036Boulenger G.A. 1920. A monograph of the South Asian, Papuan, Melanesian and Australian frogs of the genus Rana. Records of the Indian Museum 20: 1–226. Church G. 1960. The effects of seasonal and lunar changes on the breeding pattern of the edible Javanese frog, Rana cancrivora Gravenhorst. Treubia 25: 215–233.Clement M., Posada D. & Crandall K.A. 2000. TCS: a computer program to estimate gene genealogies. Molecular Ecology 9: 1657–1659. http://dx.doi.org/10.1046/j.1365-294x.2000.01020.xDubois A. 1983. A propos de cuisses de grenouilles. Protection des amphibiens, arrêtés ministériels, projets d’élevage, gestion des populations naturelles, enquêtes de répartition, production, importations et consommation: une équation diffi cile à résoudre. Les propositions de la Société Batrachologique de France. Alytes 2 (3): 69–111.Emerson S.B. 1978. Allometry and jumping in frogs – helping twain to meet. Evolution 32: 551–564. French Customs. 2012. Données d’importations CAF et d’exportation FAB de cuisses de grenouilles, fraîches, réfrigéres ou congélées. Available from http://www.insee.fr/ [accessed 16 Jan. 2012].Grosjean S., Ohler A., Chuaynkern Y., Cruaud C. & Hassanin A. 2015. Improving biodiversity assessment of anuran amphibians using DNA barcoding of tadpoles. Case studies from Southeast Asia. Comptes Rendus Biologies 338: 351–361. http://dx.doi.org/10.1016/j.crvi.2015.03.015
European Journal of Taxonomy 271: 1–19 (2017)
12
Hasan M., Islam M.M., Khan M.R., Alam M.S., Kurabayashi A., Igawa T., Kuramoto M. & Sumida M. 2012. Cryptic anuran biodiversity in Bangladesh revealed by mitochondrial 16S rRNA gene sequences. Zoological Science 29: 162–172. http://dx.doi.org/10.2108/zsj.29.162Hebert P.D., Cywinska A., Ball S.L. & deWaard J.R. 2003. Biological identifi cations through DNA barcodes. Proceedings of the Royal Society London B 270: 313–321. http://dx.doi.org/10.1098/rspb.2002.2218Huelsenbeck J.P. & Ronquist F. 2001. MrBayes: Bayesian inference of phylogenetic trees. Bioinformatics 17: 754–755. http://dx.doi.org/10.1093/bioinformatics/17.8.754Inger R.F. 1966. The systematics and zoogeography of the Amphibia of Borneo. Fieldiana, Zoology 52: 1–402. Inger R.F. & Stuebing R.B. 1997. A Field Guide to the Frogs of Borneo. Natural History Publications (Borneo) Limited, Kota Kinabalu, Malaysia.Iskandar D.T. 1998. The Amphibians of Java and Bali. Research and Development Centre for Biology – LIPI, Bogor, Indonesia.Iskandar D., Mumpuni, Das I., Shrestha T.K. & Ohler A. 2004. Limnonectes macrodon. The IUCN Red List of Threatened Species 2004: e.T58351A11770829. Available from http://dx.doi.org/10.2305/IUCN.UK.2004.RLTS.T58351A11770829.en [accessed 22 Jan. 2016].Kotaki M., Kurabayashi A., Matsui M., Khonsue W., Djong T.H., Tandon M. & Sumida M. 2008. Genetic divergences and phylogenetic relationships among the Fejervarya limnocharis complex in Thailand and neighboring countries revealed by mitochondrial and nuclear genes. Zoological Science 25: 381–390. http://dx.doi.org/10.2108/zsj.25.381Kurabayashi A., Kuramoto M., Joshy H. & Sumida M. 2005. Molecular phylogeny of the ranid frogs from southwest India based on the mitochondrial ribosomal RNA gene sequences. Zoological Science 22: 525–534. http://dx.doi.org/10.2108/zsj.22.525Kurniawan N., Islam M.M., Djong T.H., Igawa T., Daicus M.B., Yong H.S., Wanichanon R., Khan M.M., Iskandar D.T., Nishioka M. & Sumida M. 2010. Genetic divergence and evolutionary relationship in Fejervarya cancrivora inferred from allozyme and mtDNA sequence analyses. Zoological Science 27: 222–233. http://dx.doi.org/10.2108/zsj.27.222Kurniawan N., Djong T.H., Islam M.M., Nishizawa T., Belabut D.M., Sen Y.H., Wanichanon R., Yasir I. & Sumida M. 2011. Taxonomic status of three types of Fejervarya cancrivora from Indonesia and other Asian countries based on morphological observations and crossing experiments. Zoological Science 28: 12–24. http://dx.doi.org/10.2108/zsj.28.12Kurniawan N., Djong T.H., Maideliza T., Hamidy A., Hasan M., Igawa T. & Sumida M. 2014. Genetic divergence and geographic distribution of frogs in the genus Fejervarya from Indonesia inferred from mitochondrial 16S rRNA gene analysis. Treubia 41: 1–16.Kusrini M.D. 2005. Edible Frog Harvesting in Indonesia: Evaluating its Impact and Ecological Context. PhD Thesis in Zoology and Tropical Ecology. James Cook University, School of Tropical Biology, Townsville, Australia.Kusrini M.D. & Alford R.A. 2006. Indonesia’s exports of frog’s legs. Traffi c Bulletin 21: 13–20.Le Serrec G. 1988. France’s frog consumption. Traffi c Bulletin 10: 17.Manthey U. & Grossmann W. 1997. Die Amphibien und Reptilien Südostasiens. Natur und Tier-Verlag, Münster, Germany.Meier R., Shiyang K., Vaidya G. & Ng P.K. 2006. DNA barcoding and taxonomy in Diptera: a tale of high intraspecifi c variability and low identifi cation success. Systematic Biology 55: 715–728. http://dx.doi.org/10.1080/10635150600969864
OHLER A. & NICOLAS V., DNA barcoding for identifi cation of frog legs
13
Neveu A. 2004. La raniculture est-elle une alternative à la récolte? Etat actuel en France. INRA Production Animale 17: 167–175. Nijman V. 2010. An overview of international wildlife trade from Southeast Asia. Biodiversity and Conservation 19: 1101–1114. http://dx.doi.org/10.1007/s10531-009-9758-4Nylander J.A. 2004. MrModeltest v. 2. Program distributed by the author. Evolutionary Biology Centre, Uppsala University, Uppsala, Sweden.Palumbi S.R., Martin A., Romano S., McMillan W.O., Stice L. & Grabowski G. 1991. The Simple Fool’s Guide to PCR. University of Hawaii Press, Honolulu.Phelps J., Webb E.L., Bickford D., Nijman V. & Sodhi N.S. 2010. Boosting CITES. Science 330: 1752–1753.Ronquist F., Huelsenbeck J.P. & Van der Mark P. 2005. MrBayes v. 3.1 Manual. Available from http://cs.mcgill.ca/~birch/doc/mrbayes/mb3.1_manual.pdf [accessed 1 Jan. 2016].Thompson J.D., Higgins D.G. & Gibson T.J. 1994. Clustal W: improving the sensitivity of progressive multiple sequence alignment through sequence weighting, position-specifi c gap penalties and weight matrix choice. Nucleic Acids Research 22: 4673–4680. http://dx.doi.org/10.1093/nar/22.22.4673Veith M., Kosuch J., Feldmann R. Martens H. & Seitz A. 2000. A test for correct species declaration of frog legs imports from Indonesia into the European Union. Biodiversity and Conservation 9: 333–341. http://dx.doi.org/10.1023/A:1008906918236Vences M., Thomas M., van der Meijden A., Chiari Y. & Vieites D.R. 2005. Comparative performance of the 16S rRNA gene in DNA barcoding of amphibians. Frontiers in Zoology 2 (5): 1–12. http://dx.doi.org/10.1186/1742-9994-2-5Vidal-Garcia M., Byrne P.G., Roberts J.D. & Keogh J.S. 2014. The role of phylogeny and ecology in shaping morphology in 21 genera and 127 species of Australo-Papuan myobatrachid frogs. Journal of Evolutionary Biology 27: 181–192. http://dx.doi.org/10.1111/jeb.12292Warkentin I.G., Bickford D., Sodhi N.S. & Bradshaw C.J.A. 2009. Eating frogs to extinction. Conservation Biology 23: 1056–1059. http://dx.doi.org/10.1111/j.1523-1739.2008.01165.xYuan Z., Zhao E., Shi H., Diesmos A., Alcala A., Brown R., Afuang L., Gee G., Sukumaran J., Yaakob N., Leong T.M., Chuaynkern Y., Thirakhupt K., Das I., Iskandar D., Mumpuni & Inger R. 2004. Fejervarya cancrivora. The IUCN Red List of Threatened Species 2004: e.T58269A11759436. http://dx.doi.org/10.2305/IUCN.UK.2004.RLTS.T58269A11759436.en
Manuscript received: 30 January 2016Manuscript accepted: 22 July 2016Published on: 6 February 2017Guest editors: Line Le Gall, Frédéric Delsuc, Stéphane Hourdez, Guillaume Lecointre and Jean-Yves RasplusDesk editor: Danny Eibye-Jacobsen
Printed versions of all papers are also deposited in the libraries of the institutes that are members of the EJT consortium: Muséum national d’Histoire naturelle, Paris, France; Botanic Garden Meise, Belgium; Royal Museum for Central Africa, Tervuren, Belgium; Natural History Museum, London, United Kingdom; Royal Belgian Institute of Natural Sciences, Brussels, Belgium; Natural History Museum of Denmark, Copenhagen, Denmark; Naturalis Biodiversity Center, Leiden, the Netherlands.
European Journal of Taxonomy 271: 1–19 (2017)
14
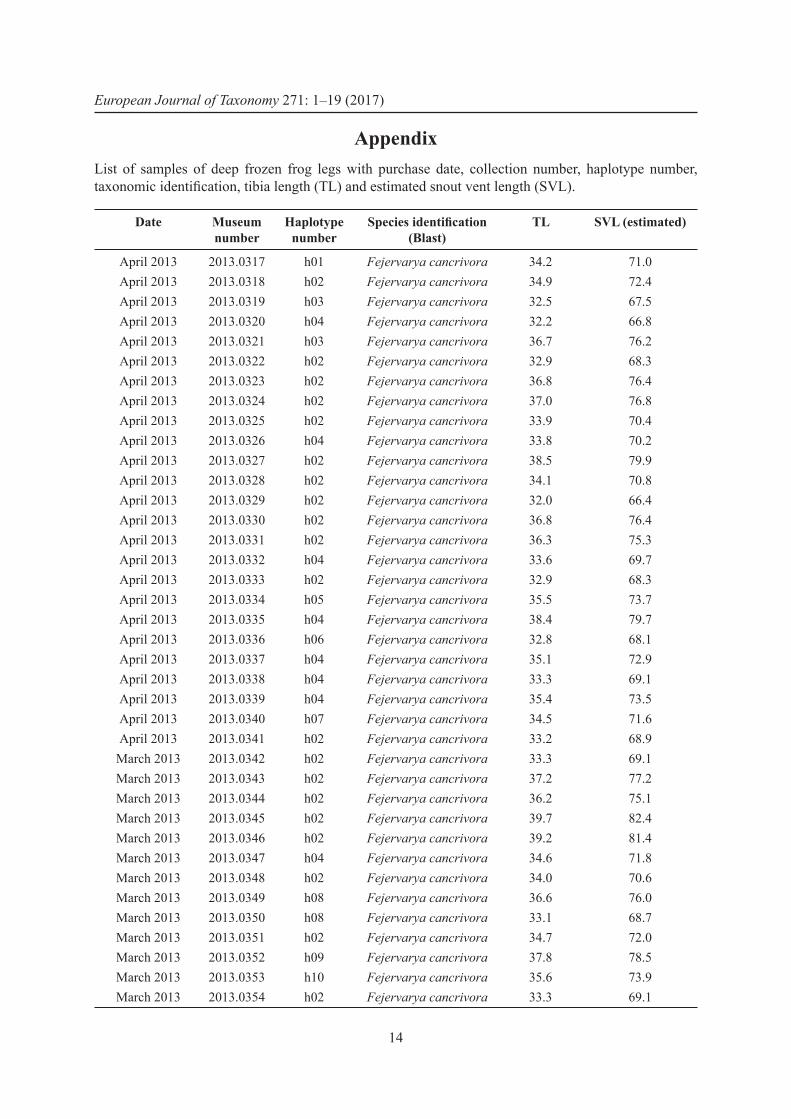
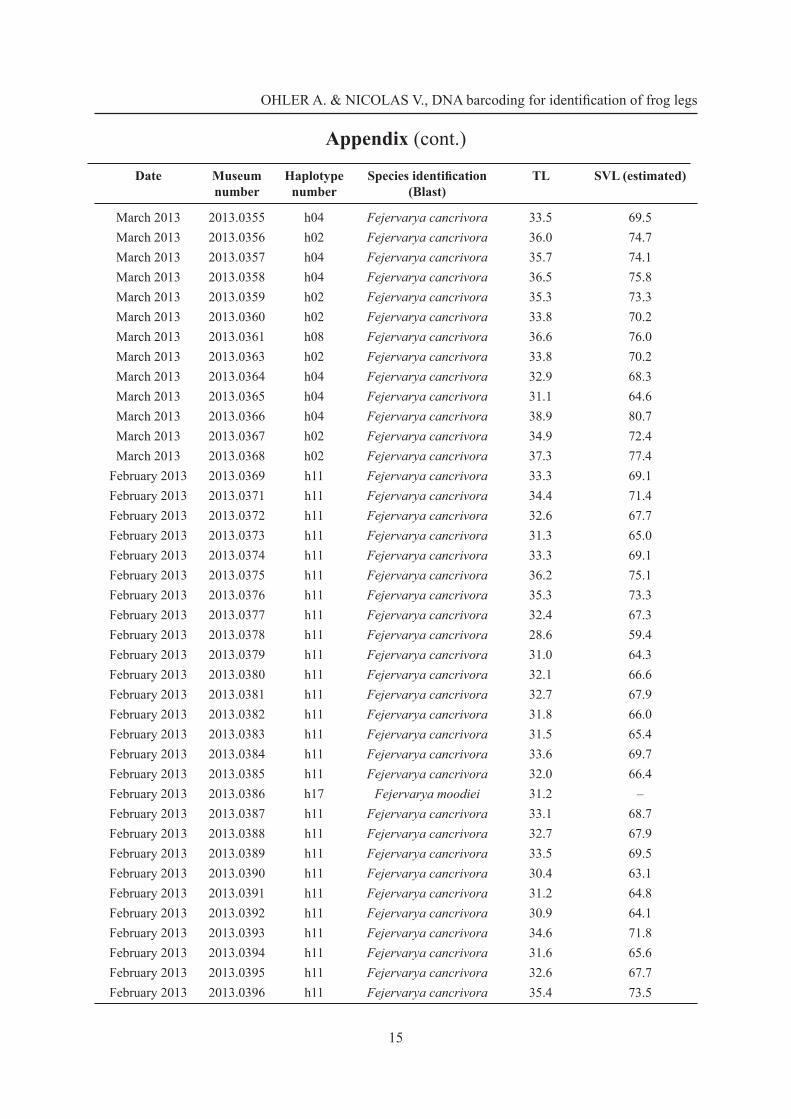
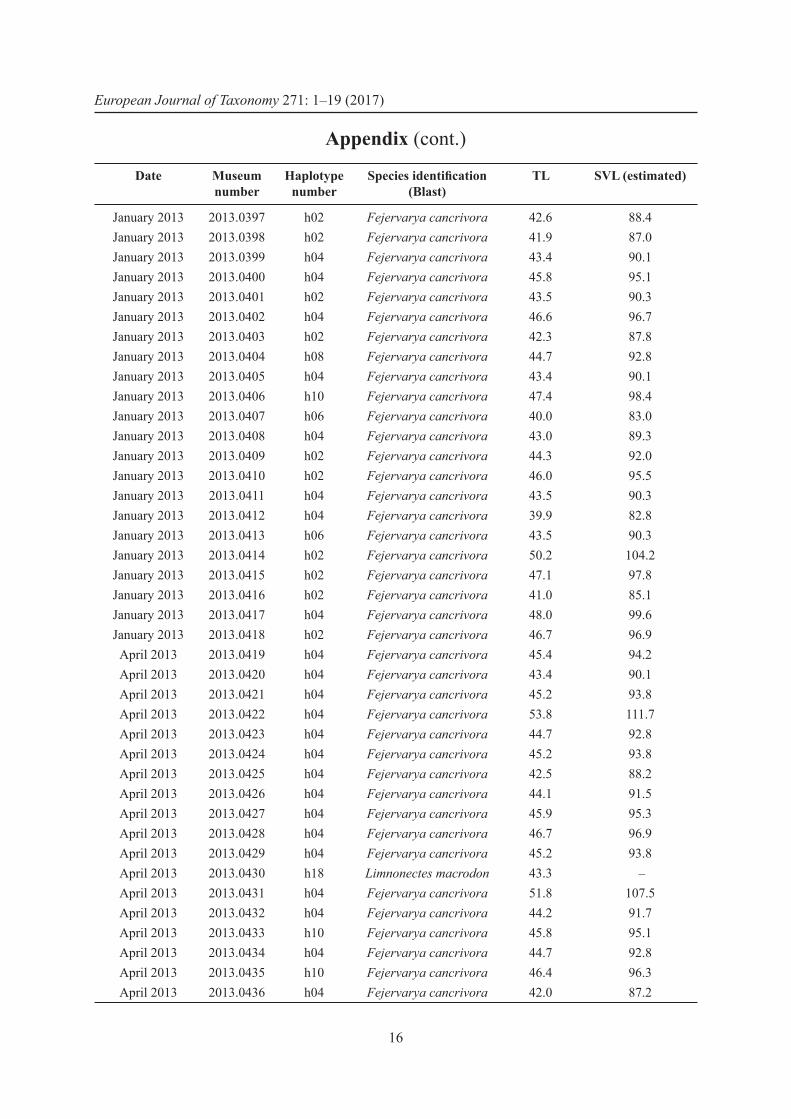
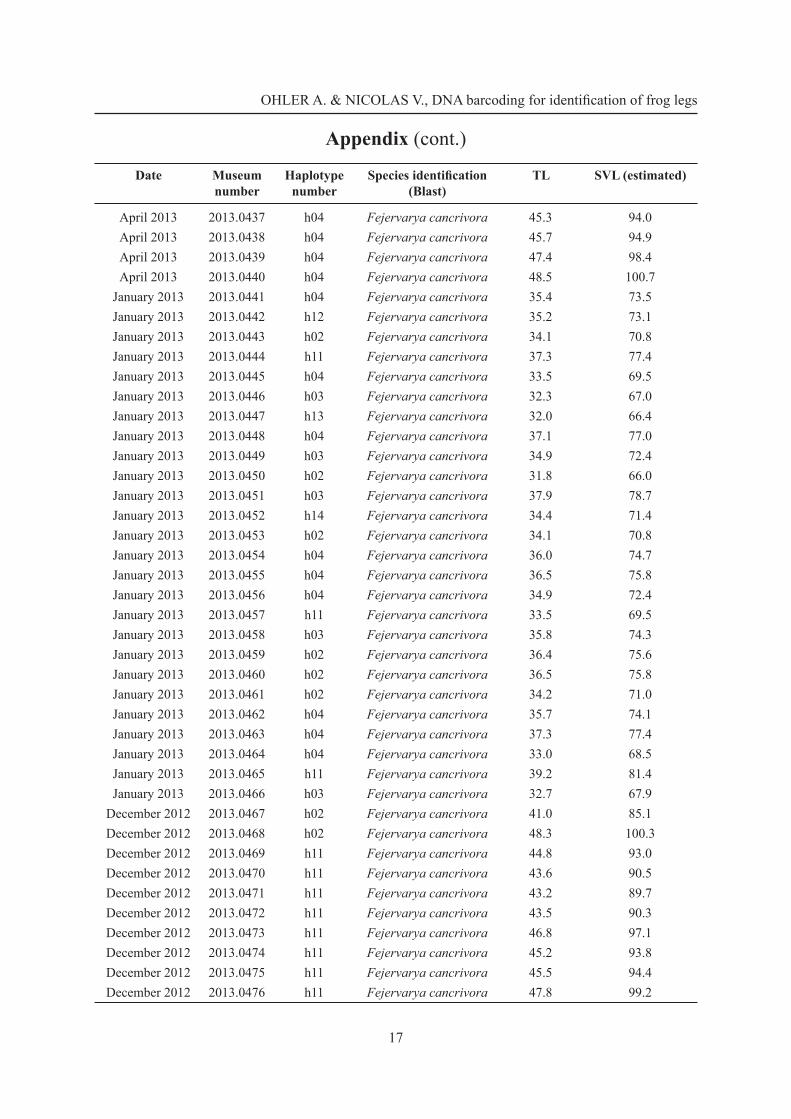
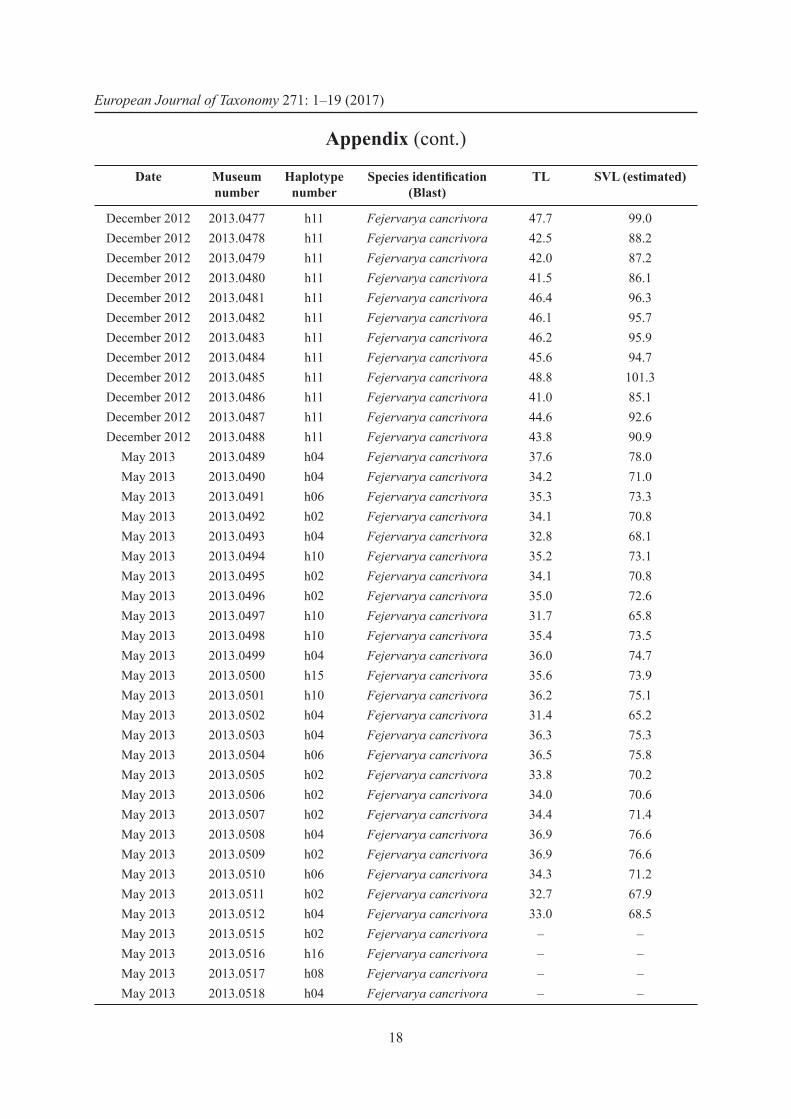
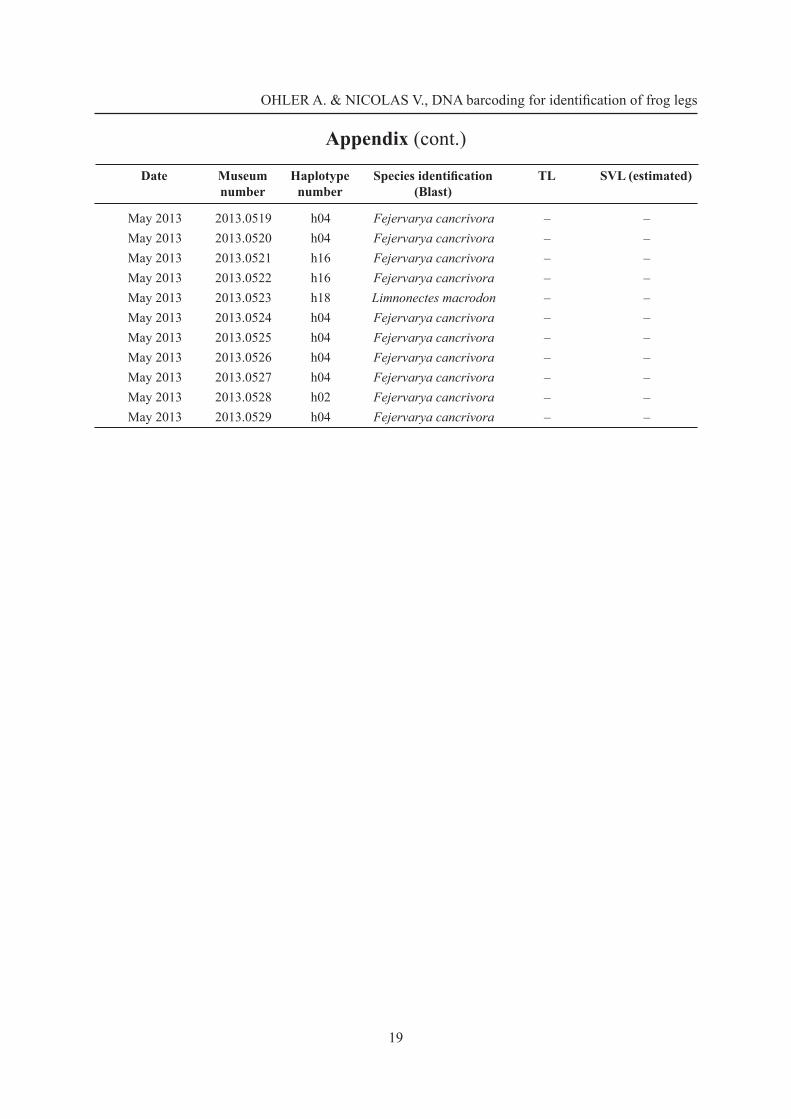
AppendixList of samples of deep frozen frog legs with purchase date, collection number, haplotype number, taxonomic identifi cation, tibia length (TL) and estimated snout vent length (SVL).
Date Museum number
Haplotype number
Species identifi cation (Blast)
TL SVL (estimated)
April 2013 2013.0317 h01 Fejervarya cancrivora 34.2 71.0April 2013 2013.0318 h02 Fejervarya cancrivora 34.9 72.4April 2013 2013.0319 h03 Fejervarya cancrivora 32.5 67.5April 2013 2013.0320 h04 Fejervarya cancrivora 32.2 66.8April 2013 2013.0321 h03 Fejervarya cancrivora 36.7 76.2April 2013 2013.0322 h02 Fejervarya cancrivora 32.9 68.3April 2013 2013.0323 h02 Fejervarya cancrivora 36.8 76.4April 2013 2013.0324 h02 Fejervarya cancrivora 37.0 76.8April 2013 2013.0325 h02 Fejervarya cancrivora 33.9 70.4April 2013 2013.0326 h04 Fejervarya cancrivora 33.8 70.2April 2013 2013.0327 h02 Fejervarya cancrivora 38.5 79.9April 2013 2013.0328 h02 Fejervarya cancrivora 34.1 70.8April 2013 2013.0329 h02 Fejervarya cancrivora 32.0 66.4April 2013 2013.0330 h02 Fejervarya cancrivora 36.8 76.4April 2013 2013.0331 h02 Fejervarya cancrivora 36.3 75.3April 2013 2013.0332 h04 Fejervarya cancrivora 33.6 69.7April 2013 2013.0333 h02 Fejervarya cancrivora 32.9 68.3April 2013 2013.0334 h05 Fejervarya cancrivora 35.5 73.7April 2013 2013.0335 h04 Fejervarya cancrivora 38.4 79.7April 2013 2013.0336 h06 Fejervarya cancrivora 32.8 68.1April 2013 2013.0337 h04 Fejervarya cancrivora 35.1 72.9April 2013 2013.0338 h04 Fejervarya cancrivora 33.3 69.1April 2013 2013.0339 h04 Fejervarya cancrivora 35.4 73.5April 2013 2013.0340 h07 Fejervarya cancrivora 34.5 71.6April 2013 2013.0341 h02 Fejervarya cancrivora 33.2 68.9March 2013 2013.0342 h02 Fejervarya cancrivora 33.3 69.1March 2013 2013.0343 h02 Fejervarya cancrivora 37.2 77.2March 2013 2013.0344 h02 Fejervarya cancrivora 36.2 75.1March 2013 2013.0345 h02 Fejervarya cancrivora 39.7 82.4March 2013 2013.0346 h02 Fejervarya cancrivora 39.2 81.4March 2013 2013.0347 h04 Fejervarya cancrivora 34.6 71.8March 2013 2013.0348 h02 Fejervarya cancrivora 34.0 70.6March 2013 2013.0349 h08 Fejervarya cancrivora 36.6 76.0March 2013 2013.0350 h08 Fejervarya cancrivora 33.1 68.7March 2013 2013.0351 h02 Fejervarya cancrivora 34.7 72.0March 2013 2013.0352 h09 Fejervarya cancrivora 37.8 78.5March 2013 2013.0353 h10 Fejervarya cancrivora 35.6 73.9March 2013 2013.0354 h02 Fejervarya cancrivora 33.3 69.1
OHLER A. & NICOLAS V., DNA barcoding for identifi cation of frog legs
15
March 2013 2013.0355 h04 Fejervarya cancrivora 33.5 69.5March 2013 2013.0356 h02 Fejervarya cancrivora 36.0 74.7March 2013 2013.0357 h04 Fejervarya cancrivora 35.7 74.1March 2013 2013.0358 h04 Fejervarya cancrivora 36.5 75.8March 2013 2013.0359 h02 Fejervarya cancrivora 35.3 73.3March 2013 2013.0360 h02 Fejervarya cancrivora 33.8 70.2March 2013 2013.0361 h08 Fejervarya cancrivora 36.6 76.0March 2013 2013.0363 h02 Fejervarya cancrivora 33.8 70.2March 2013 2013.0364 h04 Fejervarya cancrivora 32.9 68.3March 2013 2013.0365 h04 Fejervarya cancrivora 31.1 64.6March 2013 2013.0366 h04 Fejervarya cancrivora 38.9 80.7March 2013 2013.0367 h02 Fejervarya cancrivora 34.9 72.4March 2013 2013.0368 h02 Fejervarya cancrivora 37.3 77.4
February 2013 2013.0369 h11 Fejervarya cancrivora 33.3 69.1February 2013 2013.0371 h11 Fejervarya cancrivora 34.4 71.4February 2013 2013.0372 h11 Fejervarya cancrivora 32.6 67.7February 2013 2013.0373 h11 Fejervarya cancrivora 31.3 65.0February 2013 2013.0374 h11 Fejervarya cancrivora 33.3 69.1February 2013 2013.0375 h11 Fejervarya cancrivora 36.2 75.1February 2013 2013.0376 h11 Fejervarya cancrivora 35.3 73.3February 2013 2013.0377 h11 Fejervarya cancrivora 32.4 67.3February 2013 2013.0378 h11 Fejervarya cancrivora 28.6 59.4February 2013 2013.0379 h11 Fejervarya cancrivora 31.0 64.3February 2013 2013.0380 h11 Fejervarya cancrivora 32.1 66.6February 2013 2013.0381 h11 Fejervarya cancrivora 32.7 67.9February 2013 2013.0382 h11 Fejervarya cancrivora 31.8 66.0February 2013 2013.0383 h11 Fejervarya cancrivora 31.5 65.4February 2013 2013.0384 h11 Fejervarya cancrivora 33.6 69.7February 2013 2013.0385 h11 Fejervarya cancrivora 32.0 66.4February 2013 2013.0386 h17 Fejervarya moodiei 31.2 – February 2013 2013.0387 h11 Fejervarya cancrivora 33.1 68.7February 2013 2013.0388 h11 Fejervarya cancrivora 32.7 67.9February 2013 2013.0389 h11 Fejervarya cancrivora 33.5 69.5February 2013 2013.0390 h11 Fejervarya cancrivora 30.4 63.1February 2013 2013.0391 h11 Fejervarya cancrivora 31.2 64.8February 2013 2013.0392 h11 Fejervarya cancrivora 30.9 64.1February 2013 2013.0393 h11 Fejervarya cancrivora 34.6 71.8February 2013 2013.0394 h11 Fejervarya cancrivora 31.6 65.6February 2013 2013.0395 h11 Fejervarya cancrivora 32.6 67.7February 2013 2013.0396 h11 Fejervarya cancrivora 35.4 73.5
Appendix (cont.)
Date Museum number
Haplotype number
Species identifi cation (Blast)
TL SVL (estimated)
European Journal of Taxonomy 271: 1–19 (2017)
16
January 2013 2013.0397 h02 Fejervarya cancrivora 42.6 88.4January 2013 2013.0398 h02 Fejervarya cancrivora 41.9 87.0January 2013 2013.0399 h04 Fejervarya cancrivora 43.4 90.1January 2013 2013.0400 h04 Fejervarya cancrivora 45.8 95.1January 2013 2013.0401 h02 Fejervarya cancrivora 43.5 90.3January 2013 2013.0402 h04 Fejervarya cancrivora 46.6 96.7January 2013 2013.0403 h02 Fejervarya cancrivora 42.3 87.8January 2013 2013.0404 h08 Fejervarya cancrivora 44.7 92.8January 2013 2013.0405 h04 Fejervarya cancrivora 43.4 90.1January 2013 2013.0406 h10 Fejervarya cancrivora 47.4 98.4January 2013 2013.0407 h06 Fejervarya cancrivora 40.0 83.0January 2013 2013.0408 h04 Fejervarya cancrivora 43.0 89.3January 2013 2013.0409 h02 Fejervarya cancrivora 44.3 92.0January 2013 2013.0410 h02 Fejervarya cancrivora 46.0 95.5January 2013 2013.0411 h04 Fejervarya cancrivora 43.5 90.3January 2013 2013.0412 h04 Fejervarya cancrivora 39.9 82.8January 2013 2013.0413 h06 Fejervarya cancrivora 43.5 90.3January 2013 2013.0414 h02 Fejervarya cancrivora 50.2 104.2January 2013 2013.0415 h02 Fejervarya cancrivora 47.1 97.8January 2013 2013.0416 h02 Fejervarya cancrivora 41.0 85.1January 2013 2013.0417 h04 Fejervarya cancrivora 48.0 99.6January 2013 2013.0418 h02 Fejervarya cancrivora 46.7 96.9April 2013 2013.0419 h04 Fejervarya cancrivora 45.4 94.2April 2013 2013.0420 h04 Fejervarya cancrivora 43.4 90.1April 2013 2013.0421 h04 Fejervarya cancrivora 45.2 93.8April 2013 2013.0422 h04 Fejervarya cancrivora 53.8 111.7April 2013 2013.0423 h04 Fejervarya cancrivora 44.7 92.8April 2013 2013.0424 h04 Fejervarya cancrivora 45.2 93.8April 2013 2013.0425 h04 Fejervarya cancrivora 42.5 88.2April 2013 2013.0426 h04 Fejervarya cancrivora 44.1 91.5April 2013 2013.0427 h04 Fejervarya cancrivora 45.9 95.3April 2013 2013.0428 h04 Fejervarya cancrivora 46.7 96.9April 2013 2013.0429 h04 Fejervarya cancrivora 45.2 93.8April 2013 2013.0430 h18 Limnonectes macrodon 43.3 –April 2013 2013.0431 h04 Fejervarya cancrivora 51.8 107.5April 2013 2013.0432 h04 Fejervarya cancrivora 44.2 91.7April 2013 2013.0433 h10 Fejervarya cancrivora 45.8 95.1April 2013 2013.0434 h04 Fejervarya cancrivora 44.7 92.8April 2013 2013.0435 h10 Fejervarya cancrivora 46.4 96.3April 2013 2013.0436 h04 Fejervarya cancrivora 42.0 87.2
Appendix (cont.)
Date Museum number
Haplotype number
Species identifi cation (Blast)
TL SVL (estimated)
OHLER A. & NICOLAS V., DNA barcoding for identifi cation of frog legs
17
April 2013 2013.0437 h04 Fejervarya cancrivora 45.3 94.0April 2013 2013.0438 h04 Fejervarya cancrivora 45.7 94.9April 2013 2013.0439 h04 Fejervarya cancrivora 47.4 98.4April 2013 2013.0440 h04 Fejervarya cancrivora 48.5 100.7
January 2013 2013.0441 h04 Fejervarya cancrivora 35.4 73.5January 2013 2013.0442 h12 Fejervarya cancrivora 35.2 73.1January 2013 2013.0443 h02 Fejervarya cancrivora 34.1 70.8January 2013 2013.0444 h11 Fejervarya cancrivora 37.3 77.4January 2013 2013.0445 h04 Fejervarya cancrivora 33.5 69.5January 2013 2013.0446 h03 Fejervarya cancrivora 32.3 67.0January 2013 2013.0447 h13 Fejervarya cancrivora 32.0 66.4January 2013 2013.0448 h04 Fejervarya cancrivora 37.1 77.0January 2013 2013.0449 h03 Fejervarya cancrivora 34.9 72.4January 2013 2013.0450 h02 Fejervarya cancrivora 31.8 66.0January 2013 2013.0451 h03 Fejervarya cancrivora 37.9 78.7January 2013 2013.0452 h14 Fejervarya cancrivora 34.4 71.4January 2013 2013.0453 h02 Fejervarya cancrivora 34.1 70.8January 2013 2013.0454 h04 Fejervarya cancrivora 36.0 74.7January 2013 2013.0455 h04 Fejervarya cancrivora 36.5 75.8January 2013 2013.0456 h04 Fejervarya cancrivora 34.9 72.4January 2013 2013.0457 h11 Fejervarya cancrivora 33.5 69.5January 2013 2013.0458 h03 Fejervarya cancrivora 35.8 74.3January 2013 2013.0459 h02 Fejervarya cancrivora 36.4 75.6January 2013 2013.0460 h02 Fejervarya cancrivora 36.5 75.8January 2013 2013.0461 h02 Fejervarya cancrivora 34.2 71.0January 2013 2013.0462 h04 Fejervarya cancrivora 35.7 74.1January 2013 2013.0463 h04 Fejervarya cancrivora 37.3 77.4January 2013 2013.0464 h04 Fejervarya cancrivora 33.0 68.5January 2013 2013.0465 h11 Fejervarya cancrivora 39.2 81.4January 2013 2013.0466 h03 Fejervarya cancrivora 32.7 67.9
December 2012 2013.0467 h02 Fejervarya cancrivora 41.0 85.1December 2012 2013.0468 h02 Fejervarya cancrivora 48.3 100.3December 2012 2013.0469 h11 Fejervarya cancrivora 44.8 93.0December 2012 2013.0470 h11 Fejervarya cancrivora 43.6 90.5December 2012 2013.0471 h11 Fejervarya cancrivora 43.2 89.7December 2012 2013.0472 h11 Fejervarya cancrivora 43.5 90.3December 2012 2013.0473 h11 Fejervarya cancrivora 46.8 97.1December 2012 2013.0474 h11 Fejervarya cancrivora 45.2 93.8December 2012 2013.0475 h11 Fejervarya cancrivora 45.5 94.4December 2012 2013.0476 h11 Fejervarya cancrivora 47.8 99.2
Appendix (cont.)
Date Museum number
Haplotype number
Species identifi cation (Blast)
TL SVL (estimated)
European Journal of Taxonomy 271: 1–19 (2017)
18
December 2012 2013.0477 h11 Fejervarya cancrivora 47.7 99.0December 2012 2013.0478 h11 Fejervarya cancrivora 42.5 88.2December 2012 2013.0479 h11 Fejervarya cancrivora 42.0 87.2December 2012 2013.0480 h11 Fejervarya cancrivora 41.5 86.1December 2012 2013.0481 h11 Fejervarya cancrivora 46.4 96.3December 2012 2013.0482 h11 Fejervarya cancrivora 46.1 95.7December 2012 2013.0483 h11 Fejervarya cancrivora 46.2 95.9December 2012 2013.0484 h11 Fejervarya cancrivora 45.6 94.7December 2012 2013.0485 h11 Fejervarya cancrivora 48.8 101.3December 2012 2013.0486 h11 Fejervarya cancrivora 41.0 85.1December 2012 2013.0487 h11 Fejervarya cancrivora 44.6 92.6December 2012 2013.0488 h11 Fejervarya cancrivora 43.8 90.9
May 2013 2013.0489 h04 Fejervarya cancrivora 37.6 78.0May 2013 2013.0490 h04 Fejervarya cancrivora 34.2 71.0May 2013 2013.0491 h06 Fejervarya cancrivora 35.3 73.3May 2013 2013.0492 h02 Fejervarya cancrivora 34.1 70.8May 2013 2013.0493 h04 Fejervarya cancrivora 32.8 68.1May 2013 2013.0494 h10 Fejervarya cancrivora 35.2 73.1May 2013 2013.0495 h02 Fejervarya cancrivora 34.1 70.8May 2013 2013.0496 h02 Fejervarya cancrivora 35.0 72.6May 2013 2013.0497 h10 Fejervarya cancrivora 31.7 65.8May 2013 2013.0498 h10 Fejervarya cancrivora 35.4 73.5May 2013 2013.0499 h04 Fejervarya cancrivora 36.0 74.7May 2013 2013.0500 h15 Fejervarya cancrivora 35.6 73.9May 2013 2013.0501 h10 Fejervarya cancrivora 36.2 75.1May 2013 2013.0502 h04 Fejervarya cancrivora 31.4 65.2May 2013 2013.0503 h04 Fejervarya cancrivora 36.3 75.3May 2013 2013.0504 h06 Fejervarya cancrivora 36.5 75.8May 2013 2013.0505 h02 Fejervarya cancrivora 33.8 70.2May 2013 2013.0506 h02 Fejervarya cancrivora 34.0 70.6May 2013 2013.0507 h02 Fejervarya cancrivora 34.4 71.4May 2013 2013.0508 h04 Fejervarya cancrivora 36.9 76.6May 2013 2013.0509 h02 Fejervarya cancrivora 36.9 76.6May 2013 2013.0510 h06 Fejervarya cancrivora 34.3 71.2May 2013 2013.0511 h02 Fejervarya cancrivora 32.7 67.9May 2013 2013.0512 h04 Fejervarya cancrivora 33.0 68.5May 2013 2013.0515 h02 Fejervarya cancrivora – –May 2013 2013.0516 h16 Fejervarya cancrivora – –May 2013 2013.0517 h08 Fejervarya cancrivora – –May 2013 2013.0518 h04 Fejervarya cancrivora – –
Appendix (cont.)
Date Museum number
Haplotype number
Species identifi cation (Blast)
TL SVL (estimated)
OHLER A. & NICOLAS V., DNA barcoding for identifi cation of frog legs
19
Appendix (cont.)
May 2013 2013.0519 h04 Fejervarya cancrivora – –May 2013 2013.0520 h04 Fejervarya cancrivora – –May 2013 2013.0521 h16 Fejervarya cancrivora – –May 2013 2013.0522 h16 Fejervarya cancrivora – –May 2013 2013.0523 h18 Limnonectes macrodon – –May 2013 2013.0524 h04 Fejervarya cancrivora – –May 2013 2013.0525 h04 Fejervarya cancrivora – –May 2013 2013.0526 h04 Fejervarya cancrivora – –May 2013 2013.0527 h04 Fejervarya cancrivora – –May 2013 2013.0528 h02 Fejervarya cancrivora – –May 2013 2013.0529 h04 Fejervarya cancrivora – –
Date Museum number
Haplotype number
Species identifi cation (Blast)
TL SVL (estimated)