Embed Size (px)
Citation preview
Below we examine market outliers in financial markets. How
much effect do these outliers have on long term
performance? Can the investor prepare for these anomalies,
or are they truly ‘black swans’ that cannot be managed? In
this issue we examine numerous global financial markets on
daily and monthly time frames. We find that these rare
outliers have a massive impact on returns. However, these
outliers tend to cluster and the majority of both good and bad
outliers occur once markets have already been declining. We
critique the "missing the 10-best-days" argument proffered by
advocates of buy and hold investing, as we demonstrate that
a significant majority of the 10 best days and the 10 worst
days occur in declining markets. We continue to advocate
that investors attempt to avoid declining markets where most
of the volatility lies and conclude that market timing and risk
management is indeed possible, and beneficial to the
investor.
Thanks goes out to Prabhat Dalmia for his assistance with this
project.
2321 Rosecrans Avenue
Suite 4210
El Segundo, CA 90245
Phone: 310.606.5555
Fax: 310.606.5556
www.cambriainvestments.com
Mebane T. Faber
CQR ISSUE 3 | August 2011
Where the Black Swans Hide &
The 10 Best Days Myth
The Ivy Portfolio

CQR ISSUE 3 | August 2011
Nassim Taleb, author of Fooled by Randomness and The Black Swan, popularized the concept of the black swan – namely, the occurrence of utterly unforeseeable events that are thought of as not being possible based on previous experiences. Taleb defines a black swan as:
1) Outlier outside the realm of regular expectations because nothing in the past can convincingly point to its occurrence.
2) The event carries an extreme impact. 3) Explanations for the occurrence can be found after the fact, giving the impression that it can
be explainable and predictable. Many market commentators have latched on to this term to describe all financial market events. However, the existence of large outlier events known as fat-tailed distributions in financial market returns has been well documented for over 40 years (Mandelbrot 1963, Fama 1965). While the financial media have only recently re-visited the fat-tail concept (due largely to the occurrence of the internet bust in 2000-2003 as well as the global financial meltdown in 2008 and 2009), it has been a thoroughly studied field in finance over the past several decades. Investors should realize that normal market returns are extreme. Individuals that continue to believe in the Gaussian (bell-shaped) distribution, or ignore empirical results will continue to be surprised by future events. Roughly 40% of all yearly returns in US stocks are greater than 10% or less than -10%. Bear markets are common, and markets can and do decline from 50-100%. Financial market return distributions are similar to fractal systems that follow a power law distribution (which is useful in describing events like earthquakes and volcanic eruptions). Below is a chart from the book The Failure of Risk Management by Hubbard that illustrates the inability of the Gaussian models to account for large outlier moves in financial markets. In a normal distribution world a 5% decline in the Dow in a single trading day should not have happened in the past 100 years. In reality, it has happened nearly 100 times.
2
Source: The Failure of Risk Management, Hubbard (2009)

3
CQR ISSUE 3 | August 2011
Unfortunately, many investors have come to the conclusion that rare events are impossible to predict, and therefore, there is nothing to do other than buy and hold their investments and wait out any negative outliers. However, this explanation simply rids the investor (advisor) of any responsibility – the fatalistic attitude becomes "it was a black swan, it’s not my fault!" In this article we examine market outliers, their effect, but more importantly when they occur and if the investor can do anything to protect against them. While we are not going to spend much time on a literature review, the appendix has a list of books and papers on market bubbles, financial market return distributions, and investment history. The next few issues of Cambria Quantitative Research are going to expand on some of the topics mentioned here (bubbles, forecasting, etc).
MARKET OUTLIERS: THE 10 BEST DAYS MYTH
We first begin our examination by taking a look at market outliers in the US stock market back to 1928. One of the most common rhetorical bulwarks in the defense of buy and hold is investing is to demonstrate the effects of missing the best 10 days in the market, and how that would affect the compounded return to investors. This is perhaps one of the most misleading statistics in our profession (another being the Brinson asset allocation study misquote). A number of academic papers have examined the effects of missing both the 10 best as well as the 10 worst days (Gire (2005) and Ahrens (2008) are two good ones). Below we examine the S&P 500 (and the broad market predecessor) from 1928-2010. We use price history only as dividends will not have a meaningful impact on the daily return data.
FIGURE 1
US STOCKS DAILY RETURNS
9/1928-2010, PRICE ONLY
Source: Global Financial Data
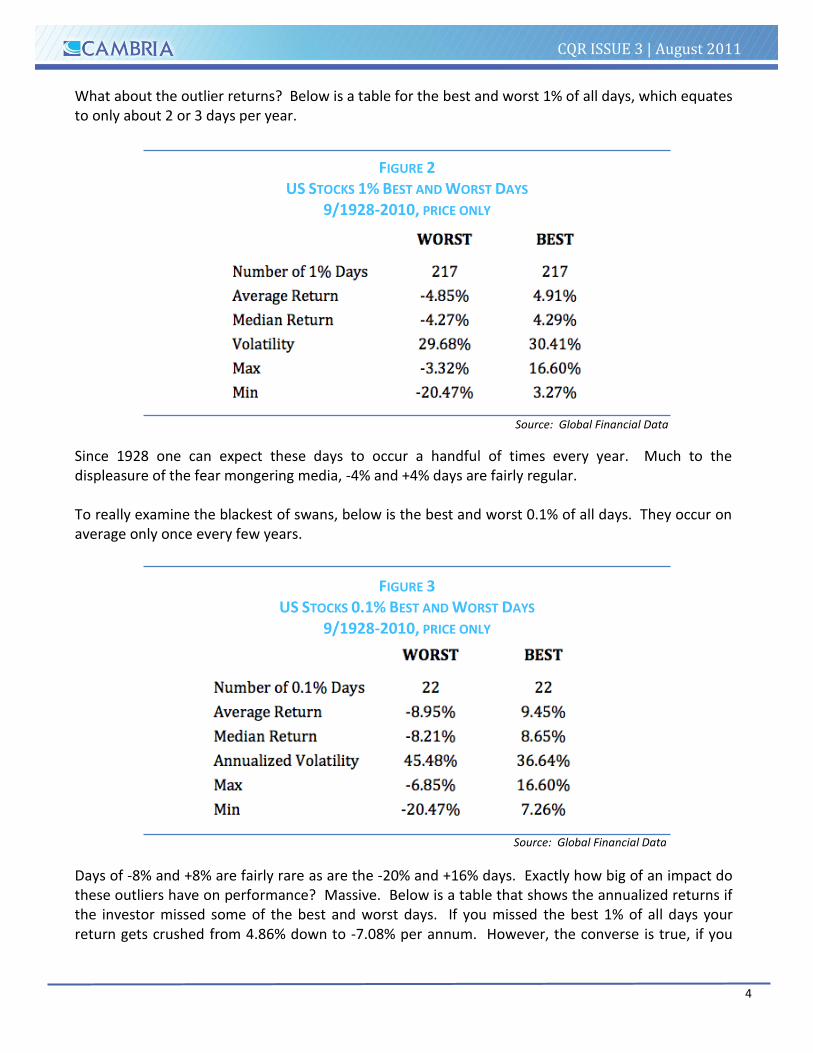
FIGURE 3 US STOCKS 0.1% BEST AND WORST DAYS
9/1928-2010, PRICE ONLY
Since 1928 one can expect these days to occur a handful of times every year. Much to the displeasure of the fear mongering media, -4% and +4% days are fairly regular. To really examine the blackest of swans, below is the best and worst 0.1% of all days. They occur on average only once every few years.
CQR ISSUE 3 | August 2011
4
Days of -8% and +8% are fairly rare as are the -20% and +16% days. Exactly how big of an impact do these outliers have on performance? Massive. Below is a table that shows the annualized returns if the investor missed some of the best and worst days. If you missed the best 1% of all days your return gets crushed from 4.86% down to -7.08% per annum. However, the converse is true, if you
What about the outlier returns? Below is a table for the best and worst 1% of all days, which equates to only about 2 or 3 days per year.
FIGURE 2 US STOCKS 1% BEST AND WORST DAYS
9/1928-2010, PRICE ONLY
Source: Global Financial Data
Source: Global Financial Data
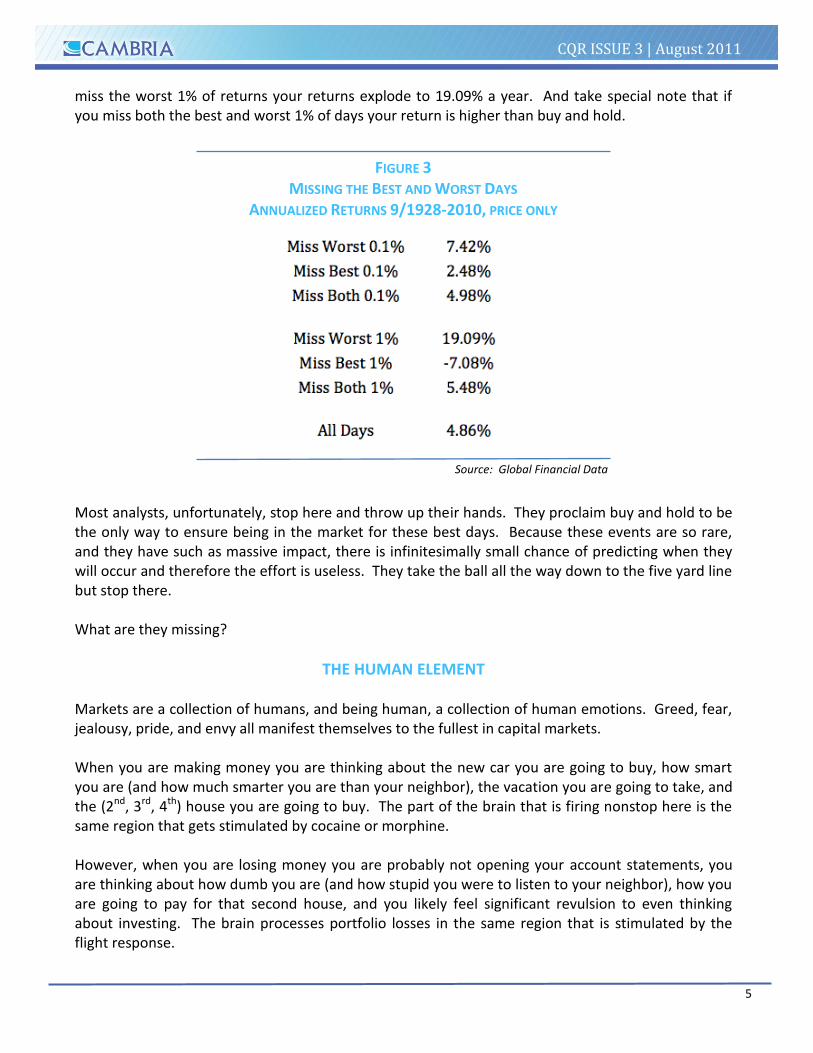
miss the worst 1% of returns your returns explode to 19.09% a year. And take special note that if you miss both the best and worst 1% of days your return is higher than buy and hold.
5
CQR ISSUE 3 | August 2011
Most analysts, unfortunately, stop here and throw up their hands. They proclaim buy and hold to be the only way to ensure being in the market for these best days. Because these events are so rare, and they have such as massive impact, there is infinitesimally small chance of predicting when they will occur and therefore the effort is useless. They take the ball all the way down to the five yard line but stop there. What are they missing?
THE HUMAN ELEMENT Markets are a collection of humans, and being human, a collection of human emotions. Greed, fear, jealousy, pride, and envy all manifest themselves to the fullest in capital markets. When you are making money you are thinking about the new car you are going to buy, how smart you are (and how much smarter you are than your neighbor), the vacation you are going to take, and the (2nd, 3rd, 4th) house you are going to buy. The part of the brain that is firing nonstop here is the same region that gets stimulated by cocaine or morphine. However, when you are losing money you are probably not opening your account statements, you are thinking about how dumb you are (and how stupid you were to listen to your neighbor), how you are going to pay for that second house, and you likely feel significant revulsion to even thinking about investing. The brain processes portfolio losses in the same region that is stimulated by the flight response.
FIGURE 3 MISSING THE BEST AND WORST DAYS
ANNUALIZED RETURNS 9/1928-2010, PRICE ONLY
Source: Global Financial Data

For a longer discussion on your behavioral biases check out the appendix as well as this great Andrew Lo video “Technical Analysis: An Academic Perspective”. To demonstrate this effect Table 4 examines the returns, but more importantly the volatility when the market is appreciating versus declining (as defined as above or below the 200 days simple moving average).
CQR ISSUE 3 | August 2011
6
FIGURE 4 MISSING THE BEST AND WORST DAYS
9/1928-2010, PRICE ONLY
Source: Global Financial Data
FIGURE 5 MISSING THE BEST AND WORST DAYS
9/1928-2010, PRICE ONLY
Source: Global Financial Data
What about the outliers -- where do they occur? The vast majority, roughly 60-80%, of the best and worst days occur after the market has already started declining. The simple reason is that markets are more volatile when they are declining, and when the really volatile events and days occur they tend to cluster together. Our central argument is that returns improve and volatility is reduced when an investor is invested in uptrending markets thus avoiding the volatility and clustering of best and worst days inherent in declining markets. As you can see in Figure 5, in declining markets returns are much lower and volatility is much higher.

Mandelbrot provides an insightful passage on volatility clustering and timing in his book The Misbehavior of Markets:
“What matters is the particular, not the average. Some of the most successful investors are those who did, in fact, get the timing right.”
This effect also plays out on the monthly timeframe as well. For a look at other markets including real estate, bonds, and foreign stocks on the monthly timeframe back to 1972 you can view a blog post here titled “Your Irrational Brain”.
EVIDENCE IN FOREIGN MARKETS
Any investment property or anomaly should be demonstrable in most if not all markets otherwise the results are likely from data mining and spurious. Estrada (2007) examined the evidence from 15 international markets and finds that “on average across all 15 markets, missing the 10 best days resulted in a portfolio 50.8% less valuable than a passive investment; and avoiding the 10 worst days resulted in a portfolio 150.4% more valuable than a passive investment.” He then goes on to the conclusion that, ”given that 10 days represent less than 0.1% of the days considered in the average market, the odds against successful market timing are staggering.” Below we recreate the prior tables with the Estrada dataset updated through 2010. We find similar statistics to the US data, namely, a small amount of outliers have a massive impact on performance and the best and worst outliers tend to cluster when the market is already declining. However, if you miss the best and worst days in every case your compound return is higher than buy and hold.
FIGURE 5 MISSING THE BEST AND WORST DAYS, VARIOUS DATES
Source: Global Financial Data
CQR ISSUE 3 | August 2011
7

CQR ISSUE 3 | August 2011
8
The volatility clustering below the long term moving averages confirms the United States results, and on average 76% of the worst days and 67% of the best days occur after the market is already declining. Lengthy summaries on all of the foreign markets are in the appendix.
CONCLUSIONS For those investors pondering how they can attempt to avoid these highly volatile periods in markets, we invite you to download a few of our other white papers here: “A Quantitative Approach To Tactical Asset Allocation” and “Relative Strength Strategies for Investing”. Astute market analysts must also realize the drawbacks and downsides of any indicator or investment approach. In the case of a trendfollowing approach there are two main drawbacks. First, in trendless markets whipsaws can occur that have negative effects on the portfolio. Second, and perhaps more important, a trendfollowing approach does not guarantee the investor from missing a black swan event in an uptrend. A very sharp move against the trend will not allow the investor or model time to react and protect against such a move. Investors looking for protection against this sort of event can use derivatives such as options to protect the portfolio when fully invested (so-called tail risk insurance), or consequently, to gain long exposure when mostly in cash and bonds (risk of missing out). This process could be a net cost (insurance) to the portfolio. That is the point of risk management – understanding and trying to account for as many risks as you can.
Summary: 1. The stock market historically has gone up about two-thirds of the time.
2. All of the stock market return occurs when the market is already uptrending.
3. The volatility is much higher when the market is declining.
4. Most of the best and worst days occur when the market is already declining. Reason: see #3.
Markets are much riskier than models assuming normal distributions predict.
5. The reason markets are more volatile when declining is because investors use a different part of
their brain making money than when losing money.

CQR ISSUE 3 | August 2011
7
APPENDIX A – FOREIGN STOCKS Source: Global Financial Data

CQR ISSUE 3 | August 2011
8
APPENDIX A – FOREIGN STOCKS Source: Global Financial Data

CQR ISSUE 3 | August 2011
9
APPENDIX A – FOREIGN STOCKS Source: Global Financial Data

CQR ISSUE 3 | August 2011
10
APPENDIX A – FOREIGN STOCKS Source: Global Financial Data

CQR ISSUE 3 | August 2011
11
APPENDIX A – FOREIGN STOCKS Source: Global Financial Data

CQR ISSUE 3 | August 2011
12
APPENDIX A – FOREIGN STOCKS Source: Global Financial Data

CQR ISSUE 3 | August 2011
13
APPENDIX A – FOREIGN STOCKS Source: Global Financial Data

CQR ISSUE 3 | August 2011
14
APPENDIX B – READING LIST Stock Distributions
Why Stock Markets Crash: Critical Events in Complex Financial Systems - Didier Sornette
The Misbehavior of Markets by Benoit Mandelbrot
Fooled by Randomness and The Black Swan: The Impact of the Highly Improbable by Taleb Finding Alpha – by Eric Falkenstein
Market Volatility – Robert Shiller
Optimal Portfolio Modeling – Philip McDonnell
Fractal Market Analysis - Edgar Peters
More Than You Know: Finding Financial Wisdom in Unconventional Places - Michael Mauboussin
The Failure of Risk Management: Why It’s Broken and How to Fix It – Douglas Hubbard
Market Bubbles
Manias, Panics, and Crashes by Charles Kindleberger
Extraordinary Popular Delusions and the Madness of Crowds by Charles MacKay
Irrational Exuberance – by Robert Shiller
A Short History of Financial Euphoria and The Great Crash 1929- John Kenneth Galbraith
The Panic of 1907: Lessons Learned from the Market’s Perfect Storm - Mark Bruner
History of Markets
Triumph of the Optimists: 101 Years of Global Investment Returns by Elroy Dimson, Paul Marsh, and Mike Staunton Stocks for the Long Run by Jeremy Siegel
Reminiscences of a Stock Operator by Edwin LeFèvre
When Genius Failed by Roger Lowenstein
Capital Ideas, Capital Ideas Evolving, and Against the Gods by Peter Bernstein
Ibbotson Yearbook by Ibbotson Associates
The CRB Commodity Yearbook by Commodity Research Bureau
The Essays of Warren Buffett by Warren E. Buffett and Lawrence A. Cunningham
Fortune’s Formula by William Poundstone
The Myth of the Rational Market - Justin Fox
The Great Game: The Emergence of Wall Street as a World Power: 1653-2000 – John Gordon
Additional Papers
Ahrens, Richard (2008). “Missing the Ten Best Days.” Technical Analysis of Stocks and Commodities, 26:4 (56-57). Aparicio, Felipe, and Javier Estrada (2001). “Empirical Distributions of Stock Returns: European Securities Markets,
1990-1995.” European Journal of Finance, 7, 1-21. Estrada, Javier (2007). “Black Swans and Market Timing: How Not to Generate Alpha”
Fama, Eugene (1965). “The Behavior of Stock Market Prices.” Journal of Business, 38, 34-105.
Gire, Paul (2005). “Missing the Ten Best.” The Journal of Financial Planning,
Jansen, Dennis, and Casper de Vries, (1991). “On the Frequency of Large Stock Returns: Putting Booms and Busts
into Perspective.” Review of Economics and Statistics, 73, 18-24.
Mandelbrot, Benoit (1963). “The Variation of Certain Speculative Prices.” Journal of Business, 36, 394-419.

Cambria Investment Management, Inc.
(“CIMI”) is an investment adviser registered
under the Investment Advisors Act of 1940
with the U.S. Securities and Exchange
Commission (SEC).
This publication is for informational purposes
only and reflects the current opinions of CIMI.
Information contained herein is believed to be
accurate, but cannot be guaranteed. This
material is based on information that is
considered to be reliable, but CIMI and its
related entities make this information
available on an “as is” basis and make no
warranties, express or implied regarding the
accuracy or completeness of the information
contained herein, for any particular purpose.
CIMI will not be liable to you or anyone else
for any loss or injury resulting directly or
indirectly from the use of the information
contained in this newsletter caused in whole
or in part by its negligence in compiling,
interpreting, reporting or delivering the
content in this newsletter.
Opinions represented are not intended as an
offer or solicitation with respect to the
purchase or sale of any security or financial
instrument, nor is it advice or a
recommendation to enter into any
transaction. The material contained herein is
subject to change without notice. Statements
in this material should not be considered
investment advice. Employees and/or clients of
CIMI may have a position in the securities
mentioned. This publication has been prepared
without taking into account your objectives,
financial situation or needs. Before acting on
this information, you should consider its
appropriateness having regard to your
objectives, financial situation or needs. CIMI is
not responsible for any errors or omissions or
for results obtained from the use of this
information. Nothing contained in this
material is intended to constitute legal, tax,
securities, financial or investment advice, nor
an opinion regarding the appropriateness of
any investment. The general information
contained in this material should not be acted
upon without obtaining specific legal, tax or
investment advice from a licensed
professional. Past performance is not a guide
to future performance, future returns are not
guaranteed, and a loss of all of the original
capital invested in a security discussed in this
newsletter may occur. It is your responsibility
to be aware of and observe the applicable
laws and regulations of your country of
residence.
There are inherent limitations in hypothetical
portfolio results as the securities are not
actually purchased or sold. They may not
reflect the impact, if any, that material
economic and market factors might have
had on the investment manager’s decision-
making if the hypothetical portfolios were
real. Indices mentioned are used for
comparison purposes, are related to the
market in a broad sense and thus may differ
from the model portfolios in their level of
volatility. Indices are unmanaged and
cannot be invested in directly. The back-
tested data relates only to a hypothetical
model of past performance of the GTAA
strategy itself, and not to any asset
management products based on this index.
No allowance has been made for trading
costs or management fees which would
reduce investment performance. Actual
results may differ. Returns represent back-
tested performance based on rules used in
the creation of the index, are not a
guarantee of future performance and are
not indicative of any specific investment.
DISCLAIMERS
CQR ISSUE 3 | August 2011