Embed Size (px)
Citation preview

61 Broadway New York, NY 10006 212.482.0900 www.kalotay.com
Where is the Option?Prepayment Modeling of MBS
April 30, 2007
2
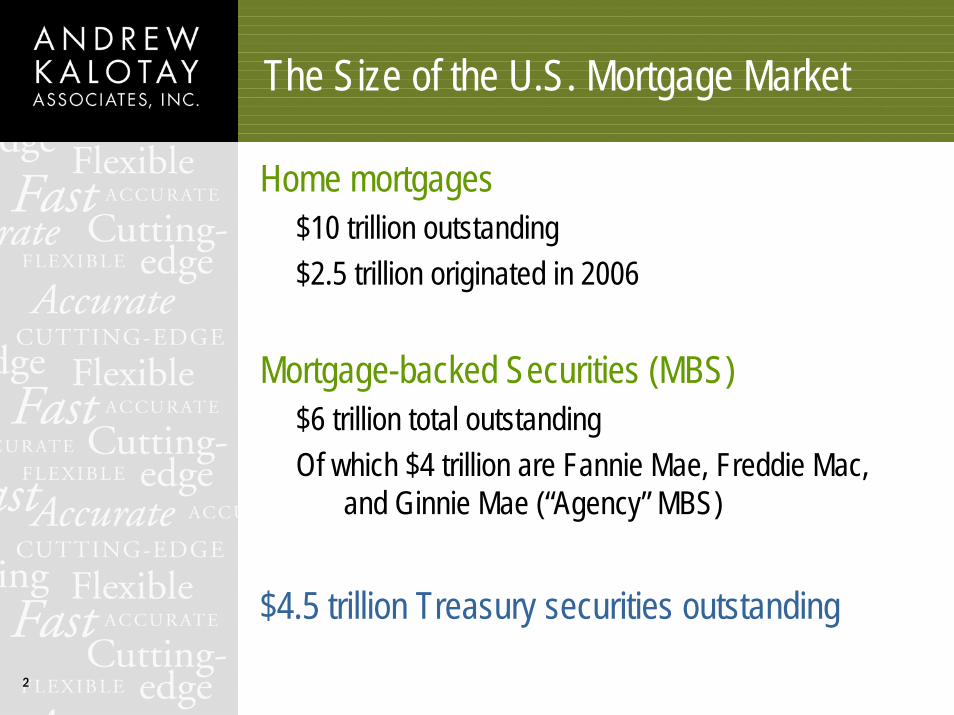
The Size of the U.S. Mortgage Market
Home mortgages$10 trillion outstanding$2.5 trillion originated in 2006
Mortgage-backed Securities (MBS)$6 trillion total outstandingOf which $4 trillion are Fannie Mae, Freddie Mac,
and Ginnie Mae (“Agency” MBS)
$4.5 trillion Treasury securities outstanding
3
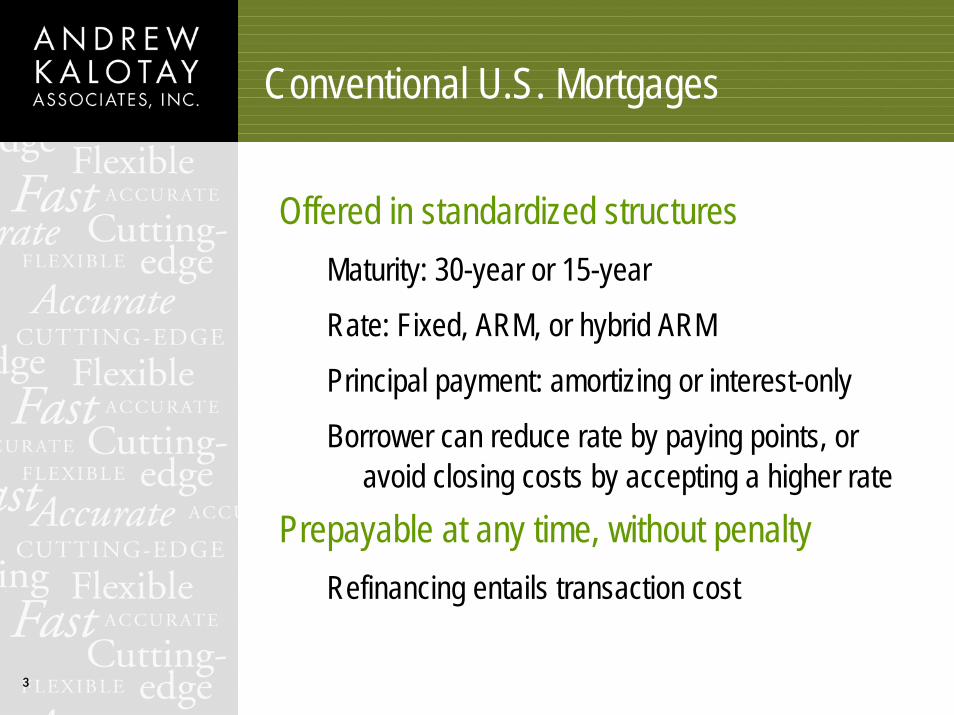
Conventional U.S. Mortgages
Offered in standardized structuresMaturity: 30-year or 15-yearRate: Fixed, ARM, or hybrid ARMPrincipal payment: amortizing or interest-onlyBorrower can reduce rate by paying points, or
avoid closing costs by accepting a higher ratePrepayable at any time, without penalty
Refinancing entails transaction cost
4
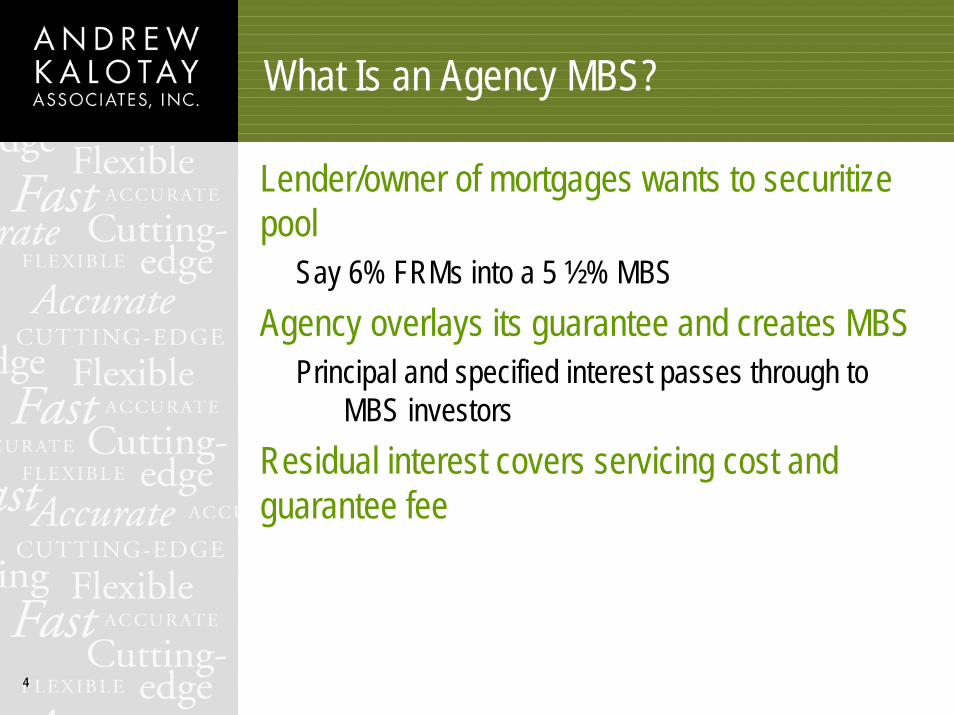
What Is an Agency MBS?
Lender/owner of mortgages wants to securitize pool
Say 6% FRMs into a 5 ½% MBSAgency overlays its guarantee and creates MBS
Principal and specified interest passes through to MBS investors
Residual interest covers servicing cost and guarantee fee
5
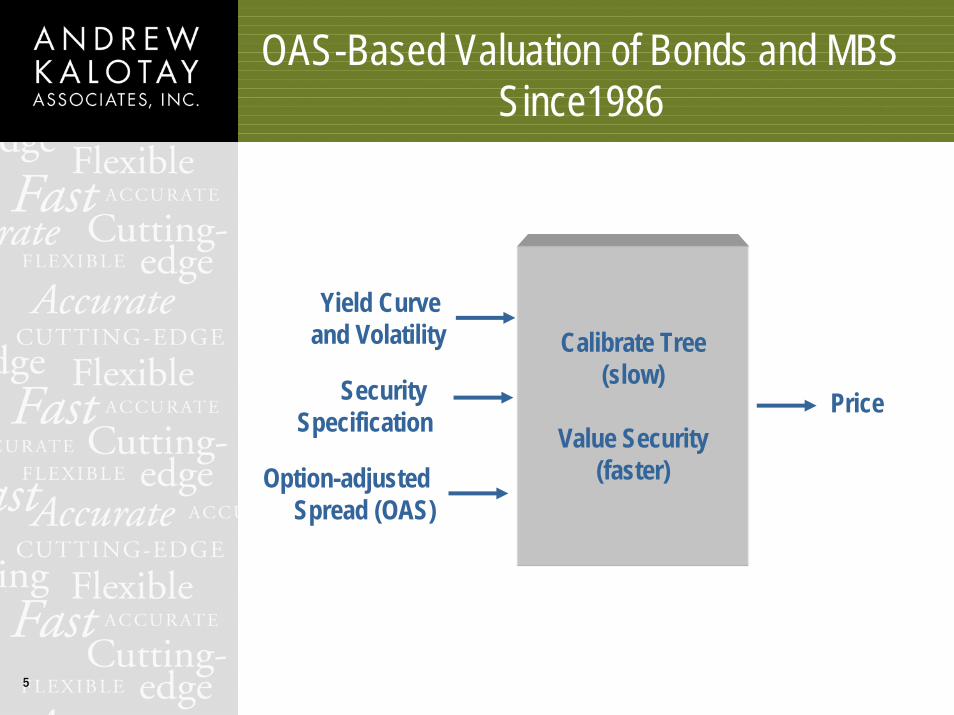
OAS-Based Valuation of Bonds and MBS Since1986
Calibrate Tree(slow)
Value Security(faster)
Yield Curve and Volatility
Security Specification
Option-adjusted Spread (OAS)
Price
6
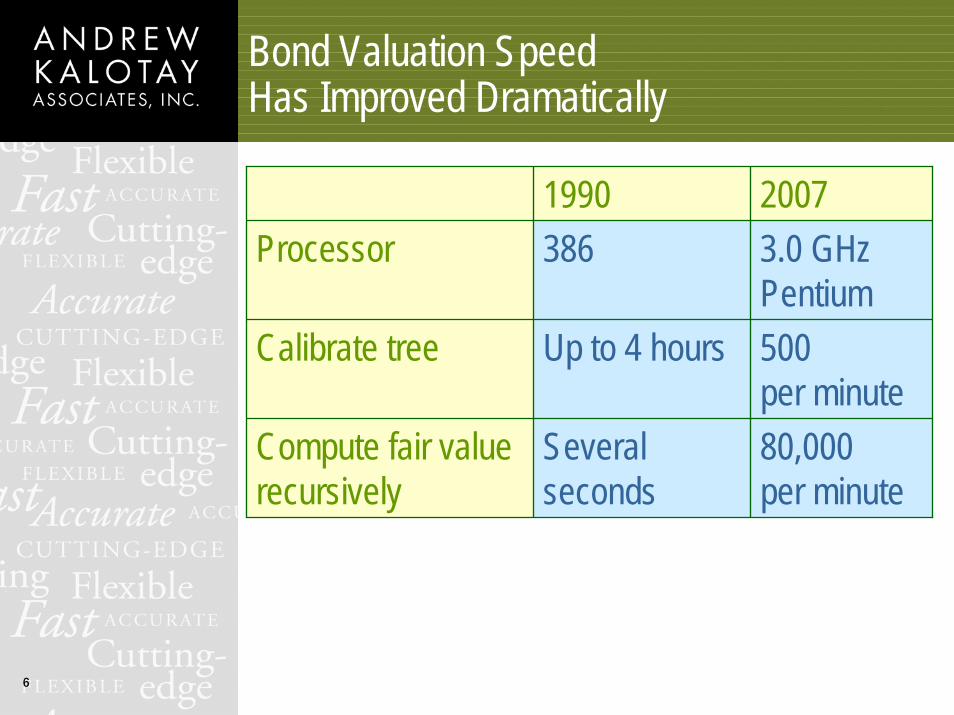
Bond Valuation SpeedHas Improved Dramatically
1990 2007Processor 386 3.0 GHz
PentiumCalibrate tree Up to 4 hours 500
per minuteCompute fair valuerecursively
Several seconds
80,000per minute
7
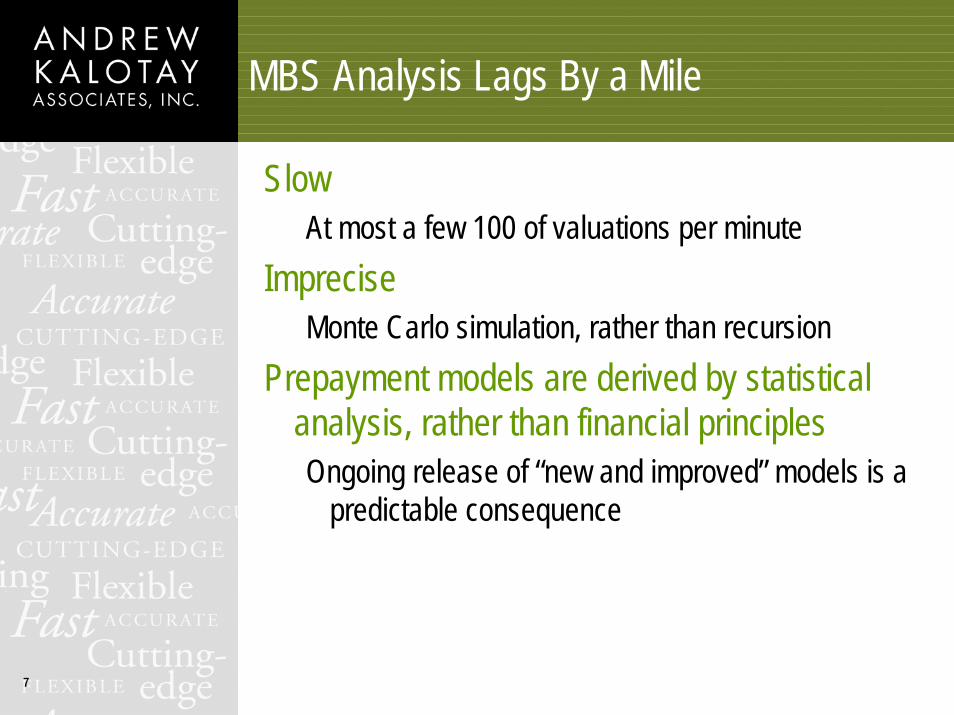
MBS Analysis Lags By a Mile
SlowAt most a few 100 of valuations per minute
ImpreciseMonte Carlo simulation, rather than recursion
Prepayment models are derived by statistical analysis, rather than financial principlesOngoing release of “new and improved” models is a
predictable consequence
8
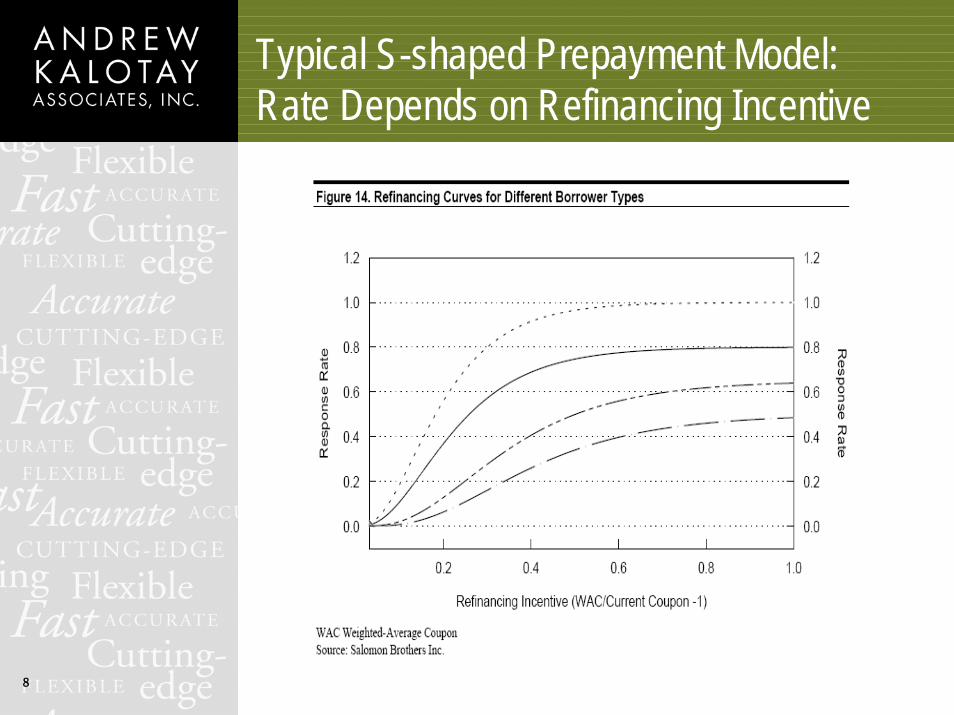
Typical S-shaped Prepayment Model:Rate Depends on Refinancing Incentive

9
MBS Models Can’t Cope withPertinent “What if” Questions
What if refis were optimal?(MBS yields would increase by 10 to 15 bps)
What if borrowers gave up the right to refi?(MBS yields would decline by 45 to 50 bps)
How sensitive are MBS prices to closing costs?
Can prepayments be sensibly modeledwithout a command of refis?
10
The right approach to MBS valuation:Understand mortgages; the rest will follow
11
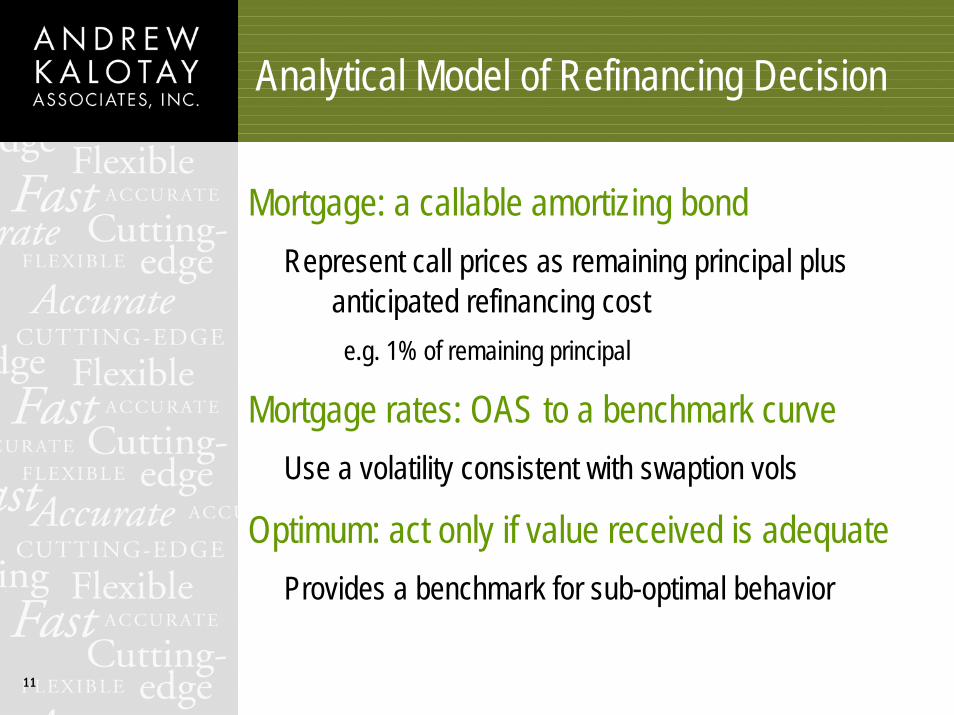
Analytical Model of Refinancing Decision
Mortgage: a callable amortizing bondRepresent call prices as remaining principal plus
anticipated refinancing coste.g. 1% of remaining principal
Mortgage rates: OAS to a benchmark curveUse a volatility consistent with swaption vols
Optimum: act only if value received is adequateProvides a benchmark for sub-optimal behavior
12
The Right Decision Tool IsGeneralized Refunding Efficiency
ValueOptionSavingsPVEfficiencygen ∆
=

13
Refinance or Wait? Decide Like a Professional!
See www.kalotay.com/calculators13
14
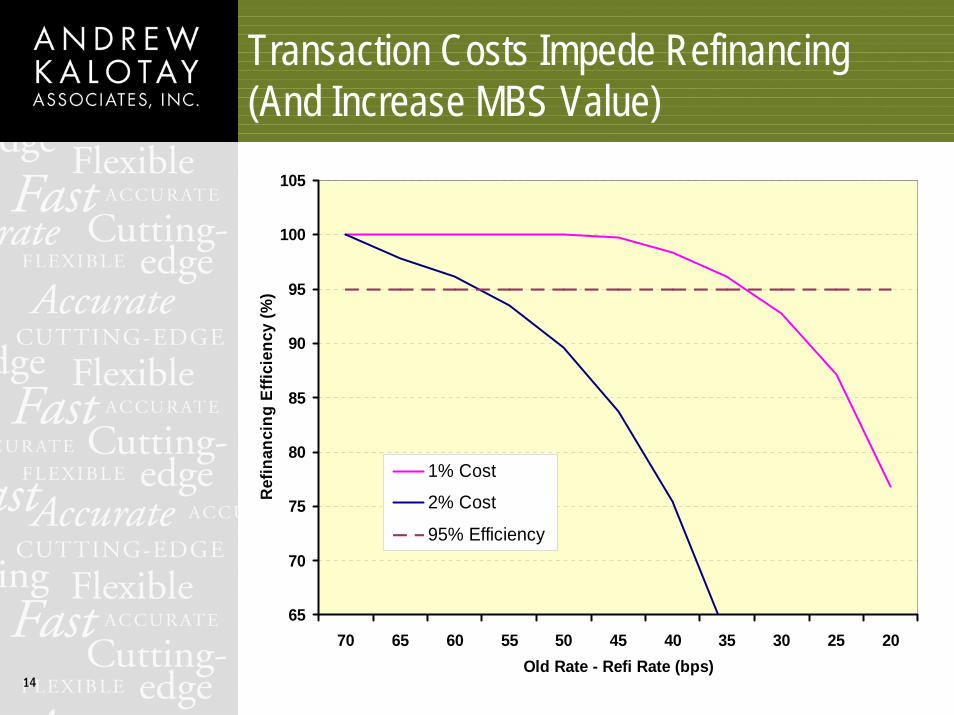
Transaction Costs Impede Refinancing(And Increase MBS Value)
65
70
75
80
85
90
95
100
105
70 65 60 55 50 45 40 35 30 25 20Old Rate - Refi Rate (bps)
Ref
inan
cing
Effi
cien
cy (%
)
1% Cost
2% Cost
95% Efficiency
15
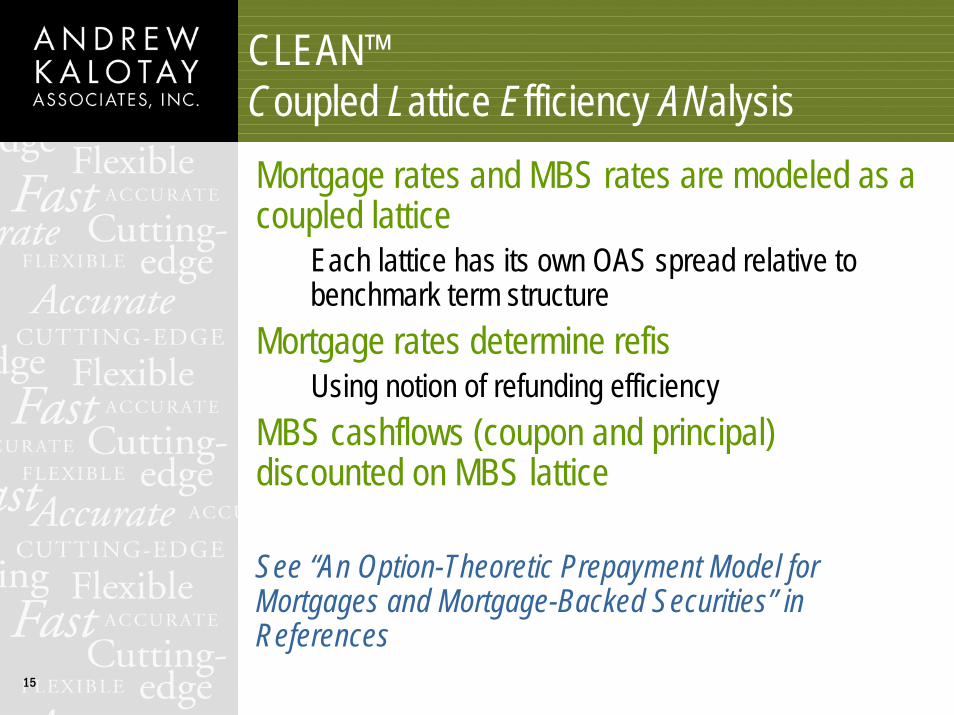
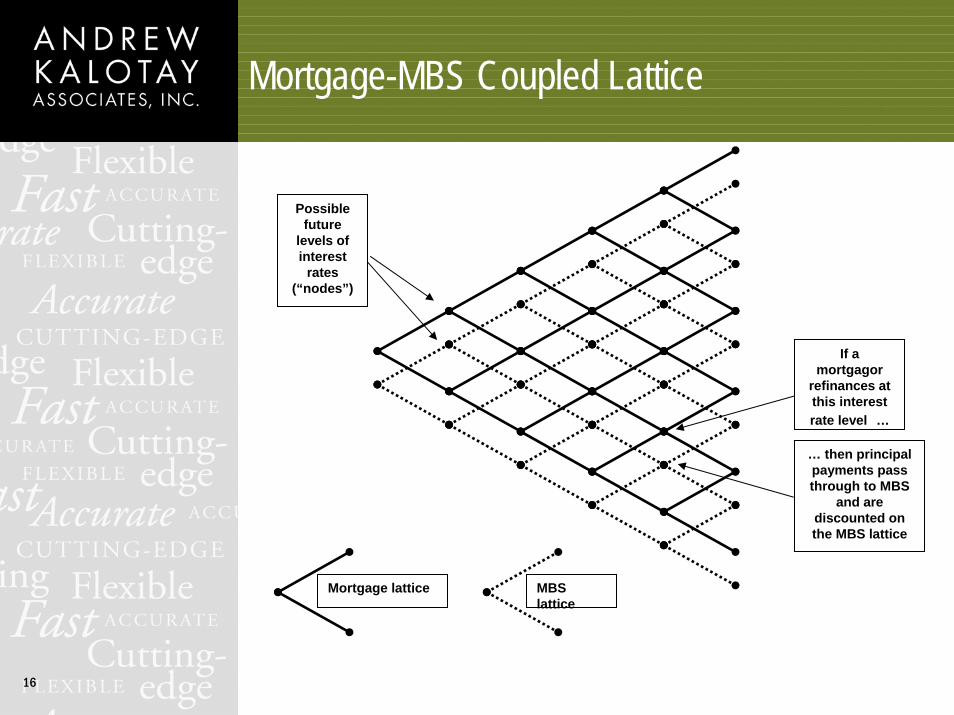
CLEAN™Coupled Lattice Efficiency ANalysisMortgage rates and MBS rates are modeled as a coupled lattice
Each lattice has its own OAS spread relative to benchmark term structure
Mortgage rates determine refis Using notion of refunding efficiency
MBS cashflows (coupon and principal) discounted on MBS lattice
See “An Option-Theoretic Prepayment Model for Mortgages and Mortgage-Backed Securities” in References
16
Mortgage-MBS Coupled Lattice
Mortgage lattice MBS lattice
Possible future
levels of interest
rates (“nodes”)
If a mortgagor
refinances at this interest rate level …
… then principal payments pass through to MBS
and are discounted on the MBS lattice
17
CLEAN™ Framework for Prepayments
A deterministic model of turnover Say a specified annual rate
A simple but complete parametrization of interest rate driven refinancings
A wide spectrum of refinancing behavior Pool is divided into several buckets
• Financial engineers, leapers, and laggards For a given behavior, prediction is straightforward
Burnout is a natural consequence of the modelAs “leapers” refinance, pool becomes weighted towards “laggards”

18
Modeling Laggards
Each mortgagor is assigned an “imputed” coupon representing refinancing behavior
Refinancing is triggered when a Financial Engineer would refinance a mortgage with the imputed coupon
A 7% mortgagor whose imputed coupon is 6% is a1% Laggard
19
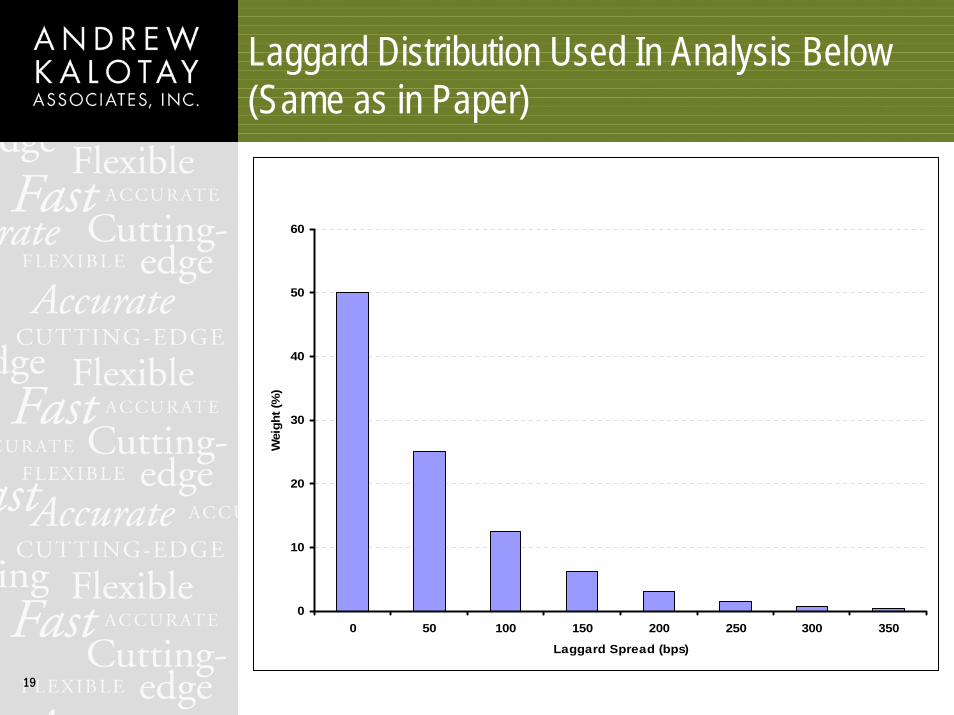
Laggard Distribution Used In Analysis Below (Same as in Paper)
0
10
20
30
40
50
60
0 50 100 150 200 250 300 350
Laggard Spread (bps)
Wei
ght (
%)
20
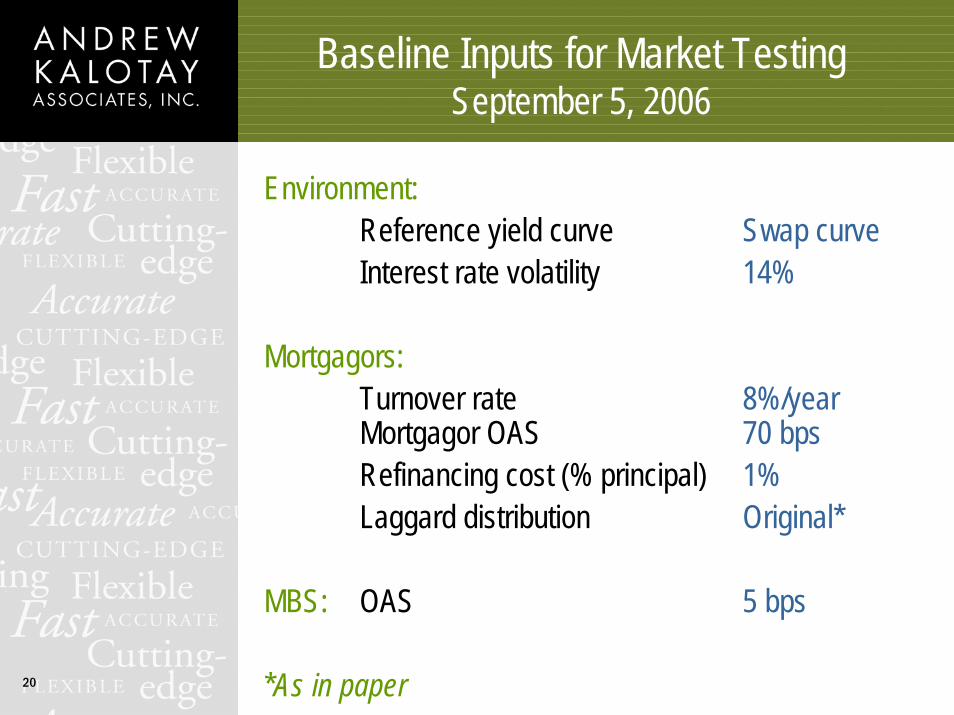
Baseline Inputs for Market Testing September 5, 2006
Environment:Reference yield curve Swap curveInterest rate volatility 14%
Mortgagors:Turnover rate 8%/yearMortgagor OAS 70 bpsRefinancing cost (% principal) 1%Laggard distribution Original*
MBS: OAS 5 bps
*As in paper
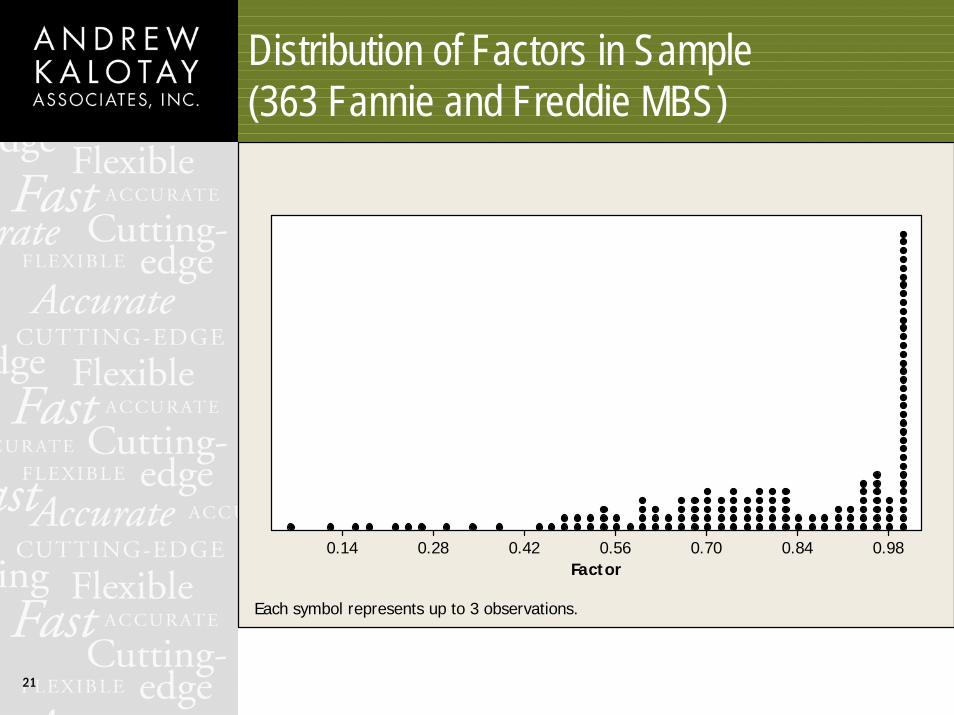
21
Distribution of Factors in Sample (363 Fannie and Freddie MBS)
Factor0.980.840.700.560.420.280.14
Each symbol represents up to 3 observations.
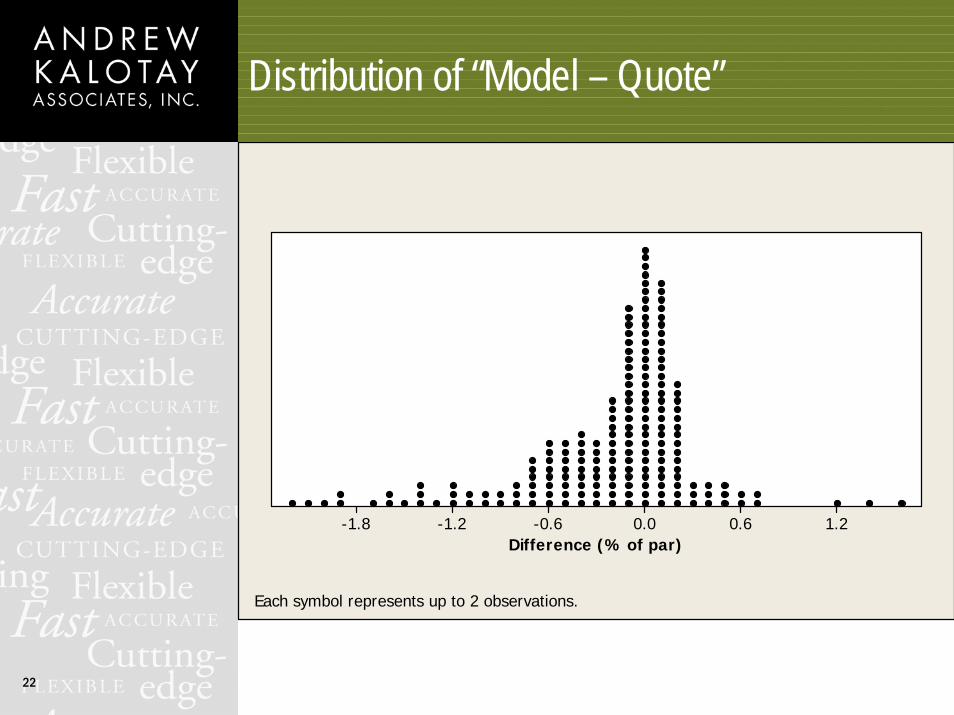
22
Distribution of “Model – Quote”
Difference (% of par)1.20.60.0-0.6-1.2-1.8
Each symbol represents up to 2 observations.
23
Baseline Inputs UndervalueRecent High-Coupon MBS
Above-market WAC reflects weaker credit, which impedes refis
Flat 70 bps OAS overestimates mortgagor’s ability to refi and thus undervalues MBS
The cause suggests a cureIncrease mortgagor OAS to reflect weaker credit Slows down refis and increases MBS value
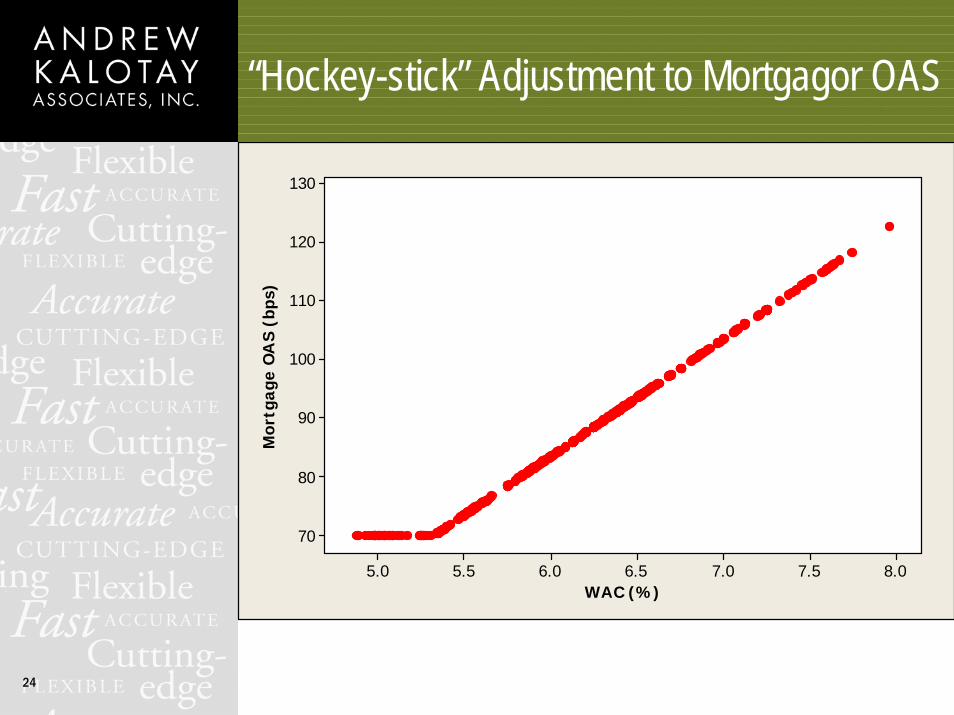
24
“Hockey-stick” Adjustment to Mortgagor OAS
WAC (%)
Mor
tgag
e O
AS
(bps
)
8.07.57.06.56.05.55.0
130
120
110
100
90
80
70

25
Model Values of High-Coupon MBS Improve
MBS Coupon (%)
Diff
eren
ce (
% o
f pa
r)
7.06.56.05.55.04.5
2.5
2.0
1.5
1.0
0.5
0.0
-0.5
-1.0
0
26
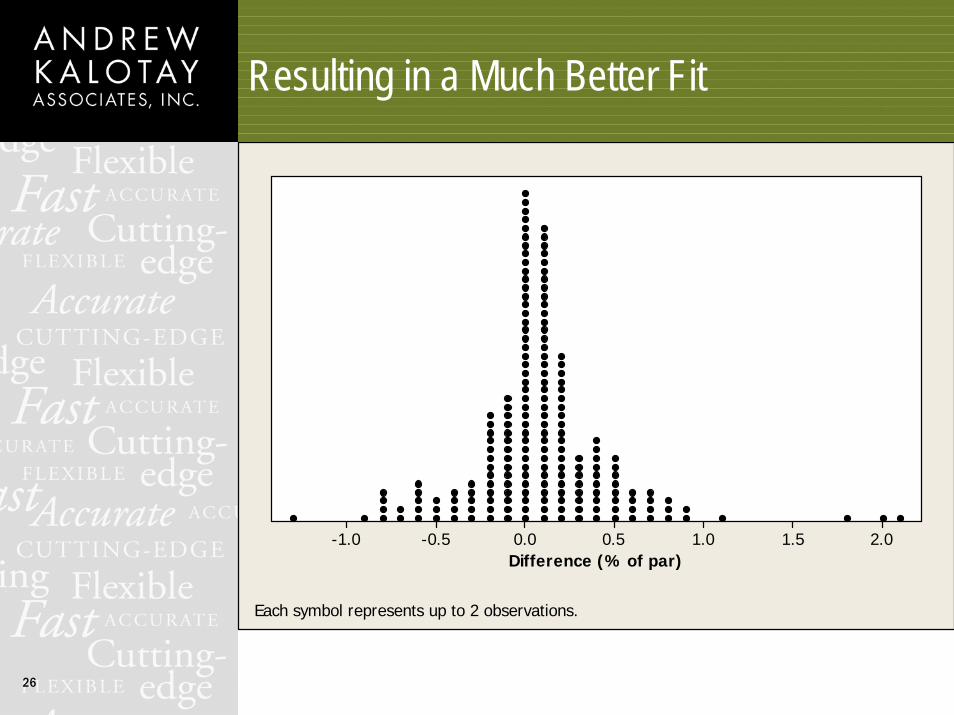
Resulting in a Much Better Fit
Difference (% of par)2.01.51.00.50.0-0.5-1.0
Each symbol represents up to 2 observations.
27
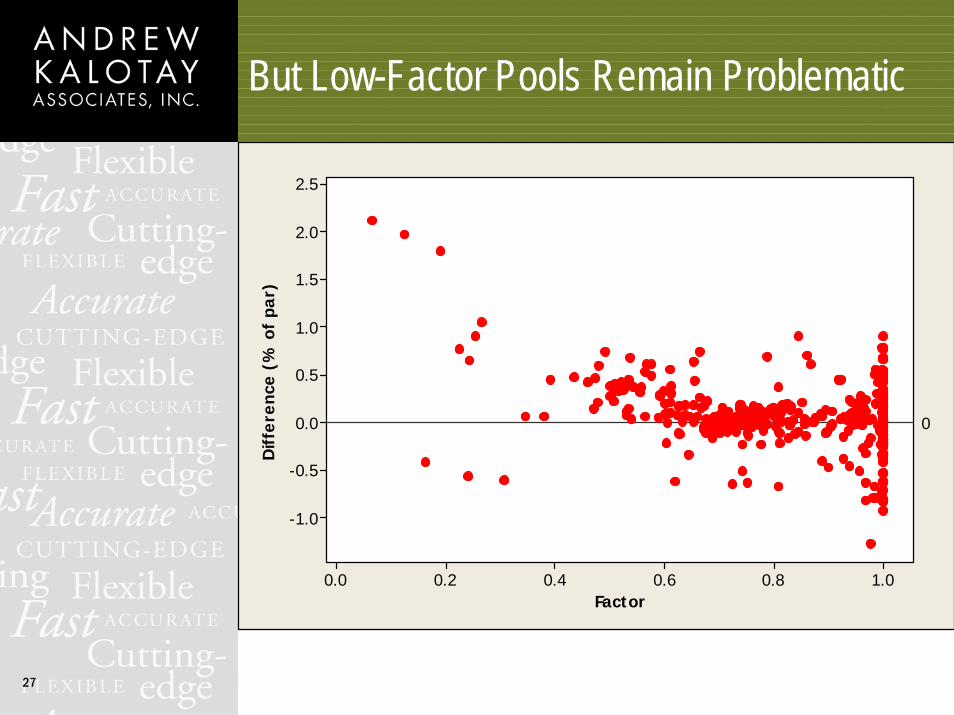
But Low-Factor Pools Remain Problematic
Factor
Diff
eren
ce (
% o
f pa
r)
1.00.80.60.40.20.0
2.5
2.0
1.5
1.0
0.5
0.0
-0.5
-1.0
0
28
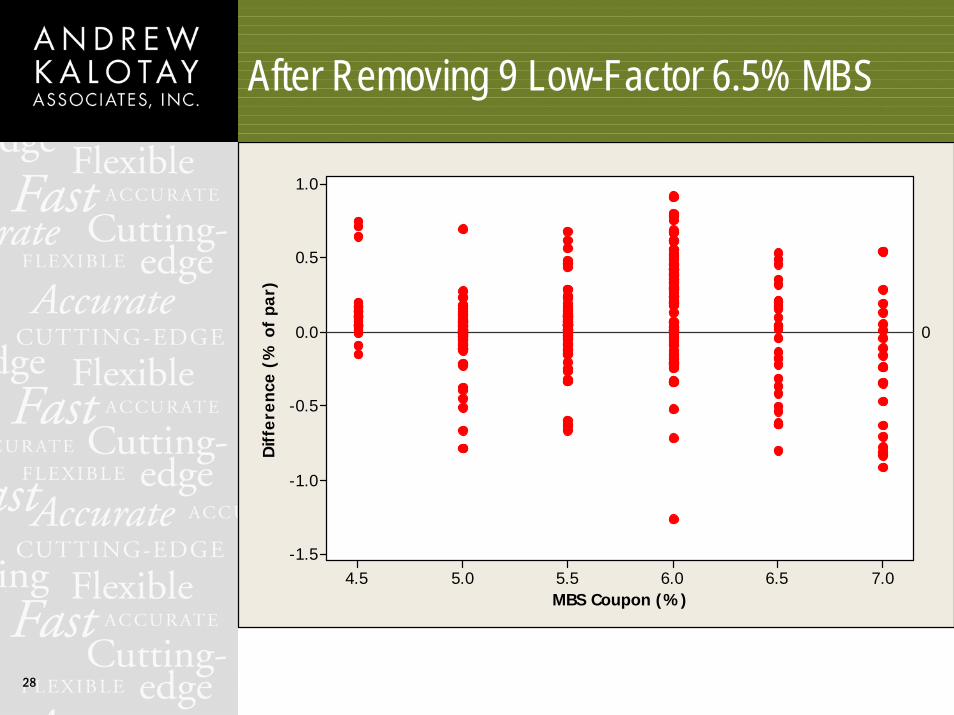
After Removing 9 Low-Factor 6.5% MBS
MBS Coupon (%)
Diff
eren
ce (
% o
f pa
r)
7.06.56.05.55.04.5
1.0
0.5
0.0
-0.5
-1.0
-1.5
0
29
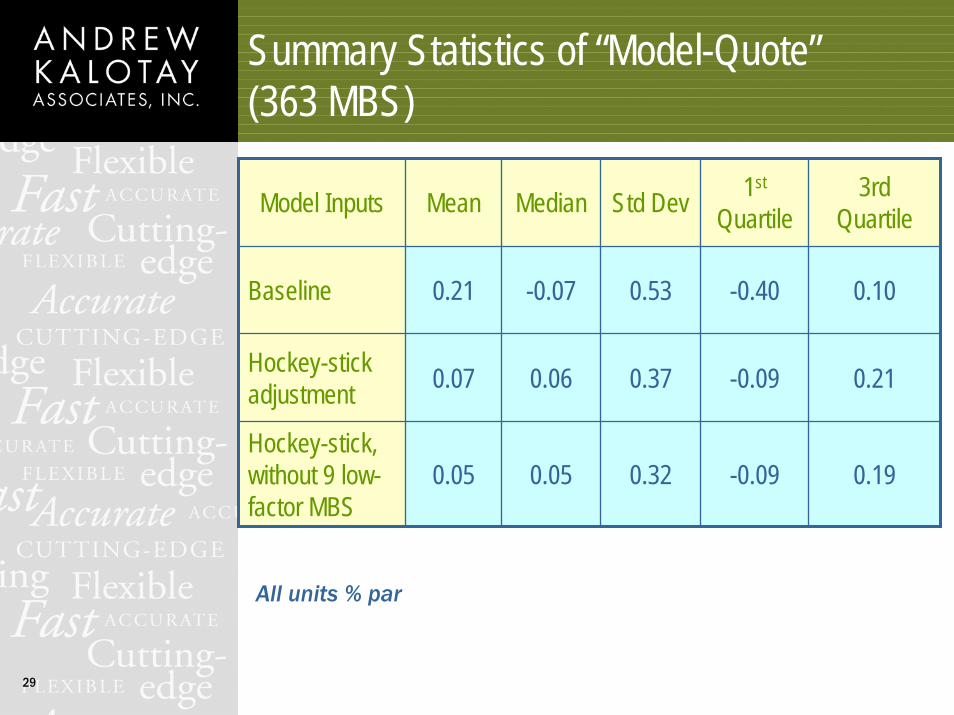
Summary Statistics of “Model-Quote”(363 MBS)
Model Inputs Mean Median Std Dev 1st
Quartile3rd
Quartile
Baseline 0.21 -0.07 0.53 -0.40 0.10
Hockey-stick adjustment 0.07 0.06 0.37 -0.09 0.21
Hockey-stick, without 9 low-factor MBS
0.05 0.05 0.32 -0.09 0.19
All units % par
30
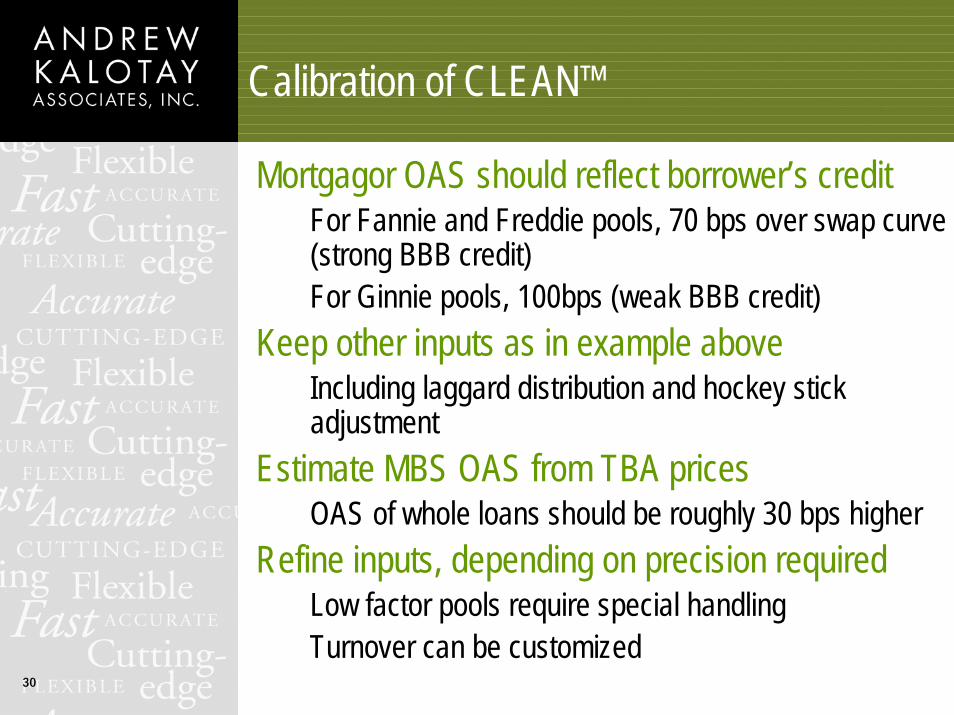
Calibration of CLEAN™
Mortgagor OAS should reflect borrower’s creditFor Fannie and Freddie pools, 70 bps over swap curve (strong BBB credit)For Ginnie pools, 100bps (weak BBB credit)
Keep other inputs as in example aboveIncluding laggard distribution and hockey stick adjustment
Estimate MBS OAS from TBA pricesOAS of whole loans should be roughly 30 bps higher
Refine inputs, depending on precision requiredLow factor pools require special handlingTurnover can be customized
31
Applications of CLEAN™
End-of-day pricing850,000 fixed-rate Agency MBS by NYSE/Sector
Electronic tradingIndicative pricing for buy-side platform
Risk managementHigh-speed stress testing
Real-time portfolio analysis
32
Why is CLEAN™ a Good Model?
Fully consistent with analysis of swaps and bondsIncluding volatility-dependent option exercise and interpretation of OAS
Expected prepayment behavior is inferred from the market, rather than history
Just as options trade on implied volatility User has full control of model
Including parameterization of refinancing behaviorQuick and accurate calculation of prices and sensitivities
10,000 recursive valuations per minute
33
References
“Optimum Bond Calling and Refunding”, W. M. Boyce and Andrew J. Kalotay, Interfaces (November 1979)
“An Option-Theoretic Prepayment Model for Mortgages and Mortgage-Backed Securities”, Andrew Kalotay, Deane Yang, and Frank Fabozzi, International Journal of Theoretical and Applied Finance (December 2004)
“Is There a Financial Engineer in the House,” Andrew Kalotay, Financial Engineering News (March/April 2006)
“Refunding Efficiency: A Generalized Approach”, Andrew Kalotay, Deane Yang, and Frank Fabozzi, forthcoming in Applied Financial Economics
“Optimum Refinancing: Bringing Professional Discipline to Household Finance”, Andrew Kalotay, Deane Yang, and Frank Fabozzi, working paper
“A Pointer on Points,” Andrew Kalotay and Jinghua Qian, forthcoming in OR/MS TodayFor Calculators, see www.kalotay.com/calculatorsCLEAN™ available at www.kalotay.com/downloads/clean