Embed Size (px)
Citation preview
Where does Microfinance Flourish?Microfinance Institution Performance
in Macroeconomic Context
Christian Ahlin
Jocelyn LinMichael Maio∗
August 2008
Abstract
Microfinance institutions (“MFI”s) are often evaluated for purposes of emulation,
replication, and funding. However, one potential ingredient of their success that has
not been sufficiently explored is the country-level context, in particular macroeconomic
and macro-institutional features. Understanding these linkages can make evaluation
more accurate and, further, can help to locate microfinance in the broader picture
of economic development. We merge 4-11 years of data on each of 329 MFIs from
70 countries with country-level macroeconomic and institutional data. We find that
growth has a significant and beneficial impact on MFI performance, in terms of financial
sustainability, default rates, and loan-size growth. Financial depth is associated with
lower operating costs, lower default rates, and lower interest rates, suggesting that
competition benefits micro-borrowers. However, labor force participation rates and the
share of manufacturing in the economy appear to affect MFIs adversely, particularly
their rate of growth in outreach. We also document relationships between inequality,
remittances, FDI, and the service sector, respectively, and MFI performance. Several
measures of institutional quality are found to be associated with higher MFI operating
costs and slower loan-size growth, while an index of credit information availability is
strongly associated with lower MFI operating costs. Overall, the results suggest that
the country context is an important determinant of MFI performance, though not
moreso than MFI-specific factors. MFI performance should be handicapped for the
environment in which it was achieved.
∗We thank Jeremy Atack, Mario Crucini, Todd Elder, Suhas Ketkar, Tong Li, John Siegfried, and JeffWooldridge for helpful comments and advice. Lauren Merrell provided excellent research assistance. Allerrors are our own. Contact: [email protected].
1
1 Introduction
The microfinance movement is large and growing. It is reported that more than 100 million
customers worldwide are borrowing small loans from around 10,000 microfinance institutions
(“MFI”s).1 A great deal of attention and funding has been directed toward microfinance by
the development community over the past few decades.
Levels of success, however, vary across MFIs. Some fail and cease to be; others grow
to reach millions of borrowers, covering costs in the process. In this context, evaluation of
MFIs is a critical exercise, and indeed, a growing literature seeks to discover key ingredients
of MFI success. The focus of this literature is typically on institution-specific practices and
techniques – contract innovations, management techniques, organizational structure. This
focus is justifiable: institution-specific factors are what can be controlled most readily by
those who would start new MFIs or advise existing ones.
However, in the attempt to discover determinants of micro-financial success, scant atten-
tion has been paid to factors that are outside the control of an MFI. In particular, little is
known about what portion of an MFI’s success is determined by the macroeconomic struc-
ture and outcomes of the country where it is located.Is the relationship between an MFI
and its host economy best characterized by interdependence, rivalry, or a dualistic indepen-
dence? Is it harder to break even in a poor or low-growth economy, so that a longer period
of start-up subsidization is reasonable? Does the broader institutional environment matter
for MFI performance, above and beyond any impact it has on growth? Here is where this
paper’s focus lies.
These questions are important for several reasons.For one, MFIs are often assessed and
compared for purposes of evaluation, funding, and replication. But any comparison that does
not take into account the macro-economic and macro-institutional environment, if these are
found to robustly and non-negligibly predict MFI performance, is incomplete.Accounting for
context allows a clearer picture of institutional success and failure to emerge.
1See Bellman (2006).
2
Consider two well-known, much-studied, and widely imitated MFIs: Bank Rakyat In-
donesia (BRI) and the Grameen Bank of Bangladesh. Often omitted in discussions of these
institutions is that the macroeconomic context over much of their histories was very different:
Indonesia averaged 5.0% growth in real GDP per capita over 1980-1997, while Bangladesh
averaged 1.7% over the same period. One wonders how much of BRI’s success and finan-
cial sustainability during this period was due to institution-specific practices and how much
came simply because the economy was booming?2 Conversely, might the Grameen Bank have
achieved greater financial sustainability3 had it operated in a more vibrant macroeconomic
context? Questions like these are rarely asked, let alone answered, in the literature.
Understanding the macroeconomic impact on MFIs may also help a growing number
of investment funds that target their dollars toward MFIs, sometimes with the dual goal of
earning returns for investors and achieving social impact.4 Since they value financial returns,
these funds cannot afford to ignore major determinants of MFI financial success – though
for dual-purpose investors the return implications would have to be weighed against social
impact considerations.
Beyond sharpening MFI evaluation, answers to the question of where MFIs tend to
flourish can provide indirect evidence on how micro-credit works and how it fits into the
process of development.5 For example, is it rivalrous or complementary with a development
path based on industrialization, manufacturing, and foreign trade and investment? Does it
work best in the context of well-developed institutions, or dogood institutionstend to squeeze
it out, perhaps prematurely? How do MFIs perform in countries with greater financial depth?
All of these questions are addressed by the results in this study.
It should be emphasized that impacts of key macroeconomic or macro-institutional vari-
2This point is emphasized in a provocative way by Henley (forthcoming), who argues that BRI and otherIndonesian micro-banks owe most of their recent success to the Indonesian macroeconomic boom.In essence,the argument goes that regarding specific policies, contracts, or institutional arrangements, the picture ismuch more one of continuity than of change, especially compared to the rapid macroeconomic acceleration.
3Morduch (1999) provides an analysis of Grameen financial results.4See Silverman (2006), and Krauss and Walter (2008).5Ahlin and Jiang (2008) explore the latter question theoretically.
3
ables are not often clear a priori. Take per-capita income growth rates. High growth can
increase demand and createnew niches for micro-enterprises to fill as well as profitable ex-
pansion opportunities for existing ventures.A growing economy might also raise households’
current or expected future incomes to the degree that they are willing to take on more
risk by investing capital in a business venture. Ingredients of growth – increasing physical
and human capital, better institutions, technological advancement – may also make micro-
entrepreneurship more profitable.
On the other hand, it is easy to argue that microfinance depends on a poor economy to
survive, since MFIs have not seemed to fare as well among poorer populations of developed
countries. Microfinance may tend to thrive where there is a vibrant informal economy, a
situation that tends to grow rarer as an economy grows. Further, it seems plausible that
the growing abundance of wage-earning opportunities that often accompanies growth may
siphon away current and potential clients from MFIs. Default may also be higher, since
growth of economic opportunities can weaken borrowers’ incentives to maintain their MFI
credit relationships. A deceleration of growth may also raise demand for products produced
by micro-enterprises as consumers substitute away from imports or higher quality goods.6
As an intermediate option, it may be that most micro-credit clients operate in small,
segmented local markets that are not very sensitive to macroeconomic conditions.7 Inshort,
the relationship between growth and MFI performance does not at all seem pinned down by
a priori considerations, raising the need for empirical evidence.
Consider also an institutional outcome such as corruption. It may be that high corruption
taxes micro-enterprise operations and creates barriers to their expansion, reducing demand
for and quality of micro-loans. On the other hand, corruption may make it easier for micro-
enterprises to avoid regulations, or may push would-be entrepreneurs out of the formal
economy and the formal credit market and into informal micro-enterprise with demand for
6Patten et al. (2001) make a similar point.7For example, work of Patel and Srivastava (1996) suggests that the official and unofficial economy in
India move relatively independently of each other.
4
micro-loans.
This paper addresses empirically the question of MFI dependence on the macroeconomic
context. Data on MFIs come from the Mix Market. We construct a panel dataset that in-
cludes only MFIs ranked as having relatively high data quality and with at least four years of
data on a key variable. This leaves us with 1912 observations on 329 MFIs from 70 countries
(in the largest regression). We analyze two types of MFI performance variables: operational
self-sufficiency (revenues/costs) and growth. Operational self-sufficiency is decomposed into
three components: interest markup (average interest rate minus average cost of capital),
losses due to default, and operating costs. These decompositions allow us in some cases
to identify the channel through which a given variable affects operational self-sufficiency.
Growth in dollars loaned is decomposed into two components: extensive margin growth (in
number of borrowers) and intensive margin growth (in average loan size).
We merge these data with macroeconomic variables taken from the World Bank’s database
of World Development Indicators. The four key indicators of macroeconomic performance
and structure are real per capita GDP growth rate, labor force participation rate, manu-
facturing’s share in GDP, and private credit as a fraction of GDP. A number of auxiliary
variables that reflect macroeconomic outcomes or structure, such as inflation and remittances
as a share of GDP are also taken from the WDI. Institutional measures and outcomes, some
of which are focused on credit markets, are also included, from the Kaufmann et al. (2007)
governance indicators and the Doing Business indicators of the World Bank.
MFI performance indicators are then each predicted in a pooled linear regression model
by the four key macroeconomic variables, as well as indicator variables for MFI-institution
type, MFI-age and asset variables to capture MFI age and size effects, and the previous year’s
GDP per capita level. We also run a specification that isolates within-MFI and between-
MFI variation in the key variables. Specifications are also run that add one-by-one the
other macroeconomic and institutional variables. Given the nature of the data, we focus on
estimation approaches that are robust to outliers, heteroskedasticity, and within-MFI error
5
term correlation.
Several results emerge from the baseline specification. First, macroeconomic growth is
a robust and significant predictor of higher MFI operational self-sufficiency, which auxiliary
regressions suggest is due in part to its negative relationship with default rates and operating
costs. The magnitudes are somewhat large – one percentage point of growth translates into
one and a half percentage points in the revenue/cost ratio – though far from the majority
of the story. For example, the interquartile difference in growth rates is associated with
17% of the interquartile difference in the MFI operational self-sufficiency variable. The
effect of growth on operational self-sufficiency is robust across a number of specifications,
and the same basic result obtains using only within-MFI or only between-MFI variation.
Further, macroeconomic growth is strongly related to MFI intensive growth: average loan
sizes increase 3/4 percentage points with every percentage point of growth. Overall, the
evidence suggests that while the macroeconomy is not an MFI’s destiny, its effect is significant
and should not be ignored.
Second, while the size and development of the country’s financial sector, private credit,
does not significantly affect an MFI’s operational self-sufficiency, it is strongly associated with
lower default, lower operating costs, and lower interest markups (and interest rates). This is
consistent with the idea that financial competition spurs (or selects for) more effective and
efficient intermediation, with cost savings passed on to the borrowers. The result is robust to
controlling for a number of credit market institution variables directly, suggesting the effect
is operating via competition.
Third, some evidence emerges for a rivalrous relationship between microfinance-led devel-
opment and growth based on industrialization, manufacturing, and wage work. In particular,
workforce participation and manufacturing show up as negative predictors of extensive MFI
growth, in number of borrowers. Workforce participation is also a negative predictor of MFI
operational self-sufficiency. Evidently, microfinance faces a more difficult expansion path in
countries that are following more industrial, wage-labor based paths of development.
6
Among the other macro-economic determinants, remittances emerge as a positive predic-
tor of MFI operational self-sufficiency and foreign direct investment predicts faster growth in
MFI loan sizes. These seem to be examples of synergy rather than rivalry between microfi-
nance and wage-earning opportunities; perhaps the difference is due to borrowers’ perception
of these foreign-based opportunities as relatively transitory in nature as compared with the
more domestic opportunities reflected in the variables of the previous paragraph.
The institutional variables do not typically add much predictive power to the baseline
set of control variables.8 There are some exceptions. A number of variables predict slower
growth in MFI loan size, including regulatory quality, a rigidity of employment index, and
indices capturing credit rights and credit information availability, respectively. Regulatory
quality, government effectiveness, and rule of law all predict higher operating costs driven by
smaller loan sizes rather than higher costs per borrower. One interpretation (among several)
is that well-meaning regulations that are enforced can actually stifle informal enterprise,
leading micro-borrowers to start and stay smaller.9
More positively, the credit information index is associated with a significant drop in
operating costs per dollar loaned, and this appears to be mostly passed on to borrowers via
lower interest markups. This result is consistent with MFIs economizing on screening and
monitoring when good information systems are in place, and is suggestive of the importance
of credit information institutions.
Overall, the results give evidence that MFI performance is non-negligibly driven by the
surrounding macroeconomic and institutional environment. Consequently, an MFI should
be judged in context.
The paper is organized as follows. Section 2 describes the data and variables. Section 3
describes estimation methodology. Section 4.1 reports the baseline (pooled) results, as well
8Nor do they much affect the estimated relationship between macroeconomic growth and MFI operationalself-sufficiency; see section 5.2.
9A more favorable interpretation of weaker loan-size growth that makes most sense with the credit rightsand information indices is that good credit institutions ease the path of graduation to the formal creditsector and away from micro-finance institutions (and hence out of the data).
7
as the results isolating within-MFI and between-MFI variation. Sections 4.2 and 4.3 present
the results on additional macroeconomic variables and institutional variables, respectively.
Section 5 discusses causality and performs some additional robustness tests. Section 6 dis-
cusses the related literature and the specific contribution of this paper. Section 7 concludes.
2 Data
The dataset is assembled from several sources. Microfinance institution (“MFI”) data come
from a relatively new organization called the Mix Market (mixmarket.org). This organiza-
tion’s aim is to promote “investment and information flows” within the world of MFIs and
donors, as well as to improve reporting standards in the microfinance industry. Its publicly
available website currently contains information on 1229 MFIs, 101 investors (e.g. Calvert
Foundation), and 167 partners (which tend to be umbrella organizations that facilitate mul-
tiple MFIs’ operations).10
Our dataset contains only MFIs that meet certain criteria. First, Mix Market puts
the reporting MFIs into five categories – one- through five-diamond – based on amount
and reliability of information reported. We collect data only on four- and five-diamond
institutions. Institutions with data rated four-diamond and higher have financial statements
audited by a third-party accounting firm or similar; thus this seems a reasonable cutoff
for reliable and comparable data.11 Second, the dataset includes only institutions that
were founded no later than 2004 and that have four or more years of data on the key
operational self-sufficiency variable (described below), during the time of our data collection,
June/July 2008. Further, the four years of data must correspond to a calendar-year fiscal
year, for comparability to the annual country-level data discussed below. Third, MFIs
reporting that the percentage of their operations comprised by microfinance is 80% or below
10Descriptive information here and below is taken from the mixmarket.org website during June/July 2008.11Audit reports often explicitly state that they comply with international accounting standards, raising our
confidence that the data are comparable across banks. However, we also use several econometric approachesthat allow for MFI-specific differences in reporting standards: clustering standard errors at the MFI-leveland using only within-MFI variation. See section 3.
8
are excluded. Fourth, only MFIs that report one of the following institutional types are
included: bank, cooperative/credit union, non-bank financial institution, and non-profit
(NGO). This excludes the two smallest categories: rural banks and “other”, the former
because it does not have enough observations (only four rural banks, all in the Philippines,
meet the preceding criteria) and the latter because it is too vague.12 Finally, MFIs from
Afghanistan, East Timor, Kosovo, Palestine, and Serbia and Montenegro are excluded for
lack of available country data.
In all, we have 329 MFIs with sufficient data, from 70 countries, each with 4-11 years
of data (on at least the key variable) from the years 1996-2006. Many are relatively small,
though some large and well-known institutions are included, e.g. ASA, BRAC, and the
Grameen Bank of Bangladesh. The breakdown by institutional type is as follows: 42 co-
operative/credit unions, 27 banks, 125 non-bank financial institutions, and 135 non-profit
NGOs. The breakdown by region is: 12 from South Asia,13 28 from East Asia and the
Pacific, 67 from Eastern Europe or Central Asia, 18 from the Middle East or North Africa,
72 from sub-Saharan Africa, and 132 from Latin America.
While the MFI sample is quite geographically dispersed and varied in other ways, e.g.
size, we cannot claim it is a representative sample of the MFI universe. Rather, it is selected
based on availability and quality of data, as described above, as well as desire to publicly
report it. All results should be viewed in that light.
We use several performance indicators from these MFI data, summarized in Table 1a.
The focal indicator is called operational self-sufficiency. It is the ratio of annual financial
revenue to annual total expense (which equals financial expense plus loan loss provision
expense plus operating expense). Hence, a number greater than one (100%) indicates that
the MFI has sufficient revenue from lending to cover its costs, including the cost of capital,
accounting for bad loans, and paying operating expenses.
12Institutional type and percentage of operations devoted to micro-finance are reported only as currentvariables rather than year-by-year.
13This number would be higher except for the non-calendar year reporting of many MFIs from South Asia,especially India.
9
The ability to cover costs thus depends on doing well in some combination of three
categories: financial revenue versus costs (ignoring default); default costs; and operating
costs. Informative measures exist for each of these three categories.
Our main indicator of financial revenue versus costs is the interest markup. This equals
the difference between its two components, the average interest rate (financial revenue per
dollar loaned) and the average cost of capital (financial expenses per dollar loaned).14
Two indicators are used to measure default costs. The loan loss expense rate is the
amount provisioned for bad loans as a fraction of the average loan portfolio over the year.15
This is supplemented by a more mild measure, the PAR-30, which gives the fraction of the
loan portfolio that has been considered at risk (e.g. behind schedule with payments) for
more than a month. Some of these loans are eventually repaid, but this is an early indicator
of default problems and one perhaps more objectively measured (in terms of timing, at least)
than the loan loss expense rate.
We measure operating costs mainly by the operating cost per dollar loaned, which equals
annual operating costs divided by the year-average size of the loan portfolio. This can be
decomposed as the product of the operating cost per borrower and (the reciprocal of) the
average loan size;16 in other words, lower costs per dollar loaned can come from lower costs
per borrower or larger average loans. This is a potentially interesting decomposition if costs
per borrower are largely fixed, i.e. do not vary much with loan size, as is often argued.
A second category of outcome variable focuses on growth of the MFI. Perhaps the simplest
measure would be portfolio growth, annual growth in total dollars loaned. We focus instead
14These are not directly reported, but are calculated from the reported financial revenue per asset andfinancial expense per asset ratios. These ratios are renormalized, multiplying by the year-average asset-holdings and dividing by the year-average loan portfolio. (Year-average amounts are calculated averagingthe previous year’s and current year’s reported values, since these values apply to the final day of the year.)
15This too is reported with average asset-holdings in the denominator; we renormalize by average size ofloan portfolio.
16The former is reported directly. The latter is calculated as the operating cost per borrower dividedby the operating cost per dollar loaned, or alternatively as the year-average loan portfolio divided by theyear-average number of active borrowers. In the vast majority of cases, both approaches yield non-missingvalues. When they do, they are virtually identical, up to rounding error; one predicts the other with anR2 = 1.0000. In a handful of cases, one of the two approaches yields a missing value but can be imputedfrom the other, and is.
10
on a decomposition of this MFI growth variable into growth on the extensive and intensive
margins. Note that the loan portfolio is the product of the number of borrowers and the
average loan size. It follows that portfolio growth is composed of borrower growth, i.e. annual
growth in number of borrowers (extensive margin), and loan-size growth, i.e. annual growth
in the average loan size (intensive margin).17
Finally, as control variables age is calculated using data on the year the MFI was founded;
and assets and the (current) institutional type are also collected as reported.
The MFI-level dataset is merged with country-level data from a number of sources; see
Table 1b for a description of key variables. From the World Development Indicators (WDI)
come data on real GDP per capita levels and growth rates. We focus on growth as ar-
guably the most informative single indicator of progress in economic development. It can
be considered an approximate summary statistic for the various institutional, technological,
and factor-accumulation related ingredients of economic development. Three other baseline
macroeconomic variables are drawn from the WDI, each reflecting an aspect of the macroe-
conomic environment that is potentially important to MFIs. The workforce participation
rate is the labor force divided by the population aged 15-64. This partly reflects the preva-
lence of labor opportunities in the economy, which may be complementary to micro-financed
activities or may crowd them out. The manufacturing value-added to GDP ratio, similarly,
captures the existence of a potentially alternate route to development that is associated with
wage labor rather than small enterprise. The private credit variable equals the amount of
domestic credit to the private sector, divided by GDP. It tends to be the preferred measure of
financial development in the finance and growth literature. Clearly the level of development
of the financial sector may have a significant bearing on an MFI’s ability to operate, though
it is not clear in which direction.
Other variables from the WDI are the gini coefficient of inequality,18 inflation, foreign
17Each of these growth variables is calculated as a log difference.18Since year-to-year data on inequality are typically sparse, we use for each year the average of all reported
figures over 1994-2006.
11
direct investment inflows as a percent of GDP, remittances as a percent of GDP, percent of
population in rural areas, and the share in GDP of agriculture, services, and industry.
A number of variables intended to capture various aspects of the institutional environ-
ment are also included. The Kaufmann et al. (2007) governance indicators aggregate and
normalize a number of existing country ratings along several institutional dimensions. They
produce six annual series, in all of which a higher number reflects a more ideal institutional
outcome: control of corruption, rule of law, regulatory quality, government effectiveness,
political stability/lack of violence, and voice/accountability.
A complementary approach to measuring institutional characteristics, with roots in de
Soto (1989) and pathbreaking examples in Djankov et al. (2002) and Botero et al. (2004),
seeks to quantify specific barriers to starting and operating a firm, enforcing a contract, etc.,
via detailed case studies and extensive consultation with experts. This is the approach taken
in the Doing Business indicators of the World Bank.19
From these indicators we include (where available) the number of procedures, number
of days required, the monetary cost (as a percentage of income/capita), and the monetary
plus time cost, to start a business and to enforce a contract. Also included are minimum
capital requirements for starting a formal business, as a percent of average income. In each of
these cases, restrictive institutions and regulations may harm microfinance customers in their
micro-enterprise endeavors; but they also may push households out of the formal economy
and into the market for microloans.
Doing Business indicators also measure specific aspects of the credit market. A credit
rights index captures aspects of the efficiency of the legal environment supporting lending;20 a
credit information index captures aspects of quality and accessibility of credit information;21
and two variables capture the percent of adults covered by public credit registries and private
19Since the data published each year apply to the previous year, we attribute them to the year-publishedminus one.
20There are ten components of this index, seven related to collateral (types of collateral allowed, seniorityrules, etc.) and three to bankruptcy law; see World Bank (2006, p. 67).
21There are six components of this index, reflecting various aspects of the coverage depth and quality ofinformation available via public or private credit registries; see World Bank (2006, pp. 67-8).
12
credit bureaus, respectively.
Doing Business indicators also include a summary measure of rigidity of employment
law (aggregating difficulty of hiring, difficulty of firing, and rigidity of hours), which may be
thought to affect outside options of potential micro-credit customers as well as the expansion
paths of actual customers.
3 Estimation Methodology
Let yijkt be a year-t outcome of MFI i (which is located in country j and of institutional
type k); and Xjt be a set of macroeconomic variables describing country j at time t. The
baseline specification pools all MFIs and estimates
yijkt = α+βage ageit+βage2 age2it+βassetsln(assetsit)+βincome ln(incj,t−1)+βX Xjt +νk+εijkt.
This includes a potentially non-linear relationship between age and MFI outcomes, and
allows asset-holdings to have an effect. It also controls for the level of real GDP/capita in
the country prior to this year’s macroeconomic realizations, incj,t−1. Finally, it controls for
any level differences between institutional types.
The focal outcomes are operational self-sufficiency and the extensive- and intensive-
growth variables. We also look at the three components of operational self-sufficiency:
default, operating costs, and interest markups.22
The focal macroeconomic variables are contained in Xjt. Our baseline set includes growth
in real GDP per capita, labor force participation rate, manufacturing’s share of GDP, and
private credit.23 Additional tests add other macroeconomic variables one at a time to Xjt.
We emphasize that with all variables besides growth, estimated effects are conditional on a
22Within the following internally-related sets of variables, we use the same sample by dropping all obser-vations that do not appear in every regression in the set: operating cost per dollar loaned, operating cost perborrower, and average loan size (costs); average interest rate, average cost of capital, and average interestmarkup (financial); and growth in borrowers and growth in average loan size (growth).
23Section 2 discusses the anticipated importance of these variables in explaining MFI performance.
13
given growth rate. This isolates a variable’s effects on MFIs that operate other than through
its influence on economic growth.
Certain characteristics of the data direct our choice of estimation procedure. First, there
can be little confidence in assuming homoskedastic errors. Second, errors may be correlated
within MFIs, for example since individual MFIs do their own record-keeping or due to serially
correlated MFI-specific shocks. Third, outlier problems are potentially severe, as preliminary
work with the data made clear.
To address the outlier issue, we focus on estimating conditional median functions rather
than conditional mean functions. That is, we use median regression, which minimizes the
sum of absolute residuals rather than the sum of squared residuals and tends to be less
susceptible to outlier problems than least squares. For robustness, median regression is
supplemented by two other approaches. First, significance levels from “robust regression”
are also reported. This is a procedure that drops extreme outliers (typically zero, at most two
in our case) and then iterates using weighted least squares with weights negatively related
to the size of the residual, until the weights and coefficient estimates converge. Second, the
top and bottom {0,1,2,3,4,5}% of the sample based on the dependent variable is eliminated
and OLS is run in each of these six cases.24 The median significance level of each coefficient
across the six runs is then reported. Of course, there is no necessary reason that these
three approaches should give the same results, especially when there are valid but influential
outliers or when the underlying distribution is not symmetric. However, when the results do
coincide, it increases confidence that results are not being driven by outliers.
To address the potential heteroskedasticity and within-MFI standard error correlation,
we bootstrap standard errors and confidence intervals for both the median and robust regres-
sions, clustering the bootstrap by institution. This approach does not require homoskedas-
ticity or error terms to be independent within MFIs. Standard errors for each parameter
estimate are calculated straightforwardly from the bootstrapped estimates. Significance lev-
24We eliminate all relevant tied observations. This leads to a few cases of asymmetry due to the masspoints at zero for the default variables.
14
els of tests for zero coefficients come from eliminating two symmetric tails of the parameter
estimate data (e.g. the top and bottom 2.5% for significance at 5%) and checking whether
zero is contained within the remaining data. For the six OLS runs, significance levels are
calculated using standard methods and clustering at the institution level.
We also estimate a variation on the baseline specification that separates within-MFI
and between-MFI variation for the key macro-economic variables. That is, each regressor
can be decomposed into a within-MFI median (e.g. the median macroeconomic growth
rate for the years the MFI reports data) and a deviation from this median. We include
both of these respective components, the median and the deviation, rather than each of
the following focal variables: growth, workforce participation, manufacturing, and private
credit.2526 Significance levels are calculated as before.
A key advantage of isolating within-MFI variation in the estimation is the ability to
control for unobserved MFI (or country) attributes that may be correlated with the macroe-
conomic context and important for MFI financial sustainability. For example, it may be that
more profitable or profit-driven MFIs choose to locate in faster growing economies. Or, it
may be that a slow-changing omitted country variable, e.g. some aspect of culture, is (par-
tially) responsible for both the macroeconomic growth and the MFI performance. However,
a result obtained using only within MFI-variation is much less vulnerable to both of these
kinds of concerns.
However, a disadvantage of within-MFI variation is that it only picks up high-frequency
relationships between the variables. For example, it cannot directly address the question
of whether MFIs in consistently high-growth economies have an easier time achieving oper-
ational self-sufficiency than those in consistently low-growth economies. It also eliminates
much of the variation in slow-changing variables, also potentially decreasing the signal/noise
ratio. (This is especially true for the three focal variables besides growth, for which nearly
25In each case, only the observations used in the given regression are used to calculate the median.26One can also replicate the baseline with all variables (including the dependent variable and the controls)
set at their respective medians (between) or at their respective deviations from median (within). Results aresimilar and are not reported for brevity.
15
all variation is between-MFI variation; see Table 1b.) Estimation using only between-MFI
variation thus sheds light on more low-frequency relationships between the variables under
analysis.
4 Results
For brevity, not all results are reported in tables – unreported results are available from the
authors upon request.
4.1 Baseline Results
Baseline results from median regressions are reported in Table 2, along with significance levels
from both these and unreported robust and least squares regressions (see section 3). Table 3
reports results from a specification that separates between- and within-MFI variation, which
are also discussed here.
Growth. Quite robustly, growth impacts positively an MFI’s ability to cover costs,
operational self-sufficiency. An additional percentage point of growth is associated with a
1.5 percentage point higher revenue/cost ratio (Table 2). A difference in growth equal to
the interquartile range27 (about 3.9 percentage points) is associated with a 5.9 percentage
point higher revenue/cost ratio, which is about 17% of this variable’s interquartile range.
Put differently, a growth differential equal to the interquartile range is worth about the first
3 2/3 years of the age effect, or just under one third of the peak age effect (which occurs just
past 20 years); and is worth more than a quadrupling of MFI assets.
Thus, while the macroeconomy is certainly not an MFI’s destiny, it seems to play a
non-negligible role in an MFI’s financial success. Further insight comes from looking at the
components of operational self-sufficiency.
1) Growth could lead to higher micro-enterprise returns and the ability of MFIs to charge
27The interquartile range is a measure of dispersion less sensitive to outliers than the more commonly usedstandard deviation. It equals the difference between the 75th and 25th percentile values.
16
higher interest rates. But the impact of growth on the interest markup is negative, though
insignificant, suggesting that growth is not raising self-sufficiency by supporting higher in-
terest rates. In fact, the respective relationships (not reported) between growth and both
average interest rates and average cost of capital, the two components of the interest markup,
are negative and significant (in the former case, marginally so), while the net effect is near
zero. (The decline in the cost of capital and in interest rates are likely related to the results
of the following two paragraphs: lower default rates and operating costs.)
2) Growth clearly seems to bolster financial sustainability by reducing default. Robust
evidence for this is found in the results for the loan loss provision rate and the PAR-30.
An additional percentage point of growth is associated with a 0.07 percentage point lower
loan loss provision rate and a 0.18 percentage point lower PAR-30. The interquartile range
of growth is associated with declines in the loan loss provision rate and PAR-30 equal to
10% and 13% of their respective interquartile ranges. This result is consistent with the view
that higher growth provides greater solvency to the projects for which micro-banks lend, and
seems to belie a strict dualism between micro-financed projects and the broader economy.
3) Growth also has a detectible negative relationship with an MFI’s operating costs,
though significance of the results depends to some degree on the estimation method used.
An additional percentage point of growth reduces costs per dollar loaned by 25 basis points
and costs per borrower by two dollars. An increase in growth equal to the interquartile range
is associated with drops in costs per dollar loaned and per borrower equal to 5% and 6%
of the respective interquartile ranges. As discussed in section 2, cost per dollar loaned can
be lowered by reducing cost per borrower or by raising average loan size; but growth has a
near-zero association (not reported) with average loan sizes (in levels). Thus, it seems likely
that any cost-reducing effect comes mainly via monitoring and collection costs.
The results separating between- and within-MFI variation (Table 3) essentially echo the
baseline results. One difference comes in the magnitudes: the between (median) variables
have larger estimated effects of growth on operational self-sufficiency, default variables, and
17
operating costs. For example, a percentage point of median growth translates into nearly
2 percentage points in the revenue/cost ratio, rather than about 1.5, and lowers operating
costs per dollar loaned by 67 basis points rather than 25. By contrast, the within results
remain significant in all cases except operating costs but tend to produce smaller coefficient
estimates.28 It appears that the low-frequency growth effects are dominant in explaining
MFI performance, and in particular that operating in a persistently high-growth environment
involves a significant financial advantage.
The other key outcome variables capture growth of the MFI. The results indicate that
macroeconomic growth is not significantly related to extensive growth (in the number of
borrowers), but is quite significantly related to intensive growth (in the size of loans). Using
the point estimate, an additional percentage point of macroeconomic growth is associated
with 3/4 of a percentage point of growth in an MFI’s average loan size; the estimate is also
within a standard deviation of 1.29 One interpretation is that borrowers’ ability to expand
projects profitably (and related, perhaps their ability to meet debt obligations so as to raise
future credit limits) tend to shift up and down nearly in step with the economy as a whole,
a striking sign of interdependence. The overall explanatory power of growth is about the
same as in previous cases: about 11% of the interquartile range of loan growth is explained
by the interquartile range of macroeconomic growth. Results separating between and within
variation are quite similar.30
Labor force participation, Manufacturing. We group these together because both
seem strongly associated with the extent and availability of labor market opportunities.
Unlike growth, workforce participation robustly and negatively impacts an MFI’s ability
28Results are largely similar when separate between and within regressions are run, that is with all de-pendent and independent variables set at their MFI-median and deviation-from-median values, respectively.However, differences in between and within coefficient magnitudes tend to be larger. For example, foroperational self-sufficiency the between coefficient is 2.11 and the within coefficient is 0.81, both stronglysignificant.
29The point estimate for growth in total dollars loaned, which involves both intensive and extensive growth,is significant and greater than one: 1.18, s.e. of 0.29.
30Quantitatively, the purely within regression produces a smaller estimate for intensive growth: 0.28, s.e.0.14.
18
to cover costs. An additional percentage point in the workforce participation rate is asso-
ciated with a 0.6 percentage point drop in the revenue/cost ratio. Similar to growth, the
interquartile range of workforce participation (9.9 percentage points) accounts for 18% of
self-sufficiency’s interquartile range. The same basic result is borne out when separating be-
tween and within variation, though the within result is only marginally significant (perhaps
because less than 2% of variation in workforce participation is within-MFI, see Table 1b).
Evidently, MFIs do better when there is a larger pool of individuals not officially active
in the labor force. This could be because MFIs are able to achieve a given growth trajectory
more selectively when more people are not already active, or because the pool of potential
clients is of higher quality when there are structural reasons for its large size. Unfortunately,
the auxiliary regressions do not help to pinpoint where workforce participation is having its
most salient effect, except for the wisp of significance in raising operating costs per dollar
loaned. If true, this increased cost could come from time spent on screening or training, in
line with either of the above two hypotheses.
Manufacturing (as a percent of GDP) does not seem to affect operational self-sufficiency.
That said, it is positively associated with the interest markup, at 56 basis points per percent-
age point of manufacturing. This extra markup and its failure to affect financial sustainability
is probably explained in part by the (marginally significant) 45 basis point rise in operating
cost per dollar loaned attributable to a percentage point of manufacturing. That manufac-
turing is associated with higher cost per dollar loaned may seem puzzling given evidence
that it appears to be associated with lower cost per borrower. But, manufacturing also has
a significant and negative relationship with average loan size (not reported). Thus, more
manufacturing is associated with smaller loans, lower cost per borrower, but (smaller loans
being the dominant effect) higher cost per dollar loaned. Apparently, a more vibrant manu-
facturing sector crowds out all but smaller endeavors among the pool of micro-borrowers.31
31The baseline results are perfectly echoed in the MFI-median variables of Table 3 – not surprising giventhat more than 95% of variation in manufacturing is between-MFI. There is a significant negative relationshipbetween manufacturing and loan loss expense rate using the MFI-deviation measure. This may be becausehigh-frequency fluctuations in manufacturing lead to gains and losses in jobs that are used to help repay
19
Turning to MFI growth, manufacturing and workforce participation are both negatively
and significantly associated with MFI growth in number of borrowers, i.e. extensive growth.
One percentage point of workforce participation (manufacturing) is associated with a 0.35
(0.27) percentage point lower percentage extensive growth. The interquartile difference in
workforce participation (manufacturing) explains 11% (6%) of the interquartile range in
extensive growth. Similar results are evident in the MFI-median variables in Table 3, but
not in the MFI-deviation variables – again, not surprising given the lack of within-MFI
variation in manufacturing and workforce participation; see Table 1b.
These results suggest that MFI extensive growth is harder to come by when more people
are economically active and manufacturing jobs are more abundant. They are consistent
with the idea of a rivalry between two routes to development, one based on increasing wage-
earning opportunities and the other based on microfinance and self-employment.32
Private Credit. The results give no strong evidence that private credit – reflecting the
size and development of the financial sector – affects an MFI’s operational self-sufficiency.
Behind this general result are interesting correlations of private credit with components of
the ability to cover costs.
Private credit is negatively and significantly associated with both forms of default. Its
interquartile range accounts for 9% and 10% of the respective interquartile ranges of the
loan loss expense rate and the PAR-30. This result does not appear consistent with the
idea that competition in lending generally raises micro-finance default rates by providing
temptation to switch lenders. One potential explanation is that a well-developed financial
sector complements micro-finance by providing incentives to maintain good credit histories
and opening up pathways for enterprises to advance beyond micro-credit. Another is that
a strong financial sector simply reflects the presence of well-functioning credit market insti-
tutions that benefit bank recovery rates at all levels. However, this interpretation is put in
micro-loans when other avenues fail.32Related issues are explored in Ahlin and Jiang (2008), who find there can be rivalry between industri-
alizing growth and development driven by self-employment.
20
some doubt by the robustness of the relationship between private credit and default measures
when various credit institution variables are controlled for (see section 4.3).
Private credit is also significantly associated with lower operating costs, both on a per-
dollar loaned and a per-borrower basis. Its interquartile range accounts for 12% and 10% of
the respective interquartile ranges of the cost per dollar loaned and cost per borrower. Again,
this could reflect the efficiency-enhancing credit market institutions associated with better
financial development; but again, inclusion of direct measures of credit market institutions
(discussed in section 4.3) does not affect results. Instead, it may be that future financial
prospects beyond micro-finance affect micro-borrowers’ incentives and reduce the MFI’s need
to screen and/or monitor. There may also be a competition-related story: greater financial
competition drives down costs of delivery via selection or incentive effects at the MFI level.
Competition also comes to mind in the result that private credit is statistically signif-
icantly associated with a lower interest markup. Quantitatively, a percentage point in the
credit/GDP ratio predicts a 21 basis point drop in the interest markup. Most of this is
coming through the average interest rate charged, where the drop is estimated at 23 basis
points (not reported), though the median cost of capital also falls a statistically significant
5 basis points (not reported). The interquartile range of private credit (about 18 percentage
points) predicts a 375 basis point drop in the interest markup, which is about 18% of its
interquartile range.
Note that the 375 basis point drop in interest markup can be mostly but not entirely
accounted for (using the point estimates) by the drops in default costs, 27 basis points, and
in operating costs, 267 basis points, attributable to the interquartile range of private credit.
Interestingly then, MFIs operating in the context of better developed financial markets seem
to (more than) pass on cost savings and default reductions in the form of lower interest
rate markups to borrowers – perhaps due to competition. The combination of lower costs
and default but lower markups explains why the net effect on financial self-sufficiency is not
distinguishable from zero.
21
The between variables of Table 3 largely echo the pooled results. The within variables
generally lose significance, though there are hints of some dramatic differences: private credit
being associated with lower operational self-sufficiency and higher default. Interpreting this
as a high-frequency phenomenon, one can imagine that unusually rapid growth of the finan-
cial sector may induce default via the temptation/opportunity to switch lenders. However,
the results ought not be pushed too far since they are coming from less than 8% of the
variation in private credit.
MFI growth is not statistically significantly affected by private credit, though the co-
efficients are negative on both extensive and intensive growth, not inconsistent with the
possibility of some crowding out.33
4.2 Other Macroeconomic Determinants
The structure of the economy can have an impact on MFI performance; some evidence
for this has already been seen. Obviously, there are other structural characteristics of the
economy not yet controlled for that may be thought to matter for microfinancial success.
We alternately add one at a time to the baseline specification remittances, foreign direct
investment inflows, agricultural sector value-added, service sector value-added, industrial
sector value-added, all as fractions of GDP; average (gini) inequality over 1994-2006; and
the rural fraction of the population.
Table 4 reports (for brevity) only specifications in which the additional variable registers
a significant coefficient in at least two out of the three types of regressions (median, robust,
and least squares). It also reports on only the key outcome variables – operational self-
sufficiency, borrower growth, and loan-size growth.
Remittances are positively and significantly associated with operational self-sufficiency
33We also run a more conservative approach that clusters standard errors at the country level ratherthan the MFI level. This does not drastically alter the picture, though significance levels do fall a bit. Inparticular, growth and private credit become insignificant (in all but at most one technique) in explainingoperating costs; private credit becomes insignificant against one default measure except in the OLS; andmanufacturing loses significance except in the OLS in explaining borrower growth.
22
(see Table 4). The regressions on the three components of sustainability give some hints
about channels of operation. Remittances statistically significantly go with lower default as
measured by the PAR-30. One percentage point of remittances also significantly predicts
about a 10 basis point drop in the cost of capital, which feeds in (with marginal significance)
to a similar hike in the interest markup (there is a near-zero impact on the average interest
rate). There is no measured impact on the cost per dollar loaned, though this masks two
opposing effects: a higher cost per borrower but larger loans associated with remittances.
That prevalence of remittances goes with higher loan size and lower default may reflect
the greater ability to take on risk that comes from more households having access to a reli-
able source of (foreign) wage earnings. If so, this is evidence for synergy rather than rivalry
between wage-earning opportunities and microfinance, unlike the results on workforce partic-
ipation and manufacturing have suggested. Perhaps foreign wage-earning opportunities are
seen as temporary and complementary to (current and future) domestic economic activity by
other household members, while domestic wage-earning opportunities are seen as potentially
long-term and substitutable. That remittances predict a drop in the cost of capital may
suggest they promote greater savings, which can be a relatively cheap source of funds in the
semi-local markets where MFIs operate.
Percent rural has no significant impact on any of the three main indicators, though
it is a significant negative predictor of the loan loss expense rate (not reported). Similarly,
agriculture has a statistically significant negative relationship with the loan loss expense
rate; oddly, though, it has an opposite, positive relationship with the PAR-30. These are
reconcilable if, for example, agricultural loans are repaid more tardily but ultimately more
reliably. However, overall agriculture is negatively related to operational self-sufficiency:
one percentage point of agriculture/GDP lowers an MFI’s revenue/cost by 0.55 percentage
points. This appears to be due to a lower interest markup by MFIs where agriculture is more
prevalent – due to higher cost of capital and lower (though not statistically significantly)
interest rates. One can speculate that part of the explanation for higher cost of capital
23
could involve the relative scarcity of monetary savings in agricultural environments; and for
average interest rate, lower productivity of agricultural projects may play a role.
Unlike agriculture, the relative size of services is positively associated with operational
self-sufficiency.34 It also has a significant negative relationship with the PAR-30 and the
cost of capital (not reported). Perhaps a larger service economy provides more viable micro-
enterprise opportunities, at least in comparison to a more agricultural economy.
Industry registers no significant key relationships, though is not far from significance in
negatively predicting MFI borrower growth, like manufacturing (which is already controlled
for). Also like manufacturing, foreign direct investment is a negative predictor of MFI
borrower growth, in the least squares only, and is positive and significant in predicting MFI
loan-size growth. Again, there is some evidence that MFIs grow more slowly (on the extensive
margin) where industrialization is greater. Here, there is evidence that loan sizes may grow
faster in such countries as perhaps there is greater opportunity or necessity to increase scale
toward efficiency. It is interesting that the potential synergy with microfinance again shows
up with foreign-related opportunities (as it did with remittances), which may be seen as
temporary and complementary to, rather than permanent and substitutable with, micro-
financed activities.35
Theoretically, inflation can hinder the MFI lending mission. An unanticipated infla-
tion tends to lower real rates of return for an MFI, and may cause it to react by building
conservatively large inflation premia into interest rates. For similar reasons, inflation may
also affect an MFI’s cost of capital. Borrowers’ incentives for delay and default can also be
affected.
To check for an effect, we add to the baseline macroeconomic variables the inflation
rate – alternately measured by the consumer price index and the GDP deflator. Perhaps
surprisingly, no significant results (using at least two out of three techniques) emerge. Using
previous-year instead of current-year inflation again produces no significant results, except
34Economy shares of services and agriculture are negatively correlated at about 0.7.35Note also that FDI is measured as a flow, while manufacturing is more reflective of a stock.
24
that higher lagged (GDP deflator) inflation predicts a 25 basis point higher interest rate
charged. Using a dummy equaling one if inflation exceeds 10% (as in Boyd et al., 2001)
also does not give any significant results for the key variables but does consistently predict
a higher cost of capital, by between 100-200 basis points (depending on whether consumer
price of GDP deflator inflation is used and whether it is lagged or not).
Thus, there is some evidence that higher inflation raises (real) interest rates that MFIs
charge and pay; but there does not seem to be a significant effect on sustainability or growth.
This may reflect the lack of high-inflation episodes in our dataset – the 95th percentile
involves just about 20% inflation and the 99th percentile involves 33% (for GDP deflator)
and 56% (for consumer price) inflation.
Inequality measured by the gini coefficient is a negative predictor of operational self-
sufficiency and MFI borrower growth, but a positive predictor of MFI loan-size growth.
Quantitatively, the interquartile inequality difference accounts for 16% of the interquartile
difference in the operational self-sufficiency variable – similar to the magnitude of the growth
effect in the baseline results (an effect which drops about 20% here). The negative impact
on sustainability stems partly from a significant and positive relationship with default, using
either measure of default (not reported).
The results may stem from a relationship between inequality and the degree of dualism
in the economy. A dualistic economy arguably makes it harder for micro-enterprises to
achieve viability, as they lack helpful linkages to broader markets. This can lead to slower
MFI extensive growth and the higher default rates that hinder sustainability. But, it could
also potentially lead to faster average loan-size growth as some funded projects expand,
perhaps out of necessity in order to straddle the dual economy, while less dynamic ones fold.
An alternative explanation may have to do with social capture: access to micro-credit is
partly restricted in favor of relatively well-off local elites, who quickly increase loan sizes.
In this scenario repayment discipline may be lower because borrowers are less dependent on
the MFI. Further research would be needed to distinguish these stories or pinpoint others,
25
but the evidence does suggest that an MFI’s path to financial sustainability and growth in
outreach is harder in more unequal economies.
4.3 Institutional Determinants
It is potentially insightful into the workings of microfinance to see how specific institutions
and institutional outcomes affect an MFI’s operation. For example, higher corruption may
hinder micro-enterprises’ ability to operate and grow, much as it has been seen to impact
small and medium enterprises throughout the world (see for example Fisman and Svensson,
2007). On the other hand, it may lower wages (see Ahlin, 2005) and push more households
to small-scale self-employment, allowing for faster MFI growth. Similarly, rule of law may
create the stable environment micro-borrowers need to succeed; but it may also make it
harder for micro-enterprises to operate avoiding regulations and tax-free.
We first add to the baseline pooled regressions the six broad governance indicators of
Kaufmann et al. (2007), one at a time (see section 2 for a description). As already stressed,
estimated effects are above and beyond any effects operating through macroeconomic growth.
Table 5 reports the regressions involving one of the three key dependent variables in which
the included governance indicator was significant using at least two of the three methods
(median, robust, and least squares regression). It turns out there is only one:36 better
regulatory quality predicts slower growth in average MFI loan size. One interpretation
is that “good” regulations make it harder for micro-enterprises to grow while remaining
informal – for better or worse. This would be consistent with arguments some have put
forward in favor of relaxed regulations for micro-enterprises. On the other hand, it may
reflect a formal business sector that is healthy due to rational regulation and leaves less
room (or need) for all but smaller micro-enterprises.
Related to these results, regulatory quality and, especially, rule of law and govern-
36In each series, 1997, 1999, and 2001 are missing; we experiment with linearly extrapolating these valuesfrom neighboring years, and the results change little.
26
ment effectiveness are all37 predictive of higher operating costs per dollar loaned, and
the evidence suggests that this effect comes through lower loan sizes (in levels) rather than
higher per-borrower operating costs. Again, rule of law and good government and regulation
may limit the scope of the informal economy and keep micro-enterprises small. Voice and
accountability38 also predicts higher costs per dollar loaned, but the channel is via higher
costs per borrower rather than smaller loans. Perhaps this is related to the cost of more
feedback mechanisms or responsiveness in the MFIs. At any rate, this paragraph’s results
provide evidence that MFIs face higher operating costs where institutions are stronger –
suggesting that the relevant margin may be between MFIs that operate largely under the
radar and those that are supervised or regulated.39
We also examine relevant Doing Business indicators of the World Bank. Unfortunately for
our purposes, this dataset is relatively recent and covers only since 2003, which significantly
reduces sample sizes.
The first set of indicators we examine measures difficulty in officially starting a busi-
ness: start-up capital requirements, number of procedures, amount of time needed, amount
of money needed as a percent of GDP/capita, and a total cost that includes the money and
time cost (the latter valued based on average income). Added one at a time to the baseline
specification, none of them is significantly related to any of the three key MFI outcomes.
However, two of them significantly and positively impact the operating cost per dollar loaned:
the number of start-up procedures and start-up capital requirements. One interpretation is
that typical micro-borrowers are going through the official procedures and attaining the min-
imum capital requirements needed, in which case the higher costs may partly be explained
by increased training costs (which MFIs often partly bear). This could also help explain the
fact that higher capital requirements predict lower default, measured by loan loss expenses
– loans to better capitalized micro-enterprises are better insured against downside risk. But
37These three are correlated at about 0.7-0.8 in the dataset.38Measuring the “extent to which a country’s citizens are able to participate in selecting their government,
as well as freedom of expression, freedom of association, and a free media” (Kaufmann et al., 2007).39Unclear, of course, is whether these higher costs are justified by net social benefits.
27
a different interpretation seems preferable, since in both cases the higher costs seem to be
coming from smaller loan sizes rather than higher costs per borrower.40 Namely, a large
number of formal start-up procedures and capital requirements may push micro-borrowers
to start out informal and relatively small. Lower default could also be related to the smaller
projects involving less risk. However, there is no registered effect on growth in loan size (the
point estimates are positive but insignificant), suggesting that the effects are concentrated
on start-up and do not continue to affect the growth trajectory.41
Also examined were number of procedures and time required for contract enforcement.
The time required was a significant and positive predictor of MFI borrower growth. This
is consistent with the idea that barriers to efficient, formal firm operation grows the pool
of potential demand for MFI products. Both number of procedures and time required are
significantly associated with smaller loans and smaller per-borrower costs, though the net
effect on costs per dollar loaned are in neither case significant. The smaller loans, again,
suggest that borrowers start smaller in these more dysfunctional environments. The reduced
risk of smaller ventures may explain the lower loan loss expense rate associated with the
number of procedures.42
The rigidity of employment index from Doing Business is a marginally significant and
negative predictor of MFI loan-size growth (and of loan-size levels, though not significantly).
It is not hard to imagine that labor-related regulations can hinder the expansion of micro-
enterprises, making the transition from use of family or informal or own labor to use of formal
labor more costly. The index also predicts a lower PAR-30 – again, perhaps associated with
smaller loans in levels and growth rates.
40The relevant results are significant for capital requirements but not for the number of procedures.41Supplementing the numbers on start-up time and cost with numbers from Djankov et al. (2002), which
correspond to the year 1999, did not appreciably affect results.42Time and number of procedures required for registering property and various tax-related variables are
also available in the Doing Business database. The latter are available for significantly fewer years, and soare not considered here. The property variables are also available for fewer years, putting typical regressionsample sizes in the 800s. This may help explain the paradoxical result that time required to register propertyis negatively related to MFI loan-size growth while the number of procedures required is positively relatedto loan-size growth.
28
We turn finally to a set of Doing Business variables capturing two aspects of credit
market institutions, the legal backdrop and information flows. Oddly, the credit rights
index predicts slower growth in MFI loan-size and, marginally, higher default (PAR-30).
One favorable interpretation of the loan-growth result is that better credit rights extend the
reach of the formal, commercial credit sector, that is, they make graduation away from the
MFI sector more feasible. More negatively, it could relate to the higher delinquency rate
which induces MFIs to raise loan size more cautiously.
A similar result obtains with the credit information index: it is associated with lower
loan-size growth, perhaps for similar reasons. The magnitude is quite remarkable: one point
higher on the index is associated with a 2.4 percentage point drop in loan growth, and the
interquartile range of the index (4 points, out of 6) is associated with 37% of the interquartile
range of loan growth. (This is more than four times the comparable figure for the credit
rights index.)
The credit information index is also statistically significantly associated with lower costs
per dollar loaned. This result appears to be driven both by larger loans (in levels)43 and
smaller costs per borrower, though neither result is significant using at least two of three
techniques. Again, the magnitude is remarkable: one point on the index lowers costs per
dollar loaned by about 180 basis points, and the interquartile range of the index accounts for
33% of the interquartile range of the cost per dollar loaned. One obvious interpretation is
that screening and monitoring costs can be lowered when information flows are better. It is
also interesting that most of these cost savings seem to translate into lower interest markups,
by a statistically significant 150 basis points per point on the index.
Harder to explain are the positive relationships with default using either default measure.
Similar results for default obtain for the two remaining measures of information flows, public
credit registry coverage and private credit bureau coverage. Perhaps propensity
43Perhaps larger loan sizes in levels help explain the lower loan-size growth associated with the creditinformation index. If so, they do not seem to go vary far in doing so: the interquartile range of the indexaccounts for only 11% of the interquartile range of the average loan size (using the statistically insignificantpoint estimate), as compared with 37% of the interquartile range in loan-size growth.
29
to report loans gone bad is positively associated with more extensive credit information
reporting. Another reverse causality story would be that a systemic default problem led to
these institutions’ establishment – however, it is hard to imagine any MFI or even the micro-
credit sector as driving these institutions. A different interpretation is that with greater
information flows MFIs substitute away from screening and/or monitoring, or in some other
way lessen repayment pressure, to such a degree that defaults actually rise. But the point
estimates (for credit information index) indicate that the 180 basis points in operating costs
per dollar loaned saved per index point significantly outweigh the 20 basis points higher loan
loss expense rate per index point.
Overall, the evidence suggests that increasing credit information flows appears to have
appreciable positive effects on the micro-lending market.44
5 Further Tests and Robustness
5.1 Padding Profits or Breaking Even?
One might wonder if a good growth rate helps sustainable MFIs to further pad their profit
margins, but does not enable MFIs to break the key 100% sustainability barrier. Note that
the median self-sufficiency ratio in the data is 115% (and the mean is 118.5%), which is
well above 100% – thus the median regressions are focused on a part of the distribution
significantly above the critical break-even point.
There are a number of ways to address this. First, we estimate the conditional quantile
function at the quantile of self-sufficiency corresponding to the key 100% mark, which is
roughly the 25th percentile of the operational self-sufficiency variable.45 Estimates of the
44One might wonder whether some of the counterintuitive results involving the credit market institutionvariables reflect an odd partial effect since they condition on the general size and development of the financialsector (private credit). However, results on these four variables run without private credit turn out to bevery similar. Conversely, the results for private credit discussed in section 4.1 are robust to the inclusion ofthe credit institutions variables discussed here.
45In principle, quantile regression can be used to estimate the conditional quantile function for any quantile.See Koenker (2005).
30
conditional 25th percentile function of operational self-sufficiency are contained in columns
1 and 2 of Table 6. Growth remains significant, at the 1% level, with a slightly smaller
coefficient than at the median: 1.44 instead of 1.53. Workforce participation also is negative
and significant, though only at 10%, and with a smaller magnitude: −0.44 rather than
−0.62. Column 2 shows that both the between-MFI and within-MFI variation in growth
are statistically significantly related to operational self-sufficiency at the 25th percentile, as
they are at the median. By contrast, though, it appears to be the within-MFI variation
in workforce participation – high-frequency movements – that is significant for MFIs at the
25th percentile, rather than the between-MFI variation which is more robustly predictive at
the median.
Next, we collapse the operational self-sufficiency measure into sustainable, a dummy
variable that equals 1 if and only if the revenue/cost ratio is at least 100%. About 75% of
observations have sustainable = 1. We then run a logit specification, with standard errors
clustered at the institution level. Results are reported in columns 4 and 5 of Table 6. Growth
is a significant predictor of breaking even, at the 1% level. Quantitatively, the interquartile
growth difference (3.9 percentage points) is associated with a 5.2 percentage point increase in
the probability of a non-profit MFI breaking even.46 Put differently, this amount of growth
has the same impact on the probability of breaking even as about the first one and two thirds
years of the age effect or a 130% increase in assets. Separating the between- and within-MFI
variation of the key variables (column 5) shows that both low-frequency and high-frequency
growth differences are significantly associated with the ability to break even.
Interestingly, log-income level of the country becomes significant and positive at the 10%
level – consistent with the idea that it is easier to break even in richer countries. Further,
when log-income is replaced by a quadratic, both terms are significant at the 1% level and the
shape is an inverted-U peaking at around $2680. Similarly, when a quadratic specification
is used in the 25th quantile regression, both terms are significant and the peak is at $2410;
46Quantitative calculations for the logit are made by setting all non-dummy variables at their mediansand using the modal institutional type.
31
see columns 3 and 6 of Table 6.47 This leaves 6-7% of the data beyond the peak, mainly
from institutions in South and Central America. Quantitatively, in the logit specification
an MFI where income is at the 75th percentile ($1780) has a 10.2 percentage point higher
probability of breaking even than an MFI where income is at the 25th percentile ($370) –
about twice the comparable number for growth. A straightforward interpretation of these
results is that it is easier to break even in richer countries, up to a point. However, one
might also wonder if the result is because, for MFIs operating in poorer economies, breaking
even is less necessary – subsidies being easier to obtain for work in poorer economies, e.g. –
or less desirable.
Overall, the evidence is strong that the relationship between MFI financial performance
and macroeconomic growth is not isolated at the upper end of the MFI distribution. Rather,
both year-to-year fluctuations in growth and growth trends are strongly related to an MFI’s
ability to achieve financial sustainability.
5.2 Causality and Growth
Growth seems strongly correlated, then, with an MFI’s ability to cover costs self-sufficiently.
To what extent is it reasonable to think of this relationship as a causal link from growth to
MFI performance? Several non-causal interpretations can be given.
One such interpretation is reverse causation: good financial performance of the MFIs in
our data is directly fueling economic growth. This seems far-fetched, given the small size
relative to each economy of most MFIs in our dataset. Few, if any, MFIs would claim to
have substantial macroeconomic impacts (and MFIs are not generally known for moderate
self-assessments).
Still, the possibility of reverse causality can be addressed. Since it is especially implau-
sible with small institutions, we rerun the baseline results on operational self-sufficiency,
alternately dropping the MFI observations in which a) the number of borrowers is not miss-
47Quadratic terms for income in the baseline specification are not significant, except the squared term inthe median regression only, at the 10% level.
32
ing and exceeds 1% of the country’s population and b) the value of the loan portfolio is not
missing and exceeds 1% of private credit in the economy. These drops reduce the sample
size by about 3% and 17%, respectively. However, the results (not reported) are very similar
to the baseline results. Growth remains a significant predictor of operational self-sufficiency,
at the 1% significance level for all techniques and both subsamples. The coefficient magni-
tudes are close to the baseline levels: respectively, 1.58 and 1.71 as opposed to 1.53 in the
baseline.48 Thus, it seems implausible that the results are being driven by causality flowing
in the other direction.
A second interpretation is omitted variable bias at an aggregate level: it may not be
growth per se, but something correlated with growth that is causing better MFI performance.
One variant of this interpretation is that the informal sector as a whole is doing well for some
unobserved reason that is both causing higher growth and better performance of the MFI
sector.
We cannot completely rule out omitted variable bias. Several points can be made though.
First, given that within-MFI growth differences are significant predictors of operational self-
sufficiency, omitted variable bias due to time-invariant MFI-level or country-level factors does
not seem to be causing the positive growth effect.49 Second, the large number and variety
of additional macro-structural and institutional variables that are controlled for without
growth losing its explanatory power for operational self-sufficiency50 gives greater confidence
that obvious omitted variables are not lurking. Finally, we do not need to rule out this
interpretation in order to answer our main question, namely, whether MFI performance is
48Workforce participation also remains significant at the 1% level in all cases with very similar coefficientsto the baseline.
49When country, region, or MFI fixed effects are included (not reported), growth remains significant thoughits coefficient drops by about 1/3-1/2. However, these specifications remove much of the low-frequency growthvariation.
50Growth is always significant at the 1% level using all three techniques (median, robust, and least squares)when the additional variables of sections 4.2 and 4.3 are included, with one exception: it falls to significanceat the 5% level in at most two of three techniques when the Doing Business indicators are included. Thisdrop in significance seems surely related to the fact that the Doing Business indicator regressions involvesubsamples 50-60% the size of the baseline sample (since the data begin in 2003). Further, the minimumestimated coefficient on growth (from the median regressions) across all the added variables, excludinginequality, is 1.42 compared to the 1.53 of the baseline; for inequality it is 1.19.
33
significantly dependent on the surrounding macroeconomic context. Whatever the aggregate
factors that are omitted may be, it is implausible that the particular MFI in our dataset is
responsible for them. Hence, the results do establish that a substantial part of the MFI’s
success is out of its control.
A third interpretation involves a selection story: it may be that more sustainable MFIs
choose to locate in high-growth economies, while MFIs that are content to be dependent
on subsidies locate in low-growth economies. This story, however, almost requires a causal
macroeconomic effect behind it: why would financially driven MFIs tend to prefer high-
growth economies unless growth were conducive to better financial performance? And again,
it is put in question by the within results, which show that even within MFIs over time growth
significantly affects operational self-sufficiency.
A fourth interpretation involves a more subtle selection story. It may be that MFIs
shift between goals depending on the health of the aggregate economy – an issue that does
not arise with purely profit-maximizing firms. For example, MFIs may prioritize their social
mission when growth is poor, letting loans be delinquent and taking losses; but may prioritize
financial goals when growth resumes, returning to strictness and profitability. They may do
this even though operational self-sufficiency is equally attainable in both scenarios, simply
because their various goals take on different urgency depending on the state of the economy.
We are not able to rule this kind of story out. In fact, even an experimental design that
found an exogenous growth shock could not rule out this story. Disentangling the effect of
shifting objectives due to macroeconomic factors seems to require some way of getting at
the propensity of an MFI to shift weights between different components of its mission. This
is left to future research.
With these caveats in mind, then, we interpret the results as suggestive of causal effects
of growth on MFI performance.
34
6 Relation to the Literature
This paper is related to a number of others. There is a significant literature evaluating MFI
success and failure, much of it with a view toward arriving at sound practices. See, for
example, Yaron (1994), Chaves and Gonzalez-Vega (1996), Kaboski and Townsend (2005),
Armendariz de Aghion and Morduch (2005), and most similarly, Cull et al. (2006), who
pioneered the use of cross-country, cross-MFI data in this area. Our study differs from these
in focusing on the macroeconomic and macro-institutional, rather than micro-institutional,
determinants of MFI success.
There is also a literature examining determinants of the performance of standard com-
mercial banks or the financial sector as a whole. Boyd et al. (2001) examine the impact of
inflation on the aggregate financial sector and find inflation hinders financial development.
Demirguc-Kunt and Huizinga (1999) and Demirguc-Kunt et al. (2004) are most comparable
to our study in that they use panel datasets of banks across countries to examine macroe-
conomic and institutional determinants of bank interest markups and (in the former case)
profitability. Interestingly, Demirguc-Kunt and Huizinga do not find an effect of growth on
bank profitability, and they find that lower corruption and better contract enforcement lower
profitability.51
Our study’s main difference from these is its exclusive focus on MFIs. It is far from clear
that what holds true for commercial banks or the banking sector as a whole will also hold
true for MFIs. There are significant differences. First, a number of MFIs are subsidized,
indefinitely or at least during an initial start-up phase. Thus it is not a foregone conclusion
that MFIs failing to break even for a number of years will cease to exist. In other words, there
appears to be much more significant and persistent variation on the financial sustainability
margin in the MFI sector than in the formal banking sector. Second, MFIs by definition tend
to serve a different client base and finance relatively small projects. The MFI’s technologies of
51Research has also attempted to understand causes of systemic banking crises, e.g. Demirguc-Kunt andDetragiache (1998, 2000, 2005), Kaminsky and Rinehart (1999), and Eichengreen and Rose (2001).
35

service delivery, screening, and monitoring may significantly differ from those in the formal
banking sector, and clients’ projects also may face different determinants of viability. In
summary, in the case of microfinance – given its operation among economically marginal
clientele, its concentration in informal sectors, its frequent reliance on local markets, and
its common non-profit status – the relationship with the macroeconomy cannot likely be
extrapolated from results on the broader banking sector.52
There are a few papers that do focus on the relationship between the macroeconomy
and MFI performance. The Patten et al. (2001) case study of BRI in the wake of the
late-1990’s Indonesian financial crisis finds that repayment rates for BRI’s micro-loans were
basically unchanged. However, they also note that BRI’s nominal interest rates on micro-
loans increased little, rising about thirteen percentage points for just one year; this compares
with a spike in annual inflation of more than fifty percentage points. Apparently, BRI charged
significantly lower real interest rates, and hence had lower real revenue rates, as a result of
the crisis. Henley (forthcoming) studies Indonesian finance over the past century and argues
based on historical evidence that robust macroeconomic growth contributed significantly to
the recent success of Indonesian microfinance. Our paper makes a point related to Henley’s,
but differs from both Henley and Patten et al. mainly in its more quantitative methodology.
Several studies more closely related to ours appeared since our first draft (Ahlin and Lin,
2006). Independently of us, Krauss and Walter (2006, updated 2008) examine correlations
between MFI performance and stock market indices as well as domestic income levels, using
MFI fixed effects. They find that MFI performance is less correlated with stock market
indices than comparison groups of emerging market firms and emerging market banks, but
more correlated with GDP levels.53 Also independently, Gonzalez (2007) examines measures
of portfolio at risk and default using similar data to ours in an MFI fixed effect specifica-
tion. He finds that only the PAR-30 measure is significantly related to growth, while other
52There are similarities between this question and another that has received much attention, the relation-ship between growth and poverty.
53Given their MFI fixed effect specification, including GDP levels could partially pick up an age effect,which is not directly included in their specification.
36
measures of default, including the loan loss expense rate, are not.
There are a number of differences between our approaches. We aim to test a broader
set of macroeconomic and macro-institutional determinants, and we examine both broad
indicators of MFI sustainability and growth as well as their components; we focus on solving
outlier and data quality issues as well as endogeneity issues; and, related, we use and isolate
both within- and between-MFI variation. Krauss and Walter (2008), on the other hand,
include correlation with stock indices and also compare to emerging market firms and banks;
Gonzales (2007) uses a richer set of MFI controls and default measures. We view the results
as complementary and in agreement where they overlap.54
Of course there is a large literature that tries to establish a reverse proposition: that
finance affects growth (see Levine, 2005, for an introduction). However, the measures of
finance used tend to be country-level indicators, such as the private credit measure used
here. It is much less believable that a single microfinance institution, or even the microfinance
sector in a country, is driving a significant portion of growth in the short run. Nonetheless,
we addressed the issue of reverse causation in the robustness section 5.2.
7 Conclusion
This study is a first attempt to place the performance of microfinance institutions in the
relevant national context. We examine country-level determinants of success of more than
300 MFIs from around the world. The broad conclusion that emerges is that MFI success –
at least in terms of financial sustainability and its components, and extensive and intensive
growth – is significantly affected by the macroeconomic and macro-institutional environment
in which an MFI is situated.
Specifically, the evidence is that growth – both cyclical and sustained – is good for
54The exception would be in the emphasis of Gonzales (2007) on the macroeconomic resilience of MFIs.One difference is in estimation techniques, where again we focus on outlier issues and use both within- andbetween-MFI variation, while Gonzales focuses on endogeneity issues by using only within-MFI variation.However, our results are still significant, though quantitatively muted, when we use only within-MFI growthvariation to explain default.
37
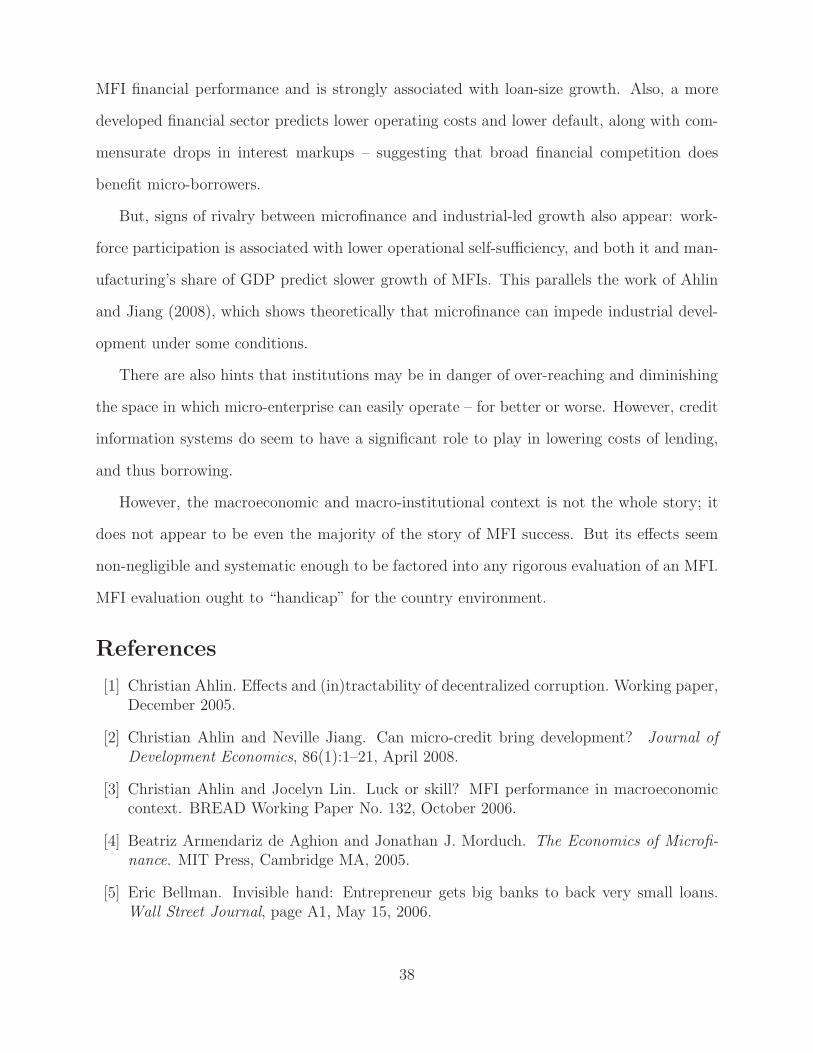
MFI financial performance and is strongly associated with loan-size growth. Also, a more
developed financial sector predicts lower operating costs and lower default, along with com-
mensurate drops in interest markups – suggesting that broad financial competition does
benefit micro-borrowers.
But, signs of rivalry between microfinance and industrial-led growth also appear: work-
force participation is associated with lower operational self-sufficiency, and both it and man-
ufacturing’s share of GDP predict slower growth of MFIs. This parallels the work of Ahlin
and Jiang (2008), which shows theoretically that microfinance can impede industrial devel-
opment under some conditions.
There are also hints that institutions may be in danger of over-reaching and diminishing
the space in which micro-enterprise can easily operate – for better or worse. However, credit
information systems do seem to have a significant role to play in lowering costs of lending,
and thus borrowing.
However, the macroeconomic and macro-institutional context is not the whole story; it
does not appear to be even the majority of the story of MFI success. But its effects seem
non-negligible and systematic enough to be factored into any rigorous evaluation of an MFI.
MFI evaluation ought to “handicap” for the country environment.
References
[1] Christian Ahlin. Effects and (in)tractability of decentralized corruption. Working paper,December 2005.
[2] Christian Ahlin and Neville Jiang. Can micro-credit bring development? Journal ofDevelopment Economics, 86(1):1–21, April 2008.
[3] Christian Ahlin and Jocelyn Lin. Luck or skill? MFI performance in macroeconomiccontext. BREAD Working Paper No. 132, October 2006.
[4] Beatriz Armendariz de Aghion and Jonathan J. Morduch. The Economics of Microfi-nance. MIT Press, Cambridge MA, 2005.
[5] Eric Bellman. Invisible hand: Entrepreneur gets big banks to back very small loans.Wall Street Journal, page A1, May 15, 2006.
38
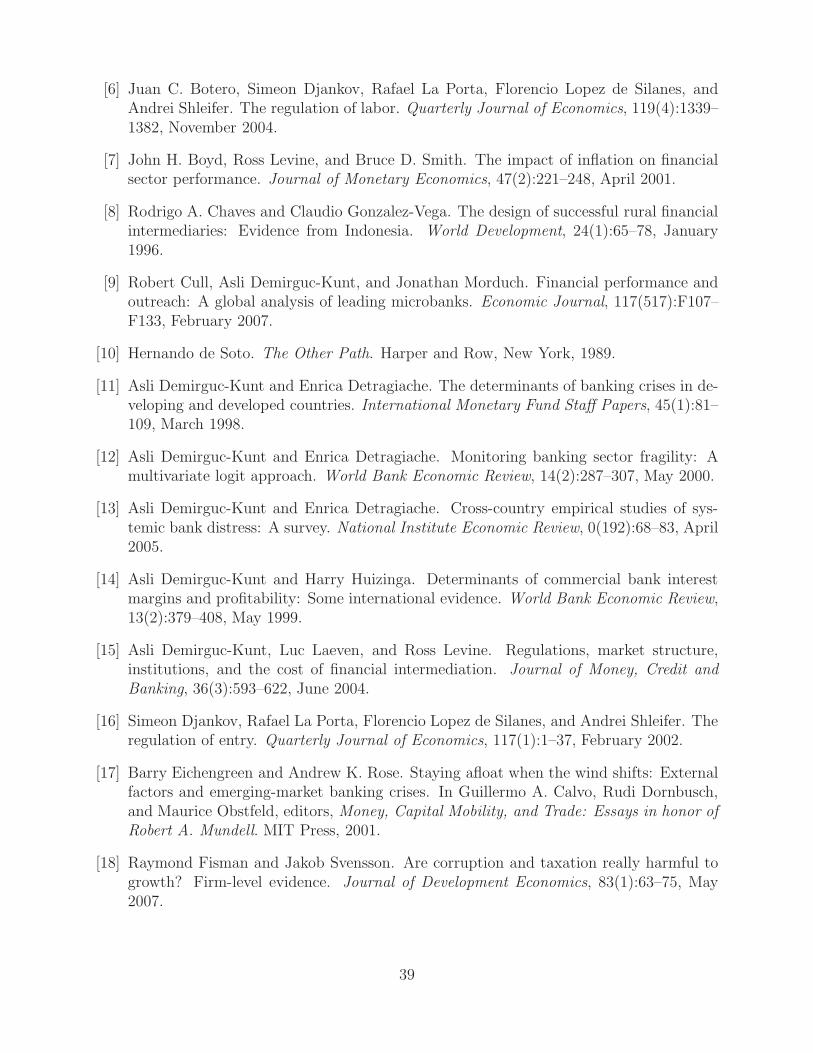
[6] Juan C. Botero, Simeon Djankov, Rafael La Porta, Florencio Lopez de Silanes, andAndrei Shleifer. The regulation of labor. Quarterly Journal of Economics, 119(4):1339–1382, November 2004.
[7] John H. Boyd, Ross Levine, and Bruce D. Smith. The impact of inflation on financialsector performance. Journal of Monetary Economics, 47(2):221–248, April 2001.
[8] Rodrigo A. Chaves and Claudio Gonzalez-Vega. The design of successful rural financialintermediaries: Evidence from Indonesia. World Development, 24(1):65–78, January1996.
[9] Robert Cull, Asli Demirguc-Kunt, and Jonathan Morduch. Financial performance andoutreach: A global analysis of leading microbanks. Economic Journal, 117(517):F107–F133, February 2007.
[10] Hernando de Soto. The Other Path. Harper and Row, New York, 1989.
[11] Asli Demirguc-Kunt and Enrica Detragiache. The determinants of banking crises in de-veloping and developed countries. International Monetary Fund Staff Papers, 45(1):81–109, March 1998.
[12] Asli Demirguc-Kunt and Enrica Detragiache. Monitoring banking sector fragility: Amultivariate logit approach. World Bank Economic Review, 14(2):287–307, May 2000.
[13] Asli Demirguc-Kunt and Enrica Detragiache. Cross-country empirical studies of sys-temic bank distress: A survey. National Institute Economic Review, 0(192):68–83, April2005.
[14] Asli Demirguc-Kunt and Harry Huizinga. Determinants of commercial bank interestmargins and profitability: Some international evidence. World Bank Economic Review,13(2):379–408, May 1999.
[15] Asli Demirguc-Kunt, Luc Laeven, and Ross Levine. Regulations, market structure,institutions, and the cost of financial intermediation. Journal of Money, Credit andBanking, 36(3):593–622, June 2004.
[16] Simeon Djankov, Rafael La Porta, Florencio Lopez de Silanes, and Andrei Shleifer. Theregulation of entry. Quarterly Journal of Economics, 117(1):1–37, February 2002.
[17] Barry Eichengreen and Andrew K. Rose. Staying afloat when the wind shifts: Externalfactors and emerging-market banking crises. In Guillermo A. Calvo, Rudi Dornbusch,and Maurice Obstfeld, editors, Money, Capital Mobility, and Trade: Essays in honor ofRobert A. Mundell. MIT Press, 2001.
[18] Raymond Fisman and Jakob Svensson. Are corruption and taxation really harmful togrowth? Firm-level evidence. Journal of Development Economics, 83(1):63–75, May2007.
39
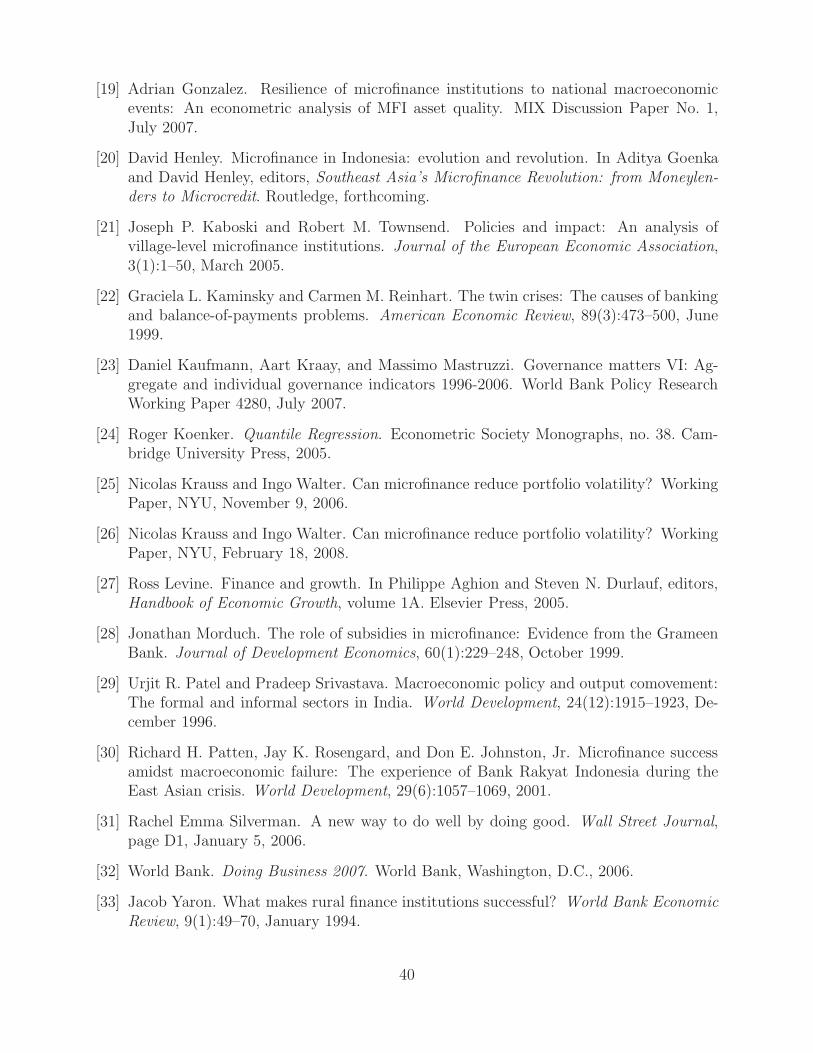
[19] Adrian Gonzalez. Resilience of microfinance institutions to national macroeconomicevents: An econometric analysis of MFI asset quality. MIX Discussion Paper No. 1,July 2007.
[20] David Henley. Microfinance in Indonesia: evolution and revolution. In Aditya Goenkaand David Henley, editors, Southeast Asia’s Microfinance Revolution: from Moneylen-ders to Microcredit. Routledge, forthcoming.
[21] Joseph P. Kaboski and Robert M. Townsend. Policies and impact: An analysis ofvillage-level microfinance institutions. Journal of the European Economic Association,3(1):1–50, March 2005.
[22] Graciela L. Kaminsky and Carmen M. Reinhart. The twin crises: The causes of bankingand balance-of-payments problems. American Economic Review, 89(3):473–500, June1999.
[23] Daniel Kaufmann, Aart Kraay, and Massimo Mastruzzi. Governance matters VI: Ag-gregate and individual governance indicators 1996-2006. World Bank Policy ResearchWorking Paper 4280, July 2007.
[24] Roger Koenker. Quantile Regression. Econometric Society Monographs, no. 38. Cam-bridge University Press, 2005.
[25] Nicolas Krauss and Ingo Walter. Can microfinance reduce portfolio volatility? WorkingPaper, NYU, November 9, 2006.
[26] Nicolas Krauss and Ingo Walter. Can microfinance reduce portfolio volatility? WorkingPaper, NYU, February 18, 2008.
[27] Ross Levine. Finance and growth. In Philippe Aghion and Steven N. Durlauf, editors,Handbook of Economic Growth, volume 1A. Elsevier Press, 2005.
[28] Jonathan Morduch. The role of subsidies in microfinance: Evidence from the GrameenBank. Journal of Development Economics, 60(1):229–248, October 1999.
[29] Urjit R. Patel and Pradeep Srivastava. Macroeconomic policy and output comovement:The formal and informal sectors in India. World Development, 24(12):1915–1923, De-cember 1996.
[30] Richard H. Patten, Jay K. Rosengard, and Don E. Johnston, Jr. Microfinance successamidst macroeconomic failure: The experience of Bank Rakyat Indonesia during theEast Asian crisis. World Development, 29(6):1057–1069, 2001.
[31] Rachel Emma Silverman. A new way to do well by doing good. Wall Street Journal,page D1, January 5, 2006.
[32] World Bank. Doing Business 2007. World Bank, Washington, D.C., 2006.
[33] Jacob Yaron. What makes rural finance institutions successful? World Bank EconomicReview, 9(1):49–70, January 1994.
40
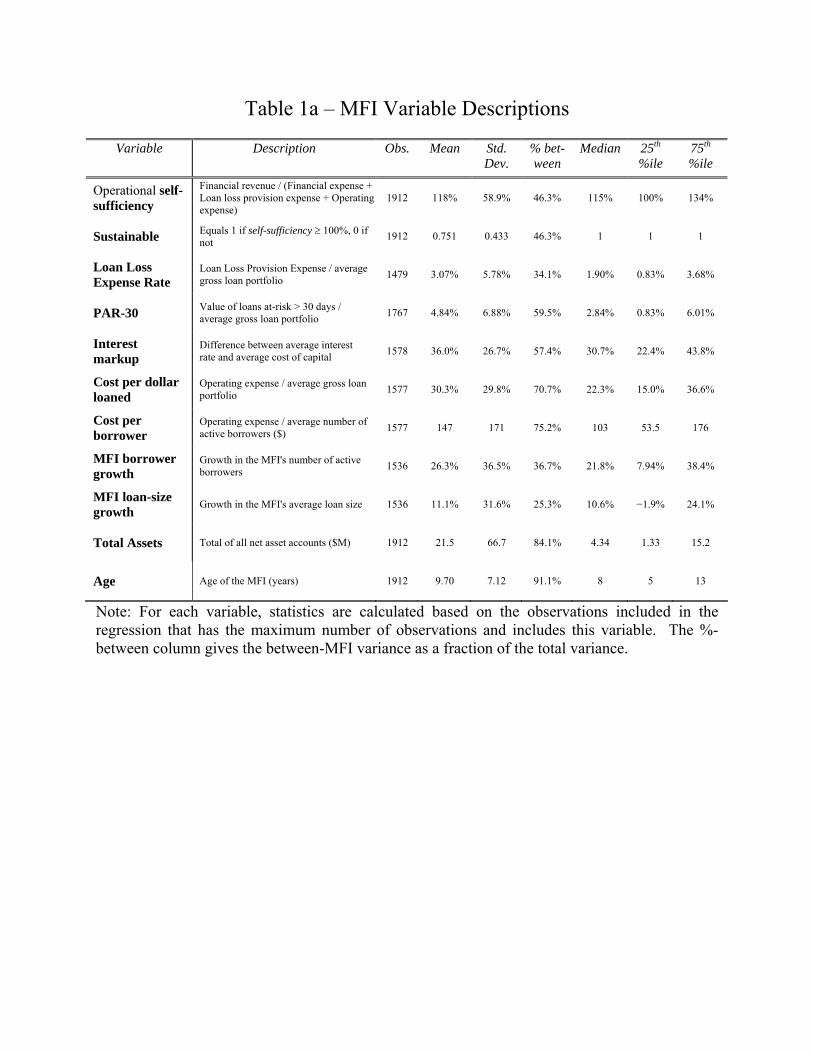
Table 1a – MFI Variable Descriptions
Variable Description Obs. Mean Std. Dev.
% bet-ween
Median 25th %ile
75th %ile
Operational self-sufficiency
Financial revenue / (Financial expense + Loan loss provision expense + Operating expense)
1912 118% 58.9% 46.3% 115% 100% 134%
Sustainable Equals 1 if self-sufficiency ≥ 100%, 0 if not 1912 0.751 0.433 46.3% 1 1 1
Loan Loss Expense Rate
Loan Loss Provision Expense / average gross loan portfolio 1479 3.07% 5.78% 34.1% 1.90% 0.83% 3.68%
PAR-30 Value of loans at-risk > 30 days / average gross loan portfolio 1767 4.84% 6.88% 59.5% 2.84% 0.83% 6.01%
Interest markup
Difference between average interest rate and average cost of capital 1578 36.0% 26.7% 57.4% 30.7% 22.4% 43.8%
Cost per dollar loaned
Operating expense / average gross loan portfolio 1577 30.3% 29.8% 70.7% 22.3% 15.0% 36.6%
Cost per borrower
Operating expense / average number of active borrowers ($) 1577 147 171 75.2% 103 53.5 176
MFI borrower growth
Growth in the MFI's number of active borrowers 1536 26.3% 36.5% 36.7% 21.8% 7.94% 38.4%
MFI loan-size growth
Growth in the MFI's average loan size 1536 11.1% 31.6% 25.3% 10.6% −1.9% 24.1%
Total Assets Total of all net asset accounts ($M) 1912 21.5 66.7 84.1% 4.34 1.33 15.2
Age Age of the MFI (years) 1912 9.70 7.12 91.1% 8 5 13
Note: For each variable, statistics are calculated based on the observations included in the regression that has the maximum number of observations and includes this variable. The %-between column gives the between-MFI variance as a fraction of the total variance.
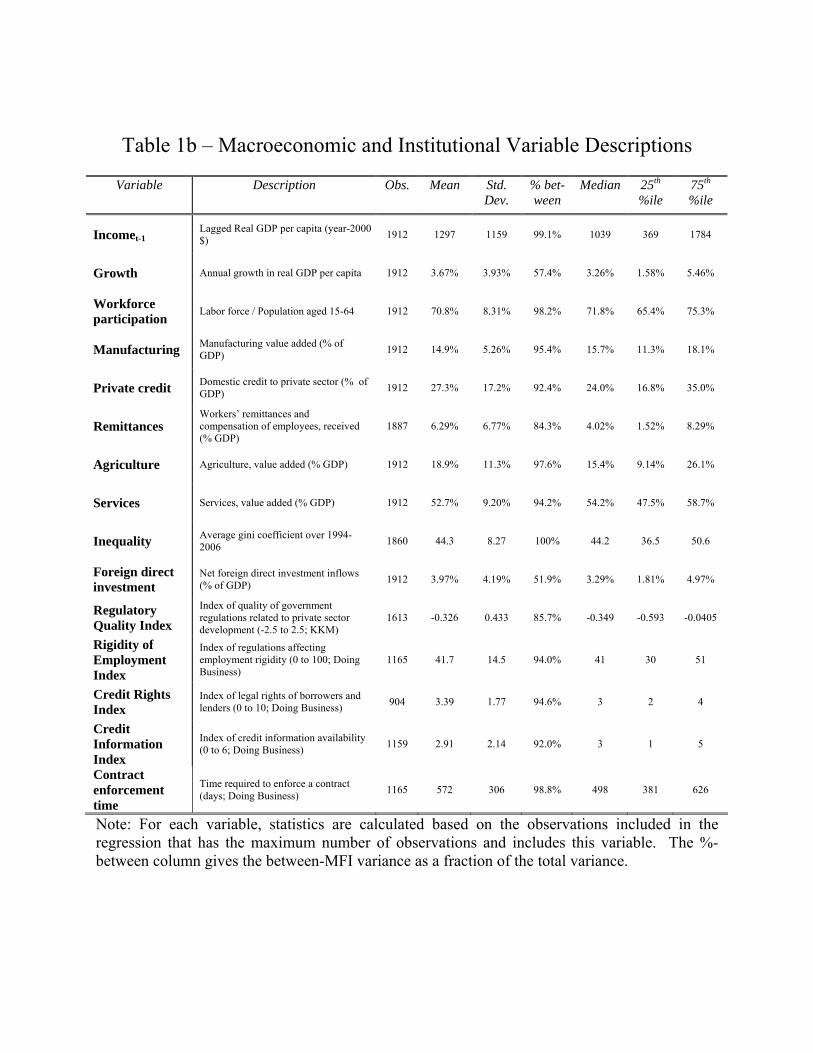
Table 1b – Macroeconomic and Institutional Variable Descriptions
Variable Description Obs. Mean Std. Dev.
% bet-ween
Median 25th %ile
75th %ile
Incomet-1 Lagged Real GDP per capita (year-2000 $) 1912 1297 1159 99.1% 1039 369 1784
Growth Annual growth in real GDP per capita 1912 3.67% 3.93% 57.4% 3.26% 1.58% 5.46%
Workforce participation
Labor force / Population aged 15-64 1912 70.8% 8.31% 98.2% 71.8% 65.4% 75.3%
Manufacturing Manufacturing value added (% of GDP) 1912 14.9% 5.26% 95.4% 15.7% 11.3% 18.1%
Private credit Domestic credit to private sector (% of GDP) 1912 27.3% 17.2% 92.4% 24.0% 16.8% 35.0%
Remittances Workers’ remittances and compensation of employees, received (% GDP)
1887 6.29% 6.77% 84.3% 4.02% 1.52% 8.29%
Agriculture Agriculture, value added (% GDP) 1912 18.9% 11.3% 97.6% 15.4% 9.14% 26.1%
Services Services, value added (% GDP) 1912 52.7% 9.20% 94.2% 54.2% 47.5% 58.7%
Inequality Average gini coefficient over 1994-2006 1860 44.3 8.27 100% 44.2 36.5 50.6
Foreign direct investment
Net foreign direct investment inflows (% of GDP) 1912 3.97% 4.19% 51.9% 3.29% 1.81% 4.97%
Regulatory Quality Index
Index of quality of government regulations related to private sector development (-2.5 to 2.5; KKM)
1613 -0.326 0.433 85.7% -0.349 -0.593 -0.0405
Rigidity of Employment Index
Index of regulations affecting employment rigidity (0 to 100; Doing Business)
1165 41.7 14.5 94.0% 41 30 51
Credit Rights Index
Index of legal rights of borrowers and lenders (0 to 10; Doing Business) 904 3.39 1.77 94.6% 3 2 4
Credit Information Index
Index of credit information availability (0 to 6; Doing Business) 1159 2.91 2.14 92.0% 3 1 5
Contract enforcement time
Time required to enforce a contract (days; Doing Business) 1165 572 306 98.8% 498 381 626
Note: For each variable, statistics are calculated based on the observations included in the regression that has the maximum number of observations and includes this variable. The %-between column gives the between-MFI variance as a fraction of the total variance.
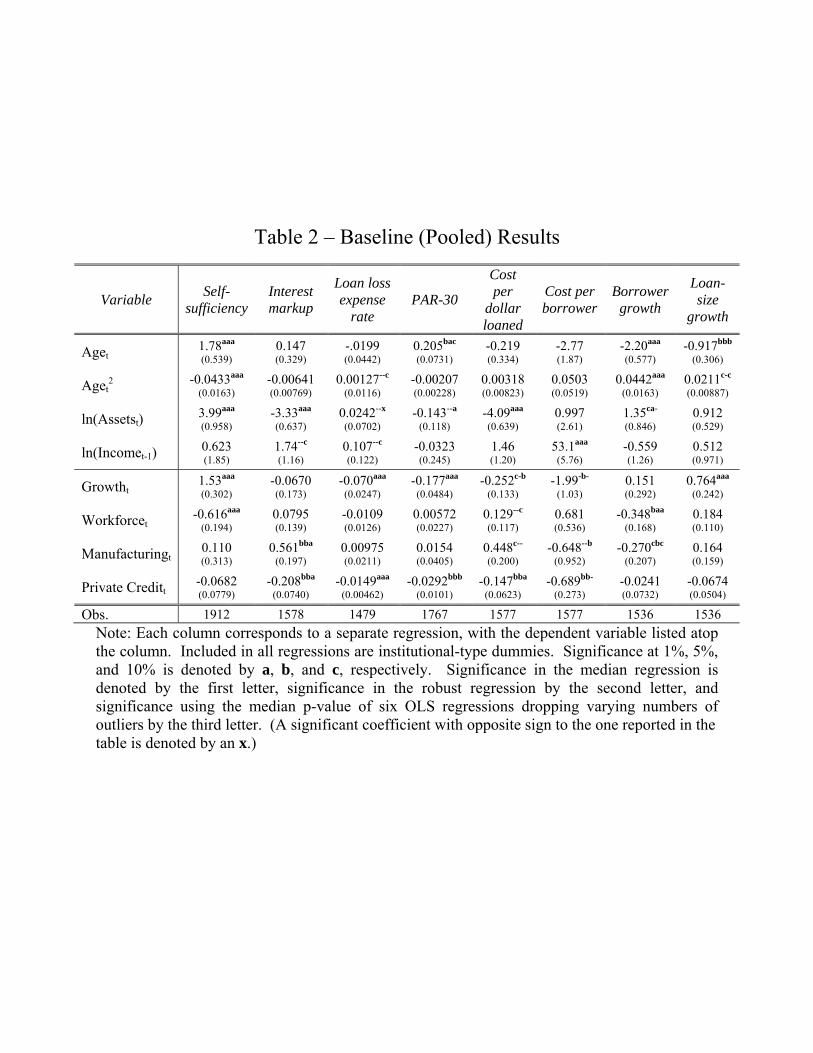
Table 2 – Baseline (Pooled) Results
Variable Self-sufficiency
Interest markup
Loan loss expense
rate PAR-30
Cost per
dollar loaned
Cost per borrower
Borrowergrowth
Loan-size
growth
Aget 1.78aaa
(0.539) 0.147
(0.329) -.0199 (0.0442)
0.205bac
(0.0731) -0.219 (0.334)
-2.77 (1.87)
-2.20aaa
(0.577) -0.917bbb
(0.306)
Aget2
-0.0433aaa
(0.0163) -0.00641
(0.00769) 0.00127--c
(0.0116) -0.00207
(0.00228) 0.00318 (0.00823)
0.0503
(0.0519) 0.0442aaa
(0.0163) 0.0211c-c
(0.00887)
ln(Assetst) 3.99aaa (0.958)
-3.33aaa
(0.637) 0.0242--x (0.0702)
-0.143--a
(0.118) -4.09aaa (0.639)
0.997
(2.61) 1.35ca-
(0.846) 0.912 (0.529)
ln(Incomet-1) 0.623 (1.85)
1.74--c
(1.16) 0.107--c
(0.122) -0.0323 (0.245)
1.46 (1.20)
53.1aaa
(5.76) -0.559
(1.26) 0.512 (0.971)
Growtht 1.53aaa
(0.302) -0.0670
(0.173) -0.070aaa
(0.0247) -0.177aaa
(0.0484) -0.252c-b
(0.133) -1.99-b-
(1.03) 0.151
(0.292) 0.764aaa
(0.242)
Workforcet -0.616aaa
(0.194) 0.0795
(0.139) -0.0109
(0.0126) 0.00572 (0.0227)
0.129--c (0.117)
0.681
(0.536) -0.348baa
(0.168) 0.184 (0.110)
Manufacturingt 0.110 (0.313)
0.561bba
(0.197) 0.00975 (0.0211)
0.0154 (0.0405)
0.448c-- (0.200)
-0.648--b
(0.952) -0.270cbc
(0.207) 0.164 (0.159)
Private Creditt -0.0682
(0.0779) -0.208bba
(0.0740) -0.0149aaa
(0.00462) -0.0292bbb
(0.0101) -0.147bba
(0.0623) -0.689bb-
(0.273) -0.0241 (0.0732)
-0.0674 (0.0504)
Obs. 1912 1578 1479 1767 1577 1577 1536 1536 Note: Each column corresponds to a separate regression, with the dependent variable listed atop the column. Included in all regressions are institutional-type dummies. Significance at 1%, 5%, and 10% is denoted by a, b, and c, respectively. Significance in the median regression is denoted by the first letter, significance in the robust regression by the second letter, and significance using the median p-value of six OLS regressions dropping varying numbers of outliers by the third letter. (A significant coefficient with opposite sign to the one reported in the table is denoted by an x.)
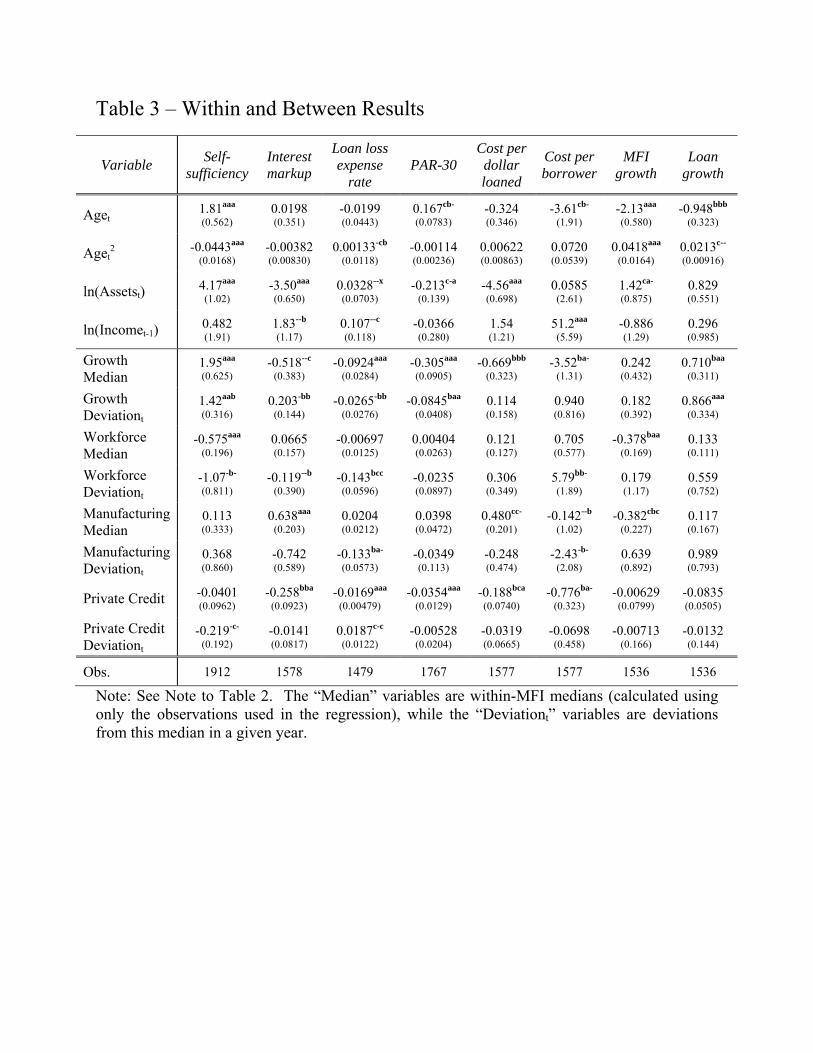
Table 3 – Within and Between Results
Variable Self-sufficiency
Interest markup
Loan loss expense
rate PAR-30
Cost per dollar loaned
Cost per borrower
MFI growth
Loan growth
Aget 1.81aaa
(0.562) 0.0198
(0.351) -0.0199 (0.0443)
0.167cb-
(0.0783) -0.324 (0.346)
-3.61cb-
(1.91) -2.13aaa
(0.580) -0.948bbb
(0.323)
Aget2
-0.0443aaa
(0.0168) -0.00382
(0.00830) 0.00133-cb
(0.0118) -0.00114
(0.00236) 0.00622
(0.00863) 0.0720 (0.0539)
0.0418aaa
(0.0164) 0.0213c--
(0.00916)
ln(Assetst) 4.17aaa (1.02)
-3.50aaa
(0.650) 0.0328--x (0.0703)
-0.213c-a
(0.139) -4.56aaa
(0.698) 0.0585
(2.61) 1.42ca-
(0.875) 0.829 (0.551)
ln(Incomet-1) 0.482 (1.91)
1.83--b
(1.17) 0.107--c
(0.118) -0.0366 (0.280)
1.54
(1.21) 51.2aaa
(5.59) -0.886
(1.29) 0.296 (0.985)
Growth Median
1.95aaa
(0.625) -0.518--c
(0.383) -0.0924aaa
(0.0284) -0.305aaa
(0.0905) -0.669bbb
(0.323) -3.52ba-
(1.31) 0.242
(0.432) 0.710baa
(0.311)
Growth Deviationt
1.42aab
(0.316) 0.203-bb
(0.144) -0.0265-bb
(0.0276) -0.0845baa
(0.0408) 0.114 (0.158)
0.940
(0.816) 0.182
(0.392) 0.866aaa
(0.334)
Workforce Median
-0.575aaa (0.196)
0.0665
(0.157) -0.00697
(0.0125) 0.00404
(0.0263) 0.121 (0.127)
0.705
(0.577) -0.378baa
(0.169) 0.133 (0.111)
Workforce Deviationt
-1.07-b-
(0.811) -0.119--b
(0.390) -0.143bcc
(0.0596) -0.0235 (0.0897)
0.306 (0.349)
5.79bb-
(1.89) 0.179
(1.17) 0.559 (0.752)
Manufacturing Median
0.113
(0.333) 0.638aaa
(0.203) 0.0204
(0.0212) 0.0398 (0.0472)
0.480cc-
(0.201) -0.142--b
(1.02) -0.382cbc
(0.227) 0.117
(0.167)
Manufacturing Deviationt
0.368
(0.860) -0.742
(0.589) -0.133ba-
(0.0573) -0.0349 (0.113)
-0.248 (0.474)
-2.43-b-
(2.08) 0.639
(0.892) 0.989 (0.793)
Private Credit -0.0401 (0.0962)
-0.258bba
(0.0923) -0.0169aaa
(0.00479) -0.0354aaa
(0.0129) -0.188bca
(0.0740) -0.776ba-
(0.323) -0.00629
(0.0799) -0.0835 (0.0505)
Private Credit Deviationt
-0.219-c-
(0.192) -0.0141
(0.0817) 0.0187c-c
(0.0122) -0.00528
(0.0204) -0.0319 (0.0665)
-0.0698
(0.458) -0.00713
(0.166) -0.0132 (0.144)
Obs. 1912 1578 1479 1767 1577 1577 1536 1536
Note: See Note to Table 2. The “Median” variables are within-MFI medians (calculated using only the observations used in the regression), while the “Deviationt” variables are deviations from this median in a given year.
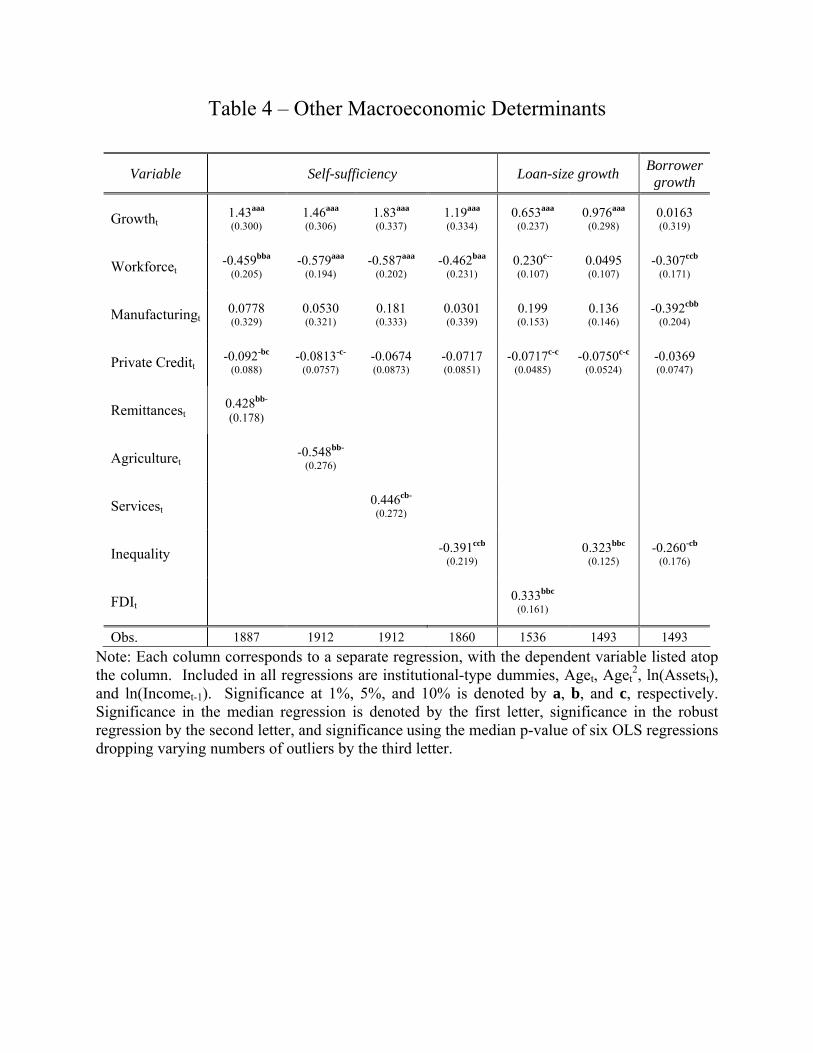
Table 4 – Other Macroeconomic Determinants
Variable Self-sufficiency Loan-size growth Borrower growth
Growtht 1.43aaa
(0.300) 1.46aaa
(0.306) 1.83aaa (0.337)
1.19aaa
(0.334) 0.653aaa
(0.237) 0.976aaa
(0.298) 0.0163
(0.319)
Workforcet -0.459bba
(0.205) -0.579aaa
(0.194) -0.587aaa
(0.202) -0.462baa
(0.231) 0.230c--
(0.107) 0.0495
(0.107) -0.307ccb
(0.171)
Manufacturingt 0.0778 (0.329)
0.0530
(0.321) 0.181 (0.333)
0.0301
(0.339) 0.199
(0.153) 0.136 (0.146)
-0.392cbb
(0.204)
Private Creditt -0.092-bc
(0.088) -0.0813-c-
(0.0757) -0.0674
(0.0873) -0.0717
(0.0851) -0.0717c-c
(0.0485) -0.0750c-c
(0.0524) -0.0369
(0.0747)
Remittancest 0.428bb-
(0.178)
Agriculturet -0.548bb-
(0.276)
Servicest 0.446cb- (0.272)
Inequality -0.391ccb
(0.219) 0.323bbc
(0.125) -0.260-cb
(0.176)
FDIt 0.333bbc
(0.161)
Obs. 1887 1912 1912 1860 1536 1493 1493 Note: Each column corresponds to a separate regression, with the dependent variable listed atop the column. Included in all regressions are institutional-type dummies, Aget, Aget
2, ln(Assetst), and ln(Incomet-1). Significance at 1%, 5%, and 10% is denoted by a, b, and c, respectively. Significance in the median regression is denoted by the first letter, significance in the robust regression by the second letter, and significance using the median p-value of six OLS regressions dropping varying numbers of outliers by the third letter.
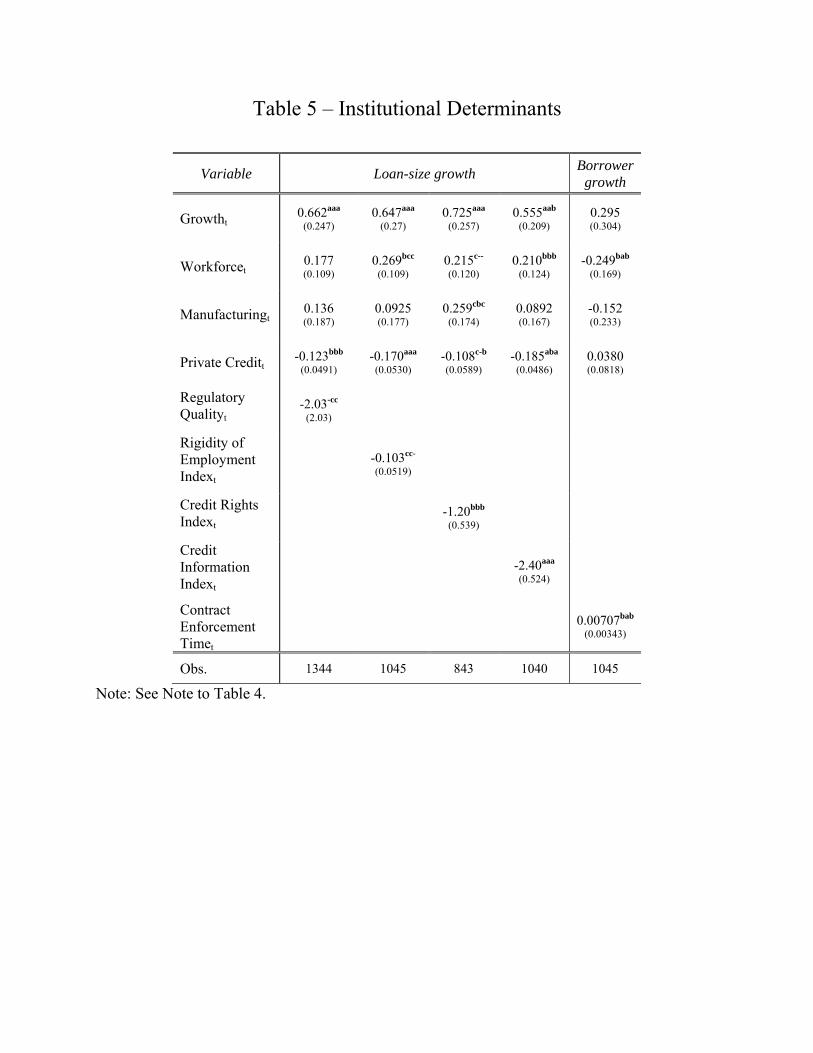
Table 5 – Institutional Determinants
Variable Loan-size growth Borrower growth
Growtht 0.662aaa
(0.247) 0.647aaa
(0.27) 0.725aaa
(0.257) 0.555aab
(0.209) 0.295
(0.304)
Workforcet 0.177
(0.109) 0.269bcc
(0.109) 0.215c--
(0.120) 0.210bbb
(0.124) -0.249bab
(0.169)
Manufacturingt 0.136 (0.187)
0.0925
(0.177) 0.259cbc
(0.174) 0.0892
(0.167) -0.152 (0.233)
Private Creditt -0.123bbb
(0.0491) -0.170aaa
(0.0530) -0.108c-b
(0.0589) -0.185aba
(0.0486) 0.0380 (0.0818)
Regulatory Qualityt
-2.03-cc
(2.03)
Rigidity of Employment Indext
-0.103cc-
(0.0519)
Credit Rights Indext
-1.20bbb (0.539)
Credit Information Indext
-2.40aaa
(0.524)
Contract Enforcement Timet
0.00707bab
(0.00343)
Obs. 1344 1045 843 1040 1045
Note: See Note to Table 4.
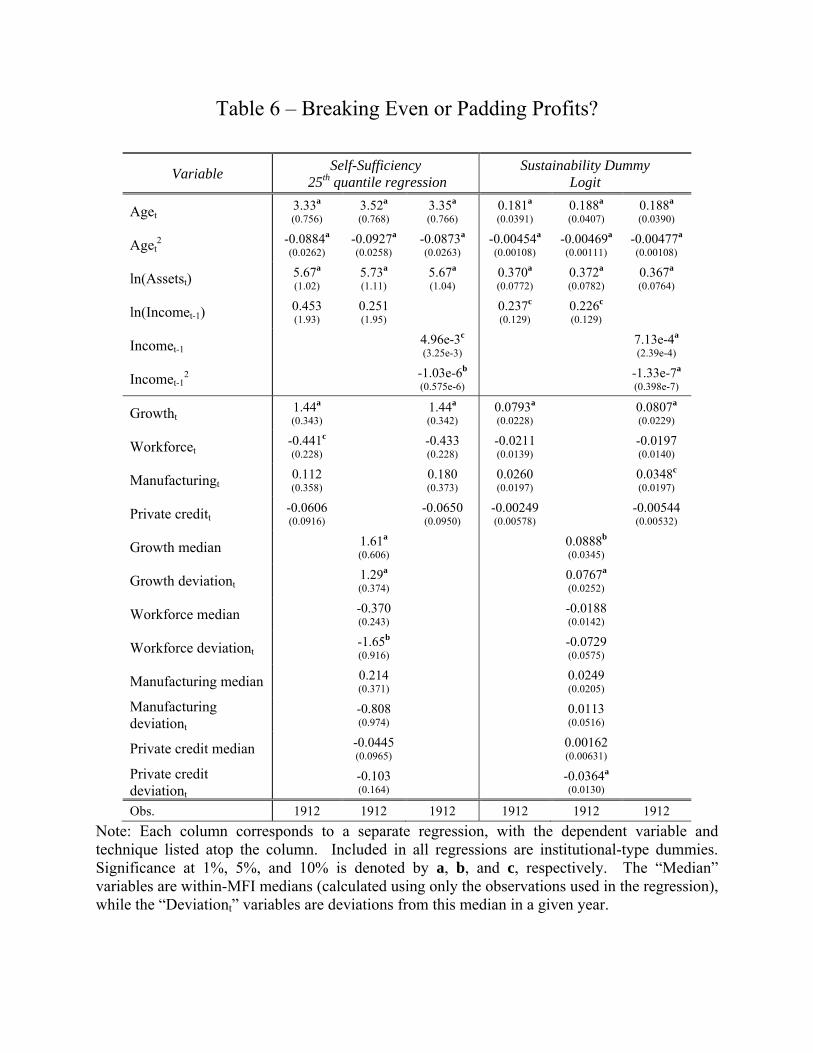
Table 6 – Breaking Even or Padding Profits?
Variable Self-Sufficiency 25th quantile regression
Sustainability Dummy Logit
Aget 3.33a
(0.756) 3.52a
(0.768) 3.35a
(0.766) 0.181a
(0.0391) 0.188a
(0.0407) 0.188a
(0.0390)
Aget2
-0.0884a
(0.0262) -0.0927a
(0.0258) -0.0873a
(0.0263) -0.00454a
(0.00108) -0.00469a
(0.00111) -0.00477a
(0.00108)
ln(Assetst) 5.67a
(1.02) 5.73a (1.11)
5.67a
(1.04) 0.370a
(0.0772) 0.372a
(0.0782) 0.367a
(0.0764)
ln(Incomet-1) 0.453 (1.93)
0.251 (1.95) 0.237c
(0.129) 0.226c
(0.129)
Incomet-1 4.96e-3c
(3.25e-3) 7.13e-4a
(2.39e-4)
Incomet-12 -1.03e-6b
(0.575e-6) -1.33e-7a
(0.398e-7)
Growtht 1.44a
(0.343) 1.44a
(0.342) 0.0793a
(0.0228) 0.0807a
(0.0229)
Workforcet -0.441c
(0.228) -0.433
(0.228) -0.0211 (0.0139) -0.0197
(0.0140)
Manufacturingt 0.112 (0.358) 0.180
(0.373) 0.0260 (0.0197) 0.0348c
(0.0197)
Private creditt -0.0606 (0.0916) -0.0650
(0.0950) -0.00249 (0.00578) -0.00544
(0.00532)
Growth median 1.61a
(0.606) 0.0888b
(0.0345)
Growth deviationt 1.29a
(0.374) 0.0767a
(0.0252)
Workforce median -0.370 (0.243) -0.0188
(0.0142)
Workforce deviationt -1.65b
(0.916) -0.0729 (0.0575)
Manufacturing median 0.214 (0.371) 0.0249
(0.0205)
Manufacturing deviationt
-0.808 (0.974) 0.0113
(0.0516)
Private credit median -0.0445 (0.0965) 0.00162
(0.00631)
Private credit deviationt
-0.103 (0.164) -0.0364a
(0.0130)
Obs. 1912 1912 1912 1912 1912 1912 Note: Each column corresponds to a separate regression, with the dependent variable and technique listed atop the column. Included in all regressions are institutional-type dummies. Significance at 1%, 5%, and 10% is denoted by a, b, and c, respectively. The “Median” variables are within-MFI medians (calculated using only the observations used in the regression), while the “Deviationt” variables are deviations from this median in a given year.