Embed Size (px)
Citation preview
The Journal of Entrepreneurial Finance The Journal of Entrepreneurial Finance
Volume 6 Issue 1 Spring 2001 Article 9
12-2001
Where Do We Stand on Closely-Held Firm Valuation? Where Do We Stand on Closely-Held Firm Valuation?
William P. Dukes Texas Tech University
Follow this and additional works at: https://digitalcommons.pepperdine.edu/jef
Recommended Citation Recommended Citation Dukes, William P. (2001) "Where Do We Stand on Closely-Held Firm Valuation?," The Journal of Entrepreneurial Finance: Vol. 6: Iss. 1, pp. 129-155. Available at: https://digitalcommons.pepperdine.edu/jef/vol6/iss1/9
This Article is brought to you for free and open access by the Graziadio School of Business and Management at Pepperdine Digital Commons. It has been accepted for inclusion in The Journal of Entrepreneurial Finance by an authorized editor of Pepperdine Digital Commons. For more information, please contact [email protected], [email protected], [email protected].

The Journal o f Entrepreneurial Finannce 6 (1) 2001
Where Do We Stand On Closely-Held Firm Valuation?
William P. Dukes
ABSTRACT
This paper contains a review of issues pertaining to the valuation of privately held businesses, noting significant inconsistencies in the rationale and approaches taken in the valuation process. In addition to suggesting that appraisers stay with the “tried and true” rather than testing the obsolete, it may be desirable for an experiment to be conducted with a “friends of the Tax Court” idea, in which a few select extremely well qualified appraisers offer assistance in the Tax Court’s deliberations on valuation issues.
INTRODUCTION
With some 25 million businesses in operation, and less than one-half of one percent traded in any meaningful way, the need for valuations of small and/or privately held businesses is large and increasing. Valuations will be made, in many cases required to be made, for various reasons, i.e. sale of a minority stock position; sale of the entire business; going public; estate, gift and inheritance tax purposes; the formation of a limited partnership; or valuation for the purpose of forming an Employee Stock Ownership Plan (ESOP) and annually following the startup of an ESOP. However, the magnitude of the need is dwarfed by the lack of consistency in the valuation process.
The appraisal of individual assets can be accomplished but is much more appropriate when a firm is being liquidated or assets are being sold individually rather than valuing the business (the full package of assets) as a “going concern”. The summation of market prices of outstanding securities requires a market that is not available for closely-held businesses.
The concept of valuation based on capitalization or the discounting of prospective earnings was summarized by Dewing (1953) years ago as follows: “In spite of the practical difficulties of determining a definite and precise value for a specific business the capitalization of earnings is the only means at our disposal for the value of a going business.” Not only is the literamre clear, but the law is well established. In a series of decisions, the U.S. Supreme Court has laid down the rule that the value of a business depends primarily on the expected future earnings of the enterprise. In the Galveston, Harrisburg and San Antonio case, Justice Holmes said that, “The commercial value of property consists of the expectation of income from it.”
The position taken by Bonbright (1937) is that, “The theory is that the present value of any object of wealth is simply a discounted or capitalized valuation of the anticipated services derivable by the owners of wealth.”
W illiam P. D ukes • Finance Area, C ollege o f B usiness Administration, Texas Tech University. Lubbock Texas
T h e J ou rn a l o f E ntrepren eu ria l F inance 6( 1) Copyright© 2001 by AEF- A cadem y o f Entrepreneurial Finance
ISSN: 1057-2287 A ll rights o f reproduction in any form is reserved.
129
The Journal o f Entrepreneurial Finannce 6( 1 ) 2001
Revenue Ruling 59-60 (1959) requires the finding of a “fair market value” for the trade, sale, or exchange of assets. Without transactions between a willing buyer and a willing seller, there must be a way to satisfy the requirement of fairness.
The purpose of this paper is to review prevailing concepts and practices in the valuation of small and/or closely-held businesses and offer a suggestions for consideration. The first part involves a discussion of various methods of valuing businesses with special attention given to three approaches found to be given more attention than considered practical. This part ends with a review of empirical tests made of a fairly broad number of valuation approaches. The second part includes consideration of the approaches and factors needed to estimate capitalization/discount rates used in the valuation process. The third part pertains to the various discounts applied to “as if actively traded” values to reach the level of value considered appropriate in the literature. The fourth part contains a review of tax court findings, which sets the stage for the final part that contains suggestions and recommendations on what can and should be done to assist the tax courts and the taxpayers.
METHODS OF VALUATION
According to a classical authority (Bosland 1963), the value of a business enterprise may be determined by four methods: 1) summation of appraisal value of individual assets, 2) summation of the market prices of the outstanding securities, 3)capitalization of realized or prospective earnings, and 4) some combination of these three methods.There are a number of different approaches to valuation used by appraisers. In a survey of members of the American Society of Appraisers (ASA) and the Institute of Business Appraisers (IBA), Dukes, Bowlin and Ma (1996) identified ten approaches which were reported to be used in the process of valuing privately held businesses. They are:
1. Present value of cash flows, after salary, before interest and taxes2. Present value of cash flows, after salary, interest and taxes3. Present value of income, after salary, before interest and taxes4. Present value of income, after salary, interest and taxes5. Present value of dividends or draw6. Multiple of sales7. Multiple of income, after salary, before interest and taxes8. Multiple of income, after salary, interest and taxes9. Comparable firms10. Book value
The IRS Valuation Guide (1994) lists ahemative approaches, as shown below.
1. Adjusted book value2. Comparable price3. Excess earnings4. Capitalization of earnings5. Discounted fiiture earnings, and6. Discounted cash flow.
A comparison of these valuation approaches is shown in Exhibit 1. The valuation approaches shown as ASA/IBA are those suggested in the survey and marked by the practitioners as the methods they used in the valuation process. The approaches listed in the IRS Valuation Guide pertaining to the discounting of cash flows, capitalization or discounting of earnings, comparables and book value are
130
quite similar. The IRS Guide describes no approach which uses earnings or cash flow on a before interest and taxes basis. Recognition is given to the fact that most small, closely-held businesses do not pay regular dividends but the IRS Guide as well as Revenue Ruling 59-60 recognize “dividend paying capacity” and very few AS A/IBA members use the present value of dividends or the draw. The multiple of sales is more often used as a cross check or verification of reasonableness rather than a valuation approach by practitioner and not shown as a method of valuation by the IRS Guide. In spite of the IRS repudiation of the “excess earnings” approach some appraisers continue to believe that the approach has merit.
Exhibit 1Comparison of Valuation Approaches
ASA/IBA Survev Approaches IRS Valuation GuidePV cash flow, after salary, before interest & taxes None similarPV cash flow, after salary, interest & taxes Discounted cash flowPV of income, after salary, before interest & taxes None sunilarMultiple of income after salary, before interest & taxes None similarPV of income, after salary, interest & taxes Capitalization of earnings.Multiple of income, after salary, interest & taxes Discounted future earningsPV of dividends or draw None similarMultiple of sales None similarComparable firms Comparable PriceBook Value Adjusted book valueNone similar_______________________________________ Excess earnings_____________
The Journal o f Entrepreneurial Finannce 6 ( 1 ) 2001
In the sections that follow, we will examine several of the more popular methods of valuation in more detail. Specifically, we will consider the methods of (1) book value, (2) market comparables, and (3) excess earnings. (The valuation approaches involving earnings capitalization and discounted cash flows are not included because few if any appraisers ever question the validity on using these techniques.)
Book Value
In a survey of small companies, each of which had stock repurchase plans. Block (1985) found that the most important measure of market value was book value, pcirticularly when no formal outside appraisal was made. There is a tendency by some—including analysts who should know better—to believe that book equity represents market value. In the extreme, equity ftands may be invested in assets that are not productive, or, in some cases, is invested in assets capable of producing products for which there is no longer a market. It is not unusual for firms which are growing to sell at multiples of book equity, in many cases at five to ten times the dollar amounts shown in the equity section of the balance sheet.
Based on the survey by Dukes et. al (1996), book value is recognized as practical by about 12 percent of the ASA/IBA respondents, but is given relatively little support in the literature or by most practitioners, except when adjusted in a very significant way. Longenecker (1983) states that “it is universally agreed that book value is not a reliable indicator of asset values” and cites court cases as justification (Hicks 1974; Estate of Charles H. M. Atkins 1951; and Estate of Huntsman 1976). Other authors suggest using adjusted book value for firms owning substantial natural resources and for
131
financial firms (Walker and Petty (1986); and Bonbright, (1937)). Pratt (1986, 1996) recognizes that some practitioners use book value and that Revenue Ruling 59-60 (1959) requires “consideration” of book value, among other factors, in the valuation process. In a more theoretical way, Ohlson (1995) uses book values as a primary value indicator. He suggests that book value is an approximation of market value when adjusted for any abnormal earnings, and other information. He uses accounting data to “re-express the present value of expected dividends formula as being equivalent to book value plus the present value of expected abnormal earnings.”
Market Comparables
Market comparables, market approach, guideline public company method and even comparable price approach all carry the same meaning, which is to develop value measures or standards based on firms which are similar to the closely-held firm being valued, but have securities that are actively traded. If comparability requirements can be met, measures such as price-earnings ratios, betas, growth rates, risk measures and other financial ratios can be applied to the closely-held firm in the valuation process.
The difficulty and even misuse of market comparables for valuation purposes can be demonstrated by an anecdote. Not many years ago an IRS agent selected five companies as “comparables”, with comparability defined as the raw material for the manufacmring process which was a plastic base. Two of the firms selected were in financial distress with low recent earnings and consequently high P/E ratios. In the agent’s eyes these firms were similar because they were manufacturing products from plastics.
Miles (1993) has developed axioms of business valuation, including “Comparable does not mean identical,” and “Comparable means both similar and relevant.” Clearly “identical” goes much too far to be reasonable and “Similar and relevant” appear to leave the door open for different interpretation.
Among other factors, the price-eamings (P/E) ratio is influenced by risk (however measured) and expected growth of sales and earnings. Appraisers tend to use the P/E of the comparable firm, usually much larger and actively traded, and invert it to use the E/P ratio to capitalize earnings. Besides normalizing earnings, as most agree, the inverted P/E is most critical and should be as close to “identical” as possible in view of the extreme sensitivity of value to the capitalization rate.
To apply the market comparable approach in valuing a firm, we have to decide on what dimensions we should use to compare the firms. Pratt (1986) indicated that comparability covers the asset mix, age of assets, accounting policies, comparative capital structures, return on equity, and size. Similarly Plutchock (1985) argues that comparability means the same line of business, same size range, similar capital structures, and vital financial ratios, especially those concerning earmngs, and stock which is freely and fairly traded.
Longnecker (1983) reinforces Pratt and Plutchock by stating that “comparability will depend on many factors, including similarity of product line, risk, size, capital structure, competitive position, reputation, management ability, and growth prospects.”
Pratt (1996) later referred to Tallichet (1974) in which the court emphasized “guideposts in determining comparability” which included: 1) capital structure; 2) credit status; 3) depth of management; 4) personal experience; 5) nature of competition; and 6) maturity of the business.
In Estate of Victor R Clark (1976), Pratt (1996) quoted the court as saying that it is “impera
The Journal o f Entrepreneurial Finannce 6 ( 1 ) 2001
132
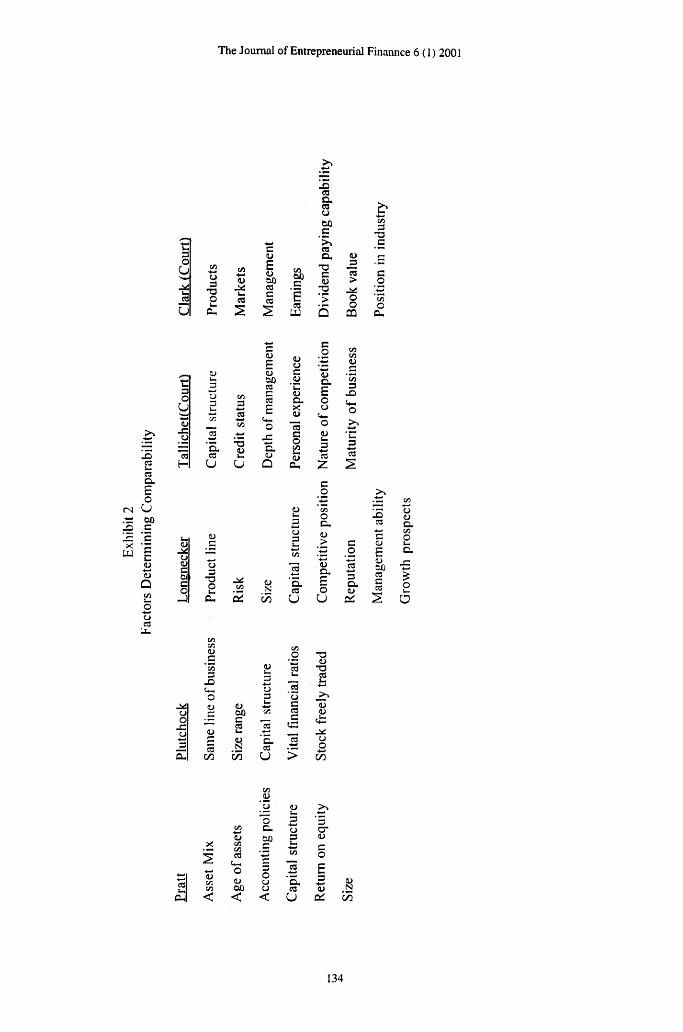
tive that the characteristics of the subject company and the purportedly comparable company, relevant to the question of value be isolated and examined so that a significant comparison can be made.” The factors cited by the court were: 1) Products; 2) Markets; 3) Management; 4) Earnings; 5) Dividend- paying capacity; 6) Book value; and 7) Position of company in industry.A summary of the foregoing factors used to indicate comparability is shown in Exhibit 2. The five views of comparability leave a similar message to all appraisers - you may not assume comparability by merely finding other firms that are actively traded and use market data from the traded firm in the valuation of the closely-held firm. As different as the listing appears to be for the five views the appraiser is cautioned that no one factor is adequate to assume comparability. Four of the five say capital structure is important; three out of five stress size, product line and management; two out of five stress financial ratios and competition. Without placing a weight on each factor, the appraiser is advised to do some homework before making an assumption of comparability.
The Journal o f Entrepreneurial Finannce 6 ( 1 ) 2001
In looking at the relationship between firm size and valuation, Peters (1995), observed that the price/eamings ratios for firms valued at less than $25 million were 26 percent less than those valued at $ 100 million or more. However, a $100 million firm is still small. In relating price/eamings ratios of firms over $ 1 billion in value, the analyst should consider the size differential and the impact on the assumed (comparable) firm to the much smaller firm. Miles (1992) reports mean P/E ratios for various sized small businesses, ranging from 1.66 for a firm $49,000 or less, up to a P/E of 4.26 for firms $500,000 to $1,000,000. A plot was made using IBA Market Data Base of “actual sales of several thousand closely-held businesses” of smaller size firms. The plot confirms “a definite upward trend in P/E ratios as company size increases.”
Because the P/E ratio has been shown to increase with size, the choice of a firm or firms or even the industry P/E ratio selected as “comparable” could very well result in wide variation in the value findings. Exhibit 2 contains a listing of factors important to the choice of the firm or firms considered to be comparable. The lack of special care in selecting discount rates, P/E ratios, betas and other variables from “comparables” could cause considerable variability in valuations reported. Numerous authors [McCarthy and Healy (1971); Eber (1984); Plutchock (1985); Sherman (1994); Leach (1998); Tibegien (1987)] among others and most of the authors testing the “excess earnings” approach recommend using “comparables” as the primary source of valuation variables.
Excess Earnings/Formula Approach
The “excess earnings” approach is based on the assumption that an analysts can determine what part of the economic income comes from tangible assets and establish that rate of return, and then determine what part of the economic income comes from intangible assets and determine the rate of return appropriate to be applied to intangible assets. Frequently, the advise is if you have trouble making that determination use 8 to 10 percent for tangible assets and 15 to 20 percent for intangible assets. Users of this approach appear to believe that the capitalization rates in 1920, 1931 and 1998 will be the same.
Mastracchio and Lippitt (1996) used larger, actively-traded securities to make a tie to market data in their regression analyses to estimate price/eamings ratios separately for the larger companies. The authors then estimate the returns on both tangible and intangible assets which they use to support
133
The Journal o f Entrepreneurial Finannce 6 ( 1 ) 2001
t:io
-2U
<u
c<uE(Uax)COcRS
GOC
scauu
otocreCXT 3C(U
."2>
(U_3>
OoQQ
3•X3C
oCL.
X)2aQ,pO
<N U .t; 00 c
XUJ p
nwCJQ
■d3OU"SJ5o”e3H
c:(UEunoCOnccE
iS .ts --Q.a
U
T3(UU.o
c.OJ
O
r"01s
o3T3OI- •— .i::
<L)CL,
(Uo c .Si<u Q,
215 ® c o
(UCl,Eoo
asz
co
3JD
KJ
I/Oo CflL. O3 c.O3ki
(U> c
W2 '■Jj _o—• re
(Ure
’5.n,E 3
OhN re o <L>C /5 O U a;
JD
<UE1)S3C«
u<uo.t/3O
PO
CJOi-iu
cu
5 —
<L)00I
f/3 GOC.re
U
orec
•o(UT3s
uO
Ch
•— Cfl .3
O<L>00<
«3
‘5 o' u.o 3C . CJ
31-1to
3 reO ."tiCJ o.CJ re< U
O"(U
E3"S
c/3
134
the “excess earnings” method of valuing small firms. It would appear that the advise to discontinue use of this approach from Pratt (1986), Schih (1984), Plutchock (1985), Longenecker (1983) and Eber (1984) was given little consideration in determining that the “excess earnings” is a superior method. In their evaluation of the accuracy of appraisal methods, Harper and Rose (1993) listed fourteen different approaches, without mention of the “excess earnings” approach. (Do they deserve a Gold Star?) The appraisal industry would be better off without this approach.
The “Excess Earnings” approach to placing a value on a closely-held firm appears to have wide acceptance and considered to be one of the most “misused” approaches to valuation. The approach was developed and published in 1920 by the U.S. Treasury Department, Appeals and Review Memorandum Number 34 (ARM 34). Justification for the approach was that “Prohibition” caused those firms in the business of producing alcoholic beverages to lose “goodwill” value. The design was to be able to distinguish between the value of the earning assets and the value of those intangible assets, such as goodwill.
In 1968 Revenue Ruling 68-609 (RR 68-609) stated that “The ‘formula’ approach may be used in determining the fair market value of intangible assets of a business onlv if there is no better basis available for making the determination.” In brief the “formula” is to determine a return on tangible assets “prevailing in the industry,” which if it is not available, “a percentage of 8 to 10 percent may be used.” The 8 to 10 percent return on tangible assets is deducted from the average earnings of the business. The remainder is assumed to be the average annual earnings from intangible assets, which are capitalized at 15 to 20 percent to determine the value of intangible assets.
Any number of researchers have reviewed the “Excess Earnings” method of appraisal. Peterson (1989) indicated that the excess earnings method is used widely, with questionable accuracy, but he had a preference for capitalization of earnings “which is as accurate as any method.” Kurzman (1988) called it an industry method but provides little support for its use, even though he explains how it can be used. Kissin and Zulli (1988) gave recognition to the excess earnings approach (or the Treasury method) and illustrated the approach by using 10 percent as the normal return on net tangible assets, and 30 percent to capitalize earnings allocated to intangibles. The excess earnings approach is recommended by Howard (1982), Crandall (1985) and Hayes and Finley (1989), with some embellishment over the revenue ruling description. The probability of consistency and accuracy are quite low.
Ledereich and Siegel (1990) refer to the “formula” method as “a superior approach” and in 1990 use the 8 percent remrn on tangible net assets to illustrate use of “excess earnings” methodology as a valuation approach. In the illustration the authors apply a multiplier of 4 to “excess earnings” (equivalent to a capitalization rate of 25 percent.)
It appears reasonable to ask how the “excess earnings” approach proponents would value “intangibles” if the return for the firm being valued was less than the normal earning used in the valuation process. Zero value could be possible for the value of “intangibles”, but if return on assets were less than the “normal” return, could this amount to a negative value for the intangibles?
Pratt (1996) quotes the denunciation of the “excess earnings” approach by the IRS as relegating the “formula to a position of being a last resort” and that the approach “resulted in many improper appraisals,” such as “the same value would be found in 1960 as in 1933,” at least partially because “the rates of return which are applied to tangibles and to intangibles are completely arbitrary and have no foundation in fact....” The expectation is “to get a good answer based upon two bad guesses.” Schih (1984) appears
The Journal o f Entrepreneurial Finannce 6 ( 1 ) 2001
135
to agree with Pratt (1996) as to the worth of the “excess earnings” approach by his statement that “One method that should be excoriated is the excess earnings/formula approach.”
Since the “excess earnings” approach has been repudiated by the IRS, questioned by some [Peterson (1989); Kurzman (1988)], and castigated by some of the more experienced appraisers [Pratt (1996); and Schilt (1984)], the excess earnings approach should be eliminated from valuation approaches considered to be valid. It appears as though the economic environment is assumed to be the same whether the country is in a recession, deep dark depression, or in a raging bull market. Many of those supporting the approach fall back on a “normal” asset earnings rate of 8 to 10 percent and 15 to 20 percent appropriate for the excess earnings. It is inconceivable that these rates could apply to every company in every industry and in every economic environment. The assumption appears to be that all earnings assets will have the same earnings rate and likewise all intangible assets will have the same earnings rate. Using these unrealistic assumptions will “resuh in ...improper appraisals.” [Pratt 1996]. Use of such a controversial approach will not give confidence to a valuation.
Rules o f Thumb
The term “Rules of Thumb” refers to various observation, ratios and relationships that have evolved from actual sales of small businesses, and were passed on initially by word of mouth but in more recent times can be received from business brokers and trade associations. Partial credit for development of the “rules” has been attributed to the inadequacy and inaccuracy of financial statements by many small businesses. For the most part the “rules” are intended to be supportive of valuations, not replace them.
Taub (1993) finds agreement with certain tenets offered earlier by Wright (1990) regarding the misapplication of rules of thumb. For Taub, rules of thumb are overly simplistic; they should never be used alone; and they are useful as a rough cross-check against other approaches and methods. However, by dint of usage, they have the tendency to become self-fulfilling prophecies. As Taub notes, “Rules of thumb probably had their origin in the actual buying and selling of small businesses, where through a certain amount of observation of actual sales, the rules gradually evolved and via word of mouth became known by buyers, sellers, business brokers, trade associations and publications.” (Taub 1993, p i3).
Testing o f Models
A number of researchers have examined the relative accuracy of the various valuation approaches. Waldron and Hubbard (1991) found a range of values from $6 million to $17.5 million for the same firm, depending on the approach taken. Miles (1993) reported results of a poll of 64 business appraisers that indicated an error range across different methods of 10 to 25 percent, with a mode of 17 percent and an average of 22 percent. Pratt (1989) indicated that the high end of a value range may be 50 percent or more above the low end.
Mastracchio and Lippitt (1996) performed a comparison of the excess earnings approach to the capitalization of earnings. With a smaller sample and a restriction placed on the size of the value of firms included, the authors used regression analysis (regressing value on earnings) to estimate the price-eamings ratio for each of six industries to be used in the capitalization of earnings model. The regression technique was also used to estimate the returns on tangible and intangible assets for each of the six industries. This procedure ties the rates used for the excess earmngs model to market determined discount rates, all using large firms. The authors conclude that “the excess earnings model
The Journal o f Entrepreneurial Finannce 6 ( 1 ) 2001
136
provides results that are superior to those of the earnings capitahzation model®”. The research by Boatman and Baskin [1981] and by Schilt [1984] are reported to be more favorable for the capitalization of earnings model in both cases,
Hickman and Petry (1990) compared valuation models by differences between values predicted and actual values. Harper and Rose (1993) and Hickman and Petry (1990) used the same basic approach to comparing valuation techniques, except that Harper and Rose excluded litigation-related valuations. ). Furthermore, Harper and Rose evaluated 14 methods of valuation, compared to seven for Hickman and Petry. Harper and Rose’s tests covered ten industrial categories, and Hickman and Petry used three categories but also covered three different time periods. Finally, Harper and Rose’s data base was closely-held businesses, which is more relevant in the valuation of small privately-held businesses, compared to Hickman and Petry’s sample of large, publicly held firms.
For Harper and Rose, the poorer methods included capitalized revenue (36.88% error), and unadjusted book value (-35.47% error). The two best methods were combinations of capitalized earnings and adjusted book value (61 firms, 5.99% error) and capitalized earnings and comparable sales (10 firms, -6.32% error). It was also noted that “Consultants with prior experience and academic faculty were found to have the smallest errors and standard deviation of errors” (Harper and Rose, 1993.)
Hickman and Petry (1990) tested muhiple versions of Gordon’s model [value = Dj/(kg-gj^)],
and the two stage Gordon’s model; the Bader case model: value = [.5(EPS)(P/E) + .25 (company dividend yield industry dividend yield) + ,25 (.625 book value)]; the Central Trust case model: V=[.5(EPS)(P/E) + .3 (company dividend yield industry dividend yield) + .2 (book value)(book to market)]; and a cross-sectional P/E model (regressing beta, expected growth, and payout using market data for three industries at three different time periods, against P/E). The range of errors reported were quite large. The poorest results are indicated by the largest mean absolute error (MAE) as shown below:
Approach Used Mean Absolute Error Multiple of P/EModels
The Journal o f Entrepreneurial Finannce 6 ( 1 ) 2001
Gordon single stage 25.96 4.21Gordon two stage 20.48 3.32Bader and Central Trust 9.33 1.51P/E models 6.17
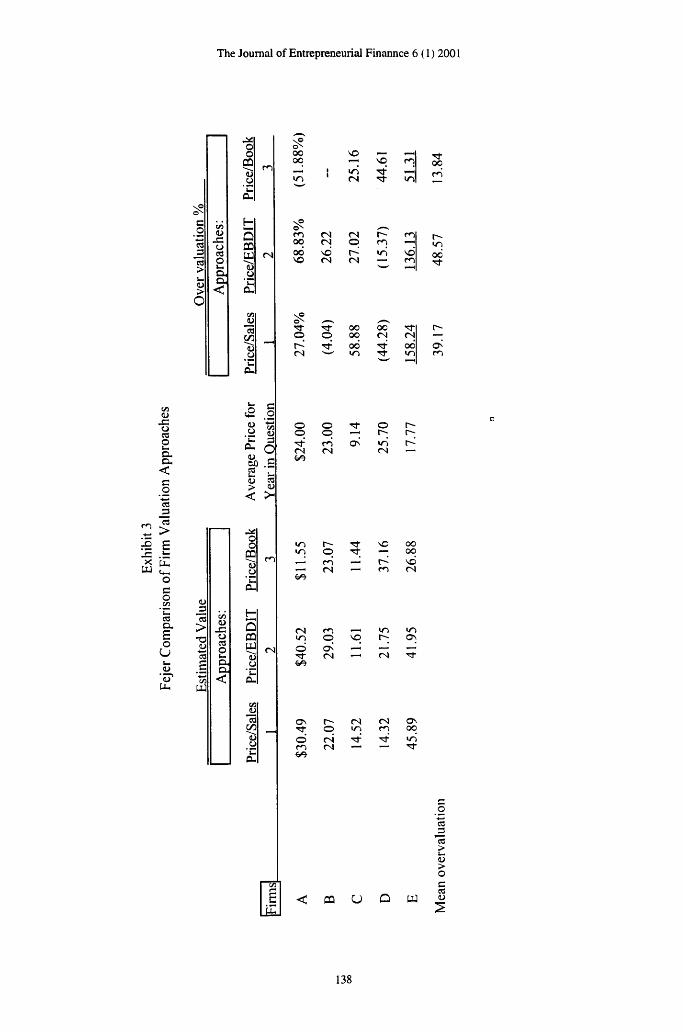
Another illustration of inconsistency is shown by Fejer (1995) collecting Value Line data for 18 firms in the same industry as the closely-held firm being valued. From the list of 18 firms, the analyst selected 5 firms, stated to be the smallest, when in fact only two of the five were in the smallest category. The smallest five firms (not the five used) were about 6.7 times the size of the closely- held firm. The average size of the 18 firm sample was 16 times the size of the private firm. Based upon the arbitrarily selected firms, the following three ratios were used to value the firms.
• Price/Sales• Price/EBDIT• Price/Book
The results are provided in Exhibit 3. In looking at the exhibit, we note the following:1. The use of a price/sales ratio to value the selected sample, showed a smaller average over
valuation, but with a very large range from a negative 44.28 percent to a positive 158.24 percent.
137
The Journal o f Entrepreneurial Finannce 6 ( 1 ) 2001
C.O
cd>u>
(Uoc«oa.O h
<
d>-CoC3
2c.o.<c
_o"S
C >le E^ .h: X LUw Z
o c o
COClBoUQJ‘c?Uu
d>
«>■o
£
UJ
(Uoca2cuo.<
(UtaCSu.(U><
CBC/3
(N
<N
0000
VOVO r n
i n(N '51- IT)
Tf00
m JN (N moo (N O —od vd U-) vdVO (N <N m
r-W-)00
6^OO
O P oo (N <Nod TT od
(N m IT)
o O O r-p p
rn iri<N (N <N —
O'
vO ooin p oo
rn vd(N m (N
(N m U-) mIT) p VO r-; O)O cK€»e
(N CN
o r- (N <N Ovp rn 00
o (N irim «N — —€>e
CQ U PJ
i±tJ
138
2. The application of the Price/EBDIT ratio to the selected sample shows an overvaluation on average approaching 50 percent, but that ratio was still used to estimate the value for a closely-held firm, which was less than 16 percent of the size of the sample firms used. Could size be part of the problem?
3. In the application of the Price/Book (Market/Book) approach, the standard deviation (37.39%), and mean (13.84%) are relatively small, but the coefficient of variation (2.7) is by far the largest of the three processes, which means that it is the least predictive of the three on a relative basis.
The unreliability of these approaches is further shown by the high unexplained variance. These variances, as reported in the original research, are presented in Exhibit 4.
The Journal o f Entrepreneurial Finannce 6( 1) 2001
Exhibit 4Approach Reliability
Variance . Variance Approach Explained Unexplained (1-R -)
Price/Sales .0003 .9997Price/EBDIT .2296 .7704Price/Book Value .2679 .7321
Some researchers have also looked at the valuation accuracy of different analysts. In studies by Waldron and Hubbard (1991) and Hubbard and Waldron (1988), appraisers were categorized as either investors (defined as entrepreneurs, venture capitalists, and investment bankers) or consultants (valuation consultant, business appraiser, and CPA/consultant). Thirty business valuation experts were asked to conduct a case study leading to the valuation of a small avionics firm, which had been sold for about $18.5 million. Participants were requested to assign a value to the firm and explain the valuation approach applied. The same package of information was provided to all participants and included the information considered sufficient for most business valuation approaches. All of the investor group assigning a value did so using an earnings multiple. Members of the investor group who assigned a value to the avionics firm project, based on an earnings multiple approach had a mean value of $8.85 million. In contrast, the consuUant group assigned a mean value of $13.17 million using either an earnings multiple or a discounted cash flow approach - they were evenly divided between the two approaches. The variability in the key variables (i.e., multipliers, discount rates and cash flows) was quite large. The range of sales prices was $6 million to $17.5 million, with an average of $ 11.15 million. Thus the consultant group assigned mean values almost 50 percent higher than assigned by the investor group, but about 30 percent below the actual sale price.
In Bader vs United States (1959) tlie valuation by the Plaintiff’s expert for Bader stock was $428 per share, after taking a 25 percent discount for nonmarketability. The Government placed a value on the stock of $1,405 per share, after taking a 15 percent discount for nonmarketability and the Court’s value was $642 per share after a 10 percent discount for nonmarketability. In the Central Trust Company case (1962), the donor applied a price of $7.50 per share and three experts for the donor found values ranging from $7.88 to $9.50. The Internal Revenue Service Commissioner set the value at $24.00 per share and the defendants expert estimated the value of $21.85 per share. Following the approach use in Bader(1959) various weightings were given to a muhiple of earnings, dividend yield
139
and book value. The court allowed a value of $15.50 per share by following the Bader approach and applying a discount for nonmarketability of
12.17 percent. As indicated by others the court value ($15.50) came very close to “splitting the difference” between the taxpayer ($7.50) and the IRS ($24.00).
In summary, the confidence that we can have in any technique used to value a privately held firm is limited at best. As Miles (1993) observed in his axioms, “appraising, by any method, is not a highly accurate process.” Furthermore, usefulness of dividend discount models could be called in question in valuing closely held firms, most of which do not pay dividends. Also, some prefer to believe that they can find usable market data from multibillion dollar firms to apply to firms with a size of less than $25 miUion, and avoid the advice provided by Pratt (1986), Plutchock (1985), Longenecker (1983) and others as to what “comparable” means in trying to find price-eamings ratios to apply in valuing small businesses. The good news is that appraisal accuracy could well be improved by the use of relatively simple models that show smaller errors and fit the requirements of closely-held firms. Harper and Rose (1993) found that “adjusted book value, capitalized earnings and past transactions produced lower error estimates of share values.. An application of these techniques should provide greater accuracy because their research was conducted on small, closely-held firms.
From the most relevant empirical findings, reported by Harper and Rose (1993), the single approach that appears to be the most acceptable is capitalized earnings which is both simple to apply and more accurate than any other individual approach. It must be realized, however, that financial statement adjustments must be made prior to the use of earnings as stated. In addition to capitalized earnings, when truly comparable market data are available, use of market data such as the P/E ratio to be applied in combination with capitalized earnings would be very desirable. In like fashion relationships from truly comparable firm s sales transactions or market data could be most beneficial. The real problem is in finding realistically comparable firms. When the appraiser has high confidence in the quality of growth of earnings, the discounting of future earnings of five to seven years, or the discounting of cash flows would be most appropriate. It is misapplication of a technique to gather market data from multi-billion dollar actively traded firms and expect data to be comparable to a small closely-held firm. In addition it would be misapplication of a technique to use “rules of thumb” as the sole approach to value a closely-held firm. To use the “rules” as a comparison or cross check for other techniques could be acceptable. The variability in value using acceptable techniques is quite high but misapplication of various approaches is no better than a shot in the dark.
DETERMINING A CAPITALIZATION RATE
A “capitalization rate” was proposed by Graham, Dodd and Cottle (1962) many years ago, for “capitalizing” a stream of earnings which are expected to grow at some specific rate. The capitalization rate can be considered to be a required rate of return or an opportunity cost. If the funds available could be applied to an alternative investment, the opportunity cost concept comes into play. Brigham and Gapenski (1996) state that “The discount rate (capitalization rate) should reflect the return that could be earned by investing the fiinds in the best alternative investment opportunity of similar risk” and that “the expected rates of return on financial assets are usually used to set the opportunity cost rate for all investment decisions.” Pratt (1996) and McMullin (1986) agree that a discount rate and a capitalization rate are defined in a way similar to an opportunity cost when referring to a “rate of return available on alternative investment opportunities with comparable risk.”
In distinguishing between discount rates and capitalization rates, Gilbert (1990) defines the
The Journal o f Entrepreneurial Finannce 6 ( 1 ) 2001
140
difference as a “steady-into-perpetuity” growth rate, clearly following Gordon’s growth rate used in his “constant growth” dividend model. With “k” as the required rate of return and “g” the constant growth rate “k-g” becomes the discount rate for a growing stream of benefits, whether earnings or dividends. In those situations in which there is no groulh in earnings and/or dividends the divisor shown by Gordon’s model still works with g=0. With no growth, the required return becomes a capitalization rate. [See Sliwoski (1992)].
The most popular choice in determining a required rate of return is using a risk-free rate plus a risk premium, and the eamings-to-price ratio of similar firms is a distant second choice (Dukes et al, 1996).
The Journal o f Entrepreneurial Finannce 6 ( 1 ) 2001
Risk-Free Proxy
Brigham and Gapenski [1996] and Harrington (1987), among others, believe that Treasury Bill yields are not true market yields and that Treasury Bond returns more adequately reflect long-term inflation and other aspects of long-term holdings of equity securities, but rather the nature of the difference calculation. More than 60 percent of practitioners responding to a question pertaining to the use of a “risk-free” proxy, selected a yield on Treasury bonds. (Dukes, et al, 1996). Pratt (1996) elects to use a “long-term Treasury bond yield, such as the 20-year Treasury bond,” as the “risk-free” component. Approximately half (51%) of the academics selected Treasury bills as the “risk-free” proxy (Dukes, et al, 1996). Martinez-Cuevas (1995), Melcher (1994), Miles (1982) and Fishman, et al (1995) follow the practitioners choice of “a long term treasury bond yield.” Gilbert (1990) states the issue in a more general way by stating that “the standard choices are U.S. government treasury bills, notes or bonds.” Hickman and Petry (1990) used long-term government bonds in their efforts to estimate a required return for testing the accuracy of various valuation formulas.
Equity Risk Premiums
King (1994) defines the equity risk premium (ERJP)as:
ERP = V - R f
where expected return on a fully diversified portfolio of equity
securities.
Rf = the rate of return on a risk-free investment.
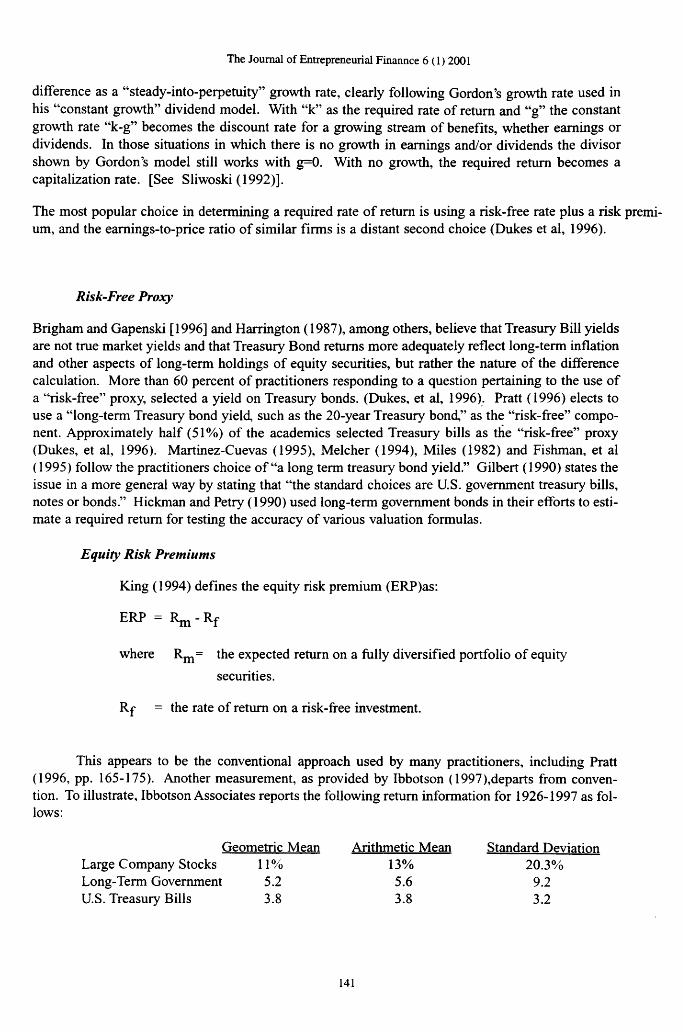
This appears to be the conventional approach used by many practitioners, including Pratt (1996, pp. 165-175). Another measurement, as provided by Ibbotson (1997 ),departs from convention. To illustrate, Ibbotson Associates reports the following return information for 1926-1997 as follows;
Geometric Mean Arithmetic Mean Standard DeviationLarge Company Stocks 11% 13% 20.3%Long-Term Government 5.2 5.6 9.2U.S. Treasury Bills 3.8 3.8 3.2
141
Using the conventional measurement, the equity risk premium would be:
ERP = R ^ - R f =.13 -.056 = .074 = 7.4%
In contrast, Ibbotson computes the risk premium as follows:
ERP = = 1.07008 - 1 = .07008 = 7.008%.1+/?/ 1.056
The Ibbotson approach follows the well known “Fisher effect” as described in Van Home (1994). The 39.2 basis point difference (7.4 % - 7.008%) can make a significant difference in the valuation process. This inconsistency, using identical data, is cause for concern.
There is no doubt that the “equity risk premium” fluctuates with the changes in market returns and interest rates. Further, there is no question about the application being a forward view, or what is expected. There is, however, a question about which data best represents that forward look. Generally speaking, the longer the time period the more likely the data base will provide a reasonable guide to the future. Selecting different time periods can provide different “equity risk premiums ranging from 3.7% to 7.2% (King, 1994). King also provides six different estimates of future market performance ranging from 1.3 percent to 6.5 percent. If we drop out the unreasonably low ERP estimate of 1.3 percent the average is 5.14 percent, using the same estimates calculated following the above Ibbotson approach yields an average ERP of 4.82 percent. If King used a risk-free rate of 5.5 percent in calculating the ERP, the range would be 3.51 percent to 6.82 percent. It appears as though the “guessing” at time periods provides little if anything more than having five different “guesses” for various time periods. Thus, the issue boils down to which approach provides the most confidence to the analyst.
In an efficient market context, expected return distributions are formulated by investors. “The observed remrn for period t + 1 is drawn from a return distribution that remains constant through time. Furthermore, the return for each time period is independent of the return in the previous period. Statisticians refer to these properties...as returns that are identically distributed and independent.” Sears and Trennepohl (1993 p 206). Thus, there is little justification for using six different estimates ala King, rather than the Ibbotson long-run averages.
Beaver, Kettler and Scholes (1970), Brigham and Gapenski (1990), Beaver and Manegold (1975), Gonedes (1973), and De Thomas (1985), among others, have suggested approaches to estimating a proxy for the market beta for closely held firms, all using accounting data. In the practitioner literature, however, no one was found to use the market beta proxy, other than “assume beta of one” when beta is not available (Mercer, 1989, p. 150).
A “build-up” approach is another way used to determine the appropriate risk premium for smaller firms. The “build-up” is the sum of the risk free rate, the equity risk premium and a small cap premium, when needed. However, the approach does not rely on a stock’s beta to estimate the equity risk premium, using instead an industry beta for “comparable” companies (Pratt 1996, p. 165). For a comparison of the “build-Up” capitalization and discount rate procedures, see Melcher (1994).
DISCOUNTS FROM VARIOUS VALUES
The IRS Valuation Guide (1994) defines lack of marketability “as the absence of a ready or existing market for the sale or purchase of the securities being valued.” If one has an asset that is illiquid because of a lack of demand, too much supply, or restrictions placed on the owner, recognition must be given to these factors and, consequently, a reduction in price may be required in order to
The Journal o f Entrepreneurial Finannce 6 ( 1 ) 2001
142
sell the asset. Most valuations of closely-held businesses begin with an “as if actively traded” price (as if the security in question is traded on the New York Stock Exchange), but since the asset is illiquid, a reduction in price is necessary to attract buyers.
Key Man Discount
Maher (1977) suggests that the loss of a key man substantially increases the risk to a company and that the required rate of return used in the valuation process could be increased by 30 percent if a successor has not been identified. If a successor has been identified but could take up to five years to develop, the increase required by a willing buyer could amount to 20 percent. A 30 percent increase in the required return would amount to a discount of about 23 percent. Longenecker (1983) cites a court case in which the court cut a 20 percent discount to 12 percent (which would translate into a required return increase of about 14 percent. Pratt (1996) cites a court case in which a 25 percent “key person” discount was recognized.
Minority Interest and Premium for Control
It should be clear that an owner or majority interest owner has control over a business in a very substantial way. A controlling stockholder can name himself/herself President and CEO, his/her spouse as Vice-President and Chief Operating Officer. The owner can determine salaries for all employees and hire or fire anyone, anytime, change the functioning in any way desired, or even liquidate the business. All day-to-day activities are under control of the majority owner. This amount of control is priced by the market. Actively traded stock is minority interest stock. In LBO’s, mergers, and acquisitions, the price paid for the right to appoint management, determine compensation, set policy, acquire assets, award contracts, sell or acquire treasury stock, declare and pay dividends and change the articles of incorporation, among other functions, is generally called a premium for control.
For any particular security, the dollar amount of the premium for control and a minority interest discount is the same. Assume that the control value of a business is $100 and that a minority interest price is $80. The “premium” for control is $20 or 25% premium over a minority or actively traded interest (20/80 = .25 or 25%). From the control value of $100, a minority interest discount is $20 (20/100 = .20 or 20%). The difference between a minority interest and the control value, in this case, is $20, and going from control value to a minority interest, the base is $100 so the discount is 20%, but going from a minority position to the control value the base is $80, so the premiimi for control is 25%.
For the time period 1985-1994, Mergerstat Review (1994) reported that the average “premium” for control paid in mergers and acquisitions amounted to 39.52 %. These data include 2501 transactions. This premium for control of 39.52% can be converted into a minority interest discount, as follows:
PremiumPaid
The Journal o f Entrepreneurial Finannce 6 ( 1 ) 2001
1 + PremiumPaid
.3952 .3952
■= minority interest discount
= .2833 or 28.33%1+.3953 1.3953
If an appraiser is concerned with valuing a minority interest with the control value known, he/she should apply the minority interest discount of 28.33% or multiply the control value by (1-minority interest discount). ( 1-.2833) = .7167. However, many prefer to use median data rather than averages. The ten year median for the control premium of the 2501 transactions is 31.24%; therefore the minority interest discount for the ten year time period would be:
143
The Journal o f Entrepreneurial Finannce 6 ( 1 ) 2001
.3124= .2380 or 23.80%1.3124
Discount for Lack o f Marketability
Whether called illiquidity, nonmarketability or any other term that means being difficult to sell, an asset or business that is difficult to sell may require a substantial discount to attract buyers. Elliott (1993) illustrated a discount for lack of marketability with a listmg of nine independent studies all pertaining to restricted stock (letter stocks) transactions. Elliott reports the results of the SEC Institutional study covering 1966-1969 with an average discount for restricted stocks of 25.8 percent. The SEC study reports average discounts on the purchase of restricted common stocks on various markets. The average discount for shares on the New York Stock Exchange was 20 percent, for the American Stock Exchange 24 percent; and for OTC the discount varied from 27.28 percent to 33.58 percent depending on the qualification of the dealer. A grand mean for the various markets was 26 percent, for the time period January 1, 1966 through June 30, 1969. The weaker the market the larger the discount.
Gehnan (1972) reported the purchase of restricted securities in the 1968-1970 time period for four large closed-end investment companies. The purchases were made either directly from the company or in some cases from selling stockholders. The 89 public companies involved both over-the- counter and listed companies. The average and median discounts for the 89 stock purchases was 33 percent.
Trout (1977) reported 60 purchases during 1968-1972 by six mutual funds that purchased restricted securities. Using regression analysis with highly significant results, he reported an average discount for the restricted stock purchases of 33.45 percent.
Moroney (1973) claims that “Most Courts Overvalue Closely Held Stocks” and supports this contention with 146 blocks of restricted securities with discounts on purchase as high as 50 to 90 percent on various lots and an average overall of 35.6 percent. These were discounts from quoted market values of the same corporations’ unrestricted stock of the same class, following “a hard-nosed, arm’s length bargain” involving cash purchases. These cash discounts for lack of marketability were compared with court allowed discounts of 10 percent in Bader. 10 percent in Worthem. 12 percent in Central Trust Co. 20 percent in Bartram. and none over 35 percent. Even when the Internal Revenue Service recommends/allows very small discounts, the courts have the record of cash discounts up to 90 percent (Moroney 1973) yet end up finding “fair market value” to be the arithmetic mean of the tax payer s value and the IRS’s value, with a correlation of .9873. (Englebrecht and Davison, 1977 p. 397.) Longenecker (1983, p. 41) reports this as “splitting the difference.” Court actions should be more sensitive to pricing and less sensitive to the amount of taxes recommended by the IRS.
Maher (1976) cited mutual fund purchases of restricted securities in the time period 1969- 1973 and found discounts averaging 35.43 percent. As part of the data used to calculate the average, discounts were as high as 75.66 percent in 1969, 60.53 percent in 1970, 39.64 percent in 1971, 61.31 percent in 1972 and only a single block of restricted securities trading with a discount of 66 percent in 1973. It should be recognized that the economy was in a recession in 1969-1970 and an even deeper recession in the 1973-1974, which may have a bearing on the amount of the discounts and the low number of transactions in 1973. Maher concludes that the marketability discount should average about 35 percent.
144
Silber (1971) reports an average discount of 33.75 percent for a sample of 69 companies, with a high discount of 84 percent for the time period 1981-1988. He found a direct relationship between the amount of the discount and the amount of restricted stock relative to publicly traded stock and an inverse relationship with the credit worthiness of the issuing company. Under the Sec’s Rule 144, holders of restricted stock are required to hold the stock for at least two years.
Standard Research Consultants (1983) reported an average discount of 45 percent for the time period 1978-1982. Willamette Management Associates (unpublished) reports average discounts of 31.2 percent during 1981-1984 These two studies were also reported in Pratt (1996, p 343).
All of the restricted stock reports follow the SEC Rule 144, which requires a holding period of two years. More recently some restricted stock sales “off shore” have been permitted to sell the restricted shares in as little time as two months under the right circumstances.
As compelling as this extensive research appears relative to restricted stock sales, there is not a single report of closely-held firms issuing restricted stock. With restricted stock (letter stock) the probability is very high that the stock will be marketable in a relatively short time period, but closely-held firms, for the most part, have little if any chance for marketability, now or in the future. Considerable variability would be shown by the use of different studies.
Much more relevant for evaluating a discount for lack of marketability is the research done by Willamette Management Associates and the so called Baird studies (Emory 1995) covering the time period 1975 through June 1995 as reported in Pratt( 1996 pp 344-348). Their studies relate the prices of private transactions to the prices of public offerings of the stock of the same companies (Initial Public Offerings-IPO’s). Emory’s work covers the time period from 1980 through June 1995 and reports a median discount from the IPO price of 46 percent for 219 transactions. Willamette Management Associates conducted 12 studies over the period 1975-1992. The discounts from the public offering prices, adjusted for changes in industry stock price indexes, ranged from 39.1 percent to 80.5 percent with a median of 62.11 percent for 879 transactions. Willamette also compared 503 private transaction price-eamings multiples to the public offering multiples, adjusted for changes in industry price-earning multiples, with median discounts ranging from 31.8 percent to 74.4 percent and averaging 51.4 percent. These
are the studies that should be used as benchmarks for discounting lack of marketability. Closely-held businesses do not issue restricted stock but a few could be fortunate enough to go public.
VALUATION AND THE COURTS
Englebrecht and Leeson (1978) provided evidence of the extent of the influence of Bader (1959) and Central Trust (1962) on subsequent cases involving valuation of closely-held firms for gift or estate tax purposes. The evidence is not compelling because of 18 cases identified, only eight provided sufficient data on the factors contained in Bader which were needed. Through regression analysis they showed that the association between court determined value and the value computed using the Bader weighting of earnings, dividend capacity and book value was a very high correlation of .9663, at a high level of significance. The same approach was used for cases following Central Trust and the correlation between court determined value and the value computed using the Central Trust approach was .9668, at a high level of significance. It appears as though Bader and Central Trust have had much influence on subsequent cases of the 44 percent of the cases for which data were available.
The duplicating of methodology approach is in spite of the strong statement against the approach by Revenue Ruling 59-60, which says that such “result cannot be supported by a realistic
The Journal o f Entrepreneurial Finannce 6 ( 1 ) 2001
145
application of the significant facts in the case except by mere chance.” Evidence is available that shows little value is added by including assets and dividends to the approach (LeClair, (1990 p. 39). Longenecker (1983) even cites three court cases to make the point that “it is universally agreed that book value is not a reliable indicator of asset values,” as indicated earlier.
Englebrecht and Davison (1977) reviewed Tax Court valuations of closely-held stock for the time period January 1950 through December 1974. With multiple valuations in some cases, 74 cases contained 106 usable valuations. They selected 85 valuations randomly, and used the other 21 as a holdout sample for later testing to verify the model. The authors used regression analysis to test the relationship between the Tax Court valuation and the arithmetic mean of the values submitted by the IRS and the taxpayer. The correlation coefficient of .9873 shows a strong association between the variables. The correlation coefficient which showed a strong positive relationship between the Tax Court’s value and the arithmetic mean of the IRS and taxpayer values, was found to be highly significant. The authors recognized and reported that 16 of the Tax Court’s values were identical to the IRS value, and 14 of the Tax Court s values were identical to the taxpayer s values. The holdout sample of 21 valuations provided the same strong relationship shown in the regression of the random sample of 85 valuations.
The authors state that it is “possible” that the IRS could set a high value to maximize taxes, with which few would disagree. It is also possible that the taxpayer sets a low value to minimize taxes. Consequently the Tax Court considers these human tendencies by the parties in compromising between the two extreme positions.
Englebrecht and Davison make a pitch for a “Closely held stock valuation” that eliminates “subjectivity by focusing on a reasonably unbiased approach to valuation.” The authors are suggesting “equity and uniformity among taxpayers.”
The authors empirical work provides support for much earlier theories of Hart wig (1955), Bosland (1963) and Huggins (1973), all of which pertain to courts acting as arbitrators or compromisers in finding values which were approximately equal to the mean of the values of the taxpayers and the IRS.
Bromley (1979) challenged the statistical work of Englebrecht and Davison (1977) without changing any of their conclusions pertaining to a compromise position taken by Tax Courts, as found by others previously cited. Englebrecht’s (1979) response provided additional data to support the compromise theses, in addition to citing the work by Johnson, Shapiro and O’Meara (1951) in which they found the criteria employed in the valuation of closely held stocks to be subjective. In an attempt to develop a valuation model their work “disclosed that there is not a stable relationship between earnings and price, between dividends and price, or between book value and price.” The lack of stability for P/E ratios was later confirmed by Bowlin (1961).
WHERE TO FROM HERE?
A desire for direction is suggested in a number of ways over time, none of which have generated activity on the proper level. Bosland (1963) noted “a tendency to compromise defeats justice when it is substituted for a rigorous application of basic valuation principles.” “The Tax Court tends to lend credence to this charge by its vague reporting of valuation decisions and by statements such as the following:” (Englebrecht and Davison (1977).
“We have no deep seated conviction as to what the value of the stock may have been on any of these dates, but a finding of value is necessary and has been made to the best of our ability. It
The Journal o f Entrepreneurial Finannce 6 ( 1 ) 2001
146
would serve no useful purpose and might convince no one if we were to explain in detail just how our conclusions were reached.” (Schwabacher (1946)).
Earlier it was shown that Bader and Central Trust had a significant impact on Tax Court actions following their decisions, which were based on three factors; earnings, dividends and book value. For large publicly traded firms, dividends can have a significant impact on value, but for closely-held businesses, most of which pay no dividends, the issue is clear— no impact. It is more rationalization than fact to throw in, “dividend paying capacity.” The use of book value is put into perspective by Longenecker (1983) by her statement: “it is universally agreed that book value is not a reliable indicator of asset value.” Earnings of a firm are critically important. For courts to give 50 percent weight to factors that have little or no bearing on value is misplaced judgment, to be kind, but for others to follow this guide is unforgivable.
The Tax Courts
It appears that Tax Courts recognize the problem they have with valuations of closely held businesses, but could be too proud to ask for help. The natural and logical assistance would be to have Senior ASA/IBA appraisers, such as Dr. Shannon Pratt and Mr. James Schilt, participate at the request of the Court as “friends of the Court.” If it were known that a select few Senior Appraisers would act as “advisors” in the form of Friends of the Court the IRS would use care in how their “specialists” make valuations, rather than do whatever appears necessary to maximize taxes for a later compromise, as suggested by Englebrecht and Davison, and likewise the taxpayer’s appraisers would make special efforts to place a value other than that needed to minimize taxes. Senior appraisers acting as advisors should permit tax courts to shake off the “splitting the difference” approach that appears to have been well documented.
The Appraiser
The literature contains numerous suggestions by appraisers, such as Pratt, Plutchock, Longenecker and others about what to look for and what adjustments should be made to “normalize” earnings, with very little if any disagreement. The assumption is that there is general agreement on this issue.
There is much written about what to capitalize and discount, with net income, earnings, cash flow, and net free cash flow at the forefront. The capitalization and discount rates can be adjusted to accommodate cash flows and net free cash flows. The literature is replete with support for capitalization of earnings and for the discounting of earnings. Only when dififering assumptions are made, will inconsistencies and high variations in value resuh.
In determining the required rate of return, whether following the “Build up” approach or the CAPM, there appears to be a consensus among practitioners and many academics that long-term Treasury bonds are the best proxy for the “risk-free rate,” while recognizing that theory calls for application of the Treasury bill.
While generous use is made of Ibbotson’s “equity risk premium” data, one small problem continues. As discussed earlier, Pratt, King and others calculate the premium by (Rm-Rf), with Rm = .13 and Rf = .056, ERP = .074. Ibbotson Associates recognize the “Fisher eflt'ect” and calculate the premium as
Er p ^ 1 + ^ - = 1.07008 - 1 = .07008 = 7.008%.\+R f 1.056
The Journal o f Entrepreneurial Finannce 6( 1 ) 2001
147
The difference of 39.2 basis points in a divisor can be significant. Believing that 39.2 basis points is of consequence, it appears appropriate to follow the Ibbotson approach for accuracy if not for consistency.
The discount for lack of marketability is probably the single most important among the discounts that could be taken. The earlier literature related this discount to the many studies pertaining to restricted or letter stocks because of the availability of data. With citation of actual transactions with up to 90 percent discounts, courts have been reluctant to grant nonmarketability discounts amounting to more than a token. For the most part, restricted stocks will be fiilly marketable in two years to two months, but most closely-held stocks will never be marketable. The more appropriate studies pertaining to nonmarketability are those comparing prices for sales of closely held firms a few months before, to the price at the Initial Public Offering (IPO). A few excellent studies have been made in more recent times that are far more appropriate than the use of restricted stock discount findings. Citing the IPO studies appears to be more appropriate, and with proper presentations should be more meaningful to the Courts.
In general the literature is most impressive and beneficial once we get beyond the insistence of a few who are still trying to sell a product that is obsolete and inferior to most other products. A narrowing of the focus and care in application should bring the inconsistencies and variations down to a manageable level.
The Journal o f Entrepreneurial Finannce 6( 1 ) 2001
148
The Journal o f Entrepreneurial Finannce 6( 1 ) 2001
References
Appeals and Review Memorandum Number 34 (ARM 34), C. B. 2,31 (1920),
Bader, v United States (1959). 59-1 USTC, 172 F. Supp. 833 (DC, 111). (March 26).
Bartram V Graham 157 F. Supp. Conn. 757 (1957).
Beaver, W., and Manegold, J. (1975). “The Association Between Market Determined Measures ofSystematic Risk: Some Further Evidence.” Journal of Financial and Quantitative Analysis (June), pp. 231-284.
Beaver, W., Kettler, R and Scholes, M. (1970). “The Association Between Market Determined and Accounting Determined Risk Measures.” The Accounting Review (October), pp. 654-682.
Block, S. B. (1985). “Buy-Sell Agreements for Privately Held Corporations.” Journal of Accountancv. 160, pp. 110-124.
Boatsman, J. R. and Baskin, E. F. (1981). “Asset Valuation With Incomplete Markets.” The Accounting Review. Vol. LVI, No. 1 (January), pp. 38-53.
Bonbright, J. C. (1937). The Valuation of Propertv. (McGraw-Hill), pp. 1058-1060.
Bosland, C. C. (1963a). “Tax Valuation by Compromise,” Tax Law Review. Vol. 19, pp. 77. (1963b) Estate Tax Valuation in Sale or Merger of Small Firms (New York: Boardman Publishing Corp.)
Bowlin, O. D. (1961). “The Price-Eamings Ratio: A Whimsical Variable.” The Commercial and Financial Chronicle. (September 7).
Brigham, E. F. & Gapenski, L. C. (1996). Intermediate Financial Management. 5^ ed. pp. 173-202 and page 6. The Dryden Press, Holt, Rinehart and Winston.
Central Trust Co. of Cincinnati, Ohio v United States, (1962). 305 F.2d 393, (July 18).
Craig, T. and Hoerr, T. (1993). “Recasting Income Statements in Valuation of Closely Held Businesses.” Business Valuation Review (September) pp. 134-146.
Crandall, A. (1985). “A Practical Approach to Valuing a Closely-Held Business.” The Practical Accountant. Vol. 18, No. 3 (March, pp. 79-90.
De Thomas, A. (1985). “Valuing the Ownership Interest in the Privately-Held Small Firm.” American Journal of Small Business. Vol. IX, No 3 (Winter), pp. 50-59.
Dewing, A. S. (1953), The Financial Policy of Corporations. 5^ Edition (New York: The Ronald Press) p. 287.
Dukes, W. P., Bowlin, O. D. and Ma, K. C. (1996), “Valuation of Closely-Held Firms: A Survey.” Journal of Business Finance and Accounting. 23(3), (April).
149
Eber, V (1984). “The Valuation of Closely-Held Corporations.” Journal of Accountancy (June), pp. 103- 118.
Elliott, C. L. (1993), “Valuation Issues Pertinent to Estate Tax and Estate Planning Valuations”, a paper presented to the Houston Bar Association Probate, Trust and Estate Section, (February 22).
Ellsworth, R. K. (1994). “Valuing a Closely-Held Business: Choosing the Right Approach.” Thg Taxation of Estates and Trusts. (Summer) pp. 23-29.
Emory, J. D. (1995). “The Value of Marketability as Illustrated In Initial Public Offerings of Common Stock: January 1994 through June 1995.” Business Valuation Review (December) pp. 155-160.
Englebrecht, T. D. and Davison, D. L. (1977). “A Statistical Look at Tax Court Compromise In Estate and Gift Tax Valuation of Closely-Held Stock.” Taxes - The Tax Magazine (June) pp. 395-400.
Englebrecht, T.D. and Leeson, C. H. (1978). “Valuation of Closely Held Stock.” The Tax Executive (October), pp. 57-64.
Estate of Charles H. M. Atkins, 10 T C. M., 997 (1951).
Estate of Victor R Clarke, 35 T C. M., 1482 (1976).
Estate of Huntsman V Connor, 66 T. C. 861 (1976).
Fijer, D. (1995). Deposition regarding Case No. 94-547,081. In the 99^^ District Court of Lubbock County, Texas.
Fisher, I. (1906). “The Theory of Interest.” Reprints of Economic Classics, quoted in N. L. Jacob and R. R.
Pettit (1988), Investments. 2* * ed (Irwin), p. 307.
Fishman, J. E., Pratt, S. R, GrifFits, J. C., and Wilson, D. K. (1995). Guide to Business Valuation. 5^ ed. (Practitioners Publishing Company).
Galveston. Harrisburg, and San Antonio Railway vs Texas (210 US 217; 52 LEd 1031); 28SCt,638,p. 639.
Gelman, M. (1972). “An Economist-Financial Analyst’s Approach to Valuing Stock of a Closely-Held Company.” Journal of Taxation. (June), pp. 353-354.
Gilbert, G. A., (1990) “Discount Rates and Capitalization Rates - Where Are We?” Business Valuation Review (December) pp. 108-113.
Gonedes, W. (1973). “Evidence on The Information Contents of Accounting Numbers: Accounting Based and Market Based Estimates of Systematic Risk.” Journal of Financial and Ouantitative Analysis (June), pp. 407-443.
Gordon, M. (1962). The Investment Financing and Valuation of the Corporation. (Richard D. Irwin), pp. 43-54.
Gordon, M. and Shapiro, E. (1959). “Capital Equipment Analysis: The Required Rate of Profit.” Printed in
The Journal o f Entrepreneurial Finannce 6 ( 1 ) 2001
150
The Management of Corporate Capital, edited by Ezra Soloman, Graduate School of Business, University of Chicago, (The Free Press of Glenroei pp. 141-149.
Graham, B., Dodd, D. L. and Cottle, S. (1962) Security Analysis 4^ Edition (McGraw-Hill) pp. 526-538.
Harper, C. P. and Rose, L. E. (1993). “Accuracy of Appraisers and Appraised Methods of Closely Held Companies.” Enterpreneurship Theory and Practice.” (Spring) pp 21-33.
Harrington, D. (1987). Modem Portfolio Theory. The Capital Asset Pricing Model and Arbitrage Pricing
Theory: A User’s Guide. 2^^ ed. (Prentice-Hall, Inc.), pp. 149-165.
Harrison, Florence M. 17 TC.M. 776 (1958).
Hartwig, J. D. (1955). “Valuation Problems Before the Internal Revenue Service and Tax Court,” New York
University 13^ Annual Institute on Federal Taxation, pp. 1143-1159.
Hayes, C. and Finely, L (1989). ‘Valuation of the Closely-Held Business.” The National Public Accountant (March), pp. 30-33, 38.
Hickman, K. and Petry G. H. (1990). “A Comparison of Stock Price Predictions Using Court Accepted Formulas, Dividend Discount, and P/E Models.” Financial Management (Summer) pp. 76-87.
Hicks, V United States, 486 F 2^^ 325 (10^^ Cir. 1973), Cer denied, 416 U.S. 938 (1974).
Hitchner, J.R. (1992). “Valuation of a Closely Held Business,” The Tax Advisor 23(7) (July) pp 471-479.
Howard, J. (1982). “What’s It Worth To You?”, Inc, (July), pp. 75-80.
Hubbard, C. M. and Waldron, D. (1988). “The Valuation of a Closely-Held Firm: Diiference in Expert Opinion.” The Journal of Forensic Economics (December).
Huggins, K. M. (1973). “The Valuation of Closely-Held Corporations for Estate and Gift Tax Purposes.” (Unpublished dissertation of Texas Tech University), P. 128.
Ibbotson, R. G., & Associates. (1996). Stocks. Bonds. Bills and Inflation. Updated in SBBI 1996 Yearbook.
IRS Valuation Guide. (1994). Commerce Clearing House, Inc. P. 7-14.
Internal Revenue Service. (1993). Revenue ruling 93-12. In “Internal Revenue Service section 2512:Valuation of Gifts.” Department of Treasury Internal Revenue Service. 1999-1, Cumulative Bulletin, p. 202.
King, A.V (1994). “Valuing The Closely-Held Corporation: The Validity and Performance of Established Valuation Procedures.” Accounting Horizons 4(3) pp. 31-42.
Kissin, W. and Zulli, R. (1988). “Valuation of a Closely-Held Business.” Journal of Accountancv (June), pp. 38-44.
LeClair, M. S. (1990). “Valuing The Closely-Held Corporation: The Validity and Performance of
The Journal o f Entrepreneurial Finannce 6 ( 1 ) 2001
151
Established Valuation Procedures.” Accounting Horizons 4(3) pp. 31-42.
Lederlich, L. and Siegel, J. G. (1990) “What’s a Business Worth? Valuation Methods for Accountants. Thg National Public Accountant pp. 18-22.
Keown, A.J., Scott, D.F., Martin, J.D., and Petty, J.W (1996). Basic Financial ManagemgJll, Seventh Edition, (Prentice-Hall) p. 900.
Kirwin, L. (1991). Letter to the Editor, Business Valuation Review (March).
Kurzman, S.A. (1988). “How to Value a Closely-Held Business.” The Practical Accountanl(May), pp. 64-
74.
Lerch, M.A. (1988). “Determining Securities Values Using Regression Techniques: Price/Book/and Price/Revenue Indicators.” Business Valuation Review, (March), pp 4-9.
Leung, T.S.T (1986). “Myths About Capitalization Rate and Risk Premium.” Business Valuation Review, (September), pp 122-134.
Longenecker, R. R. (1983), “A Practical Guide to Valuation of Closely Held Stock,” Trust & Estates, (January) pp 32-46.
Maher, J. M. (1977). Application of Key Man Discount in The Valuation of Closely Held Businesses.” Taxes-The Tax Magazine (June), pp. 377-380.
Maher, J. M. (1976). “Discounts for Lack of Marketability for Closely-Held Business Interest.” Taxes, (September), pp. 562-571.
Mastracchio, N. J. and Lippitt, T. W. (1996). “A Comparison of the Earnings Capitalization and The Excess Earnings Models In The Valuation of Closely-Held Businesses.” Journal of Small Business Management (January), pp. 1-12.
Martinez-Cuevas, R. (1995). The Size Discount for Smaller Companies and the Consistency of Valuation Resuhs with Different Methodologies.” Business Valuation Review (March), pp 16-21.
McCarthy, G. and Healy, R. (1971). Valuing a Company: Practices and Procedures (John Wiley and Sons), pp. 83-99 and 338-340.
McMuIlin, S. G. (1986). “Discount Rate Selection.” Business Valuation News (September), pp. 16-22.
Melcher A. G. (1994). “A Comparison of Build-Up Capitalization and Discount Rate Development Procedures.” Business Valuation Review (December, pp. 168-173.
Merrill Lynch Business Advisory Services. (1993). Mergerstat Review 1993 (pp. 90, 99). Schaumburg, IL:
Miles, R. C. (1993). “Six Axioms of Business Valuation.” Business Valuation Review (March), pp. 25-31.
Miles, R.C. (1992). “Price/Eamings Ratios and Company Size Data for Small Businesses.” Business Valuation Review (September), pp 135-139.
The Journal o f Entrepreneurial Finannce 6 (1) 2001
152
Mercer, Z. C. (1989). “The Adjusted Capital Asset Pricing Model for Developing Capitalization Rates: An Extension of Previous ‘Build-up’ Methodologies Based Upon the Capital Asset Pricing Model,” Business Valuation Review. Vol. 8 No. 4 (December), pp. 147-156.
Moroney, R. E. (1977). “Why 25% Discount for Nonmarketability in One Valuation, 100% in Another?” Taxesj h e Tax Magazine (May), pp. 316-320.
The Journal o f Entrepreneurial Finannce 6 ( 1 ) 2001
Miles, R. C. (1982). Basic Business Appraising. (John Wiley & Sons).
Moroney, R, E. (1973). “Most Courts Overvalue Closely-Held Stocks.” Taxes-The Tax Magazine (March). Reprinted in The Texas CPA, pp. 16-28.
Moroney, R. E. (1973). “Most Courts Overvalue Closely-Held Stocks.” Taxes- The Tax Magazine. (March), pp. 144-154.
Ohlson, J.(1995). “Earnings, Book Values, and Dividends in Security Valuation.” Contemporarv Accounting Research. Vol. 11, No. 2 (Spring), pp. 661-687.
Peters, J.O. (1995). “Adjusting Price/Eamings Ratios for Differences in Company Size-An Update.” Business Valuation Review (June) pp. 59-60.
Peters, J. (1989). “The Effect of Ownership and Total Market Value on Acquisition-Based Price/Eamings Ratios.” Business Valuation Review. Vol. 8, No. 4 (December), pp. 169-171.
Peterson, R.L. (1989). “A Guide to Valuing The Closely Held Business.” The Practical Accountant. (April) pp. 35-50.
Pittock, W. E and Stryker, C.H. (1983). “Revenue Ruling 77-287 Revisited,” Standard Research Consultants Ouarterlv Reports. Vol. 10 No.l (Spring), pp. 1-3.
Plutchock, J. (1985). “Valuation: IRS-Stvle.” Financial Planning (February), pp.199-201.
Pratt, S. P., Reilly, R. F. and Schweiks, R. P. (1996). Valuing a Business. Third Edition, Richard D. Irwin.
Pratt, S. (1993). Valuing Small Business and Professional Practices (2”^ ed). Homewood, IL: Business One Irwin.
Pratt, S. (1986). Valuing Small Business and Professional Practices (p. 186). Homewood, IL: Business One, Irwin.
Pratt, S. (1986), Valuing Small Business and Professional Practices (Dow Jones-Irwin), pp. 121-142.
Revenue Ruling 59-60, quoted as Appendix B in Pratt and as Appendix D in McCarthy, pp. 657-662.Revenue Ruling 77-287 Revisited, SRC Ouarterlv Reports. (Spring, 1983), pp. 1-3.
Revenue Ruling 68-609, quoted as Exhibit 15-1 in Pratt (1993), p. 213.
Riordan, A. L. (1992). “The Ibbotson Sinquefield Numbers: Some Thoughts on Applications.” Business Valuation Review (June), pp. 63-67.
153
Schilt, J. (1982). “Selection of Capitalization Rates for Valuing a Closely-Held Business.” Business Valuation News. Vol. 1, No 2 (June), pp. 2-4.
Schilt, J. (1984). “Challenging Standard Business Appraisal Methods,” Business Valuation News (December).
Schwabacher, J. H. (1946). CCH Dec. 15, 479(M), 5TCM 971.
Sears, R. S. and Trennepohl, G.L. (1993). Investment Management. (The Dryden Press).
Sherman, W. R. (1994). “Valuation of Closely Held Businesses: Two Techniques.” The Ohio CPA Journal, (June), pp. 37-45.
Silber, W. L. (1991). “Discounts on Restricted Stock: The Impact of Illiquidity on Stock Price.” Financial Analysts Journal. (July-Aug.) pp. 60-64.
Sliwoski, L. (1992). “Capitalization Rates Discount Rates, and P/E Ratios: One more time.” Business Valuation Review. (September), pp. 122-134.
Solk, G., & Grant, R. (1987). “Valuation Techniques for the Closely-Held Enterprise.” Commercial Law Journal. 92, pp. 254-274.
Tallichet V Commissioner, 33 T. C. M. 1133 (1974).
Taub, M. J. (1993). “Rules of Thumb: Some Positive Observations.” Business Valuation Review (March), pp. 12-19.
Tibergien, M.C. (1987). “Valuation of the Closely Held Businesses: Perspective for the Planner.” Journal of Institute of Certified Financial Planners. (Fall) pp. 157-168.
Trout, R. R. (1977). “Estimation of the Discount Associated with the Transfer of Restricted Securities.” Taxes. (June), pp. 381-385.
Van Home, J.C. (1994). Financial Market Rates & Flows. Fourth Edition (Prentice Hall) pp. 72-80.
Van Home, J. C. (1974). Fundamentals of Financial Management. 3^^ Edition, (Prentice Hall) pp. 88.
Waldron, D. and Hubbard, C. M. (1991). “Valuation Methods and Estimates in Relationship to Investing Versus Consulting.” Entrepreneaurship Theorv and Practice. (Fall), pp. 43-52.
Walker, E. W. and Petty, J. W. (1986). Financial Management of the Small Firm. 2* Edition (Prentice- Hall).
Worthem, J. W. Exr. V U. S. 61-1 USTC 12,009 (1961).
The Journal of Entrepreneurial Finannce 6 ( 1 ) 2001
154

Weston, J. R and Brigham, E. F. (1971). Essentials of Managerial Finance. Tenth Edition, (Dryden Press). Pp. 535.
Wright, J. P. (1990), What Is A Business Worth? (E.VS. Publications).
The Journal o f Entrepreneurial Finannce 6( 1 ) 2001
155


![ASA-CICBV Business Valuation Conference Deferred Revenue ... · Power Holdings, Inc] ... party’s stand alone selling price, management’s best estimate of stand along selling price,](https://img.pdfslide.us/doc/110x75/5fb0e86061ef096cc67e2d76/asa-cicbv-business-valuation-conference-deferred-revenue-power-holdings-inc.jpg)