Embed Size (px)
Citation preview

Where are we in the market cycles?16 October 2018
Marine Money |Greek Shipfinance Forum |Athens
Prepared by Angelica Kemene |Head of Market Analysis & Intelligence

Market FundamentalsCycles & Prices & Trends

Ship Earnings in today’s money over three decades
© Optima Shipping Services 2018
0
10000
20000
30000
40000
50000
60000
70000
Jan-90 Jan-95 Jan-00 Jan-05 Jan-10 Jan-15
***Average earnings of bulkers, oil tankers, containers and gas carriers
$’000/Day
$20,320
$27,650
$11,937
The main markets past cycle trough, but
earnings still weak.
Good news on demand side – world industrial
growth peaking; and trade growing fast
Key issues are the development of the world
economic business cycle, China’ s steel,
shipbuilding production, scrapping,
environmental regulations and the dynamics
of releasing the surplus capacity
Not easy to weight up

Sectors: Cycle Position October 2018
% deviation from earnings average 2008-2018
© Optima Shipping Services 2018
Tanker Markets still weak
Bulk carrier & Container rates
improve after the extremely
weak 2016
Source Data: Optima Shipping Services, The Baltic Exchange
-1%
1%
-3%
12%
-106%
-70%
-65%
-37%
35%
-1%
-15%
-1%
-32%
-5%
-38%
-150% -100% -50% 0% 50%
Capesize
Bulker Panamax
Supramax
Handysize
VLCC
Suezmax
Aframax
Clean Products(MR)
Feeder Containership 1700 teu grd
Narrow Beam Containership 4400 teu gls
Intermediate Containership 6800 teu
Neo-Panamax 9000 teu
LNG 145K CBM
LNG 160K CBM
LPG (VLGC)
% change in average earnings from the 2008-2018 average
Bulk carriers much better than 12
months ago, but the Tanker
market deteriorated
The Gas market is well below
trend, however since 2017 rates
are on an upward trend –
positive demand growth through
to 2021

Newbuilding Prices out of the bottom - Bulkers
© Optima Shipping Services 2018
81K DWT Panamax Bulkcarrier NB Prices 61-64K DWT Supramax NB Prices

Newbuilding Prices - Tankers
© Optima Shipping Services 2018
Suezmax Tanker 156-158K DWT Newbuilding Prices Products Tanker 47-51K DWT Newbuilding Prices

Newbuilding Prices - Containers
© Optima Shipping Services 2018
Containers 1700 TEU Newbuilding Prices Containers 8800 TEU Newbuilding Prices

Secondhand Prices: Bulkers
Panamax 76K Bulkcarrier 5 Year Old Secondhand Prices
Handymax 56K 5 Year Old Secondhand Prices
© Optima Shipping Services 2018

Secondhand Prices: Tankers
Suezmax D / H 160K DWT 5 Year Old Secondhand Prices
Products D / H 47K DWT 5 Year Old Secondhand Prices
© Optima Shipping Services 2018
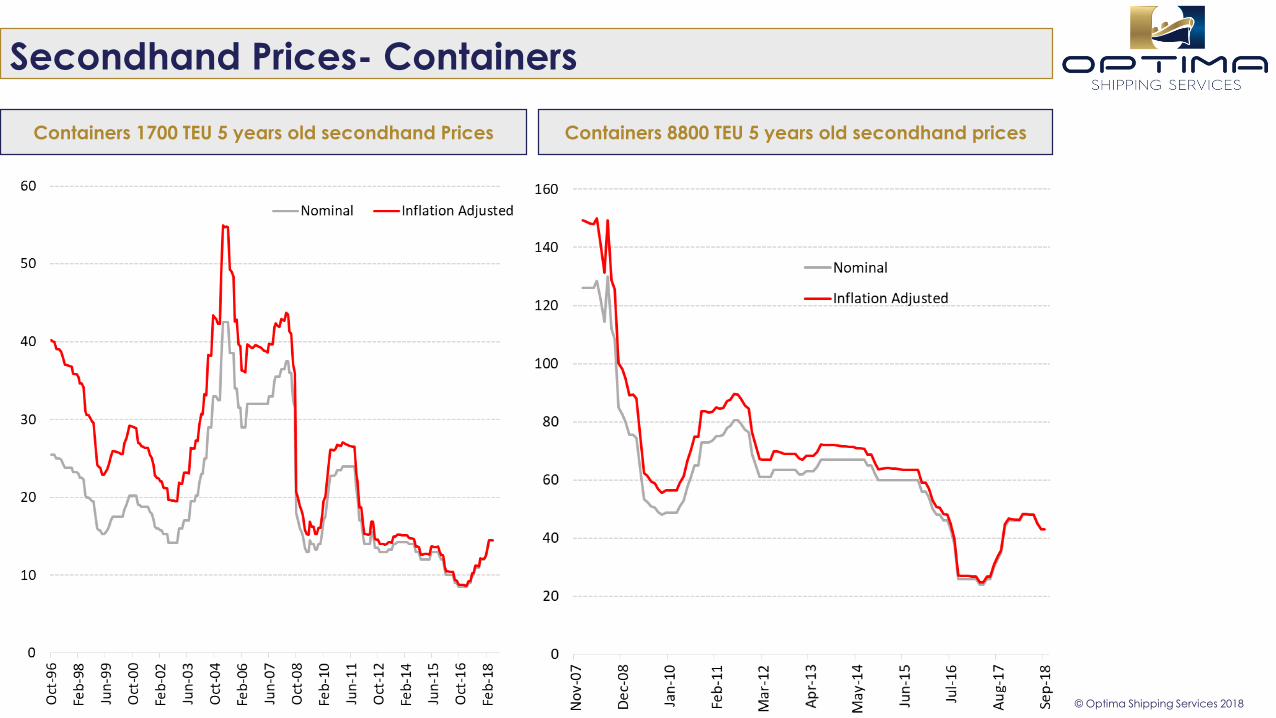
Secondhand Prices- Containers
© Optima Shipping Services 2018
Containers 1700 TEU 5 years old secondhand Prices Containers 8800 TEU 5 years old secondhand prices
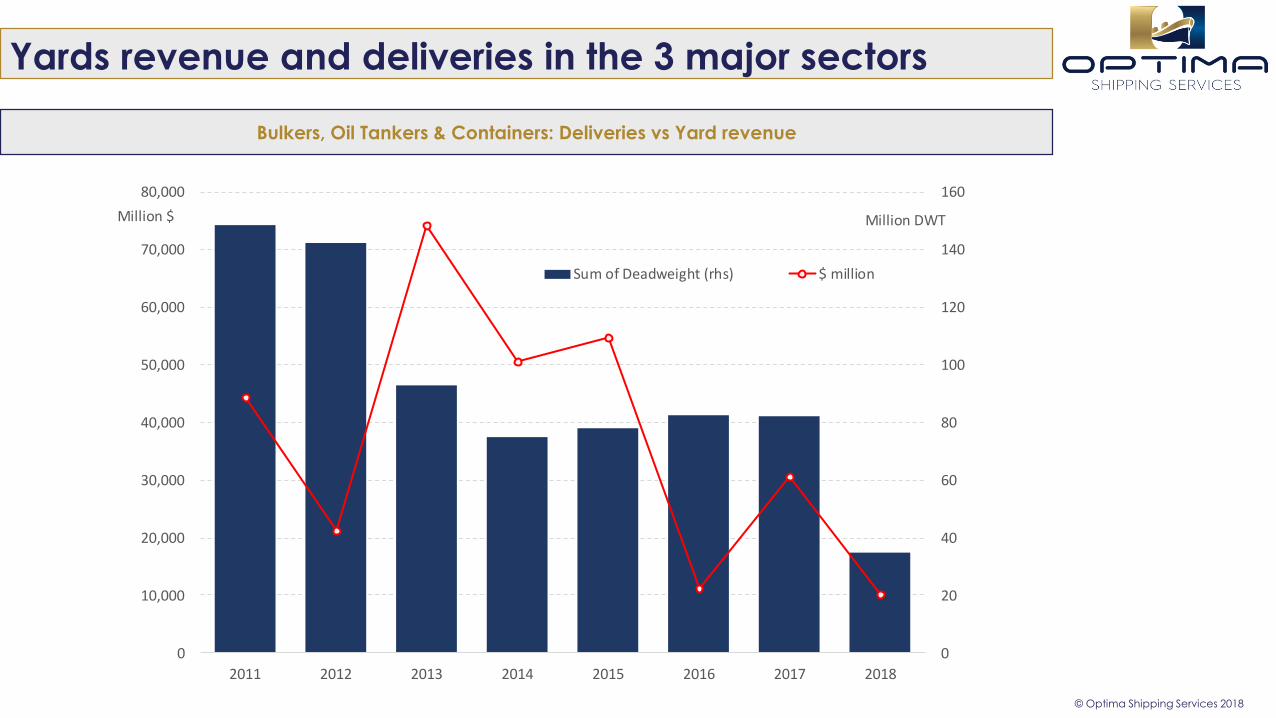
Yards revenue and deliveries in the 3 major sectors
© Optima Shipping Services 2018
Bulkers, Oil Tankers & Containers: Deliveries vs Yard revenue
0
20
40
60
80
100
120
140
160
0
10,000
20,000
30,000
40,000
50,000
60,000
70,000
80,000
2011 2012 2013 2014 2015 2016 2017 2018
Million DWTMillion $
Sum of Deadweight (rhs) $ million

A shift towards Chinese Ship Yards
Major Shipbuilding Countries Current Orderbook %
© Optima Shipping Services 2018
0% 20% 40% 60% 80% 100%
Bulk Carrier
Container
Crude Oil Tanker
Products Tanker
China, People's Republic Of Korea, South Japan Others
For the 3 major sectors there are currently 188active yards – of which 35% is expected todeliver their final order this year, whilst 78% ofthem will deliver their final order until the endof 2019.
In 2007 285 yards received more than 1 order,while in 2017 91 yards received more than 1order – A decrease of 68%.
Inability to secure orders at a profit. Issue: Yard Consolidation China: “Plans on structural reform 2016-2020 in
shipbuilding industry” China’s top 10 state-
owned shipbuilders will be responsible for 70%of the country’s new tonnage by 2020.
Japan follows the trend (capacity cuts &mergers), but S. Korea remains skeptical.
Cost increase: steel prices, labor cost,exchange rates.
The extra cost can be balanced if builderscharge higher.
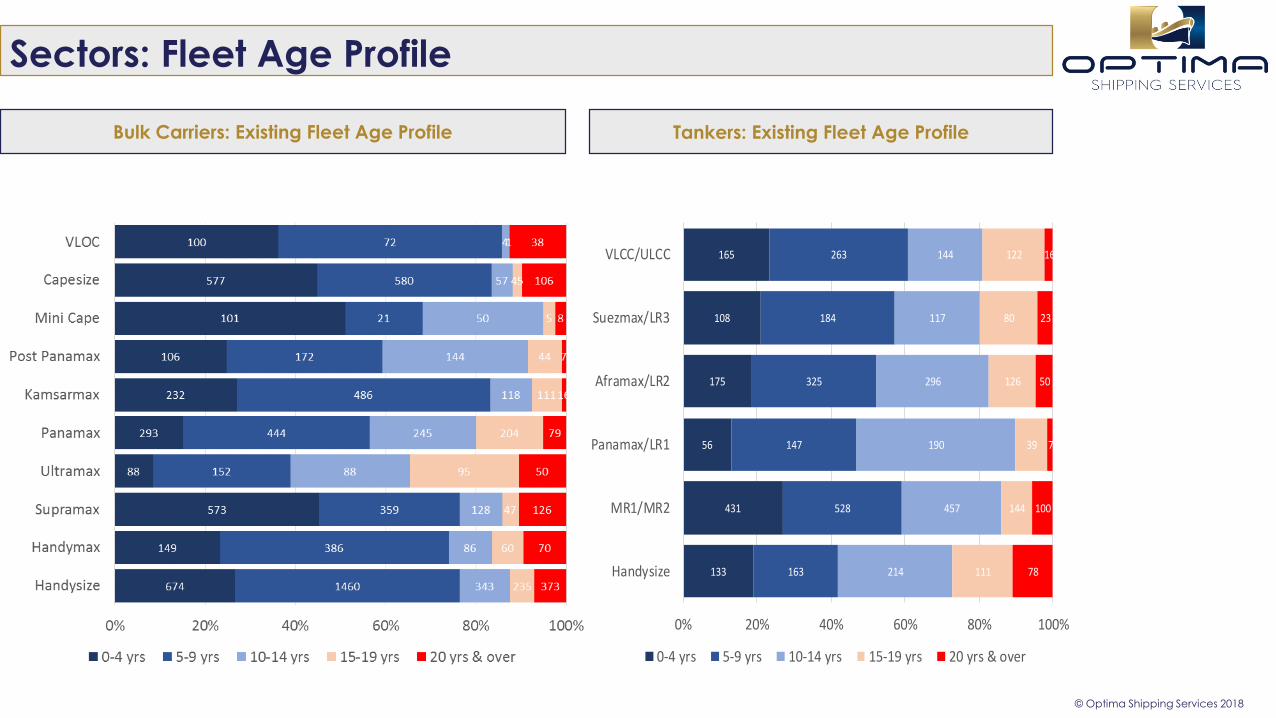
Sectors: Fleet Age Profile
Bulk Carriers: Existing Fleet Age Profile Tankers: Existing Fleet Age Profile
© Optima Shipping Services 2018
133
431
56
175
108
165
163
528
147
325
184
263
214
457
190
296
117
144
111
144
39
126
80
122
78
100
7
50
23
16
0% 20% 40% 60% 80% 100%
Handysize
MR1/MR2
Panamax/LR1
Aframax/LR2
Suezmax/LR3
VLCC/ULCC
0-4 yrs 5-9 yrs 10-14 yrs 15-19 yrs 20 yrs & over
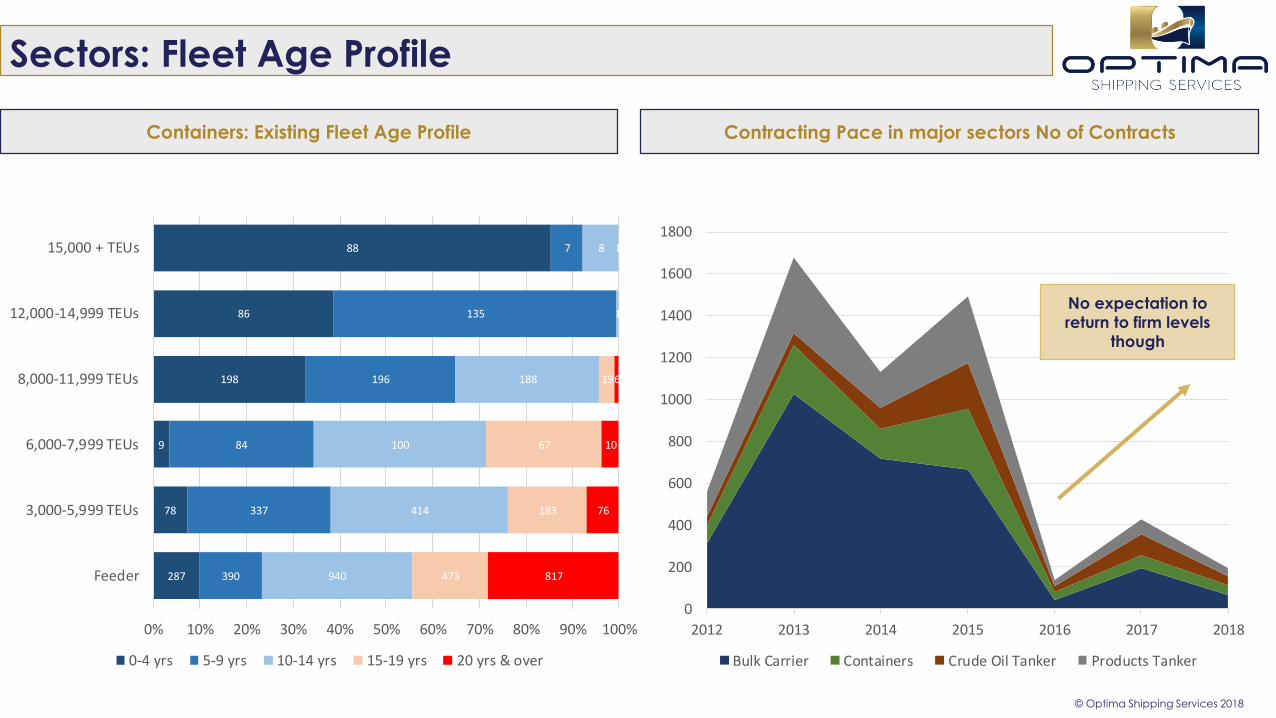
Sectors: Fleet Age Profile
Containers: Existing Fleet Age Profile
© Optima Shipping Services 2018
287
78
9
198
86
88
390
337
84
196
135
7
940
414
100
188
1
8
473
183
67
19
0
0
817
76
10
6
0
0
0% 10% 20% 30% 40% 50% 60% 70% 80% 90% 100%
Feeder
3,000-5,999 TEUs
6,000-7,999 TEUs
8,000-11,999 TEUs
12,000-14,999 TEUs
15,000 + TEUs
0-4 yrs 5-9 yrs 10-14 yrs 15-19 yrs 20 yrs & over
0
200
400
600
800
1000
1200
1400
1600
1800
2012 2013 2014 2015 2016 2017 2018
Bulk Carrier Containers Crude Oil Tanker Products Tanker
Contracting Pace in major sectors No of Contracts
No expectation to
return to firm levels
though

Forward Delivery Schedule No of vessels
© Optima Shipping Services 2018
Bulk Carriers OB:14.5% Capes8.6% Pmax5.5% Supras5.4% Hsize
Oil Tankers OB:15% VLCCs
8.5% Suezmax13.2% Afras
9%Pmax11% LR27% LR1
8% MRs/Handies
Containers OB:20.2% >8K TEU
1.14% 3-7.9K TEU9% Feeders
0
50
100
150
200
250
Cap
esiz
e
Pana
max
BC
Sup
ram
ax
Han
dysi
ze
VLC
C
Suez
max
Afr
amax
Pan
amax
Tan
ker
LR2
LR1
MR
/Han
dy
Post
Pan
amax
Co
ntai
ner
>15,
000
TEU
Neo
Pan
amax
12
-14.
9k T
EU
Neo
Pan
amax
8-1
1.9
TEU
3-7
.9k
TE
U
Feed
er <
3k
TEU
2018 2019 2020 2021 2022
Bulk Carriers Oil Tankers Containers
OrderBook as % of the fleet
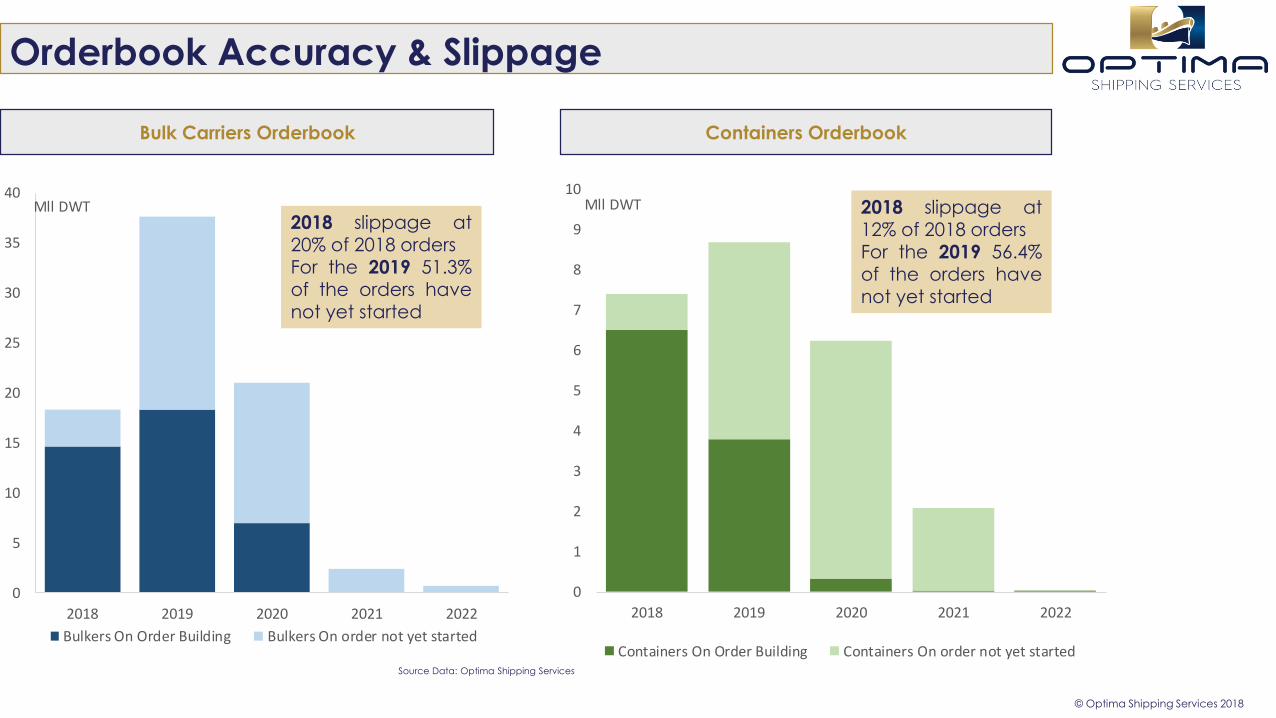
Orderbook Accuracy & Slippage
© Optima Shipping Services 2018
Bulk Carriers Orderbook Containers Orderbook
0
5
10
15
20
25
30
35
40
2018 2019 2020 2021 2022
Mll DWT
Bulkers On Order Building Bulkers On order not yet started
0
1
2
3
4
5
6
7
8
9
10
2018 2019 2020 2021 2022
Mll DWT
Containers On Order Building Containers On order not yet started
2018 slippage at
20% of 2018 ordersFor the 2019 51.3%of the orders havenot yet started
2018 slippage at12% of 2018 ordersFor the 2019 56.4%of the orders havenot yet started
Source Data: Optima Shipping Services

Orderbook Accuracy & Slippage
© Optima Shipping Services 2018
Crude Oil Tankers Orderbook Product Tankers Orderbook
0
5
10
15
20
25
30
2018 2019 2020 2021 2022
Mll DWT
Crude Tankers On order not yetstarted
Crude Tankers On Order Building
0
1
2
3
4
5
6
7
8
9
2018 2019 2020 2021 2022
Mll DWT
Product Tankers On order not yetstarted
Product Tankers On Order Building
2018 slippage at27.3% of 2018 ordersFor the 2019 72.5%of the orders havenot yet started
2018 slippage at 3%of 2018 ordersFor the 2019 51% ofthe orders have notyet started
Source Data: Optima Shipping Services
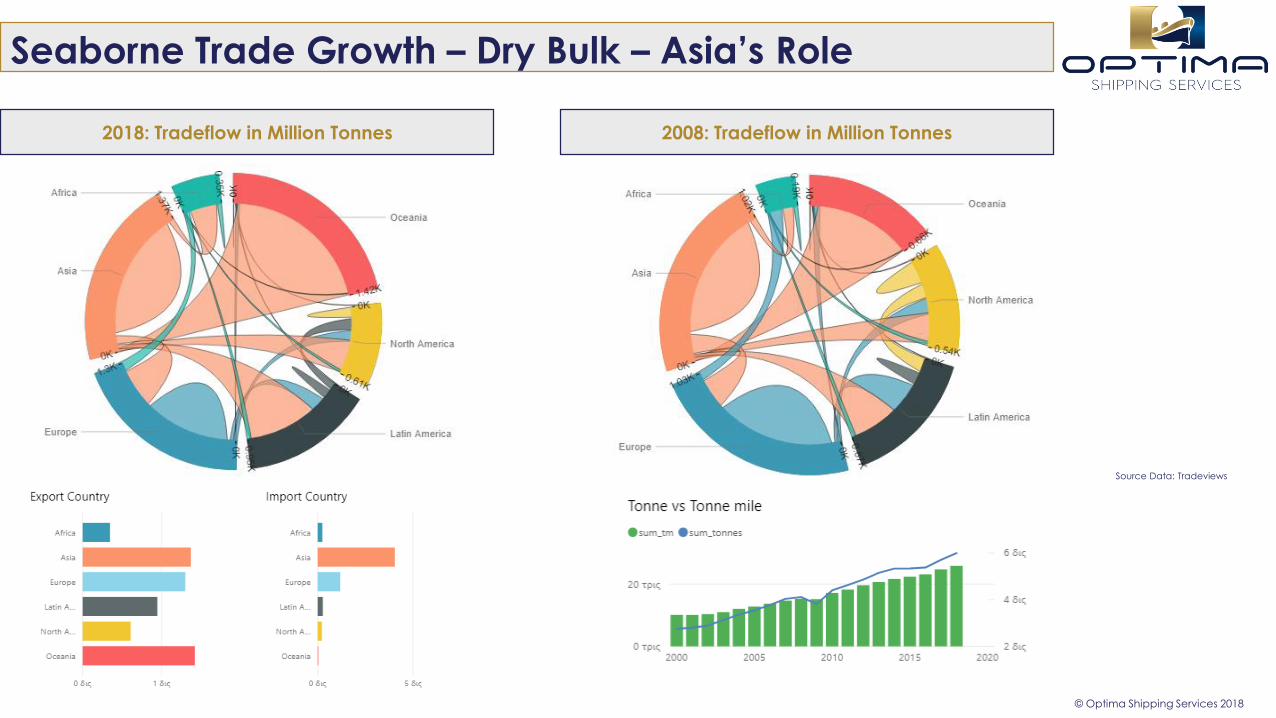
Seaborne Trade Growth – Dry Bulk – Asia’s Role
Source Data: Tradeviews
© Optima Shipping Services 2018
2018: Tradeflow in Million Tonnes 2008: Tradeflow in Million Tonnes

Seaborne Trade Growth – Oil Tankers & Gas – Asia’s Role
Source Data: Tradeviews
© Optima Shipping Services 2018
2018: Tradeflow in Million Tonnes 2008: Tradeflow in Million Tonnes

Seaborne Trade Growth Organization for Economic Cooperation and Development index of industrial production and world indices:
Gross domestic product, merchandise trade and seaborne shipments, 1975–2016(1990 = 100) - UNCTAD
Source Data: Optima Shipping Services
© Optima Shipping Services 2018
The Outlook for the world economy and trade
is expected to improve. Projections for the medium term point to
continued expansion, with volumes growing atan estimated compound annual growth rate of3.2% between 2017-2022.
Volumes are set to expand across allsegments, with containerized trade and majordry bulk commodities trade recording thefastest growth along with LNG.

Investment Opportunities & Risks
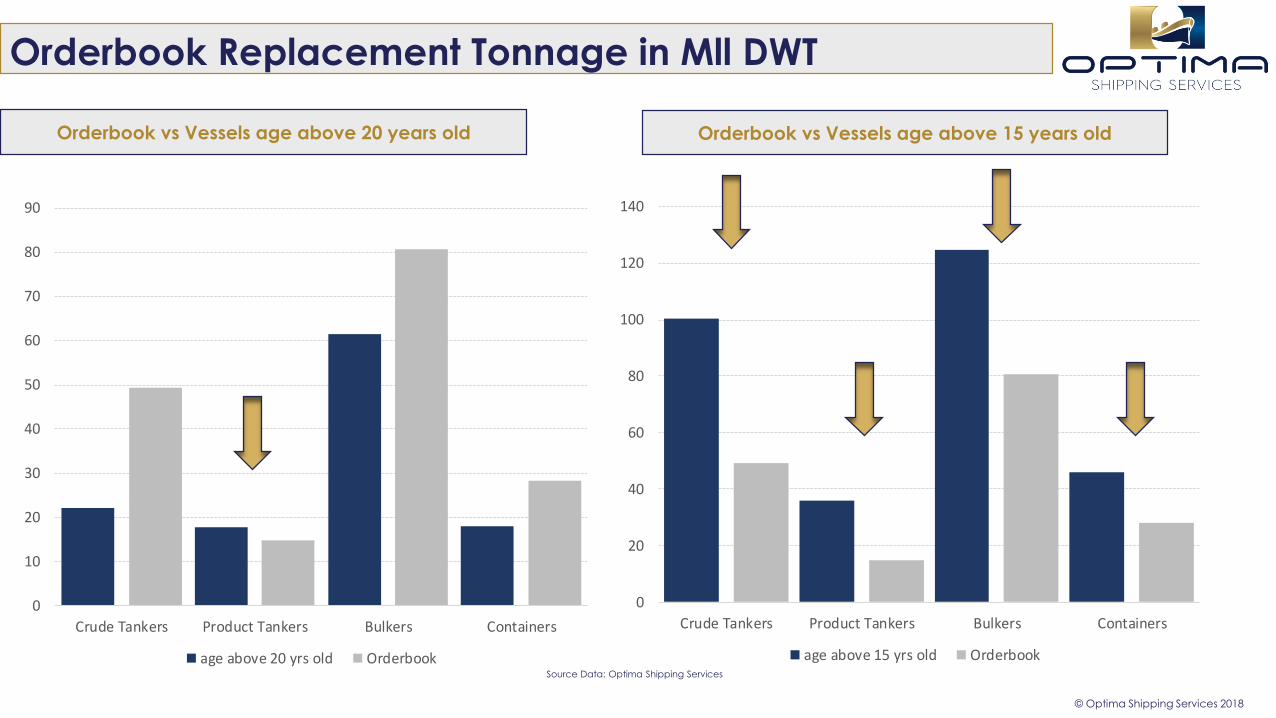
Orderbook Replacement Tonnage in Mll DWT
© Optima Shipping Services 2018
0
10
20
30
40
50
60
70
80
90
Crude Tankers Product Tankers Bulkers Containers
age above 20 yrs old Orderbook
0
20
40
60
80
100
120
140
Crude Tankers Product Tankers Bulkers Containers
age above 15 yrs old Orderbook
Orderbook vs Vessels age above 20 years old Orderbook vs Vessels age above 15 years old
Source Data: Optima Shipping Services
Prospects & Risks
Source Data: Optima Shipping Services
© Optima Shipping Services 2018
Trade still growing: Economic upswing supporting trade in short term and still growth potential in shippingdemand – especially in Asia & developed economies. Trade impacted by Chinese economy and policy(OBOR).
Fleet growth slowing: However, still many ships to hit the water and over 50% bigger, so larger market forservice sector.
Market Cycles: Better looking environment for Bulk Carriers/Containers/ LNG than Oil Tankers. Shipyard Capacity: Shipyard ordering became weak in 2016 and pressured for further consolidation and
capacity reductions. Major change in financial landscape: High interest rates and new entries in shipping investment Environmental regulation change: Regulation accelerating and creating demand for solutions but timing and
technology are pricy. Digitalization, e-commerce and the implementation of the Belt and Road Initiative: The unfolding effects of tech
advances and China’s ambitious reordering of global trade infrastructure will entail important implications forshipping and maritime trade. Potential for a boost in seaborne trade volumes and enhanced efficiency throughdigitalization.
Rising trade barriers: more and more countries adopt protectionist measures and there are many unresolvedmatters regarding several ongoing trade agreements
A trend towards de-globalisation coming out from governments, intensifying protectionist policy approaches. Many factors nowadays have been impacting the shipping industry making it extremely difficult to calculate
risks and plan long term investments. However challenging the markets might be there are still opportunities out there.
THANK YOU !
© Optima Shipping Services 2018
This report has been prepared by Optima Shipbrokers and is addressed to Optima Shipbrokers customers only and is for distribution only under such circumstances as may be permitted by applicable law. This information has no regard to specific investment objectives, financial situation or particular needs of any specific recipient. It is published solely for informational purposes and this information is not, and should not be construed as, an offer or solicitation to sell or buy any product, investment, security or any other financial instrument. Optima Shipbrokers does not make any representation or warranty, express or implied, as to the accuracy, completeness or correctness of the information contained herein, nor is it intended to be a complete statement or summary of the securities, markets or developments referred to in the report. Neither Optima Shipbrokers , nor any of its directors, employees or agents, accepts any liability for any loss or damage, howsoever caused, arising from any reliance on any information or views contained in this report. While this report, and any opinions expressed in it, have been derived from sources believed to be reliable and in good faith they are not to be relied upon as authoritative or taken in substitution for the exercise of your own commercial judgment. Any opinions expressed in this report are subject to change without notice. Optima Shipbrokers is under no obligation to update or keep current the information contained herein. This report may not be reproduced or redistributed, in whole or in part, without the written permission of Optima Shipbrokers accepts no liability whatsoever for the action of third parties in the respect. This information is the intellectual property of Optima Shipbrokers . Optima Shipbrokers logo is the trademark of the company. All rights reserved.
Produced by Optima Shipbrokers Research
10, Ouranou Str166 71Kavouri VouliagmenisGreeceTel: +30 210 8922000
Email: [email protected] www.optimashipbrokers.com


![Kemen gtd v1 [modo de compatibilidad]](https://img.pdfslide.us/doc/110x75/55d56458bb61eb373a8b45a2/kemen-gtd-v1-modo-de-compatibilidad.jpg)