Embed Size (px)
Citation preview
WWW.THEICCT.ORG© INTERNATIONAL COUNCIL ON CLEAN TRANSPORTATION, 2019
When does electrifying shared mobility make economic sense?Authors: Nikita Pavlenko, Peter Slowik, Nic Lutsey
Date: January 2019
Keywords: electric vehicle; ride-hailing; total cost of operation; payback period
IntroductionOver the past several years, the reach and use of shared vehicles has expanded significantly throughout the United States, particularly in large met-ropolitan areas. Examples of shared vehicle fleet applications include taxis, carsharing, and ride-hailing. Use of ride-hailing fleets, often referred to as transportation network companies (TNCs), is especially on the rise. TNC fleets account for a major share of trips in major cities—and this sector is pro-jected to both intensify and expand its geographic scope (Sperling, Brown, & D’Agostino, 2018; Transportation Research Board, 2018).
Largely a separate trend, the deploy-ment of electric vehicles has accel-erated in many of the same urban areas experiencing growth in shared mobility. The increased adoption of electric vehicles results from the con-fluence of local level policies, financial incentives, charging infrastructure, and awareness campaigns (Slowik & Lutsey, 2018). Improvements in battery technology have continued to decrease the price of electric vehicles and increase their driving range. However, electric vehicles remain several thousand dollars more expen-sive than their conventional counter-parts in 2018.
The use of shared and electric vehicles together offers a promising opportu-nity to accelerate the benefits of each. Given the high annual miles traveled of vehicles used in shared fleets, TNC drivers have an opportunity for greater annual fuel savings from hybrid and battery-electric vehicles (BEVs) than private drivers. This, in turn, is likely to mean lower per-mile operating costs, and shorter payback periods, depend-ing on the exact vehicle and energy prices. Although TNC vehicles are con-nected with many broader questions related to congestion and transit use, their electrification offers an oppor-tunity to eliminate TNC vehicles’ local emissions. Excitement about such con-vergence opportunities has led to the policy investigation into the viability of new regulations to increase zero-emission vehicle adoption in fleets (California Air Resources Board, 2018).
This report assesses the timing of cost-effectively electrifying shared mobility fleets in U.S. cities, with a focus on ride-hailing. We develop a total cost of operation (TCO) metric for conven-tional, hybrid, and electric vehicles in eight U.S. cities. We incorporate regional variation in incentives, taxes, and energy costs and apply vehicle technology improvements to assess the changing purchase and operat-ing costs through 2025. Within the
analysis, we also assess the importance of driver access to home charging on electric vehicle operating costs. We track the shift in per-mile operating costs and the associated payback period for BEVs relative to conven-tional and hybrid vehicles under a variety of use cases.
MethodologyThis study develops a TCO approach to evaluate the relative costs of purchas-ing and operating vehicles for TNC, taxi, and carsharing applications. We evaluate costs over a five-year owner-ship period, consistent with typical ownership duration of both Kelley Blue Book and Edmunds TCO assess-ments. The costs incorporated in the TCO analysis include upfront vehicle cost and taxes, discounted annual energy costs (i.e., electricity charging or gasoline fueling), and maintenance costs. We apply a 5% discount rate on future expenses beyond the purchase year. We also incorporate an estima-tion of the opportunity cost of public charging for electric vehicles in ride-hailing operations.
The vehicle types assessed in this study include a reference conventional vehicle, a reference hybrid vehicle, and three reference BEVs (150-mile, 200-mile, and 250-mile electric range),
WORKING PAPER 2019-01
WHEN DOES ELECTRIFYING SHARED MOBILITY MAKE ECONOMIC SENSE?
2 INTERNATIONAL COUNCIL ON CLEAN TRANSPORTATION WORKING PAPER 2019-01
each with separate cost and effi-ciency specifications. We assess the shifting upfront and operating costs of BEVs, relative to conventional and hybrid vehicles, from 2018 to 2025. This allows us to estimate the payback period—the number of years of use required to offset the difference in upfront costs—over time, factoring in regional variation, shifts in energy costs, and technological improvement. Applicable near-term state purchasing incentives are included but generally are phased out around 2019–2021 and are excluded for 2022–2025.
VEHICLE SPECIFICATIONS
Upfront purchase costs are one of the largest factors in the TCO of each vehicle. In 2018, BEV purchase costs are typically a few thousand dollars more than comparable hybrid vehicles, which in turn are typically a few thousand dollars more than compara-ble gasoline models. The largest deter-minant of electric vehicle purchase prices relative to conventional vehicles is the cost of battery packs, which, based on an industry survey, were approximately $205 per kilowatt hour (kWh) in 2017, down from $1,000 in 2010 (UBS, 2017; Chediak, 2018). Our reference vehicle is a car with utility and size specifications that approxi-mately match models like the Nissan Sentra, Toyota Corolla, Chevrolet Cruze, and Toyota Prius. For BEVs, our utility dimensions roughly match the Nissan Leaf and Chevrolet Bolt, but we consider varying electric battery pack size and electric range, as discussed further below. We do not assess plug-in hybrid electric vehicles or fuel-cell electric vehicles here. Compared to BEVs, plug-in hybrids are chal-lenged by relatively high fueling and maintenance costs, and higher upfront costs when battery costs drop in future years, and they often operate similar to non-plug-in hybrid models
in high-annual-mileage fleets. Fuel cell vehicles are in a nascent stage and face greater barriers with model availabil-ity, refueling infrastructure, and higher upfront costs (see, e.g., Isenstadt & Lutsey, 2017). Beyond the informa-tion in this section, we include further details in tables in the appendix.
Battery costs are expected to decrease significantly from 2018 through 2025, largely due to economies of scale from higher-volume battery manufactur-ing. We base our battery cost reduc-tions on the best available bottom-up material and production battery manufacturing studies, vehicle engi-neering teardown analysis, and direct automaker statements about battery costs (Ahmed, Nelson, Susarla, & Dees, 2018; Anderman, 2016; Anderman, 2018; Berckmans et al., 2017; Davies, C., 2017; Lienert & White, 2017; UBS, 2017). Based on this information, we assume per-kilowatt-hour battery pack costs decline at a compounded 5.5% per year from $205 in 2017 to $130 in 2025. Also, based on UBS (2017), we assume non-battery electric vehicle components (e.g., motor, power elec-tronics) will decrease by 21% from 2017 to 2025.
For conventional gasoline vehicles, we assume additional technology costs to comply with efficiency stan-dards. Between 2018 and 2025, the upfront purchase costs of conven-tional gasoline models are assumed to increase by 0.5% per year, meaning the 2018 reference conventional vehicle sees an increase in price from $19,000 to $19,700 due to its additional effi-ciency technology, based on infor-mation from the U.S. Environmental Protection Agency (EPA, 2016) and Lutsey et al. (2017). For hybrid costs, we assume a decrease in costs from $23,000 in 2018 to $22,000 in 2025 or approximately 0.6% per year, based on EPA (2016) and German (2015). Based on the same sources,
our analysis includes eff iciency improvements over time for all vehicle types, including reducing test-cycle and real-world per-mile CO2 and fuel consumption by 3% per year for con-ventional vehicles, and 1% per year for hybrid and electric vehicles, through 2025. Taking into account those annual efficiency improvements, we estimate that the fuel economy of conventional and hybrid vehicles will improve from approximately 30 and 53 miles per gallon in 2018, respec-tively, to approximately 37 and 57 miles per gallon by 2025.
SHARED APPLICATIONS
To assess the use-phase costs incurred by vehicle use, this analysis highlights four different shared applications to assess the relationship between vehicle use, TCO, and payback period. The daily driving distances for ride-hailing drivers are inferred from Uber’s 2015 driver roadmap and an assumption of 20 miles driven per hour of work, split out across full-time drivers (40 hours per week) and part-time drivers (18 hours per week) (Benenson Strategy Group, 2015). Maven Gig drivers log an average of approximately 135 miles per day, with approximately 10% of drivers going beyond the vehicle’s range on a given day. Taxi services, which often operate fleets with drivers sharing multiple vehicles over several daily shifts, fre-quently have even higher daily driving distances (Metro Transportation Denver, 2018; New York City Taxi & Limousine Commission, 2014, 2016). Carsharing fleets tend to be used for short, intra-urban trips; data for this assumption were taken from car2go in five major North American cities (Martin & Shaheen, 2016). We rec-ognize there is broad variation and uncertainty in these applications, and we focus on average applica-tions because we are more interested
WHEN DOES ELECTRIFYING SHARED MOBILITY MAKE ECONOMIC SENSE?
WORKING PAPER 2019-01 INTERNATIONAL COUNCIL ON CLEAN TRANSPORTATION 3
in the broader overall implications than seeking out the implications for early-adopting drivers and fleets with higher annual travel activity.
The four shared applications, along wi th comparab le approx imate numbers for private vehicle owner-ship as a reference, are presented in Table 1. The table shows the annual number of miles traveled for each of the shared applications, along with the assumed days per year that the vehicle is used. The daily miles traveled is an estimate of the average number of miles driven each day that a vehicle is used, which is used below to assess a given shared application’s reliance on fast charging versus overnight home charging. In Table 1, the two shared applications with the highest vehicle use are full-time ride-hailing drivers and taxi services. The annual miles traveled for other applications, such as part-time ride-hailing or carshar-ing, are more similar to private vehicle ownership, although their day-to-day driving patterns may be very different.
The daily miles traveled in each of the fleet use cases assessed here inform our assessment of the relative share of overnight home charging relative to public fast charging. Using a weighted random distribution of miles driven per day over the annual operation for each of the fleet use cases above, we assess the number of days per year that drivers travel beyond the capacity for the vehicle technology in question (i.e., BEV-150, BEV-200, BEV-250) and assume that the remaining daily travel distance is powered via direct current (DC) fast charging. Using the weighted random distribution, we assume on days that drivers with 50 miles of range or fewer remaining on their batteries will opt to recharge that day at a DC fast charging station.
Table 2 shows this study’s esti-mates of overnight home charging
for each vehicle technology across various shared applications. For each BEV technology that we assess, we estimate the share of that vehicle’s electricity charging that is expected to be overnight at home, based on the assumption that drivers will seek out DC fast charging whenever their remaining battery range falls below 50 miles on a given day’s drive. Generally, shared applications with more annual miles traveled, such as full-time ride-hailing and taxi services, have an increased reliance on public DC fast charging, particularly when driving shorter-range BEVs. To evaluate the potential upper bound for BEV costs, we also evaluate the TCO for shared applications where drivers are unable to charge their vehicles over-night regularly and thus use public DC fast charging for 50%–100% of their charging needs.
MAINTENANCE COST
BEVs generally incur lower main-tenance costs than conventional
vehicles, primarily because electric motors have far fewer parts than internal combustion engines, do not require engine fluids, and have less wear and tear on brakes due to regenerative braking. Hybrid-electric vehicles generally incur ongoing main-tenance costs somewhere between conventional vehicles and BEVs. Our maintenance cost assumptions are based on the UBS (2017) electric car teardown analysis. We assume mainte-nance costs of $0.061 per mile, $0.037 per mile, and $0.026 per mile for the conventional vehicle, hybrid vehicle, and BEV, respectively.
REGIONAL VARIATION
To assess the impact of regional varia-tion on the TCO and payback periods for BEVs, we analyze eight U.S. cities to include a wide range of geographic coverage, BEV purchasing incentives, and energy costs in our analysis. These cities are Austin, Chicago, Denver, Los Angeles, New York, Portland, San Francisco, and Seattle.
Table 1. Summary of assumed average driving patterns for selected shared applications.
Private vehicle owner
Ride-hailing driver
(full-time)
Ride-hailing driver
(part-time) Carsharing Taxi driver
Annual driving (miles)
15,000 40,000 18,000 8,000 70,000
Days driving per year 365 280 150 320 280
Daily miles 41 143 120 25 250
Table 2. Percentage of annual miles on original daily charge based on electric vehicle range for each shared application.
Vehicle technology
Private vehicle owner
Ride-hailing driver
(full-time)
Ride-hailing driver
(part-time) Car-sharing Taxi driver
BEV-150 mile 100% 70% 81% 100% 40%
BEV-200 mile 100% 95% 99% 100% 60%
BEV-250 mile 100% 100% 100% 100% 80%
BEV-250 mile (limited overnight charging)
- 0%–50% - - -
WHEN DOES ELECTRIFYING SHARED MOBILITY MAKE ECONOMIC SENSE?
4 INTERNATIONAL COUNCIL ON CLEAN TRANSPORTATION WORKING PAPER 2019-01
Along with covering a range of dif-ferent geographic regions, climates, energy prices, and other factors, these markets are also relatively high electric vehicle uptake markets with a proliferation of shared mobility applications (Slowik & Lutsey, 2018; Shaheen, Martin, Hoffman-Stapleton, & Slowik, 2018).
Regional policy incentives in this analysis include battery electric vehicle rebates such as those available in Denver and California. These rebates amounted to a reduction of the upfront purchase costs by $5,000 in Denver and $2,500 in both of the California cities in this analysis (Colorado Energy Office, n.d.; California Air Resources Board, n.d.). State rebates typically worth $2,000 and $2,500 are also available in New York and Oregon, respectively. The state of Washington has a sales tax exemption for BEVs that applies up to the first $32,000 of vehicle purchase costs (Washington State Department of Licensing, 2018). The clean vehicle rebates are assumed to phase out at various points by 2022, whereas the Washington state tax exemption phases out after 2018. For most of the cities in the analysis, sales taxes ranged from 8% to 10% of vehicle purchase price. In contrast, Oregon’s 0% sales tax reduces the upfront costs for new vehicles by several thousand dollars regardless of vehicle technol-ogy, uniformly reducing the relative TCO compared to other cities across vehicle categories. The $7,500 federal income tax credit is not included here. This tax credit applies uniformly across the cities in our study, and it is set to expire at different times for differ-ent automakers (e.g., perhaps within 2019 for Tesla and General Motors, and later for other automakers depending on when they reach 200,000 electric vehicle sales).
To incorporate regional variation in vehicle fueling costs into the analysis, we use average monthly retail gasoline
prices from the Energy Information Administration (EIA, 2018a), averaged for the last year. We incorporate EIA’s assessment of city-specific gasoline prices where applicable, using EIA’s prices for nearby cities for Austin and Portland, the two cities in our analysis not contained in EIA’s dataset. For the cities assessed here, gasoline can be as much as 20% cheaper (e.g., Austin) or 20% more expensive (e.g., Los Angeles) than the national average. To project the cost of gasoline from 2018 to 2025, we use data from the International Energy Agency’s World Energy Outlook (IEA, 2015), estimat-ing an approximate 4% growth rate that increases the price of gasoline to nearly $3.90 per gallon by 2025.
Regional climate variation also may affect the cost of BEV operation, as electric vehicles can suffer from effi-ciency losses in cold weather. Cold weather operation increases the internal resistance within the battery and lowers its effective capacity; furthermore, cold weather driving also necessitates heating the vehicle interior, requiring additional energy (U.S. Department of Energy [DOE], n.d.a; Union of Concerned Scientists, 2018). Together, these effects can reduce BEV range significantly; recent data suggest that BEV range may decrease by at least 25%, with some studies noting range decreases of around 45% (see, e.g., Salisbury, 2016; DOE, n.d.a; Yuksel & Michalek, 2015).
To assess the impact of climatic varia-tion on BEV TCO, we use an assess-ment from the National Climatic Data Center of the average number of days per year with an average temperature of 45 °F or lower for each of the cities studied. We then revise the charging behavior assumptions in Table 2 to account for the share of annual driving days for each shared application that occur in cold weather, by city. For each cold weather day, we assume that drivers operate their vehicles with a
30% decrease in vehicle range, increas-ing drivers’ use of DC fast charging on those days relative to home over-night charging. To quantify this impact on electricity consumption over the course of a year, we then weight the annual home versus DC fast charging for that vehicle to account for the share of cold weather days for that city.
ELECTRICITY PRICES AND CHARGING COSTS
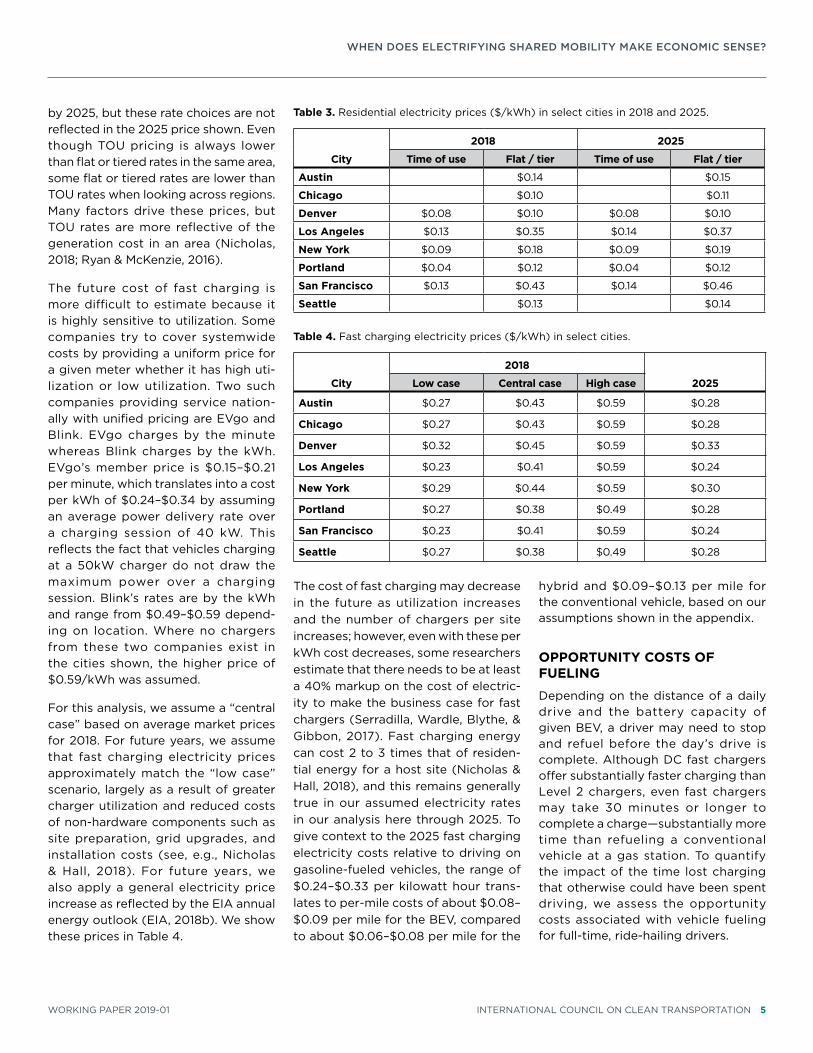
For our analysis of fueling costs for BEVs, we incorporate both regional variation in electricity prices as well as additional costs attributable to fast charging. We show the current prices available to residents in select cities based on the largest utility in the met-ropolitan area in Table 3. Most utili-ties offer either flat rates, for which all electricity is priced the same regard-less of the energy quantity or time of day consumed, or tiered rates, which increase based on the number of kWh used in a month. Tiered rates shown below are from the second-cheapest tier of prices available. In place of either tiered or flat rates, some utilities also offer time-of-use (TOU) rates wherein the lower cost of energy delivery, typi-cally overnight, is reflected in lower rates to consumers. As indicated, the tiered rates in Los Angeles and San Francisco make their electricity prices higher than many of the others, but the TOU rates there are more similar to rates elsewhere. Some utilities require separate meters to access electric vehicle rates, but we ignore those installation costs for this analysis. For areas that offer multiple electricity options, we adopt the lowest available residential charging cost, which is the TOU option when it is available. We apply a uniform increase in electricity price to 2025 for all cities based on the projected increase in electricity prices generally, as modeled by the U.S. Energy Information Administration (2018b). Some of the utilities in the listed regions plan to offer TOU rates
WHEN DOES ELECTRIFYING SHARED MOBILITY MAKE ECONOMIC SENSE?
WORKING PAPER 2019-01 INTERNATIONAL COUNCIL ON CLEAN TRANSPORTATION 5
by 2025, but these rate choices are not reflected in the 2025 price shown. Even though TOU pricing is always lower than flat or tiered rates in the same area, some flat or tiered rates are lower than TOU rates when looking across regions. Many factors drive these prices, but TOU rates are more reflective of the generation cost in an area (Nicholas, 2018; Ryan & McKenzie, 2016).
The future cost of fast charging is more difficult to estimate because it is highly sensitive to utilization. Some companies try to cover systemwide costs by providing a uniform price for a given meter whether it has high uti-lization or low utilization. Two such companies providing service nation-ally with unified pricing are EVgo and Blink. EVgo charges by the minute whereas Blink charges by the kWh. EVgo’s member price is $0.15–$0.21 per minute, which translates into a cost per kWh of $0.24–$0.34 by assuming an average power delivery rate over a charging session of 40 kW. This reflects the fact that vehicles charging at a 50kW charger do not draw the maximum power over a charging session. Blink’s rates are by the kWh and range from $0.49–$0.59 depend-ing on location. Where no chargers from these two companies exist in the cities shown, the higher price of $0.59/kWh was assumed.
For this analysis, we assume a “central case” based on average market prices for 2018. For future years, we assume that fast charging electricity prices approximately match the “low case” scenario, largely as a result of greater charger utilization and reduced costs of non-hardware components such as site preparation, grid upgrades, and installation costs (see, e.g., Nicholas & Hall, 2018). For future years, we also apply a general electricity price increase as reflected by the EIA annual energy outlook (EIA, 2018b). We show these prices in Table 4.
The cost of fast charging may decrease in the future as utilization increases and the number of chargers per site increases; however, even with these per kWh cost decreases, some researchers estimate that there needs to be at least a 40% markup on the cost of electric-ity to make the business case for fast chargers (Serradilla, Wardle, Blythe, & Gibbon, 2017). Fast charging energy can cost 2 to 3 times that of residen-tial energy for a host site (Nicholas & Hall, 2018), and this remains generally true in our assumed electricity rates in our analysis here through 2025. To give context to the 2025 fast charging electricity costs relative to driving on gasoline-fueled vehicles, the range of $0.24–$0.33 per kilowatt hour trans-lates to per-mile costs of about $0.08–$0.09 per mile for the BEV, compared to about $0.06–$0.08 per mile for the
hybrid and $0.09–$0.13 per mile for the conventional vehicle, based on our assumptions shown in the appendix.
OPPORTUNITY COSTS OF FUELING
Depending on the distance of a daily drive and the battery capacity of given BEV, a driver may need to stop and refuel before the day’s drive is complete. Although DC fast chargers offer substantially faster charging than Level 2 chargers, even fast chargers may take 30 minutes or longer to complete a charge—substantially more time than refueling a conventional vehicle at a gas station. To quantify the impact of the time lost charging that otherwise could have been spent driving, we assess the opportunity costs associated with vehicle fueling for full-time, ride-hailing drivers.
Table 3. Residential electricity prices ($/kWh) in select cities in 2018 and 2025.
City
2018 2025
Time of use Flat / tier Time of use Flat / tier
Austin $0.14 $0.15
Chicago $0.10 $0.11
Denver $0.08 $0.10 $0.08 $0.10
Los Angeles $0.13 $0.35 $0.14 $0.37
New York $0.09 $0.18 $0.09 $0.19
Portland $0.04 $0.12 $0.04 $0.12
San Francisco $0.13 $0.43 $0.14 $0.46
Seattle $0.13 $0.14
Table 4. Fast charging electricity prices ($/kWh) in select cities.
City
2018
2025Low case Central case High case
Austin $0.27 $0.43 $0.59 $0.28
Chicago $0.27 $0.43 $0.59 $0.28
Denver $0.32 $0.45 $0.59 $0.33
Los Angeles $0.23 $0.41 $0.59 $0.24
New York $0.29 $0.44 $0.59 $0.30
Portland $0.27 $0.38 $0.49 $0.28
San Francisco $0.23 $0.41 $0.59 $0.24
Seattle $0.27 $0.38 $0.49 $0.28
WHEN DOES ELECTRIFYING SHARED MOBILITY MAKE ECONOMIC SENSE?
6 INTERNATIONAL COUNCIL ON CLEAN TRANSPORTATION WORKING PAPER 2019-01
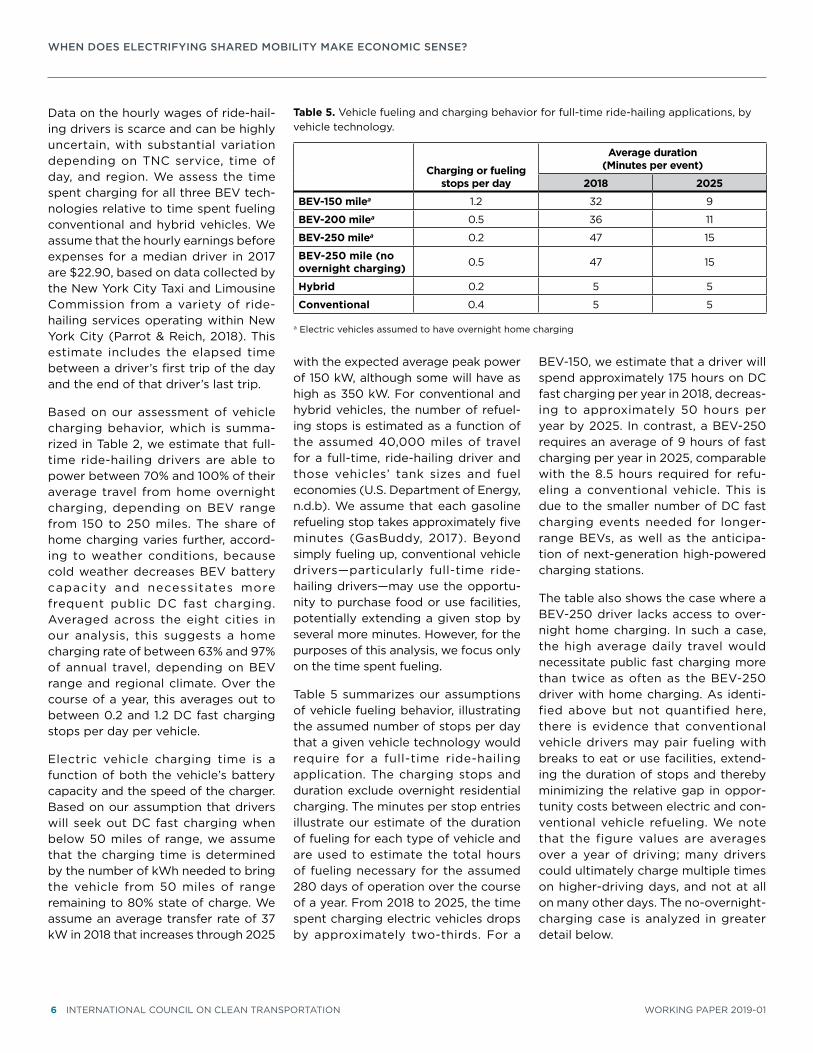
Data on the hourly wages of ride-hail-ing drivers is scarce and can be highly uncertain, with substantial variation depending on TNC service, time of day, and region. We assess the time spent charging for all three BEV tech-nologies relative to time spent fueling conventional and hybrid vehicles. We assume that the hourly earnings before expenses for a median driver in 2017 are $22.90, based on data collected by the New York City Taxi and Limousine Commission from a variety of ride-hailing services operating within New York City (Parrot & Reich, 2018). This estimate includes the elapsed time between a driver’s first trip of the day and the end of that driver’s last trip.
Based on our assessment of vehicle charging behavior, which is summa-rized in Table 2, we estimate that full-time ride-hailing drivers are able to power between 70% and 100% of their average travel from home overnight charging, depending on BEV range from 150 to 250 miles. The share of home charging varies further, accord-ing to weather conditions, because cold weather decreases BEV battery capacity and necessitates more frequent public DC fast charging. Averaged across the eight cities in our analysis, this suggests a home charging rate of between 63% and 97% of annual travel, depending on BEV range and regional climate. Over the course of a year, this averages out to between 0.2 and 1.2 DC fast charging stops per day per vehicle.
Electric vehicle charging time is a function of both the vehicle’s battery capacity and the speed of the charger. Based on our assumption that drivers will seek out DC fast charging when below 50 miles of range, we assume that the charging time is determined by the number of kWh needed to bring the vehicle from 50 miles of range remaining to 80% state of charge. We assume an average transfer rate of 37 kW in 2018 that increases through 2025
with the expected average peak power of 150 kW, although some will have as high as 350 kW. For conventional and hybrid vehicles, the number of refuel-ing stops is estimated as a function of the assumed 40,000 miles of travel for a full-time, ride-hailing driver and those vehicles’ tank sizes and fuel economies (U.S. Department of Energy, n.d.b). We assume that each gasoline refueling stop takes approximately five minutes (GasBuddy, 2017). Beyond simply fueling up, conventional vehicle drivers—particularly full-time ride-hailing drivers—may use the opportu-nity to purchase food or use facilities, potentially extending a given stop by several more minutes. However, for the purposes of this analysis, we focus only on the time spent fueling.
Table 5 summarizes our assumptions of vehicle fueling behavior, illustrating the assumed number of stops per day that a given vehicle technology would require for a full-time ride-hailing application. The charging stops and duration exclude overnight residential charging. The minutes per stop entries illustrate our estimate of the duration of fueling for each type of vehicle and are used to estimate the total hours of fueling necessary for the assumed 280 days of operation over the course of a year. From 2018 to 2025, the time spent charging electric vehicles drops by approximately two-thirds. For a
BEV-150, we estimate that a driver will spend approximately 175 hours on DC fast charging per year in 2018, decreas-ing to approximately 50 hours per year by 2025. In contrast, a BEV-250 requires an average of 9 hours of fast charging per year in 2025, comparable with the 8.5 hours required for refu-eling a conventional vehicle. This is due to the smaller number of DC fast charging events needed for longer-range BEVs, as well as the anticipa-tion of next-generation high-powered charging stations.
The table also shows the case where a BEV-250 driver lacks access to over-night home charging. In such a case, the high average daily travel would necessitate public fast charging more than twice as often as the BEV-250 driver with home charging. As identi-fied above but not quantified here, there is evidence that conventional vehicle drivers may pair fueling with breaks to eat or use facilities, extend-ing the duration of stops and thereby minimizing the relative gap in oppor-tunity costs between electric and con-ventional vehicle refueling. We note that the figure values are averages over a year of driving; many drivers could ultimately charge multiple times on higher-driving days, and not at all on many other days. The no-overnight-charging case is analyzed in greater detail below.
Table 5. Vehicle fueling and charging behavior for full-time ride-hailing applications, by vehicle technology.
Charging or fueling stops per day
Average duration (Minutes per event)
2018 2025
BEV-150 milea 1.2 32 9
BEV-200 milea 0.5 36 11
BEV-250 milea 0.2 47 15
BEV-250 mile (no overnight charging) 0.5 47 15
Hybrid 0.2 5 5
Conventional 0.4 5 5
a Electric vehicles assumed to have overnight home charging
WHEN DOES ELECTRIFYING SHARED MOBILITY MAKE ECONOMIC SENSE?
WORKING PAPER 2019-01 INTERNATIONAL COUNCIL ON CLEAN TRANSPORTATION 7
Results
TOTAL COST OF OPERATION
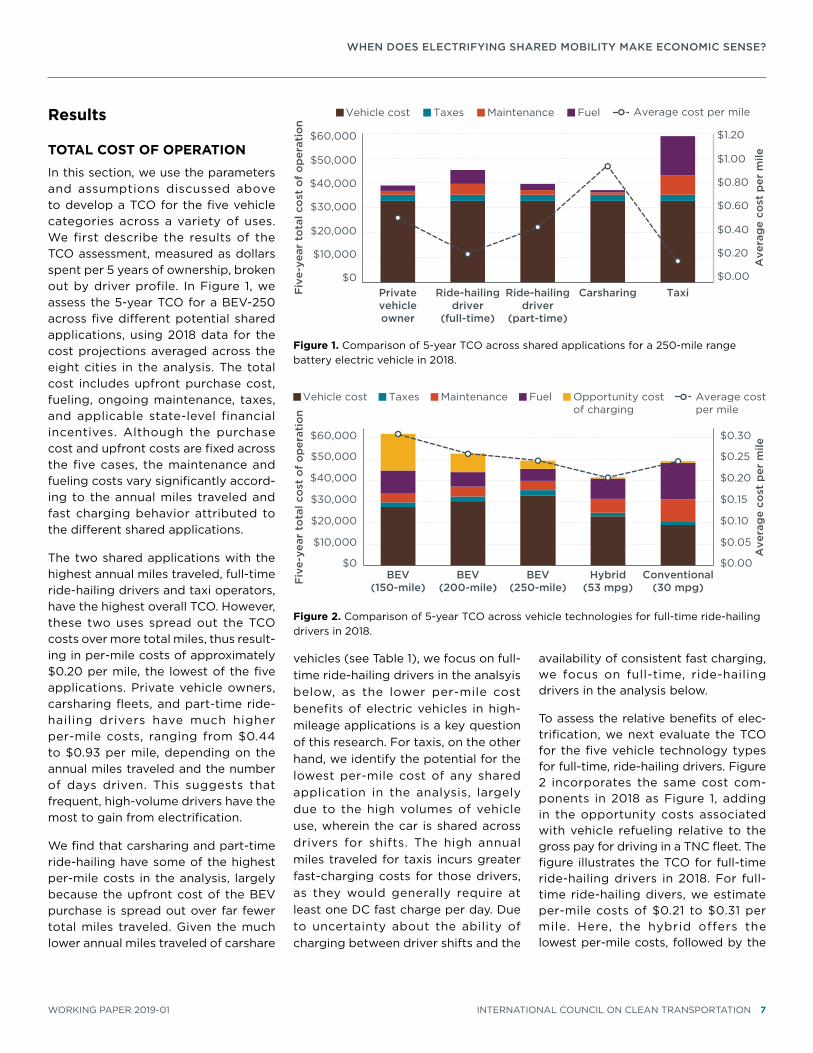
In this section, we use the parameters and assumptions discussed above to develop a TCO for the five vehicle categories across a variety of uses. We first describe the results of the TCO assessment, measured as dollars spent per 5 years of ownership, broken out by driver profile. In Figure 1, we assess the 5-year TCO for a BEV-250 across five different potential shared applications, using 2018 data for the cost projections averaged across the eight cities in the analysis. The total cost includes upfront purchase cost, fueling, ongoing maintenance, taxes, and applicable state-level financial incentives. Although the purchase cost and upfront costs are fixed across the five cases, the maintenance and fueling costs vary significantly accord-ing to the annual miles traveled and fast charging behavior attributed to the different shared applications.
The two shared applications with the highest annual miles traveled, full-time ride-hailing drivers and taxi operators, have the highest overall TCO. However, these two uses spread out the TCO costs over more total miles, thus result-ing in per-mile costs of approximately $0.20 per mile, the lowest of the five applications. Private vehicle owners, carsharing fleets, and part-time ride-hailing drivers have much higher per-mile costs, ranging from $0.44 to $0.93 per mile, depending on the annual miles traveled and the number of days driven. This suggests that frequent, high-volume drivers have the most to gain from electrification.
We find that carsharing and part-time ride-hailing have some of the highest per-mile costs in the analysis, largely because the upfront cost of the BEV purchase is spread out over far fewer total miles traveled. Given the much lower annual miles traveled of carshare
vehicles (see Table 1), we focus on full-time ride-hailing drivers in the analsyis below, as the lower per-mile cost benefits of electric vehicles in high-mileage applications is a key question of this research. For taxis, on the other hand, we identify the potential for the lowest per-mile cost of any shared application in the analysis, largely due to the high volumes of vehicle use, wherein the car is shared across drivers for shifts. The high annual miles traveled for taxis incurs greater fast-charging costs for those drivers, as they would generally require at least one DC fast charge per day. Due to uncertainty about the ability of charging between driver shifts and the
availability of consistent fast charging, we focus on full-time, ride-hailing drivers in the analysis below.
To assess the relative benefits of elec-trification, we next evaluate the TCO for the five vehicle technology types for full-time, ride-hailing drivers. Figure 2 incorporates the same cost com-ponents in 2018 as Figure 1, adding in the opportunity costs associated with vehicle refueling relative to the gross pay for driving in a TNC fleet. The figure illustrates the TCO for full-time ride-hailing drivers in 2018. For full-time ride-hailing divers, we estimate per-mile costs of $0.21 to $0.31 per mile. Here, the hybrid offers the lowest per-mile costs, followed by the
$0.00
$0.20
$0.40
$0.60
$0.80
$1.00
$1.20
$0
$10,000
$20,000
$30,000
$40,000
$50,000
$60,000
Privatevehicleowner
Ride-hailingdriver
(full-time)
Ride-hailingdriver
(part-time)
Carsharing Taxi
Ave
rag
e co
st p
er m
ile
Fiv
e-ye
ar t
ota
l co
st o
f o
per
atio
n
Vehicle cost Taxes Maintenance Fuel Average cost per mile
Figure 1. Comparison of 5-year TCO across shared applications for a 250-mile range battery electric vehicle in 2018.
$0.00
$0.05
$0.10
$0.15
$0.20
$0.25
$0.30
$0
$10,000
$20,000
$30,000
$40,000
$50,000
$60,000
BEV(150-mile)
BEV(200-mile)
BEV(250-mile)
Hybrid(53 mpg)
Conventional(30 mpg)
Ave
rag
e co
st p
er m
ile
Fiv
e-ye
ar t
ota
l co
st o
f o
per
atio
n
Vehicle cost Taxes Maintenance Fuel Opportunity costof charging
Average costper mile
Figure 2. Comparison of 5-year TCO across vehicle technologies for full-time ride-hailing drivers in 2018.
WHEN DOES ELECTRIFYING SHARED MOBILITY MAKE ECONOMIC SENSE?
8 INTERNATIONAL COUNCIL ON CLEAN TRANSPORTATION WORKING PAPER 2019-01
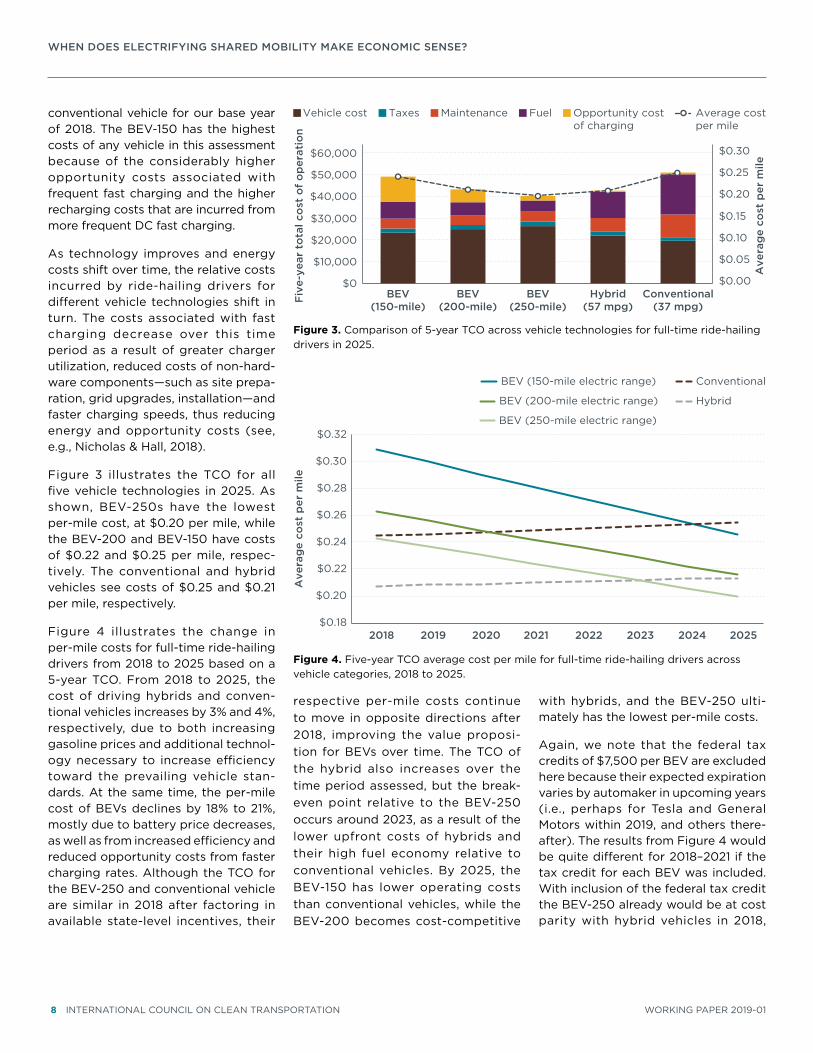
conventional vehicle for our base year of 2018. The BEV-150 has the highest costs of any vehicle in this assessment because of the considerably higher opportunity costs associated with frequent fast charging and the higher recharging costs that are incurred from more frequent DC fast charging.
As technology improves and energy costs shift over time, the relative costs incurred by ride-hailing drivers for different vehicle technologies shift in turn. The costs associated with fast charging decrease over this time period as a result of greater charger utilization, reduced costs of non-hard-ware components—such as site prepa-ration, grid upgrades, installation—and faster charging speeds, thus reducing energy and opportunity costs (see, e.g., Nicholas & Hall, 2018).
Figure 3 illustrates the TCO for all five vehicle technologies in 2025. As shown, BEV-250s have the lowest per-mile cost, at $0.20 per mile, while the BEV-200 and BEV-150 have costs of $0.22 and $0.25 per mile, respec-tively. The conventional and hybrid vehicles see costs of $0.25 and $0.21 per mile, respectively.
Figure 4 illustrates the change in per-mile costs for full-time ride-hailing drivers from 2018 to 2025 based on a 5-year TCO. From 2018 to 2025, the cost of driving hybrids and conven-tional vehicles increases by 3% and 4%, respectively, due to both increasing gasoline prices and additional technol-ogy necessary to increase efficiency toward the prevailing vehicle stan-dards. At the same time, the per-mile cost of BEVs declines by 18% to 21%, mostly due to battery price decreases, as well as from increased efficiency and reduced opportunity costs from faster charging rates. Although the TCO for the BEV-250 and conventional vehicle are similar in 2018 after factoring in available state-level incentives, their
respective per-mile costs continue to move in opposite directions after 2018, improving the value proposi-tion for BEVs over time. The TCO of the hybrid also increases over the time period assessed, but the break-even point relative to the BEV-250 occurs around 2023, as a result of the lower upfront costs of hybrids and their high fuel economy relative to conventional vehicles. By 2025, the BEV-150 has lower operating costs than conventional vehicles, while the BEV-200 becomes cost-competitive
with hybrids, and the BEV-250 ulti-mately has the lowest per-mile costs.
Again, we note that the federal tax credits of $7,500 per BEV are excluded here because their expected expiration varies by automaker in upcoming years (i.e., perhaps for Tesla and General Motors within 2019, and others there-after). The results from Figure 4 would be quite different for 2018–2021 if the tax credit for each BEV was included. With inclusion of the federal tax credit the BEV-250 already would be at cost parity with hybrid vehicles in 2018,
$0.00
$0.05
$0.10
$0.15
$0.20
$0.25
$0.30
$0
$10,000
$20,000
$30,000
$40,000
$50,000
$60,000
BEV(150-mile)
BEV(200-mile)
BEV(250-mile)
Hybrid(57 mpg)
Conventional(37 mpg)
Ave
rag
e co
st p
er m
ile
Fiv
e-ye
ar t
ota
l co
st o
f o
per
atio
n
Vehicle cost Taxes Maintenance Fuel Opportunity costof charging
Average costper mile
Figure 3. Comparison of 5-year TCO across vehicle technologies for full-time ride-hailing drivers in 2025.
$0.18
$0.20
$0.22
$0.24
$0.26
$0.28
$0.30
$0.32
2018 2019 2020 2021 2022 2023 2024 2025
Ave
rag
e co
st p
er m
ile
BEV (150-mile electric range) Conventional
BEV (200-mile electric range) Hybrid
BEV (250-mile electric range)
Figure 4. Five-year TCO average cost per mile for full-time ride-hailing drivers across vehicle categories, 2018 to 2025.
WHEN DOES ELECTRIFYING SHARED MOBILITY MAKE ECONOMIC SENSE?
WORKING PAPER 2019-01 INTERNATIONAL COUNCIL ON CLEAN TRANSPORTATION 9
instead of in 2023 as shown in the figure. With inclusion of the federal tax credit, the BEV-150 would reach cost-per-mile parity with the hybrid by 2020, whereas the figure shows it only reaches cost parity with conventional vehicles in 2024.
Our assessment of the 5-year TCO illustrates that BEVs will become com-petitive with hybrid and conventional vehicles over the next several years. Figure 4 suggests that long-range BEVs already in 2018 are competi-tive with conventional vehicles in full-time ride-hailing applications, under the assumptions outlined above even without the federal tax credit. Mid- and shorter-range BEVs reach cost com-petitiveness with conventional vehicles approximately 2 to 5 years after long-range BEVs. However, these results hold true only in cases where there is access to consistent home charging.
In cases where overnight home charging is unavailable, such as for a driver occupying a multi-family housing unit without a dedicated parking space, the lower electricity costs for home charging would be replaced with higher per-kWh costs for public fast charging. Fast charging can cost from 3 to 9 times as much as overnight home charging, depending on location (see Table 3 and Table 4) in 2018, although we assume that this price differential will decrease over time as the cost of DC fast charging declines, as outlined above.
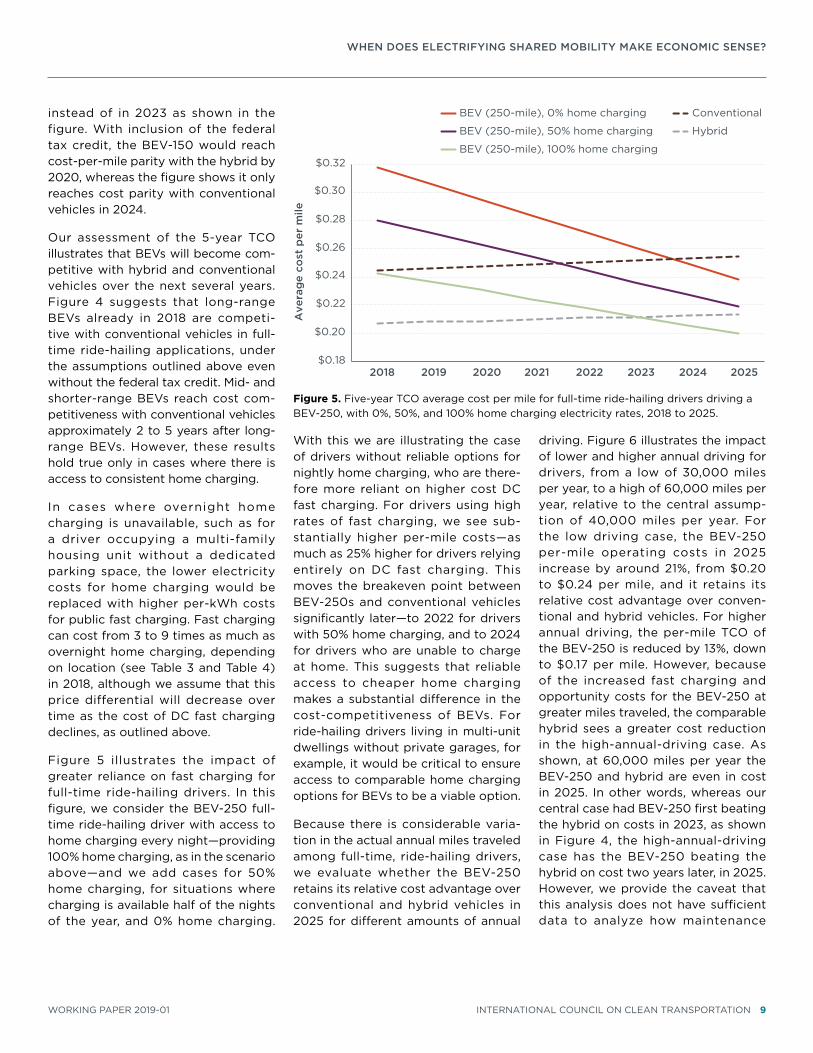
Figure 5 illustrates the impact of greater reliance on fast charging for full-time ride-hailing drivers. In this figure, we consider the BEV-250 full-time ride-hailing driver with access to home charging every night—providing 100% home charging, as in the scenario above—and we add cases for 50% home charging, for situations where charging is available half of the nights of the year, and 0% home charging.
With this we are illustrating the case of drivers without reliable options for nightly home charging, who are there-fore more reliant on higher cost DC fast charging. For drivers using high rates of fast charging, we see sub-stantially higher per-mile costs—as much as 25% higher for drivers relying entirely on DC fast charging. This moves the breakeven point between BEV-250s and conventional vehicles significantly later—to 2022 for drivers with 50% home charging, and to 2024 for drivers who are unable to charge at home. This suggests that reliable access to cheaper home charging makes a substantial difference in the cost-competitiveness of BEVs. For ride-hailing drivers living in multi-unit dwellings without private garages, for example, it would be critical to ensure access to comparable home charging options for BEVs to be a viable option.
Because there is considerable varia-tion in the actual annual miles traveled among full-time, ride-hailing drivers, we evaluate whether the BEV-250 retains its relative cost advantage over conventional and hybrid vehicles in 2025 for different amounts of annual
driving. Figure 6 illustrates the impact of lower and higher annual driving for drivers, from a low of 30,000 miles per year, to a high of 60,000 miles per year, relative to the central assump-tion of 40,000 miles per year. For the low driving case, the BEV-250 per-mile operating costs in 2025 increase by around 21%, from $0.20 to $0.24 per mile, and it retains its relative cost advantage over conven-tional and hybrid vehicles. For higher annual driving, the per-mile TCO of the BEV-250 is reduced by 13%, down to $0.17 per mile. However, because of the increased fast charging and opportunity costs for the BEV-250 at greater miles traveled, the comparable hybrid sees a greater cost reduction in the high-annual-driving case. As shown, at 60,000 miles per year the BEV-250 and hybrid are even in cost in 2025. In other words, whereas our central case had BEV-250 first beating the hybrid on costs in 2023, as shown in Figure 4, the high-annual-driving case has the BEV-250 beating the hybrid on cost two years later, in 2025. However, we provide the caveat that this analysis does not have sufficient data to analyze how maintenance
$0.18
$0.20
$0.22
$0.24
$0.26
$0.28
$0.30
$0.32
2018 2019 2020 2021 2022 2023 2024 2025
Ave
rag
e co
st p
er m
ile
BEV (250-mile), 0% home charging Conventional
BEV (250-mile), 50% home charging Hybrid
BEV (250-mile), 100% home charging
Figure 5. Five-year TCO average cost per mile for full-time ride-hailing drivers driving a BEV-250, with 0%, 50%, and 100% home charging electricity rates, 2018 to 2025.
WHEN DOES ELECTRIFYING SHARED MOBILITY MAKE ECONOMIC SENSE?
10 INTERNATIONAL COUNCIL ON CLEAN TRANSPORTATION WORKING PAPER 2019-01
needs are likely to increase for all the vehicle types over time in such heavy annual driving cases.
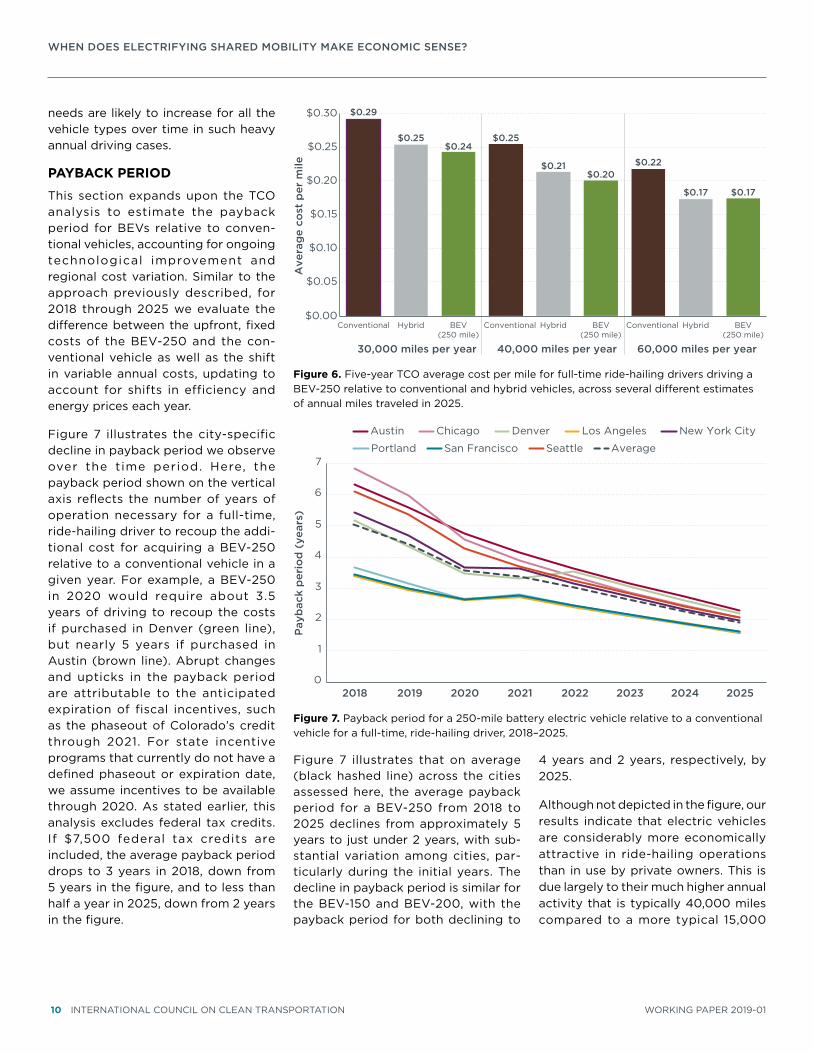
PAYBACK PERIOD
This section expands upon the TCO analysis to estimate the payback period for BEVs relative to conven-tional vehicles, accounting for ongoing technological improvement and regional cost variation. Similar to the approach previously described, for 2018 through 2025 we evaluate the difference between the upfront, fixed costs of the BEV-250 and the con-ventional vehicle as well as the shift in variable annual costs, updating to account for shifts in efficiency and energy prices each year.
Figure 7 illustrates the city-specific decline in payback period we observe over the time period. Here, the payback period shown on the vertical axis reflects the number of years of operation necessary for a full-time, ride-hailing driver to recoup the addi-tional cost for acquiring a BEV-250 relative to a conventional vehicle in a given year. For example, a BEV-250 in 2020 would require about 3.5 years of driving to recoup the costs if purchased in Denver (green line), but nearly 5 years if purchased in Austin (brown line). Abrupt changes and upticks in the payback period are attributable to the anticipated expiration of fiscal incentives, such as the phaseout of Colorado’s credit through 2021. For state incentive programs that currently do not have a defined phaseout or expiration date, we assume incentives to be available through 2020. As stated earlier, this analysis excludes federal tax credits. If $7,500 federal tax credits are included, the average payback period drops to 3 years in 2018, down from 5 years in the figure, and to less than half a year in 2025, down from 2 years in the figure.
Figure 7 illustrates that on average (black hashed line) across the cities assessed here, the average payback period for a BEV-250 from 2018 to 2025 declines from approximately 5 years to just under 2 years, with sub-stantial variation among cities, par-ticularly during the initial years. The decline in payback period is similar for the BEV-150 and BEV-200, with the payback period for both declining to
4 years and 2 years, respectively, by 2025.
Although not depicted in the figure, our results indicate that electric vehicles are considerably more economically attractive in ride-hailing operations than in use by private owners. This is due largely to their much higher annual activity that is typically 40,000 miles compared to a more typical 15,000
0
1
2
3
4
5
6
7
2018 2019 2020 2021 2022 2023 2024 2025
Pay
bac
k p
erio
d (
year
s)
Austin Chicago Denver Los Angeles New York City
Portland San Francisco Seattle Average
Figure 7. Payback period for a 250-mile battery electric vehicle relative to a conventional vehicle for a full-time, ride-hailing driver, 2018–2025.
$0.29
$0.25
$0.22
$0.25
$0.21
$0.17
$0.24
$0.20
$0.17
$0.00
$0.05
$0.10
$0.15
$0.20
$0.25
$0.30
Conventional Hybrid BEV(250 mile)
Conventional Hybrid BEV(250 mile)
Conventional Hybrid BEV(250 mile)
30,000 miles per year 40,000 miles per year 60,000 miles per year
Ave
rag
e co
st p
er m
ile
Figure 6. Five-year TCO average cost per mile for full-time ride-hailing drivers driving a BEV-250 relative to conventional and hybrid vehicles, across several different estimates of annual miles traveled in 2025.
WHEN DOES ELECTRIFYING SHARED MOBILITY MAKE ECONOMIC SENSE?
WORKING PAPER 2019-01 INTERNATIONAL COUNCIL ON CLEAN TRANSPORTATION 11
miles for an average private vehicle. With the fuel savings accruing 2 to 3 times faster, on average, a full-time ride-hailing driver of a BEV-250 sees a payback period that is less than half that of a private owner of the same electric vehicle.
The payback period for the BEV-250 relative to hybrids takes longer to decline than when compared to con-ventional vehicles. For the hybrid comparison in particular, region-specific factors contribute to long payback periods in the early years—for example, high electricity prices or low gas prices—or both together can narrow the operating costs in some cities, such as Austin, and reduce the relative per-mile benefits of BEVs in those cities. This effect decreases as the upfront price and operating costs of BEVs decline over time.
The regional variation among payback periods is primarily attributable to differences in average temperatures, incentive availability, and energy costs across the cities. Cold weather cities, such as Chicago and New York, require greater reliance on public DC fast charging during the winter months, increasing the payback periods for drivers. Cities with the most attrac-tive payback periods generally have warmer climates, lower electric-ity costs, and incentives for electric vehicle drivers. In Denver, Los Angeles, and San Francisco, upfront electric vehicle rebates result in a reduction in the payback periods by several years over the 2018 through 2021 period, elevating these cities to the shortest payback periods among the analyzed cities. The phaseout of rebates after 2021 brings these cities closer to the eight-city average. Energy cost dif-ferentials are another important factor in regional variation. Austin has low gasoline prices and relatively high elec-tricity prices, negatively influencing the value proposition of BEVs relative
to conventional vehicles and hybrids. On the opposite end of the spectrum, cities with low TOU rates, such as Los Angeles, Portland, and San Francisco, consistently generate short payback periods for electric ride-hailing opera-tion across all comparisons.
ConclusionOur assessment investigates the conditions under which electrifying shared mobility makes economic sense in the United States. Although the case already can be made in many situations in 2018, this analysis is focused on the broader trends for average shared-use vehicle cases. We close by offering four main con-clusions and several final reflections related to future work. Although we analyzed several different shared electric vehicle cases, we ultimately focused our analysis on ride-hailing applications, due to their especially compelling case for electrification.
Based on underlying economics, ride-hailing vehicles are ripe for electrifi-cation. Because of their greater annual mileage, typical full-time ride-hailing drivers have fuel savings that accrue 2 to 3 times faster when they buy more fuel-efficient vehicles. Without incen-tives, hybrids are the most attractive technology in 2018 based on lowest total cost of operation. Battery electric vehicles in 2018 beat hybrids in ride-hailing applications, provided that state-level incentives and the $7,500 federal tax credit are included, and when home overnight charging is avail-able. The payback on electric vehicles in ride-hailing applications is achieved at least twice as quickly as for private electric vehicle owners, which is again attributable to their greater annual mileage. In addition, because ride-hail-ing and taxi fleets approach vehicles from a commercial perspective, this makes economic metrics regarding fuel savings and payback period more
compelling than for typical private vehicle owners.
Even without purchasing incentives, BEVs will become the most economi-cally attractive technology for ride-hailing operations in the 2023–2025 time frame. Our central case scenario has electric vehicles becoming the most economically attractive option for ride-hailing drivers by 2023. For especially high-annual-driving ride-hailing vehicles, hybrids retain their advantage until 2025, due to electric vehicles’ greater fast charging needs. Electric vehicles beat conventional and hybrid vehicles on economic grounds in this time frame for several reasons. Foremost is the expected decline in battery pack costs from around $200 per kilowatt hour in 2018 to $130 by 2025. Of course if battery costs decline more quickly than this, electric ride-hailing could proliferate even more quickly. In addition, greater access to overnight charging as well as technol-ogy advancements that increase fast charging speeds greatly reduce driver downtime and associated opportu-nity costs. Average ride-hailing drivers across diverse cities—including Austin, Chicago, Denver, Los Angeles, New York, Portland, San Francisco, and Seattle—would see payback periods for plug-in electric vehicles versus conventional vehicles drop from 4–7 years in 2018 to 2–3 years by 2023.
Access to affordable charging will be critical to unlocking the economic benefits of electric ride-hailing. Electric vehicles become more attrac-tive than conventional and hybrid vehicles most quickly in cases where drivers have access to overnight residential charging. Greater reliance on public fast charging increases operating costs by about 25% due to higher energy costs from fast charging and also greater opportu-nity costs from time spent charging. For electrification to become a viable
WHEN DOES ELECTRIFYING SHARED MOBILITY MAKE ECONOMIC SENSE?
12 INTERNATIONAL COUNCIL ON CLEAN TRANSPORTATION WORKING PAPER 2019-01
mainstream option for ride-hailing drivers, greater access to lower-cost overnight charging infrastructure at homes, multi-unit dwellings, at the curb, and at public locations will be important. This is an important area to be addressed in future policies, for example in utility charging plans and utility rate structures.
Electrification of ride-hailing fleets is not likely to occur naturally, so new policy and company efforts will be key. Despite the results suggesting a compelling case to shift to plug-ins, such a shift will be neither quick nor likely if driven by market forces alone. Even with the positive econom-ics, ride-hailing fleet electric uptake is largely in city-specific pilots. Hybrids are more economically attractive, and this likely will persist until the early
2020s. Even when electric vehicles reach hybrid ownership cost, com-panies will need to deploy charging networks, with policy support, to meet the specific charging needs of growing ride-hailing fleets. It also is likely that ride-hailing drivers have awareness and education barriers similar to those of private drivers, so there is a role for companies to play in educating and steering their drivers toward electric vehicles with financ-ing and purchasing guidance. The supply of electric vehicles is limited in most markets, but based on the opportunity identified here, ride-hailing company demand could start to dictate their ideal electric vehicle model types and attributes.
Although the near- and long-term economic benefits of electric vehicles
in high-mileage fleet applications are clear, more work is needed to better understand the policy toolkit avail-able at state, city, and utility levels that can accelerate the transition to much broader applications for shared electric mobility. This work identifies expand-ing access to affordable residential and public fast charging as critical to ensuring an attractive electric vehicle value proposition for ride-hailing drivers in U.S. cities. Analysis like this will improve greatly with better resolu-tion into diverse annual patterns of ride-hailing drivers, if more detailed data become available over time. Despite the uncertainties, it appears to be clear that, with the right mix of policies and company leadership, shared fleets can be at the forefront of the transition to electric vehicles.
WHEN DOES ELECTRIFYING SHARED MOBILITY MAKE ECONOMIC SENSE?
WORKING PAPER 2019-01 INTERNATIONAL COUNCIL ON CLEAN TRANSPORTATION 13
ReferencesAhmed, S., Nelson, P., Susarla, N., Dees, D. (2018, March).
Automotive battery cost using BatPaC. Presented at the IEA Workshop on Batteries for Electric Mobility, Paris, France. Retrieved from https://www.iea.org/media/Workshops/2018/Session2ShabbirAhmedANL.pdf
Anderman, M. (2016). The Tesla battery report: Tesla Motors: Battery technology, analysis of the Gigafactory and Model 3, and the automakers’ perspectives. Retrieved from Total Battery Consulting website: http://www.totalbatteryconsulting.com/industry-reports/Tesla-report/Extract-from-the-Tesla-Battery-Report.pdf
Anderman, M. (2018, February). Progress in EV-battery cell cost and performance: How far and how fast? Presented at the SAE Hybrid Vehicle Symposium. Retrieved from http://www.pvsheridan.com/SAE-2018/2.30%20pm%20-%20Menahem%20Anderman,%20Total%20Battery%20Consulting.pdf
Benenson Strategy Group. (2015). Uber—The driver roadmap: Where Uber driver-partners have been, and where they’re going. Retrieved from https://newsroom.uber.com/wp-content/uploads/2015/01/BSG_Uber_Report.pdf
Berckmans, G., Messagie, M., Smekens, J., Omar, N., Vanhaverbeke, L., & Van Mierlo, J. (2017). Cost projection of state of the art lithium-ion batteries for electric vehicles up to 2030. Energies 2017, 10(9), 1314. Retrieved from http://www.mdpi.com/1996-1073/10/9/1314
California Air Resources Board. (2018, August 1). [Letter from Governor Edmund G. Brown Jr. to California Air Resources Board]. Retrieved from https://www.arb.ca.gov/msprog/zero_emission_fleet_letter_080118.pdf
California Air Resources Board. (n.d.). Plug-in vehicle resource center. Retrieved from: https://www.driveclean.ca.gov/pev/Costs/Vehicles.php
Chediak, M. (2017, December 5). The latest bull case for electric cars: The cheapest batteries ever. Bloomberg. Retrieved from https://www.bloomberg.com/news/articles/2017-12-05/latest-bull-case-for-electric-cars-the-cheapest-batteries-ever
Colorado Energy Office. (n.d.). Alt fuel vehicle tax credits. Retrieved from https://www.colorado.gov/pacific/energyoffice/alt-fuel-vehicle-tax-credits
Davies, C. (2017). VW I.D. EV boast: We’ll hugely undercut Tesla’s Model 3 says exec. SlashGear. Retrieved from https://www.slashgear.com/vw-i-d-ev-boast-well-hugely-undercut-teslas-model-3-says-exec-17491688/
Energy Information Administration. (2018a). Weekly retail gasoline and diesel prices. Retrieved from https://www.eia.gov/dnav/pet/pet_pri_gnd_dcus_nus_m.htm
Energy Information Administration. (2018b) Annual energy outlook 2018. https://www.eia.gov/outlooks/aeo/
Gasbuddy. (2017). Foot traffic report for the fuel & convenience store industry. Retrieved from https://business.gasbuddy.com/wp-content/uploads/2017/05/FootTrafficReportQ1.pdf
German, J. (2015). Hybrid vehicles: Trends in technology develop-ment and cost reduction. Retrieved from the International Council on Clean Transportation, https://www.theicct.org/publications/hybrid-vehicles-trends-technology-development-and-cost-reduction
International Energy Agency. (2015). World Energy Outlook. Retrieved from https://www.iea.org/newsroom/news/2015/november/world-energy-outlook-2015.html
Isenstadt, A., & Lutsey, N. (2017). Developing hydrogen fueling infrastructure for fuel cell vehicles: A status update. Retrieved from the ZEV Alliance website: http://www.zevalliance.org/hydrogen-infrastructure-status/
Lienert, P., & White, J. (2017, January 9). GM races to build a formula for profitable electric cars. Reuters. Retrieved from https://www.reuters.com/article/us-gm-electric-insight/gm-races-to-build-a-formula-for-profitable-electric-cars-idUSKBN1EY0GG
Lutsey, N., Meszler, D., Isenstadt, A., German, J., & Miller, J. (2017). Efficiency technology and cost assessment for U.S. 2025–2030 light-duty vehicles. Retrieved from the International Council on Clean Transportation, http://www.theicct.org/US-2030-technology-cost-assessment
Martin, E., & Shaheen, S. (2016). Impacts of Car2Go on vehicle ownership, modal shift, vehicle miles traveled, and greenhouse gas emissions: An analysis of five North American cities. Retrieved from Innovative Mobility Research, Transportation Sustainability Research Center, UC Berkeley, https://www.epa.gov/sites/production/files/2017-06/documents/05312017-martin.pdf
Metro Transportation Denver. (n.d.). Metro Taxi—Sustainable. Retrieved from http://www.metrotransportationdenver.com/about/hybrid-taxis/
New York City Taxi & Limousine Commission. (2014). Taxicab factbook. Retrieved from http://www.nyc.gov/html/tlc/down-loads/pdf/2014_tlc_factbook.pdf
New York City Taxi & Limousine Commission. (2016). TLC factbook. Retrieved from http://www.nyc.gov/html/tlc/down-loads/pdf/2016_tlc_factbook.pdf
Nicholas, M. (2018). Ensuring driving on electricity is cheaper than driving on gasoline. Retrieved from the International Council on Clean Transportation, https://www.theicct.org/publications/ensuring-driving-on-electricity-cheaper-than-gasoline
Nicholas, M. & Hall, D. (2018). Lessons learned on early electric vehicle fast-charging deployments. Retrieved from the International Council on Clean Transportation, https://www.theicct.org/publications/fast-charging-lessons-learned
WHEN DOES ELECTRIFYING SHARED MOBILITY MAKE ECONOMIC SENSE?
14 INTERNATIONAL COUNCIL ON CLEAN TRANSPORTATION WORKING PAPER 2019-01
Parrot, J. A., & Reich, M. (2018). An earnings standard for New York City’s app-based drivers: Economic analysis and policy assessment. (Report for the New York City Taxi and Limousine Commission). Retrieved from https://static1.squarespace.com/static/53ee4f0be4b015b9c3690d84/t/5b3a3aaa0e2e72ca74079142/1530542764109/Parrott-Reich+NYC+App+Drivers+TLC+Jul+2018jul1.pdf
Ryan, N., & McKenzie, L. (2016). Utilities’ role in transport electri-fication: Capturing benefits for all ratepayers. Public Utilities Fortnightly. Retrieved from https://www.fortnightly.com/fortnightly/2016/04/utilities-role-transport-electrification-capturing-benefits-all-ratepayers
Salisbury, S. (2016). Cold weather on-road testing of a 2015 Nissan Leaf. Retrieved from Idaho National Laboratory website: https://avt.inl.gov/sites/default/files/pdf/fsev/2015LeafColdWeatherTestJune2016.pdf
Serradilla, J., Wardle, J., Blythe, P., & Gibbon, J. (2017). An evidence-based approach for investment in rapid-charging infrastructure. Energy Policy, 106, 514–524. Retrieved from https://www.sciencedirect.com/science/article/pii/S030142151730232X
Shaheen, S., Martin, E., Hoffman-Stapleton, M., & Slowik, P. (2018). Understanding how cities can link smart mobility priorities through data. Retrieved from Transportation Sustainability Research Center, UC Berkeley, https://escholarship.org/uc/item/7303t6sw
Slowik, P., & Lutsey, N. (2018). The continued transition to electric vehicles in U.S. cities. Retrieved from the International Council on Clean Transportation, https://www.theicct.org/publications/continued-EV-transition-us-cities-2018
Sperling, D., Brown, A., D’Agostino, M. (2018). Could ride-hailing improve public transportation instead of undercutting it? GreenBiz. Retrieved from https://www.greenbiz.com/article/could-ride-hailing-improve-public-transportation-instead-undercutting-it
Transportation Research Board. (2018). Broadening understand-ing of the interplay among public transit, shared mobility, and personal automobiles (TCRP Research Report 195). Retrieved from http://onlinepubs.trb.org/onlinepubs/tcrp/tcrp_rpt_195.pdf
U.S. Department of Energy. (n.d.a). Maximizing electric cars’ range in extreme temperatures. Retrieved from Office of Energy Efficiency and Renewable Energy website: https://www.energy.gov/eere/electricvehicles/maximizing-electric-cars-range-extreme-temperatures
U.S. Department of Energy. (n.d.b). Side-by-side comparison of 2017 Toyota Prius, 2017 Nissan Sentra, 2017 Toyota Corolla, and 2017 Chevrolet Cruze. Retrieved from https://www.fuelecon-omy.gov/feg/Find.do?action=sbs&id=38061&id=38252&id=38153&id=37907
U.S. Environmental Protection Agency. (2016). Proposed deter-mination on the appropriateness of the model year 2022-2025 light-duty vehicle greenhouse gas emissions standards under the midterm evaluation. Retrieved from https://www.epa.gov/regulations-emissions-vehicles-and-engines/midterm-evaluation-light-duty-vehicle-greenhouse-gas#final
UBS. (2017). UBS evidence lab electric car teardown – Disruption ahead? Retrieved from https://neo.ubs.com/shared/d1ZTxnvF2k/
Union of Concerned Scientists.(2018). Do electric vehicles work in cold temperatures? Retrieved from https://www.ucsusa.org/clean-vehicles/electric-vehicles/cold-weather-electric-cars-batteries#.W37wIJNKjR
Washington State Department of Licensing. (2018). Alternative fuel vehicles and plug-in hybrids Washington state tax exemp-tions. Retrieved from https://www.dol.wa.gov/vehicleregistra-tion/altfuelexemptions.html
Yuksel,T., & Michalek, J. (2015). Effects of regional temperature on electric vehicle efficiency, range, and emissions in the United States. Retrieved from Carnegie Mellon University, https://www.cmu.edu/me/ddl/publications/2015-EST-Yuksel-Michalek-EV-Weather.pdf
WHEN DOES ELECTRIFYING SHARED MOBILITY MAKE ECONOMIC SENSE?
WORKING PAPER 2019-01 INTERNATIONAL COUNCIL ON CLEAN TRANSPORTATION 15
Appendix
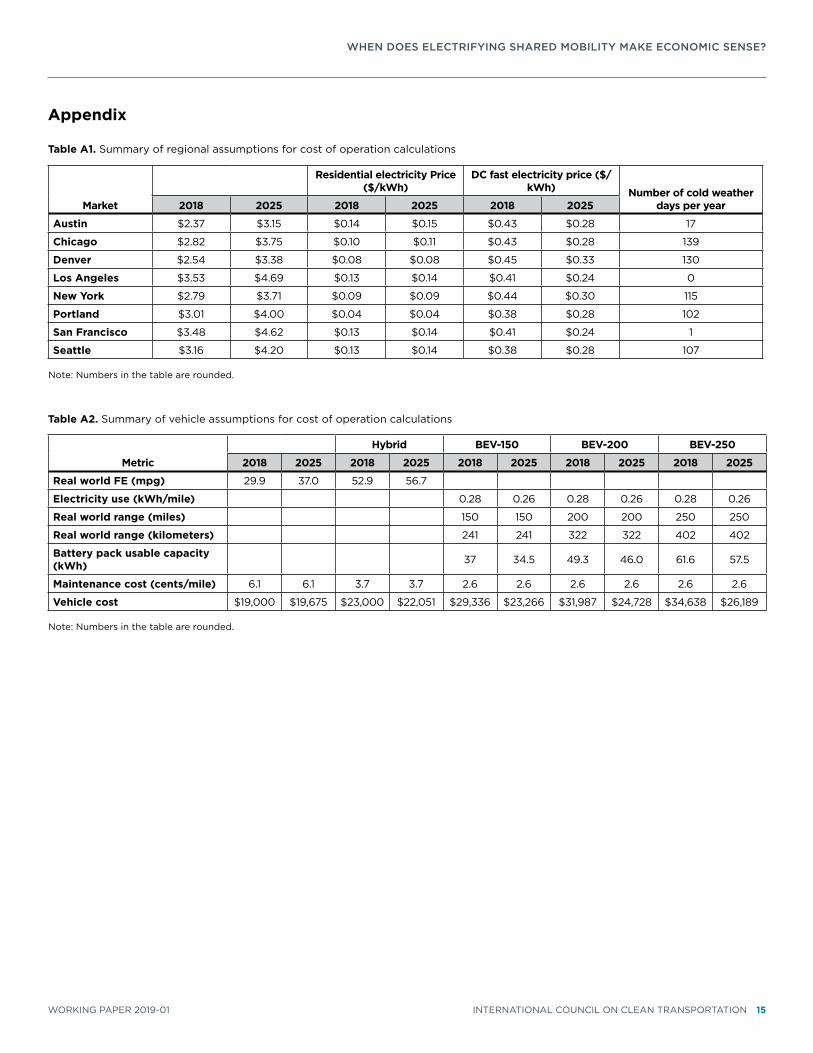
Table A1. Summary of regional assumptions for cost of operation calculations
Market
FUEL PRICE ($/GAL)Residential electricity Price
($/kWh)DC fast electricity price ($/
kWh) Number of cold weather days per year2018 2025 2018 2025 2018 2025
Austin $2.37 $3.15 $0.14 $0.15 $0.43 $0.28 17
Chicago $2.82 $3.75 $0.10 $0.11 $0.43 $0.28 139
Denver $2.54 $3.38 $0.08 $0.08 $0.45 $0.33 130
Los Angeles $3.53 $4.69 $0.13 $0.14 $0.41 $0.24 0
New York $2.79 $3.71 $0.09 $0.09 $0.44 $0.30 115
Portland $3.01 $4.00 $0.04 $0.04 $0.38 $0.28 102
San Francisco $3.48 $4.62 $0.13 $0.14 $0.41 $0.24 1
Seattle $3.16 $4.20 $0.13 $0.14 $0.38 $0.28 107
Note: Numbers in the table are rounded.
Table A2. Summary of vehicle assumptions for cost of operation calculations
Metric
CONVENTIONAL Hybrid BEV-150 BEV-200 BEV-250
2018 2025 2018 2025 2018 2025 2018 2025 2018 2025
Real world FE (mpg) 29.9 37.0 52.9 56.7
Electricity use (kWh/mile) 0.28 0.26 0.28 0.26 0.28 0.26
Real world range (miles) 150 150 200 200 250 250
Real world range (kilometers) 241 241 322 322 402 402
Battery pack usable capacity (kWh) 37 34.5 49.3 46.0 61.6 57.5
Maintenance cost (cents/mile) 6.1 6.1 3.7 3.7 2.6 2.6 2.6 2.6 2.6 2.6
Vehicle cost $19,000 $19,675 $23,000 $22,051 $29,336 $23,266 $31,987 $24,728 $34,638 $26,189
Note: Numbers in the table are rounded.