Embed Size (px)
Citation preview
7/27/2019 When Big Data Goes Lean
http://slidepdf.com/reader/full/when-big-data-goes-lean 1/5
The application of larger data sets, faster computational power,
and more advanced analytic techniques is spurring progress on a
range of lean-management priorities. Sophisticated modeling can
help to identify waste, for example, thus empowering workers and
opening up new frontiers where lean problem solving can support
continuous improvement. Powerful data-driven analytics also can
help to solve previously unsolvable (and even unknown) problems
that undermine efciency in complex manufacturing environments:
hidden bottlenecks, operational rigidities, and areas of excessive
variability. Similarly, the power of data to support improvement
efforts in related areas, such as quality and production planning, is
growing as companies get better at storing, sharing, integrating, and
understanding their data more quickly and easily.
Pioneers in the application of advanced-analytics approaches, some
borrowed from risk management and nance, are emerging in
industries such as chemicals, electronics, mining and metals, and
pharmaceuticals. Many are lean veterans: these companies cut their
teeth during the 1990s (when sagging prices hit a range of basic-
materials companies hard) and more recently doubled down in
response to rising raw-materials prices. The benets they’re
enjoying—an extra two to three percentage points of margin, on top
of earlier productivity gains (from conventional lean methods) that
often reached 10 to 15 percent—suggest that more big data
applications will be nding their way into the lean tool kits of large
When big data goes lean
The combination of advanced analytics and
lean management could be worth tens of
billions of dollars in higher earnings for large
manufacturers. A few leading companies are
showing the way.
Rajat Dhawan, Kunwar Singh, and Ashish Tuteja
F E B R U A R Y 2 0 14
7/27/2019 When Big Data Goes Lean
http://slidepdf.com/reader/full/when-big-data-goes-lean 2/5
2
manufacturers. Indeed, our work suggests that, taken together, the
new uses of proven analytical tools could be worth tens of billions ofdollars in EBITDA (earnings before interest, taxes, depreciation, and
amortization) for manufacturers in the automobile, chemical, consumer-
product, and pharmaceutical industries, among others (exhibit).
Nonetheless, to get the most from data-fueled lean production,
companies have to adjust their traditional approach to kaizen (the
philosophy of continuous improvement). In our experience, many
nd it useful to set up special data-optimization labs or cells within
their existing operations units. This approach typically requires
forming a small team of econometrics specialists, operations-
research experts, and statisticians familiar with the appropriate
tools. By connecting these analytics experts with their frontline
colleagues, companies can begin to identify opportunities for
improvement projects that will both increase performance and help
operators learn to apply their lean problem-solving skills in new ways.
For example, a pharmaceutical company wanted to get to the root
causes of variability in an important production process. Operators
suspected that some 50 variables were involved but couldn’t
determine the relationships among them to improve overall
efciency. Working closely with data specialists, the operators used
neural networks (a machine-learning technique) to model the
potential combinations and effects of the variables. Ultimately, it
determined that ve of them mattered most. Once the primary drivers
were clear, the operators focused their efforts on optimizing the
relevant parameters and then managing them as part of routine plant
operations. This helped the company to improve yields by 30 percent.
Similarly, a leading steel producer used advanced analytics to
identify and capture margin-improvement opportunities worth
more than $200 million a year across its production value chain.
This result is noteworthy because the company already had a 15-year
history of deploying lean approaches and had recently won an award
for quality and process excellence. The steelmaker began with a
Monte Carlo simulation, widely used in biology, computational
physics, engineering, nance, and insurance to model ranges of
possible outcomes and their probabilities. Manufacturing companies
can adapt these methods to model their own uncertainties by
running thousands of simulations using historical plant data to
7/27/2019 When Big Data Goes Lean
http://slidepdf.com/reader/full/when-big-data-goes-lean 3/5
3
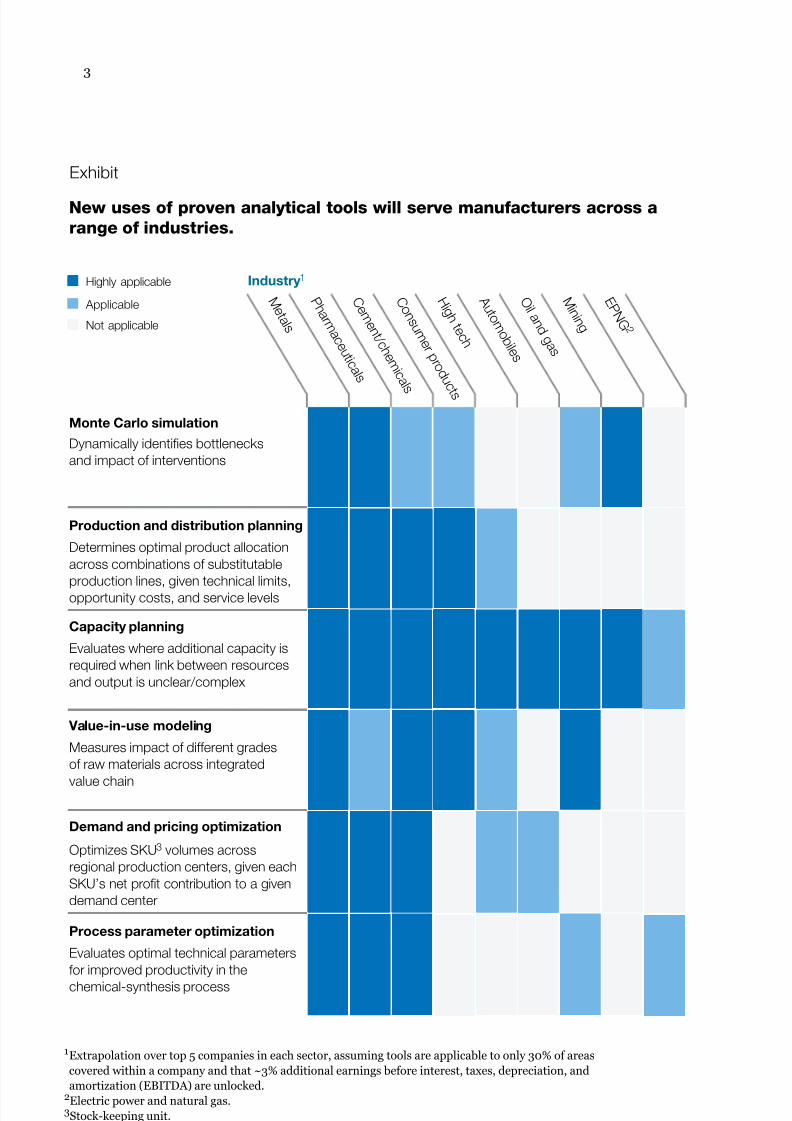
Exhibit
New uses of proven analytical tools will serve manufacturers across a
range of industries.
1Extrapolation over top 5 companies in each sector, assuming tools are applicable to only 30% of areas
covered within a company and that ~3% additional earnings before interest, taxes, depreciation, and
amortization (EBITDA) are unlocked.2Electric power and natural gas.3Stock-keeping unit.
Monte Carlo simulation
Dynamically identifies bottlenecks
and impact of interventions
Production and distribution planning
Determines optimal product allocation
across combinations of substitutable
production lines, given technical limits,
opportunity costs, and service levels
Capacity planning
Evaluates where additional capacity is
required when link between resources
and output is unclear/complex
Value-in-use modeling
Measures impact of different grades
of raw materials across integrated
value chain
Demand and pricing optimization
Optimizes SKU3 volumes across
regional production centers, given each
SKU’s net profit contribution to a given
demand center
Process parameter optimization
Evaluates optimal technical parameters
for improved productivity in the
chemical-synthesis process
Industry 1
M e t a l s Not applicable
Applicable
Highly applicable
M i n i n g
E P N G
2
O i l a n d
g a s
C e m
e n t / c h e m i c a
l s
A u t o m
o b i l e s
P h a r m
a c e u t i c a l s
C o n s u m
e r p r o d u
c t s
H i g h t e c h
7/27/2019 When Big Data Goes Lean
http://slidepdf.com/reader/full/when-big-data-goes-lean 4/5
4
identify the probabilities of breakdowns, as well as variations in
cycle times and in the availability of multiple pieces of equipmentacross parts of a production process.
The steelmaker focused on what it thought was the principal
bottleneck in an important process, where previous continuous-
improvement efforts had already helped raise output by 10 percent.
When statisticians analyzed the historical data, however, they
recognized that the process suffered from multiple bottlenecks,
which shifted under different conditions. The part of the process
that the operators traditionally focused on had a 60 percent
probability of causing problems, but two other parts could also
cripple output, though they were somewhat less likely to do so.
With this new understanding, the company conducted structured
problem-solving exercises to nd newer, more economical ways of
making improvements. Given the statistical distribution of the
bottlenecks, it proved more efcient to start with a few low-cost
maintenance and reliability measures. This approach helped
improve the availability of three key pieces of equipment, resulting
in a 20 percent throughput increase that translated into more than
$50 million in EBITDA improvements.
(Monte Carlo simulation holds promise in other areas, too. A mining
company, for instance, used it to challenge a project’s capital
assumptions, in part by deploying historical data on various
disruptions—for example, rainfall patterns—to model the effect of
oods and other natural events on the company’s mines. This effort
helped it to optimize handling and storage capacity across its whole
network of facilities, thus lowering the related capital expenditures
by 20 percent.)
A second analytical tool the steelmaker employed was value-in-use
modeling, long a xture in procurement applications, where it helps
to optimize the purchasing of raw materials. The steelmaker used
these techniques to see how different blends of metallurgical coal1
might affect the economics of its production activities. The team
investigating the problem started with about 40 variables describing
the specications (such as ash content and impurities affecting
1 A raw material that is converted to coke for use in steelmaking.
7/27/2019 When Big Data Goes Lean
http://slidepdf.com/reader/full/when-big-data-goes-lean 5/5
5
The authors wish to thank Abhishek Anand, Rajat Gupta, Snehanshu Mahto,
Dev Ramchandani, Aman Sethi, Saurabh Srivastava, and Abhishek Tikmani for
their contributions to the analysis underpinning this article.
Rajat Dhawan is a director in McKinsey’s Delhi office, where Kunwar Singh
is an associate principal; Ashish Tuteja is an associate principal in the
Mumbai office.
production) of different types of coal. Later it added fuel consumption,
productivity, and transport costs. This approach helped operators to
identify and prioritize a series of plantwide kaizen activities that
lowered the company’s raw-materials costs by 4 to 6 percent.
Moreover, procurement managers integrated the model’s ndings
into their routines—for example, by monitoring and adjusting coal
blends on a quarterly basis; previously, they might have done so only
once or twice a year, because of the complexity involved.
As the steelmaker’s example suggests, the key to applying advanced
analytics in lean-production environments is to view data through
the lens of continuous improvement and not as an isolated series of
one-offs. The ability to solve previously unsolvable problems and
make better operational decisions in real time is a powerful
combination. More powerful still is using these advantages to
encourage and empower frontline decision making. By pushing
data-related issues lower in the organization, the steelmaker is
encouraging a strong culture of continuous improvement. It is also
identifying new areas to apply its growing prociency in advanced
analytics. One area is production planning, where the operations
group is working with internal marketing and sales, as well as
external suppliers, to improve the accuracy of sales forecasts and
make production more efcient.
The steelmaker’s story shows that senior executives must take an
active role. In our experience, the information and data required for
many big data initiatives already exist in silos around companies—in
shop-oor production logs, maintenance registers, real-time
equipment-performance data, and even vendor performance-
guarantee sheets. In some cases, data may come from outside
partners or databases. Determining what to look for, where to get it,
and how to use it across a dispersed manufacturing network
requires executive know-how and support.
Copyright © 2014 McKinsey & Company.
All rights reserved.