Embed Size (px)
Citation preview

WHEATON PARK DISTRICT
Financial Overview
December, 2017
Financial Overview Table of Contents
Page #s Statement Description
Board Requested
1 WPD Summary
2 AGC Month and Year to Date Departmental Operating Summary
3 Cosley Zoo Analysis
4 Cash & Investments
5 Cash/Fund Balance Target Status Report
6 Investments Report
Balance Sheets
7 General Fund Balance Sheets
8 Recreation Fund Balance Sheets
9 Cosley Zoo Fund Balance Sheets
10 Debt Service Fund Balance Sheets
11 Capital Projects Fund Balance Sheets
12 Arrowhead Golf Club Fund Balance Sheets
13 Information Technology Internal Service Fund Balance Sheets
14 Health Insurance Internal Service Fund Balance Sheets
Operating Statements Year To Date
15 General Fund
15 Recreation Fund
15 Cosley Zoo Fund
16 Debt Service Fund
16 Capital Projects Fund
16 Arrowhead Golf Club Fund
16 ‐ 17 Information Technology Internal Service Fund
17 Health Insurance Internal Service Fund
Operating Statements By Department Year To Date
18 General Fund
18 ‐ 20 Recreation Fund
20 ‐ 21 Cosley Zoo Fund
21 ‐ 23 Arrowhead Golf Club Fund
Special Areas Operating Statements
24 Parks Plus Fitness Operating Summary
25 Central Athletic Complex Operating Summary
26 Special Events
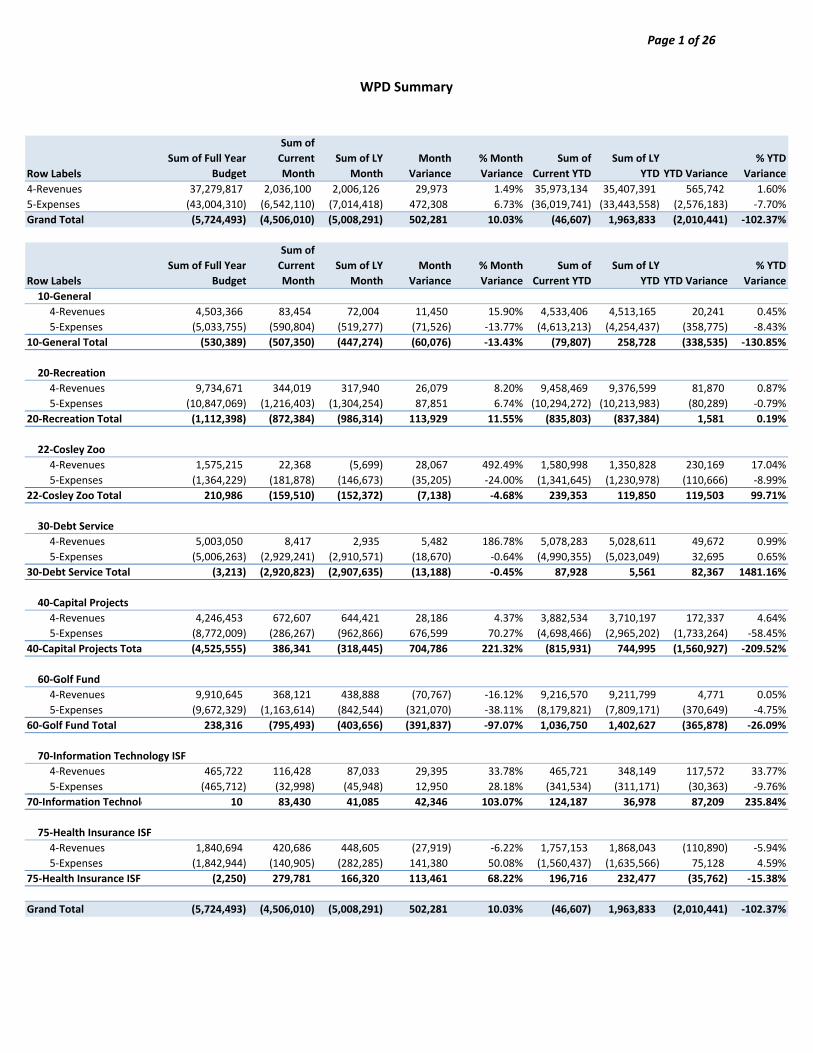
WPD Summary
Row Labels
Sum of Full Year
Budget
Sum of
Current
Month
Sum of LY
Month
Month
Variance
% Month
Variance
Sum of
Current YTD
Sum of LY
YTD YTD Variance
% YTD
Variance
4‐Revenues 37,279,817 2,036,100 2,006,126 29,973 1.49% 35,973,134 35,407,391 565,742 1.60%
5‐Expenses (43,004,310) (6,542,110) (7,014,418) 472,308 6.73% (36,019,741) (33,443,558) (2,576,183) ‐7.70%
Grand Total (5,724,493) (4,506,010) (5,008,291) 502,281 10.03% (46,607) 1,963,833 (2,010,441) ‐102.37%
Row Labels
Sum of Full Year
Budget
Sum of
Current
Month
Sum of LY
Month
Month
Variance
% Month
Variance
Sum of
Current YTD
Sum of LY
YTD YTD Variance
% YTD
Variance
10‐General
4‐Revenues 4,503,366 83,454 72,004 11,450 15.90% 4,533,406 4,513,165 20,241 0.45%
5‐Expenses (5,033,755) (590,804) (519,277) (71,526) ‐13.77% (4,613,213) (4,254,437) (358,775) ‐8.43%
10‐General Total (530,389) (507,350) (447,274) (60,076) ‐13.43% (79,807) 258,728 (338,535) ‐130.85%
20‐Recreation
4‐Revenues 9,734,671 344,019 317,940 26,079 8.20% 9,458,469 9,376,599 81,870 0.87%
5‐Expenses (10,847,069) (1,216,403) (1,304,254) 87,851 6.74% (10,294,272) (10,213,983) (80,289) ‐0.79%
20‐Recreation Total (1,112,398) (872,384) (986,314) 113,929 11.55% (835,803) (837,384) 1,581 0.19%
22‐Cosley Zoo
4‐Revenues 1,575,215 22,368 (5,699) 28,067 492.49% 1,580,998 1,350,828 230,169 17.04%
5‐Expenses (1,364,229) (181,878) (146,673) (35,205) ‐24.00% (1,341,645) (1,230,978) (110,666) ‐8.99%
22‐Cosley Zoo Total 210,986 (159,510) (152,372) (7,138) ‐4.68% 239,353 119,850 119,503 99.71%
30‐Debt Service
4‐Revenues 5,003,050 8,417 2,935 5,482 186.78% 5,078,283 5,028,611 49,672 0.99%
5‐Expenses (5,006,263) (2,929,241) (2,910,571) (18,670) ‐0.64% (4,990,355) (5,023,049) 32,695 0.65%
30‐Debt Service Total (3,213) (2,920,823) (2,907,635) (13,188) ‐0.45% 87,928 5,561 82,367 1481.16%
40‐Capital Projects
4‐Revenues 4,246,453 672,607 644,421 28,186 4.37% 3,882,534 3,710,197 172,337 4.64%
5‐Expenses (8,772,009) (286,267) (962,866) 676,599 70.27% (4,698,466) (2,965,202) (1,733,264) ‐58.45%
40‐Capital Projects Tota (4,525,555) 386,341 (318,445) 704,786 221.32% (815,931) 744,995 (1,560,927) ‐209.52%
60‐Golf Fund
4‐Revenues 9,910,645 368,121 438,888 (70,767) ‐16.12% 9,216,570 9,211,799 4,771 0.05%
5‐Expenses (9,672,329) (1,163,614) (842,544) (321,070) ‐38.11% (8,179,821) (7,809,171) (370,649) ‐4.75%
60‐Golf Fund Total 238,316 (795,493) (403,656) (391,837) ‐97.07% 1,036,750 1,402,627 (365,878) ‐26.09%
70‐Information Technology ISF
4‐Revenues 465,722 116,428 87,033 29,395 33.78% 465,721 348,149 117,572 33.77%
5‐Expenses (465,712) (32,998) (45,948) 12,950 28.18% (341,534) (311,171) (30,363) ‐9.76%
70‐Information Technolo 10 83,430 41,085 42,346 103.07% 124,187 36,978 87,209 235.84%
75‐Health Insurance ISF
4‐Revenues 1,840,694 420,686 448,605 (27,919) ‐6.22% 1,757,153 1,868,043 (110,890) ‐5.94%
5‐Expenses (1,842,944) (140,905) (282,285) 141,380 50.08% (1,560,437) (1,635,566) 75,128 4.59%
75‐Health Insurance ISF (2,250) 279,781 166,320 113,461 68.22% 196,716 232,477 (35,762) ‐15.38%
Grand Total (5,724,493) (4,506,010) (5,008,291) 502,281 10.03% (46,607) 1,963,833 (2,010,441) ‐102.37%
Page 1 of 26
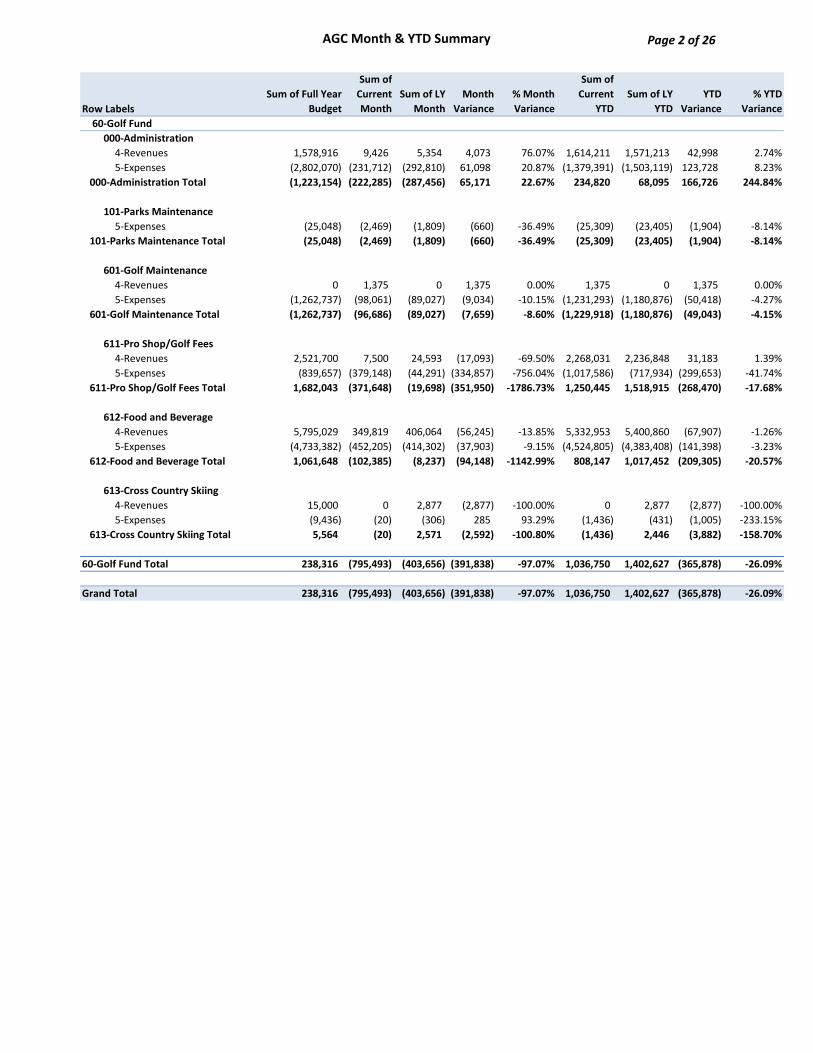
AGC Month & YTD Summary
Row Labels
Sum of Full Year
Budget
Sum of
Current
Month
Sum of LY
Month
Month
Variance
% Month
Variance
Sum of
Current
YTD
Sum of LY
YTD
YTD
Variance
% YTD
Variance
60‐Golf Fund
000‐Administration
4‐Revenues 1,578,916 9,426 5,354 4,073 76.07% 1,614,211 1,571,213 42,998 2.74%
5‐Expenses (2,802,070) (231,712) (292,810) 61,098 20.87% (1,379,391) (1,503,119) 123,728 8.23%
000‐Administration Total (1,223,154) (222,285) (287,456) 65,171 22.67% 234,820 68,095 166,726 244.84%
101‐Parks Maintenance
5‐Expenses (25,048) (2,469) (1,809) (660) ‐36.49% (25,309) (23,405) (1,904) ‐8.14%
101‐Parks Maintenance Total (25,048) (2,469) (1,809) (660) ‐36.49% (25,309) (23,405) (1,904) ‐8.14%
601‐Golf Maintenance
4‐Revenues 0 1,375 0 1,375 0.00% 1,375 0 1,375 0.00%
5‐Expenses (1,262,737) (98,061) (89,027) (9,034) ‐10.15% (1,231,293) (1,180,876) (50,418) ‐4.27%
601‐Golf Maintenance Total (1,262,737) (96,686) (89,027) (7,659) ‐8.60% (1,229,918) (1,180,876) (49,043) ‐4.15%
611‐Pro Shop/Golf Fees
4‐Revenues 2,521,700 7,500 24,593 (17,093) ‐69.50% 2,268,031 2,236,848 31,183 1.39%
5‐Expenses (839,657) (379,148) (44,291) (334,857) ‐756.04% (1,017,586) (717,934) (299,653) ‐41.74%
611‐Pro Shop/Golf Fees Total 1,682,043 (371,648) (19,698) (351,950) ‐1786.73% 1,250,445 1,518,915 (268,470) ‐17.68%
612‐Food and Beverage
4‐Revenues 5,795,029 349,819 406,064 (56,245) ‐13.85% 5,332,953 5,400,860 (67,907) ‐1.26%
5‐Expenses (4,733,382) (452,205) (414,302) (37,903) ‐9.15% (4,524,805) (4,383,408) (141,398) ‐3.23%
612‐Food and Beverage Total 1,061,648 (102,385) (8,237) (94,148) ‐1142.99% 808,147 1,017,452 (209,305) ‐20.57%
613‐Cross Country Skiing
4‐Revenues 15,000 0 2,877 (2,877) ‐100.00% 0 2,877 (2,877) ‐100.00%
5‐Expenses (9,436) (20) (306) 285 93.29% (1,436) (431) (1,005) ‐233.15%
613‐Cross Country Skiing Total 5,564 (20) 2,571 (2,592) ‐100.80% (1,436) 2,446 (3,882) ‐158.70%
60‐Golf Fund Total 238,316 (795,493) (403,656) (391,838) ‐97.07% 1,036,750 1,402,627 (365,878) ‐26.09%
Grand Total 238,316 (795,493) (403,656) (391,838) ‐97.07% 1,036,750 1,402,627 (365,878) ‐26.09%
Page 2 of 26
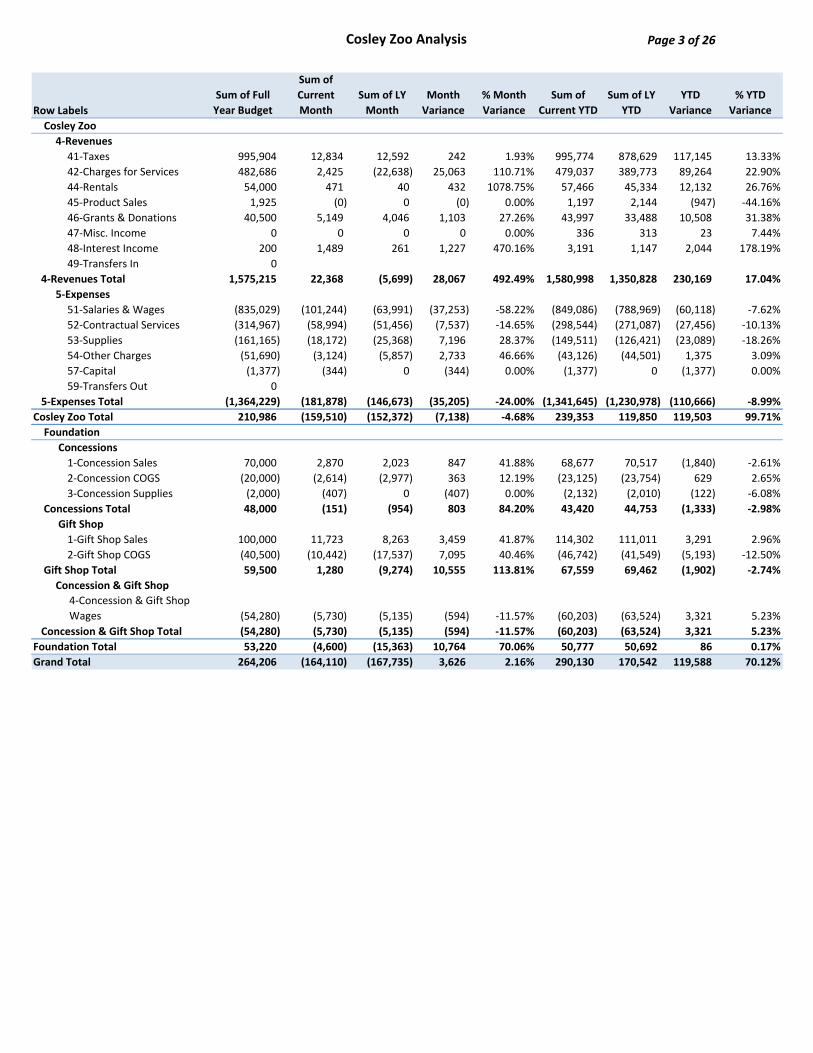
Cosley Zoo Analysis
Row Labels
Sum of Full
Year Budget
Sum of
Current
Month
Sum of LY
Month
Month
Variance
% Month
Variance
Sum of
Current YTD
Sum of LY
YTD
YTD
Variance
% YTD
Variance
Cosley Zoo
4‐Revenues
41‐Taxes 995,904 12,834 12,592 242 1.93% 995,774 878,629 117,145 13.33%
42‐Charges for Services 482,686 2,425 (22,638) 25,063 110.71% 479,037 389,773 89,264 22.90%
44‐Rentals 54,000 471 40 432 1078.75% 57,466 45,334 12,132 26.76%
45‐Product Sales 1,925 (0) 0 (0) 0.00% 1,197 2,144 (947) ‐44.16%
46‐Grants & Donations 40,500 5,149 4,046 1,103 27.26% 43,997 33,488 10,508 31.38%
47‐Misc. Income 0 0 0 0 0.00% 336 313 23 7.44%
48‐Interest Income 200 1,489 261 1,227 470.16% 3,191 1,147 2,044 178.19%
49‐Transfers In 0
4‐Revenues Total 1,575,215 22,368 (5,699) 28,067 492.49% 1,580,998 1,350,828 230,169 17.04%
5‐Expenses
51‐Salaries & Wages (835,029) (101,244) (63,991) (37,253) ‐58.22% (849,086) (788,969) (60,118) ‐7.62%
52‐Contractual Services (314,967) (58,994) (51,456) (7,537) ‐14.65% (298,544) (271,087) (27,456) ‐10.13%
53‐Supplies (161,165) (18,172) (25,368) 7,196 28.37% (149,511) (126,421) (23,089) ‐18.26%
54‐Other Charges (51,690) (3,124) (5,857) 2,733 46.66% (43,126) (44,501) 1,375 3.09%
57‐Capital (1,377) (344) 0 (344) 0.00% (1,377) 0 (1,377) 0.00%
59‐Transfers Out 0
5‐Expenses Total (1,364,229) (181,878) (146,673) (35,205) ‐24.00% (1,341,645) (1,230,978) (110,666) ‐8.99%
Cosley Zoo Total 210,986 (159,510) (152,372) (7,138) ‐4.68% 239,353 119,850 119,503 99.71%
Foundation
Concessions
1‐Concession Sales 70,000 2,870 2,023 847 41.88% 68,677 70,517 (1,840) ‐2.61%
2‐Concession COGS (20,000) (2,614) (2,977) 363 12.19% (23,125) (23,754) 629 2.65%
3‐Concession Supplies (2,000) (407) 0 (407) 0.00% (2,132) (2,010) (122) ‐6.08%
Concessions Total 48,000 (151) (954) 803 84.20% 43,420 44,753 (1,333) ‐2.98%
Gift Shop
1‐Gift Shop Sales 100,000 11,723 8,263 3,459 41.87% 114,302 111,011 3,291 2.96%
2‐Gift Shop COGS (40,500) (10,442) (17,537) 7,095 40.46% (46,742) (41,549) (5,193) ‐12.50%
Gift Shop Total 59,500 1,280 (9,274) 10,555 113.81% 67,559 69,462 (1,902) ‐2.74%
Concession & Gift Shop
4‐Concession & Gift Shop
Wages (54,280) (5,730) (5,135) (594) ‐11.57% (60,203) (63,524) 3,321 5.23%
Concession & Gift Shop Total (54,280) (5,730) (5,135) (594) ‐11.57% (60,203) (63,524) 3,321 5.23%
Foundation Total 53,220 (4,600) (15,363) 10,764 70.06% 50,777 50,692 86 0.17%
Grand Total 264,206 (164,110) (167,735) 3,626 2.16% 290,130 170,542 119,588 70.12%
Page 3 of 26
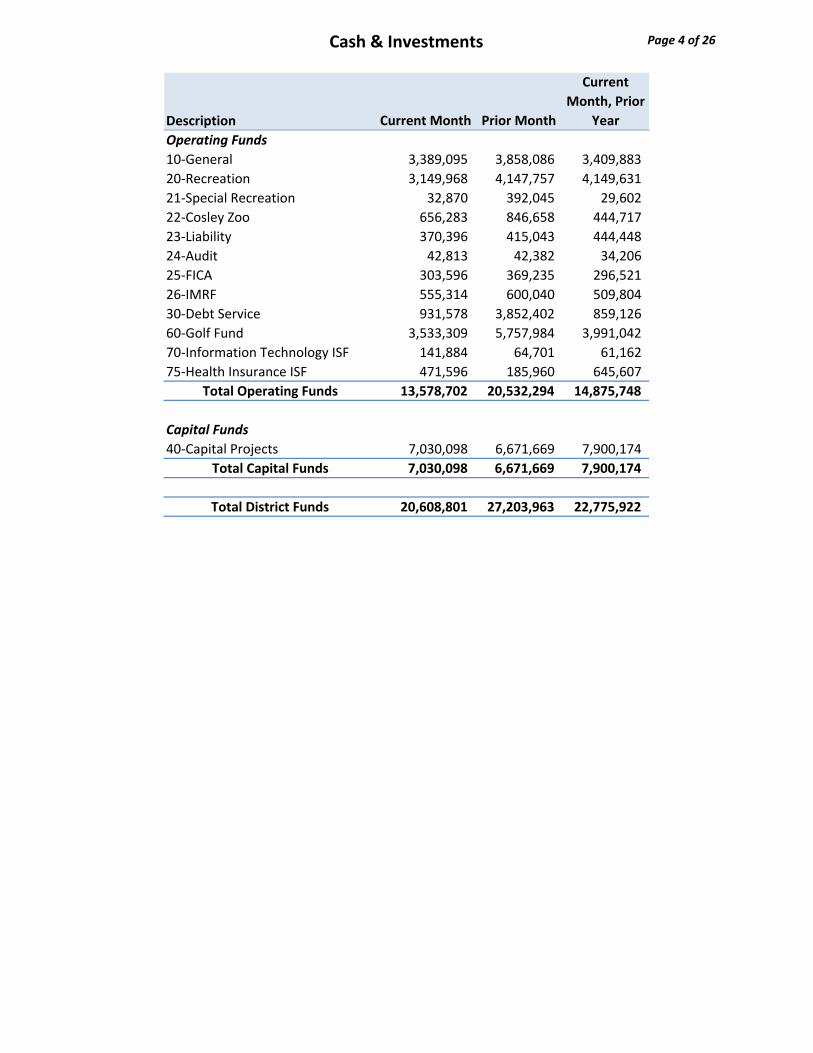
Cash & Investments
Description Current Month Prior Month
Current
Month, Prior
Year
Operating Funds
10‐General 3,389,095 3,858,086 3,409,883
20‐Recreation 3,149,968 4,147,757 4,149,631
21‐Special Recreation 32,870 392,045 29,602
22‐Cosley Zoo 656,283 846,658 444,717
23‐Liability 370,396 415,043 444,448
24‐Audit 42,813 42,382 34,206
25‐FICA 303,596 369,235 296,521
26‐IMRF 555,314 600,040 509,804
30‐Debt Service 931,578 3,852,402 859,126
60‐Golf Fund 3,533,309 5,757,984 3,991,042
70‐Information Technology ISF 141,884 64,701 61,162
75‐Health Insurance ISF 471,596 185,960 645,607
Total Operating Funds 13,578,702 20,532,294 14,875,748
Capital Funds
40‐Capital Projects 7,030,098 6,671,669 7,900,174
Total Capital Funds 7,030,098 6,671,669 7,900,174
Total District Funds 20,608,801 27,203,963 22,775,922
Page 4 of 26
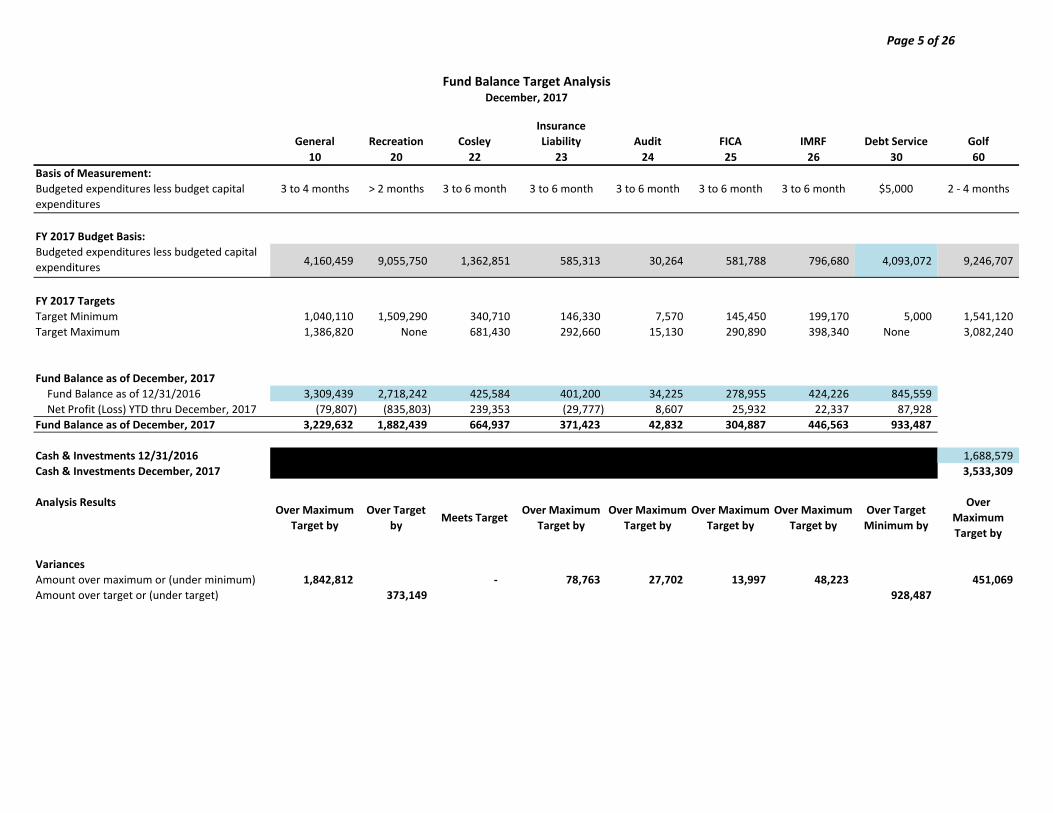
General Recreation Cosley
Insurance
Liability Audit FICA IMRF Debt Service Golf
10 20 22 23 24 25 26 30 60
Basis of Measurement:
3 to 4 months > 2 months 3 to 6 month 3 to 6 month 3 to 6 month 3 to 6 month 3 to 6 month $5,000 2 ‐ 4 months
FY 2017 Budget Basis:
4,160,459 9,055,750 1,362,851 585,313 30,264 581,788 796,680 4,093,072 9,246,707
FY 2017 Targets
Target Minimum 1,040,110 1,509,290 340,710 146,330 7,570 145,450 199,170 5,000 1,541,120
Target Maximum 1,386,820 None 681,430 292,660 15,130 290,890 398,340 None 3,082,240
Fund Balance as of December, 2017
Fund Balance as of 12/31/2016 3,309,439 2,718,242 425,584 401,200 34,225 278,955 424,226 845,559
Net Profit (Loss) YTD thru December, 2017 (79,807) (835,803) 239,353 (29,777) 8,607 25,932 22,337 87,928
Fund Balance as of December, 2017 3,229,632 1,882,439 664,937 371,423 42,832 304,887 446,563 933,487
Cash & Investments 12/31/2016 1,688,579
Cash & Investments December, 2017 3,533,309
Analysis ResultsOver Maximum
Target by
Over Target
byMeets Target
Over Maximum
Target by
Over Maximum
Target by
Over Maximum
Target by
Over Maximum
Target by
Over Target
Minimum by
Over
Maximum
Target by
Variances
Amount over maximum or (under minimum) 1,842,812 ‐ 78,763 27,702 13,997 48,223 451,069
Amount over target or (under target) 373,149 928,487
Fund Balance Target AnalysisDecember, 2017
Budgeted expenditures less budget capital
expenditures
Budgeted expenditures less budgeted capital
expenditures
Page 5 of 26
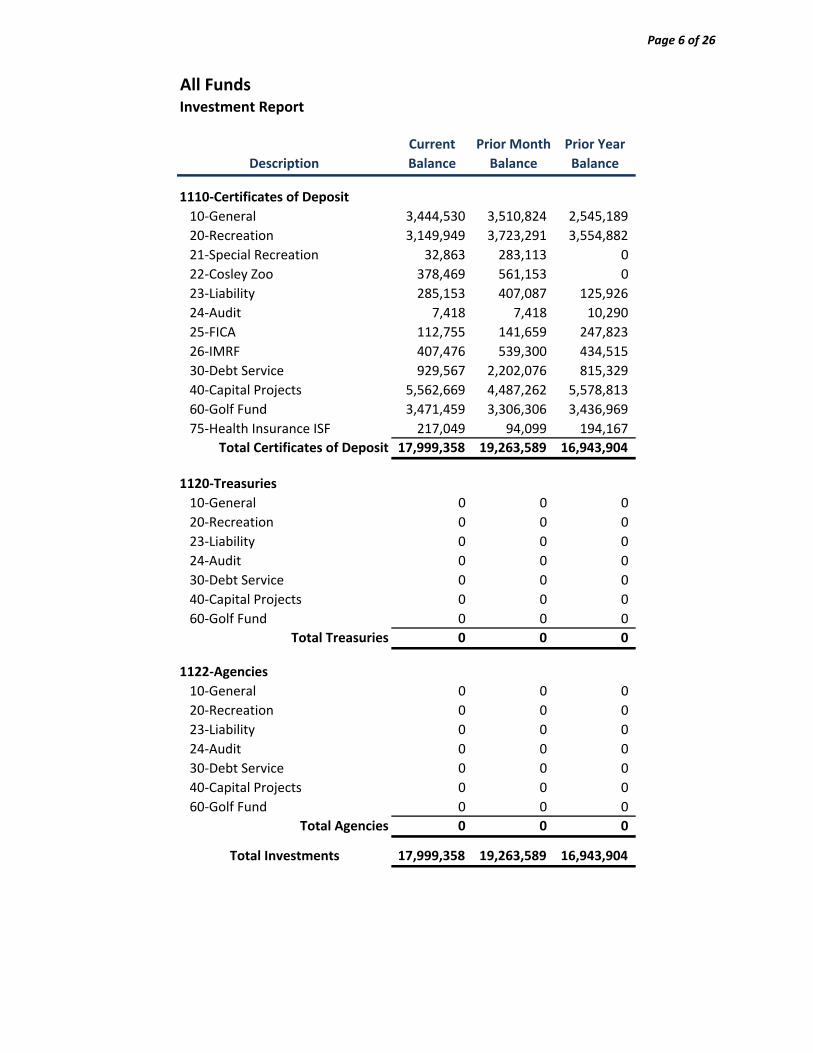
All FundsInvestment Report
Description
Current
Balance
Prior Month
Balance
Prior Year
Balance
1110‐Certificates of Deposit
10‐General 3,444,530 3,510,824 2,545,189
20‐Recreation 3,149,949 3,723,291 3,554,882
21‐Special Recreation 32,863 283,113 0
22‐Cosley Zoo 378,469 561,153 0
23‐Liability 285,153 407,087 125,926
24‐Audit 7,418 7,418 10,290
25‐FICA 112,755 141,659 247,823
26‐IMRF 407,476 539,300 434,515
30‐Debt Service 929,567 2,202,076 815,329
40‐Capital Projects 5,562,669 4,487,262 5,578,813
60‐Golf Fund 3,471,459 3,306,306 3,436,969
75‐Health Insurance ISF 217,049 94,099 194,167
Total Certificates of Deposit 17,999,358 19,263,589 16,943,904
1120‐Treasuries
10‐General 0 0 0
20‐Recreation 0 0 0
23‐Liability 0 0 0
24‐Audit 0 0 0
30‐Debt Service 0 0 0
40‐Capital Projects 0 0 0
60‐Golf Fund 0 0 0
Total Treasuries 0 0 0
1122‐Agencies
10‐General 0 0 0
20‐Recreation 0 0 0
23‐Liability 0 0 0
24‐Audit 0 0 0
30‐Debt Service 0 0 0
40‐Capital Projects 0 0 0
60‐Golf Fund 0 0 0
Total Agencies 0 0 0
Total Investments 17,999,358 19,263,589 16,943,904
Page 6 of 26
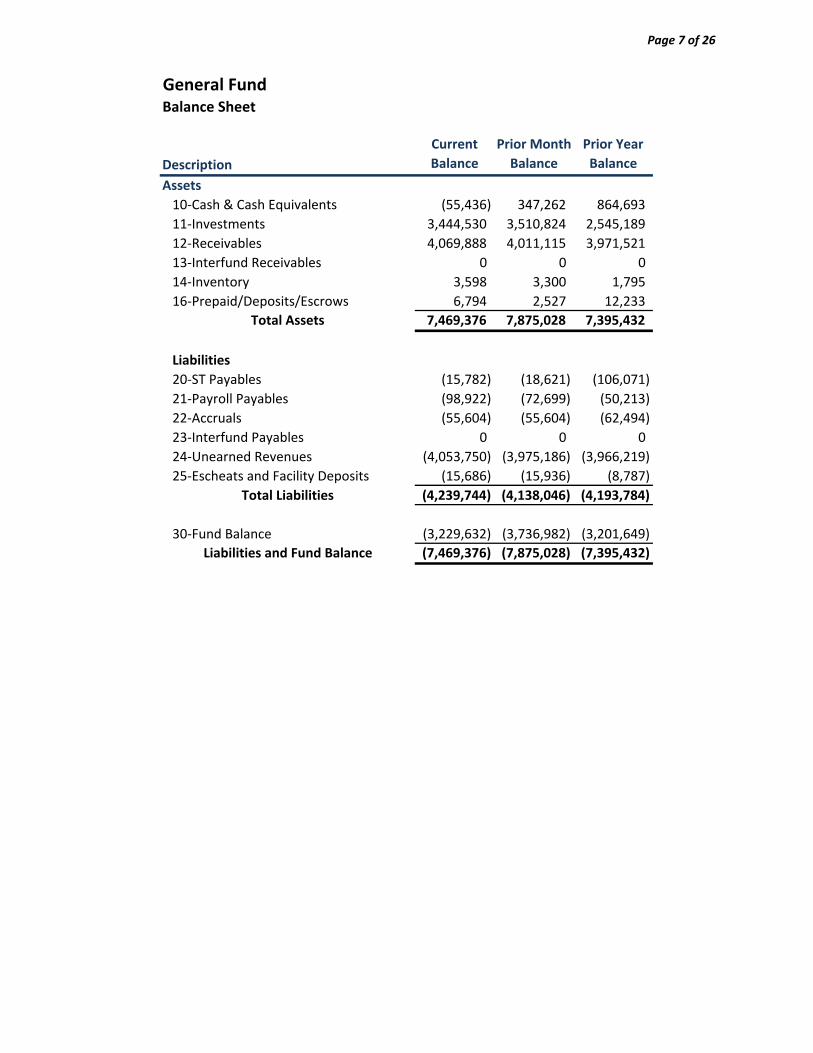
General FundBalance Sheet
Description
Current
Balance
Prior Month
Balance
Prior Year
Balance
Assets
10‐Cash & Cash Equivalents (55,436) 347,262 864,693
11‐Investments 3,444,530 3,510,824 2,545,189
12‐Receivables 4,069,888 4,011,115 3,971,521
13‐Interfund Receivables 0 0 0
14‐Inventory 3,598 3,300 1,795
16‐Prepaid/Deposits/Escrows 6,794 2,527 12,233
Total Assets 7,469,376 7,875,028 7,395,432
Liabilities
20‐ST Payables (15,782) (18,621) (106,071)
21‐Payroll Payables (98,922) (72,699) (50,213)
22‐Accruals (55,604) (55,604) (62,494)
23‐Interfund Payables 0 0 0
24‐Unearned Revenues (4,053,750) (3,975,186) (3,966,219)
25‐Escheats and Facility Deposits (15,686) (15,936) (8,787)
Total Liabilities (4,239,744) (4,138,046) (4,193,784)
30‐Fund Balance (3,229,632) (3,736,982) (3,201,649)
Liabilities and Fund Balance (7,469,376) (7,875,028) (7,395,432)
Page 7 of 26
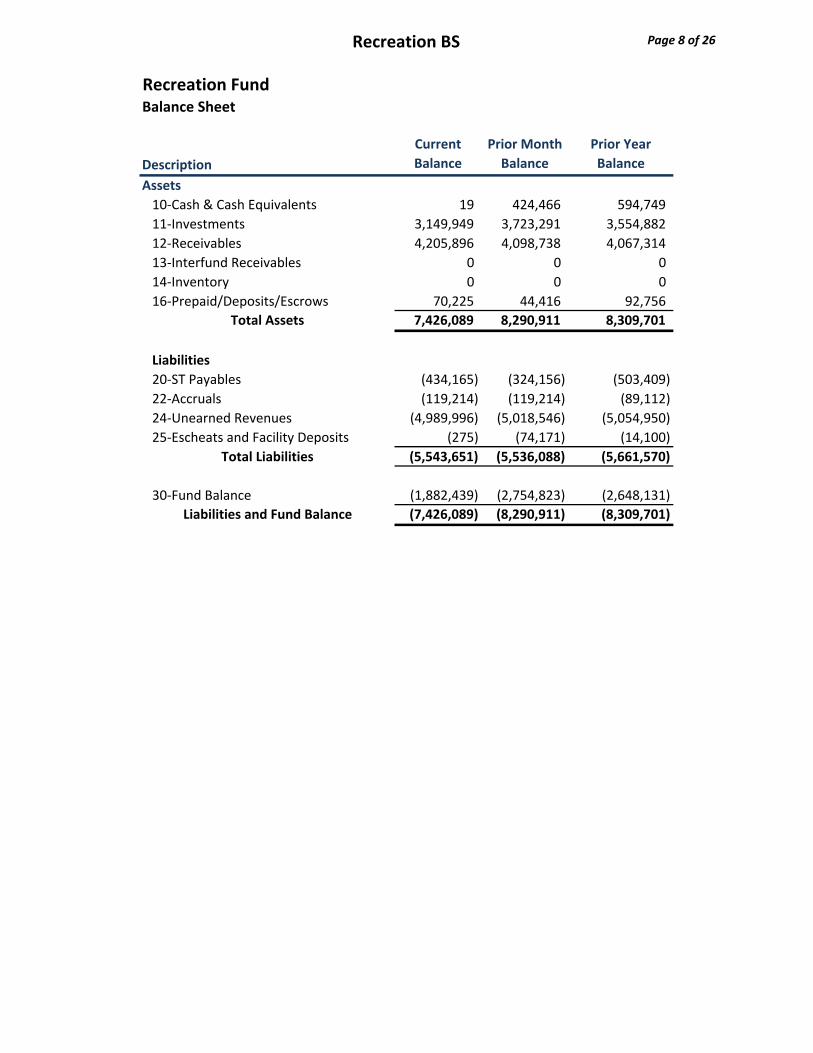
Recreation BS
Recreation FundBalance Sheet
Description
Current
Balance
Prior Month
Balance
Prior Year
Balance
Assets
10‐Cash & Cash Equivalents 19 424,466 594,749
11‐Investments 3,149,949 3,723,291 3,554,882
12‐Receivables 4,205,896 4,098,738 4,067,314
13‐Interfund Receivables 0 0 0
14‐Inventory 0 0 0
16‐Prepaid/Deposits/Escrows 70,225 44,416 92,756
Total Assets 7,426,089 8,290,911 8,309,701
Liabilities
20‐ST Payables (434,165) (324,156) (503,409)
22‐Accruals (119,214) (119,214) (89,112)
24‐Unearned Revenues (4,989,996) (5,018,546) (5,054,950)
25‐Escheats and Facility Deposits (275) (74,171) (14,100)
Total Liabilities (5,543,651) (5,536,088) (5,661,570)
30‐Fund Balance (1,882,439) (2,754,823) (2,648,131)
Liabilities and Fund Balance (7,426,089) (8,290,911) (8,309,701)
Page 8 of 26
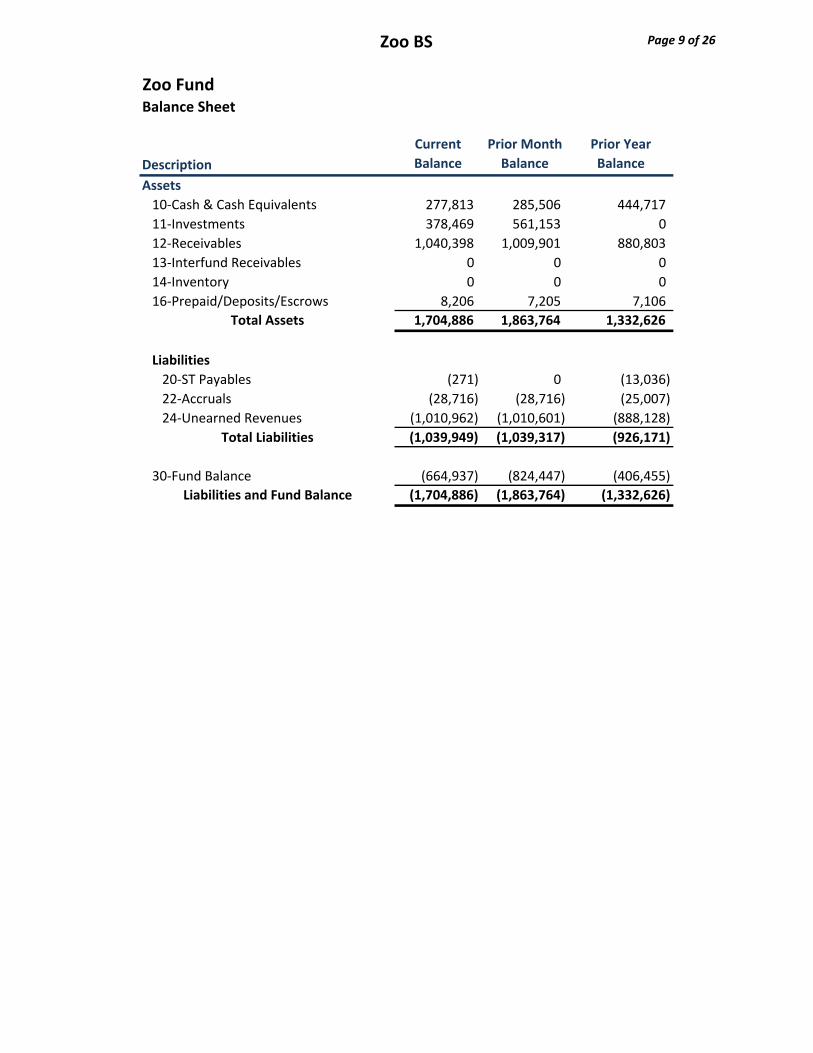
Zoo BS
Zoo FundBalance Sheet
Description
Current
Balance
Prior Month
Balance
Prior Year
Balance
Assets
10‐Cash & Cash Equivalents 277,813 285,506 444,717
11‐Investments 378,469 561,153 0
12‐Receivables 1,040,398 1,009,901 880,803
13‐Interfund Receivables 0 0 0
14‐Inventory 0 0 0
16‐Prepaid/Deposits/Escrows 8,206 7,205 7,106
Total Assets 1,704,886 1,863,764 1,332,626
Liabilities
20‐ST Payables (271) 0 (13,036)
22‐Accruals (28,716) (28,716) (25,007)
24‐Unearned Revenues (1,010,962) (1,010,601) (888,128)
Total Liabilities (1,039,949) (1,039,317) (926,171)
30‐Fund Balance (664,937) (824,447) (406,455)
Liabilities and Fund Balance (1,704,886) (1,863,764) (1,332,626)
Page 9 of 26
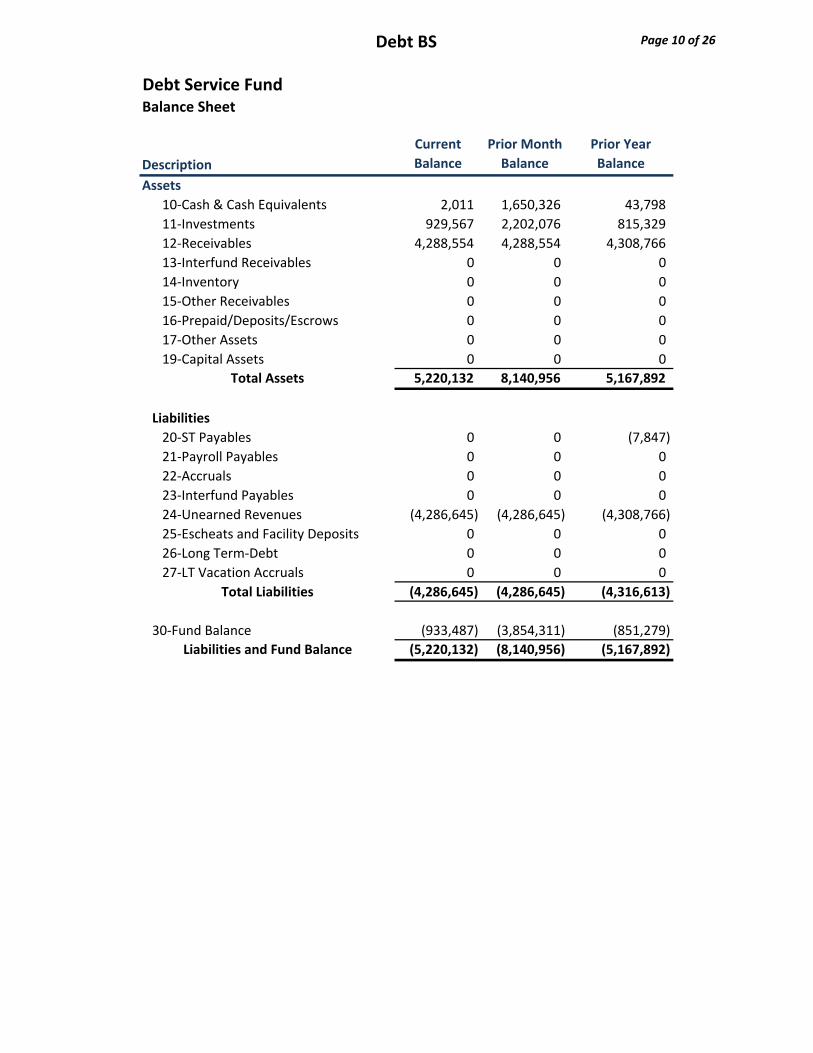
Debt BS
Debt Service FundBalance Sheet
Description
Current
Balance
Prior Month
Balance
Prior Year
Balance
Assets
10‐Cash & Cash Equivalents 2,011 1,650,326 43,798
11‐Investments 929,567 2,202,076 815,329
12‐Receivables 4,288,554 4,288,554 4,308,766
13‐Interfund Receivables 0 0 0
14‐Inventory 0 0 0
15‐Other Receivables 0 0 0
16‐Prepaid/Deposits/Escrows 0 0 0
17‐Other Assets 0 0 0
19‐Capital Assets 0 0 0
Total Assets 5,220,132 8,140,956 5,167,892
Liabilities
20‐ST Payables 0 0 (7,847)
21‐Payroll Payables 0 0 0
22‐Accruals 0 0 0
23‐Interfund Payables 0 0 0
24‐Unearned Revenues (4,286,645) (4,286,645) (4,308,766)
25‐Escheats and Facility Deposits 0 0 0
26‐Long Term‐Debt 0 0 0
27‐LT Vacation Accruals 0 0 0
Total Liabilities (4,286,645) (4,286,645) (4,316,613)
30‐Fund Balance (933,487) (3,854,311) (851,279)
Liabilities and Fund Balance (5,220,132) (8,140,956) (5,167,892)
Page 10 of 26
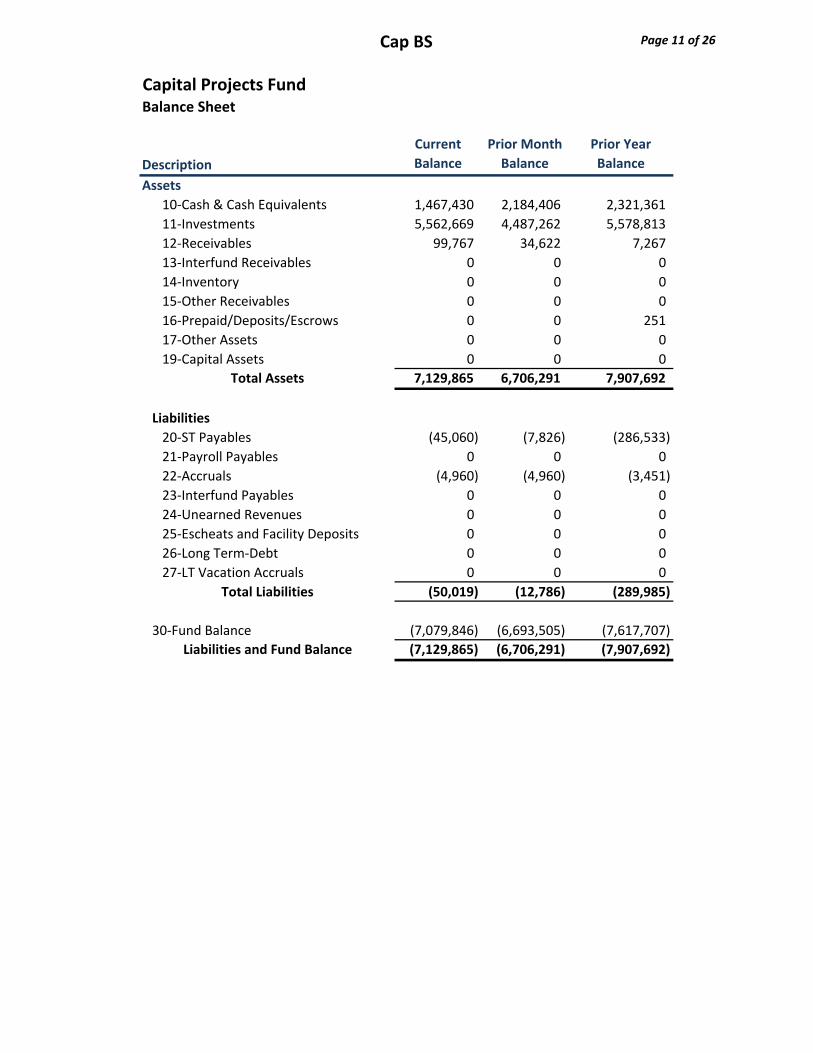
Cap BS
Capital Projects FundBalance Sheet
Description
Current
Balance
Prior Month
Balance
Prior Year
Balance
Assets
10‐Cash & Cash Equivalents 1,467,430 2,184,406 2,321,361
11‐Investments 5,562,669 4,487,262 5,578,813
12‐Receivables 99,767 34,622 7,267
13‐Interfund Receivables 0 0 0
14‐Inventory 0 0 0
15‐Other Receivables 0 0 0
16‐Prepaid/Deposits/Escrows 0 0 251
17‐Other Assets 0 0 0
19‐Capital Assets 0 0 0
Total Assets 7,129,865 6,706,291 7,907,692
Liabilities
20‐ST Payables (45,060) (7,826) (286,533)
21‐Payroll Payables 0 0 0
22‐Accruals (4,960) (4,960) (3,451)
23‐Interfund Payables 0 0 0
24‐Unearned Revenues 0 0 0
25‐Escheats and Facility Deposits 0 0 0
26‐Long Term‐Debt 0 0 0
27‐LT Vacation Accruals 0 0 0
Total Liabilities (50,019) (12,786) (289,985)
30‐Fund Balance (7,079,846) (6,693,505) (7,617,707)
Liabilities and Fund Balance (7,129,865) (6,706,291) (7,907,692)
Page 11 of 26
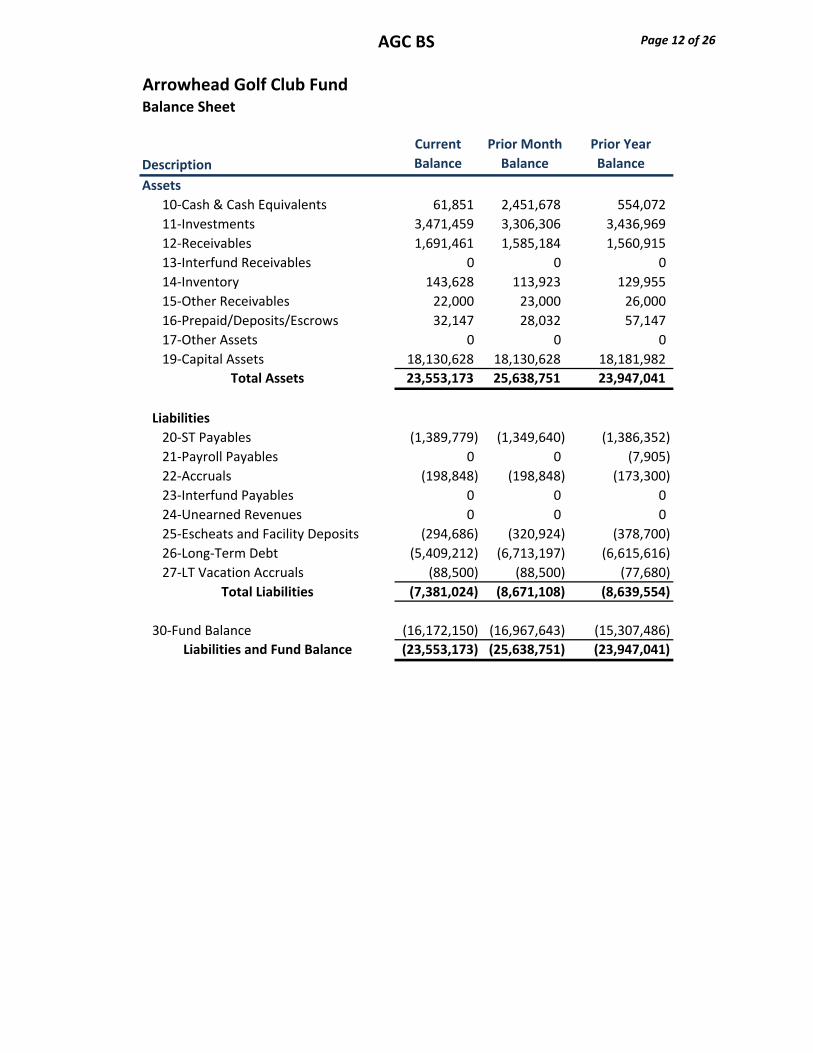
AGC BS
Arrowhead Golf Club FundBalance Sheet
Description
Current
Balance
Prior Month
Balance
Prior Year
Balance
Assets
10‐Cash & Cash Equivalents 61,851 2,451,678 554,072
11‐Investments 3,471,459 3,306,306 3,436,969
12‐Receivables 1,691,461 1,585,184 1,560,915
13‐Interfund Receivables 0 0 0
14‐Inventory 143,628 113,923 129,955
15‐Other Receivables 22,000 23,000 26,000
16‐Prepaid/Deposits/Escrows 32,147 28,032 57,147
17‐Other Assets 0 0 0
19‐Capital Assets 18,130,628 18,130,628 18,181,982
Total Assets 23,553,173 25,638,751 23,947,041
Liabilities
20‐ST Payables (1,389,779) (1,349,640) (1,386,352)
21‐Payroll Payables 0 0 (7,905)
22‐Accruals (198,848) (198,848) (173,300)
23‐Interfund Payables 0 0 0
24‐Unearned Revenues 0 0 0
25‐Escheats and Facility Deposits (294,686) (320,924) (378,700)
26‐Long‐Term Debt (5,409,212) (6,713,197) (6,615,616)
27‐LT Vacation Accruals (88,500) (88,500) (77,680)
Total Liabilities (7,381,024) (8,671,108) (8,639,554)
30‐Fund Balance (16,172,150) (16,967,643) (15,307,486)
Liabilities and Fund Balance (23,553,173) (25,638,751) (23,947,041)
Page 12 of 26
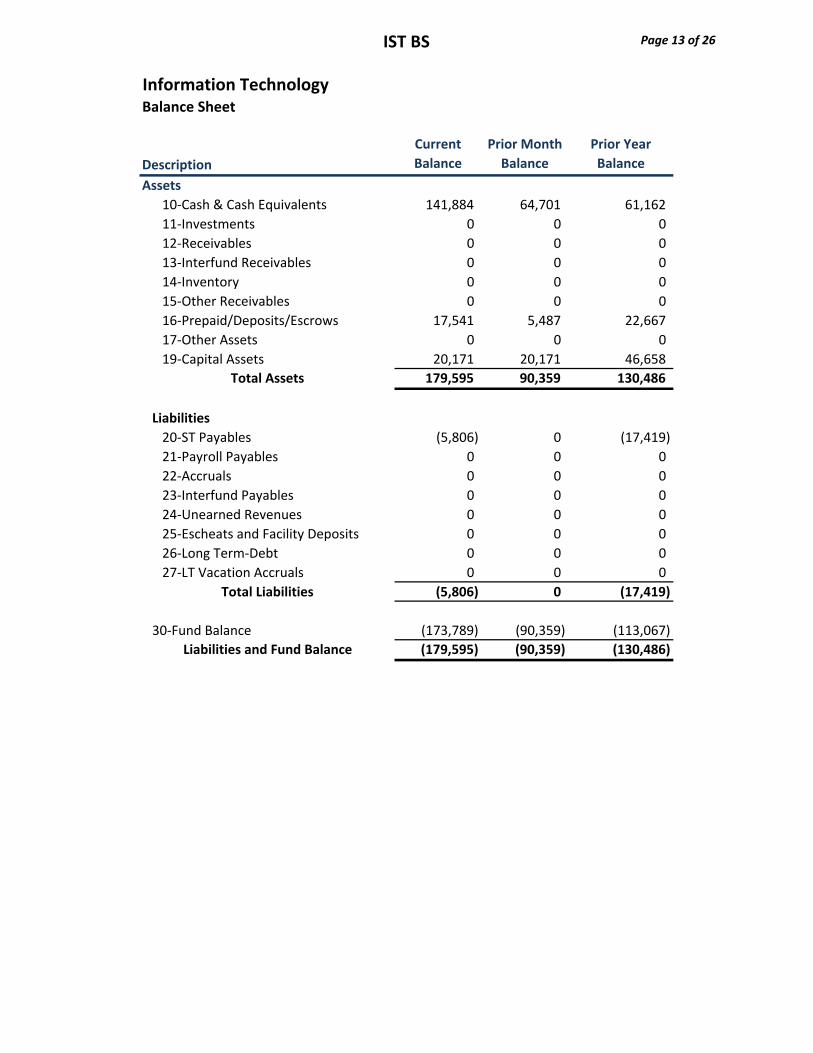
IST BS
Information TechnologyBalance Sheet
Description
Current
Balance
Prior Month
Balance
Prior Year
Balance
Assets
10‐Cash & Cash Equivalents 141,884 64,701 61,162
11‐Investments 0 0 0
12‐Receivables 0 0 0
13‐Interfund Receivables 0 0 0
14‐Inventory 0 0 0
15‐Other Receivables 0 0 0
16‐Prepaid/Deposits/Escrows 17,541 5,487 22,667
17‐Other Assets 0 0 0
19‐Capital Assets 20,171 20,171 46,658
Total Assets 179,595 90,359 130,486
Liabilities
20‐ST Payables (5,806) 0 (17,419)
21‐Payroll Payables 0 0 0
22‐Accruals 0 0 0
23‐Interfund Payables 0 0 0
24‐Unearned Revenues 0 0 0
25‐Escheats and Facility Deposits 0 0 0
26‐Long Term‐Debt 0 0 0
27‐LT Vacation Accruals 0 0 0
Total Liabilities (5,806) 0 (17,419)
30‐Fund Balance (173,789) (90,359) (113,067)
Liabilities and Fund Balance (179,595) (90,359) (130,486)
Page 13 of 26
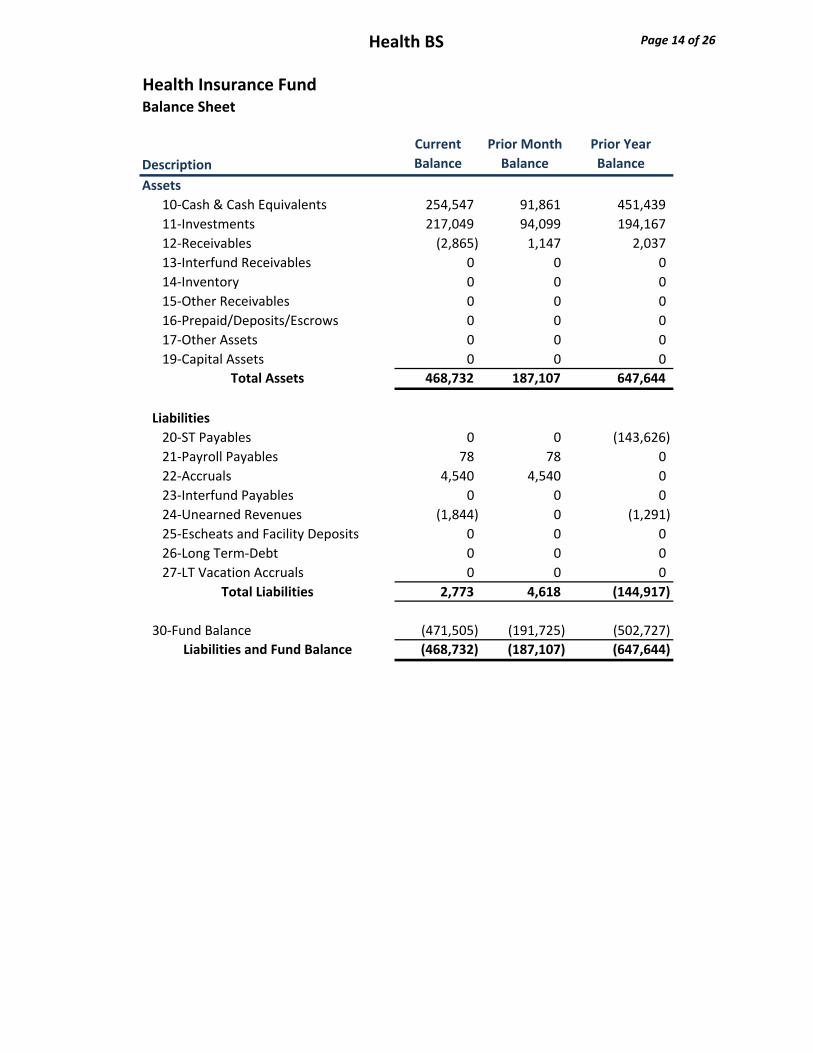
Health BS
Health Insurance FundBalance Sheet
Description
Current
Balance
Prior Month
Balance
Prior Year
Balance
Assets
10‐Cash & Cash Equivalents 254,547 91,861 451,439
11‐Investments 217,049 94,099 194,167
12‐Receivables (2,865) 1,147 2,037
13‐Interfund Receivables 0 0 0
14‐Inventory 0 0 0
15‐Other Receivables 0 0 0
16‐Prepaid/Deposits/Escrows 0 0 0
17‐Other Assets 0 0 0
19‐Capital Assets 0 0 0
Total Assets 468,732 187,107 647,644
Liabilities
20‐ST Payables 0 0 (143,626)
21‐Payroll Payables 78 78 0
22‐Accruals 4,540 4,540 0
23‐Interfund Payables 0 0 0
24‐Unearned Revenues (1,844) 0 (1,291)
25‐Escheats and Facility Deposits 0 0 0
26‐Long Term‐Debt 0 0 0
27‐LT Vacation Accruals 0 0 0
Total Liabilities 2,773 4,618 (144,917)
30‐Fund Balance (471,505) (191,725) (502,727)
Liabilities and Fund Balance (468,732) (187,107) (647,644)
Page 14 of 26
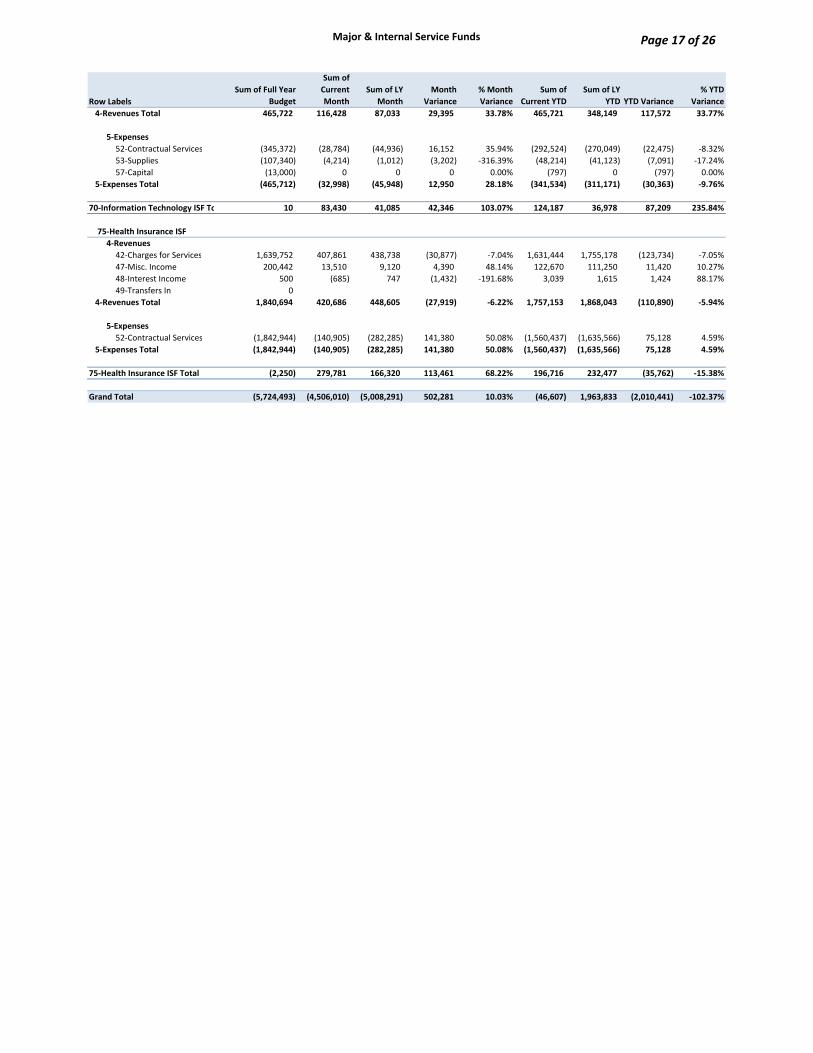
Major & Internal Service Funds
Row Labels
Sum of Full Year
Budget
Sum of
Current
Month
Sum of LY
Month
Month
Variance
% Month
Variance
Sum of
Current YTD
Sum of LY
YTD YTD Variance
% YTD
Variance
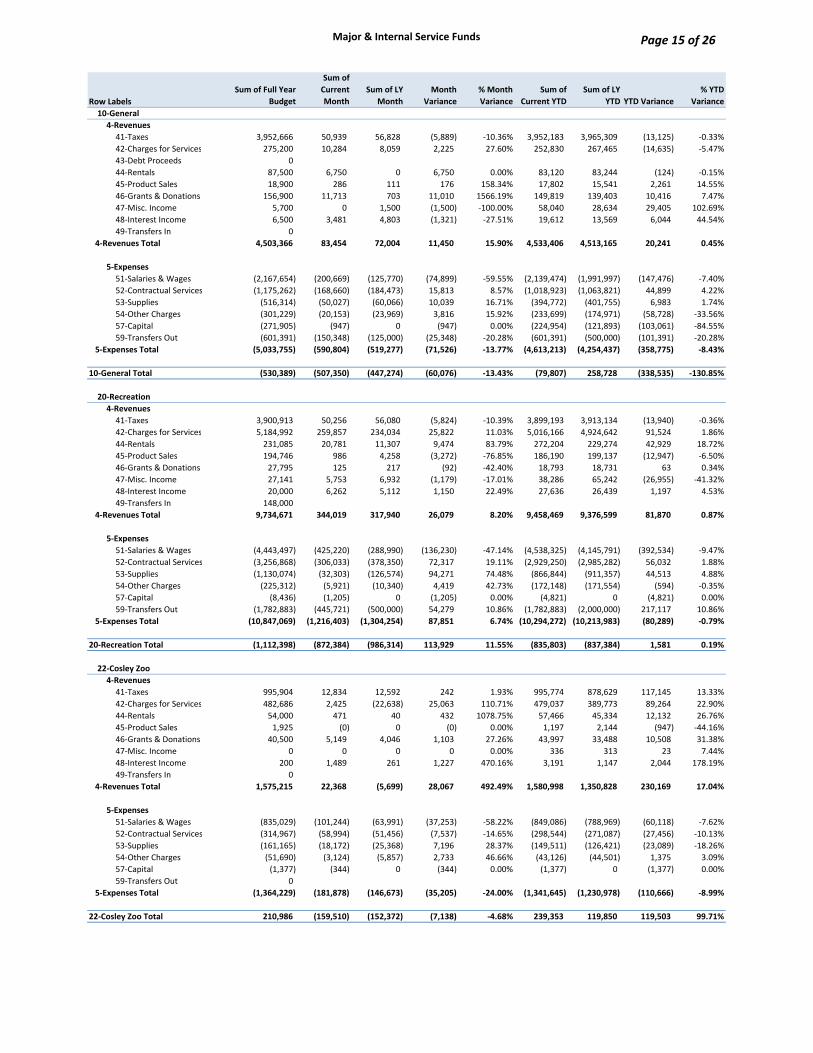
10‐General
4‐Revenues
41‐Taxes 3,952,666 50,939 56,828 (5,889) ‐10.36% 3,952,183 3,965,309 (13,125) ‐0.33%
42‐Charges for Services 275,200 10,284 8,059 2,225 27.60% 252,830 267,465 (14,635) ‐5.47%
43‐Debt Proceeds 0
44‐Rentals 87,500 6,750 0 6,750 0.00% 83,120 83,244 (124) ‐0.15%
45‐Product Sales 18,900 286 111 176 158.34% 17,802 15,541 2,261 14.55%
46‐Grants & Donations 156,900 11,713 703 11,010 1566.19% 149,819 139,403 10,416 7.47%
47‐Misc. Income 5,700 0 1,500 (1,500) ‐100.00% 58,040 28,634 29,405 102.69%
48‐Interest Income 6,500 3,481 4,803 (1,321) ‐27.51% 19,612 13,569 6,044 44.54%
49‐Transfers In 0
4‐Revenues Total 4,503,366 83,454 72,004 11,450 15.90% 4,533,406 4,513,165 20,241 0.45%
5‐Expenses
51‐Salaries & Wages (2,167,654) (200,669) (125,770) (74,899) ‐59.55% (2,139,474) (1,991,997) (147,476) ‐7.40%
52‐Contractual Services (1,175,262) (168,660) (184,473) 15,813 8.57% (1,018,923) (1,063,821) 44,899 4.22%
53‐Supplies (516,314) (50,027) (60,066) 10,039 16.71% (394,772) (401,755) 6,983 1.74%
54‐Other Charges (301,229) (20,153) (23,969) 3,816 15.92% (233,699) (174,971) (58,728) ‐33.56%
57‐Capital (271,905) (947) 0 (947) 0.00% (224,954) (121,893) (103,061) ‐84.55%
59‐Transfers Out (601,391) (150,348) (125,000) (25,348) ‐20.28% (601,391) (500,000) (101,391) ‐20.28%
5‐Expenses Total (5,033,755) (590,804) (519,277) (71,526) ‐13.77% (4,613,213) (4,254,437) (358,775) ‐8.43%
10‐General Total (530,389) (507,350) (447,274) (60,076) ‐13.43% (79,807) 258,728 (338,535) ‐130.85%
20‐Recreation
4‐Revenues
41‐Taxes 3,900,913 50,256 56,080 (5,824) ‐10.39% 3,899,193 3,913,134 (13,940) ‐0.36%
42‐Charges for Services 5,184,992 259,857 234,034 25,822 11.03% 5,016,166 4,924,642 91,524 1.86%
44‐Rentals 231,085 20,781 11,307 9,474 83.79% 272,204 229,274 42,929 18.72%
45‐Product Sales 194,746 986 4,258 (3,272) ‐76.85% 186,190 199,137 (12,947) ‐6.50%
46‐Grants & Donations 27,795 125 217 (92) ‐42.40% 18,793 18,731 63 0.34%
47‐Misc. Income 27,141 5,753 6,932 (1,179) ‐17.01% 38,286 65,242 (26,955) ‐41.32%
48‐Interest Income 20,000 6,262 5,112 1,150 22.49% 27,636 26,439 1,197 4.53%
49‐Transfers In 148,000
4‐Revenues Total 9,734,671 344,019 317,940 26,079 8.20% 9,458,469 9,376,599 81,870 0.87%
5‐Expenses
51‐Salaries & Wages (4,443,497) (425,220) (288,990) (136,230) ‐47.14% (4,538,325) (4,145,791) (392,534) ‐9.47%
52‐Contractual Services (3,256,868) (306,033) (378,350) 72,317 19.11% (2,929,250) (2,985,282) 56,032 1.88%
53‐Supplies (1,130,074) (32,303) (126,574) 94,271 74.48% (866,844) (911,357) 44,513 4.88%
54‐Other Charges (225,312) (5,921) (10,340) 4,419 42.73% (172,148) (171,554) (594) ‐0.35%
57‐Capital (8,436) (1,205) 0 (1,205) 0.00% (4,821) 0 (4,821) 0.00%
59‐Transfers Out (1,782,883) (445,721) (500,000) 54,279 10.86% (1,782,883) (2,000,000) 217,117 10.86%
5‐Expenses Total (10,847,069) (1,216,403) (1,304,254) 87,851 6.74% (10,294,272) (10,213,983) (80,289) ‐0.79%
20‐Recreation Total (1,112,398) (872,384) (986,314) 113,929 11.55% (835,803) (837,384) 1,581 0.19%
22‐Cosley Zoo
4‐Revenues
41‐Taxes 995,904 12,834 12,592 242 1.93% 995,774 878,629 117,145 13.33%
42‐Charges for Services 482,686 2,425 (22,638) 25,063 110.71% 479,037 389,773 89,264 22.90%
44‐Rentals 54,000 471 40 432 1078.75% 57,466 45,334 12,132 26.76%
45‐Product Sales 1,925 (0) 0 (0) 0.00% 1,197 2,144 (947) ‐44.16%
46‐Grants & Donations 40,500 5,149 4,046 1,103 27.26% 43,997 33,488 10,508 31.38%
47‐Misc. Income 0 0 0 0 0.00% 336 313 23 7.44%
48‐Interest Income 200 1,489 261 1,227 470.16% 3,191 1,147 2,044 178.19%
49‐Transfers In 0
4‐Revenues Total 1,575,215 22,368 (5,699) 28,067 492.49% 1,580,998 1,350,828 230,169 17.04%
5‐Expenses
51‐Salaries & Wages (835,029) (101,244) (63,991) (37,253) ‐58.22% (849,086) (788,969) (60,118) ‐7.62%
52‐Contractual Services (314,967) (58,994) (51,456) (7,537) ‐14.65% (298,544) (271,087) (27,456) ‐10.13%
53‐Supplies (161,165) (18,172) (25,368) 7,196 28.37% (149,511) (126,421) (23,089) ‐18.26%
54‐Other Charges (51,690) (3,124) (5,857) 2,733 46.66% (43,126) (44,501) 1,375 3.09%
57‐Capital (1,377) (344) 0 (344) 0.00% (1,377) 0 (1,377) 0.00%
59‐Transfers Out 0
5‐Expenses Total (1,364,229) (181,878) (146,673) (35,205) ‐24.00% (1,341,645) (1,230,978) (110,666) ‐8.99%
22‐Cosley Zoo Total 210,986 (159,510) (152,372) (7,138) ‐4.68% 239,353 119,850 119,503 99.71%
Page 15 of 26
Major & Internal Service Funds
Row Labels
Sum of Full Year
Budget
Sum of
Current
Month
Sum of LY
Month
Month
Variance
% Month
Variance
Sum of
Current YTD
Sum of LY
YTD YTD Variance
% YTD
Variance
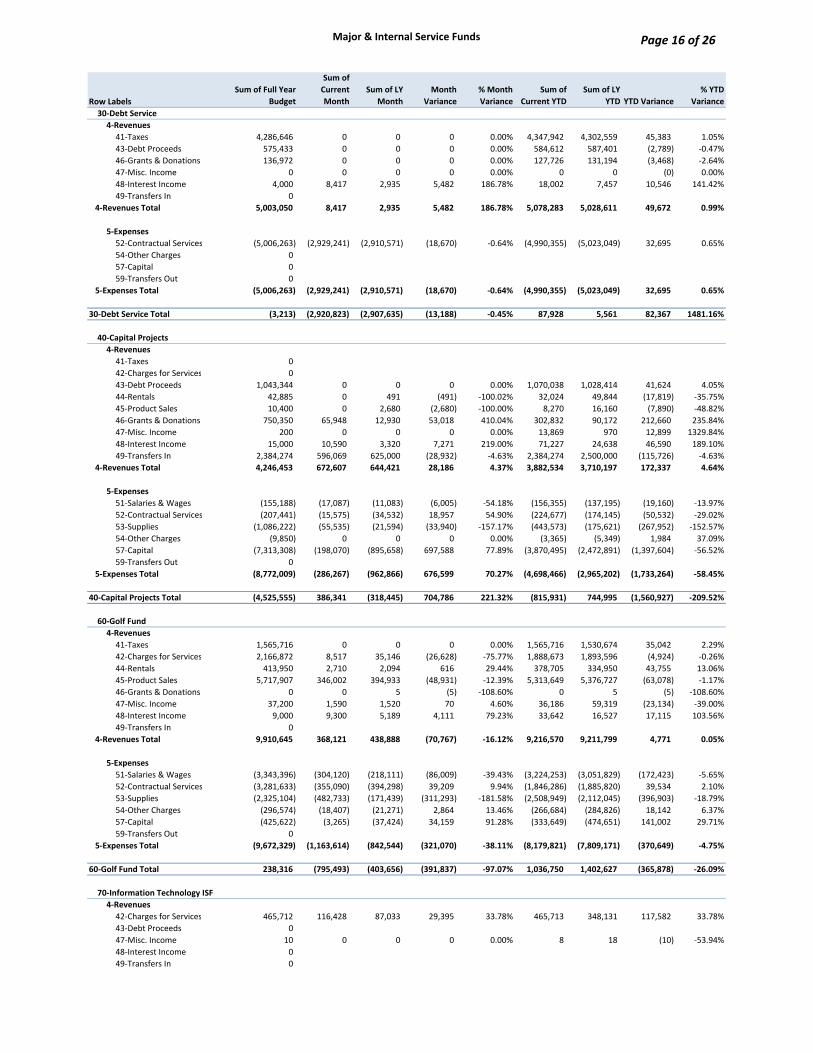
30‐Debt Service
4‐Revenues
41‐Taxes 4,286,646 0 0 0 0.00% 4,347,942 4,302,559 45,383 1.05%
43‐Debt Proceeds 575,433 0 0 0 0.00% 584,612 587,401 (2,789) ‐0.47%
46‐Grants & Donations 136,972 0 0 0 0.00% 127,726 131,194 (3,468) ‐2.64%
47‐Misc. Income 0 0 0 0 0.00% 0 0 (0) 0.00%
48‐Interest Income 4,000 8,417 2,935 5,482 186.78% 18,002 7,457 10,546 141.42%
49‐Transfers In 0
4‐Revenues Total 5,003,050 8,417 2,935 5,482 186.78% 5,078,283 5,028,611 49,672 0.99%
5‐Expenses
52‐Contractual Services (5,006,263) (2,929,241) (2,910,571) (18,670) ‐0.64% (4,990,355) (5,023,049) 32,695 0.65%
54‐Other Charges 0
57‐Capital 0
59‐Transfers Out 0
5‐Expenses Total (5,006,263) (2,929,241) (2,910,571) (18,670) ‐0.64% (4,990,355) (5,023,049) 32,695 0.65%
30‐Debt Service Total (3,213) (2,920,823) (2,907,635) (13,188) ‐0.45% 87,928 5,561 82,367 1481.16%
40‐Capital Projects
4‐Revenues
41‐Taxes 0
42‐Charges for Services 0
43‐Debt Proceeds 1,043,344 0 0 0 0.00% 1,070,038 1,028,414 41,624 4.05%
44‐Rentals 42,885 0 491 (491) ‐100.02% 32,024 49,844 (17,819) ‐35.75%
45‐Product Sales 10,400 0 2,680 (2,680) ‐100.00% 8,270 16,160 (7,890) ‐48.82%
46‐Grants & Donations 750,350 65,948 12,930 53,018 410.04% 302,832 90,172 212,660 235.84%
47‐Misc. Income 200 0 0 0 0.00% 13,869 970 12,899 1329.84%
48‐Interest Income 15,000 10,590 3,320 7,271 219.00% 71,227 24,638 46,590 189.10%
49‐Transfers In 2,384,274 596,069 625,000 (28,932) ‐4.63% 2,384,274 2,500,000 (115,726) ‐4.63%
4‐Revenues Total 4,246,453 672,607 644,421 28,186 4.37% 3,882,534 3,710,197 172,337 4.64%
5‐Expenses
51‐Salaries & Wages (155,188) (17,087) (11,083) (6,005) ‐54.18% (156,355) (137,195) (19,160) ‐13.97%
52‐Contractual Services (207,441) (15,575) (34,532) 18,957 54.90% (224,677) (174,145) (50,532) ‐29.02%
53‐Supplies (1,086,222) (55,535) (21,594) (33,940) ‐157.17% (443,573) (175,621) (267,952) ‐152.57%
54‐Other Charges (9,850) 0 0 0 0.00% (3,365) (5,349) 1,984 37.09%
57‐Capital (7,313,308) (198,070) (895,658) 697,588 77.89% (3,870,495) (2,472,891) (1,397,604) ‐56.52%
59‐Transfers Out 0
5‐Expenses Total (8,772,009) (286,267) (962,866) 676,599 70.27% (4,698,466) (2,965,202) (1,733,264) ‐58.45%
40‐Capital Projects Total (4,525,555) 386,341 (318,445) 704,786 221.32% (815,931) 744,995 (1,560,927) ‐209.52%
60‐Golf Fund
4‐Revenues
41‐Taxes 1,565,716 0 0 0 0.00% 1,565,716 1,530,674 35,042 2.29%
42‐Charges for Services 2,166,872 8,517 35,146 (26,628) ‐75.77% 1,888,673 1,893,596 (4,924) ‐0.26%
44‐Rentals 413,950 2,710 2,094 616 29.44% 378,705 334,950 43,755 13.06%
45‐Product Sales 5,717,907 346,002 394,933 (48,931) ‐12.39% 5,313,649 5,376,727 (63,078) ‐1.17%
46‐Grants & Donations 0 0 5 (5) ‐108.60% 0 5 (5) ‐108.60%
47‐Misc. Income 37,200 1,590 1,520 70 4.60% 36,186 59,319 (23,134) ‐39.00%
48‐Interest Income 9,000 9,300 5,189 4,111 79.23% 33,642 16,527 17,115 103.56%
49‐Transfers In 0
4‐Revenues Total 9,910,645 368,121 438,888 (70,767) ‐16.12% 9,216,570 9,211,799 4,771 0.05%
5‐Expenses
51‐Salaries & Wages (3,343,396) (304,120) (218,111) (86,009) ‐39.43% (3,224,253) (3,051,829) (172,423) ‐5.65%
52‐Contractual Services (3,281,633) (355,090) (394,298) 39,209 9.94% (1,846,286) (1,885,820) 39,534 2.10%
53‐Supplies (2,325,104) (482,733) (171,439) (311,293) ‐181.58% (2,508,949) (2,112,045) (396,903) ‐18.79%
54‐Other Charges (296,574) (18,407) (21,271) 2,864 13.46% (266,684) (284,826) 18,142 6.37%
57‐Capital (425,622) (3,265) (37,424) 34,159 91.28% (333,649) (474,651) 141,002 29.71%
59‐Transfers Out 0
5‐Expenses Total (9,672,329) (1,163,614) (842,544) (321,070) ‐38.11% (8,179,821) (7,809,171) (370,649) ‐4.75%
60‐Golf Fund Total 238,316 (795,493) (403,656) (391,837) ‐97.07% 1,036,750 1,402,627 (365,878) ‐26.09%
70‐Information Technology ISF
4‐Revenues
42‐Charges for Services 465,712 116,428 87,033 29,395 33.78% 465,713 348,131 117,582 33.78%
43‐Debt Proceeds 0
47‐Misc. Income 10 0 0 0 0.00% 8 18 (10) ‐53.94%
48‐Interest Income 0
49‐Transfers In 0
Page 16 of 26
Major & Internal Service Funds
Row Labels
Sum of Full Year
Budget
Sum of
Current
Month
Sum of LY
Month
Month
Variance
% Month
Variance
Sum of
Current YTD
Sum of LY
YTD YTD Variance
% YTD
Variance
4‐Revenues Total 465,722 116,428 87,033 29,395 33.78% 465,721 348,149 117,572 33.77%
5‐Expenses
52‐Contractual Services (345,372) (28,784) (44,936) 16,152 35.94% (292,524) (270,049) (22,475) ‐8.32%
53‐Supplies (107,340) (4,214) (1,012) (3,202) ‐316.39% (48,214) (41,123) (7,091) ‐17.24%
57‐Capital (13,000) 0 0 0 0.00% (797) 0 (797) 0.00%
5‐Expenses Total (465,712) (32,998) (45,948) 12,950 28.18% (341,534) (311,171) (30,363) ‐9.76%
70‐Information Technology ISF To 10 83,430 41,085 42,346 103.07% 124,187 36,978 87,209 235.84%
75‐Health Insurance ISF
4‐Revenues
42‐Charges for Services 1,639,752 407,861 438,738 (30,877) ‐7.04% 1,631,444 1,755,178 (123,734) ‐7.05%
47‐Misc. Income 200,442 13,510 9,120 4,390 48.14% 122,670 111,250 11,420 10.27%
48‐Interest Income 500 (685) 747 (1,432) ‐191.68% 3,039 1,615 1,424 88.17%
49‐Transfers In 0
4‐Revenues Total 1,840,694 420,686 448,605 (27,919) ‐6.22% 1,757,153 1,868,043 (110,890) ‐5.94%
5‐Expenses
52‐Contractual Services (1,842,944) (140,905) (282,285) 141,380 50.08% (1,560,437) (1,635,566) 75,128 4.59%
5‐Expenses Total (1,842,944) (140,905) (282,285) 141,380 50.08% (1,560,437) (1,635,566) 75,128 4.59%
75‐Health Insurance ISF Total (2,250) 279,781 166,320 113,461 68.22% 196,716 232,477 (35,762) ‐15.38%
Grand Total (5,724,493) (4,506,010) (5,008,291) 502,281 10.03% (46,607) 1,963,833 (2,010,441) ‐102.37%
Page 17 of 26
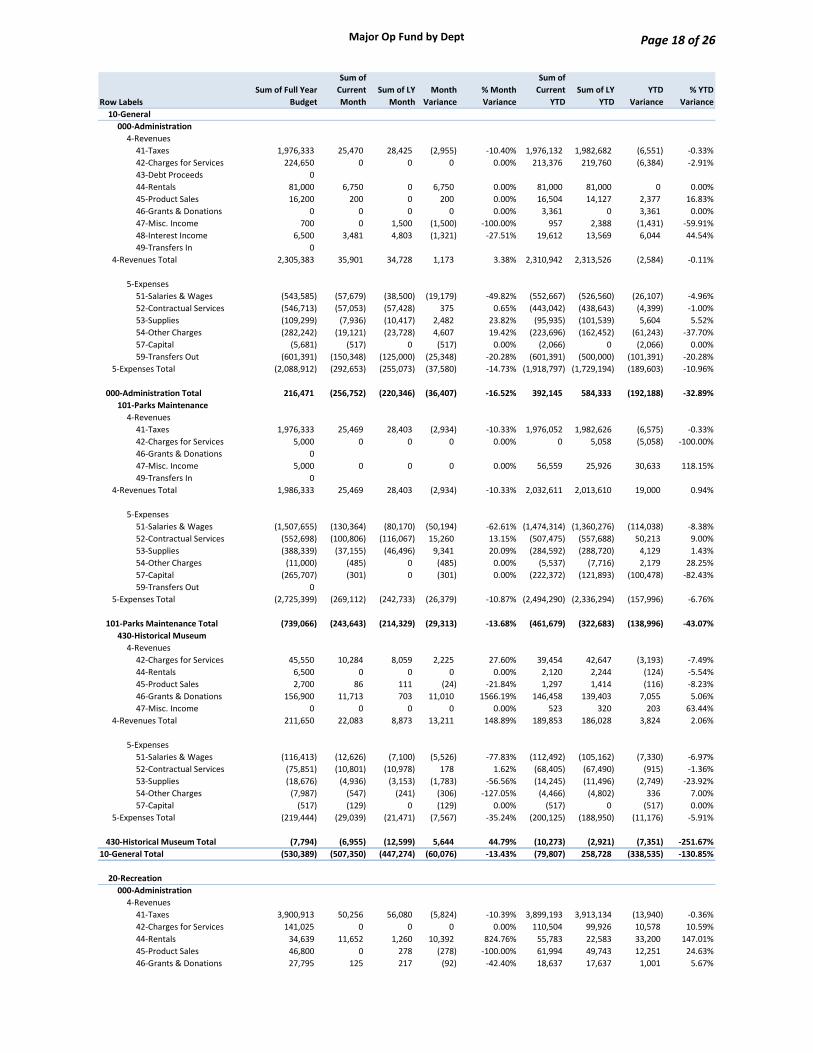
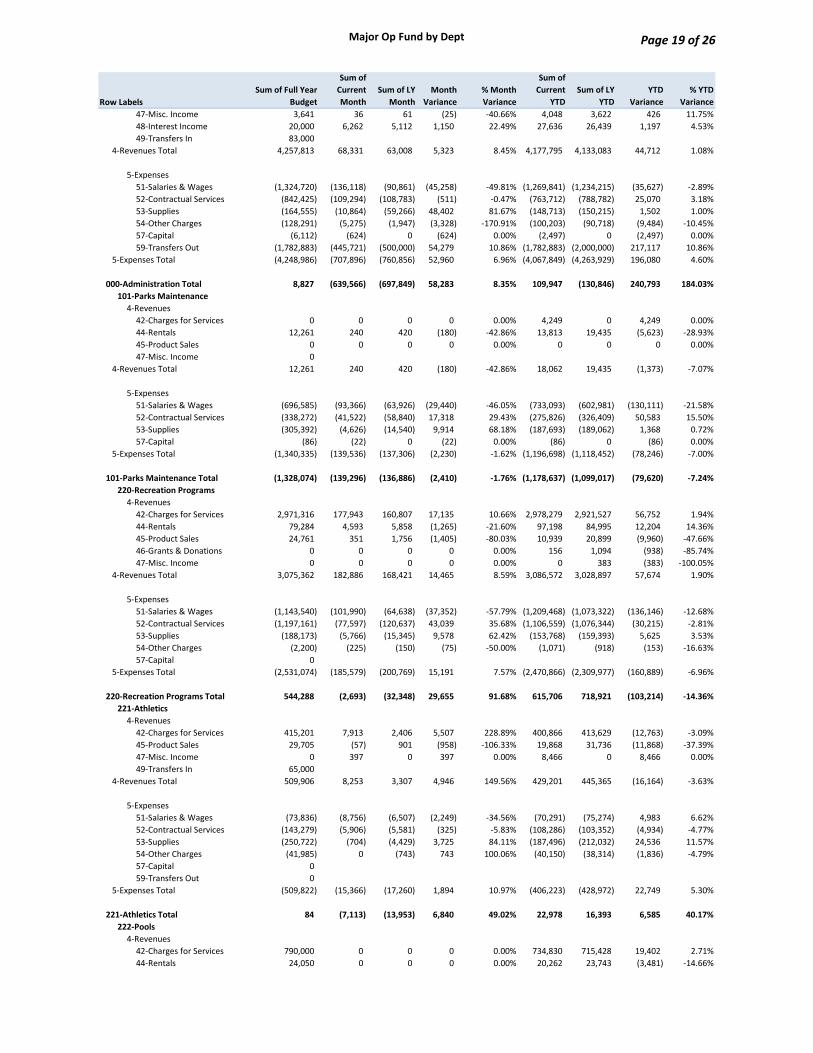
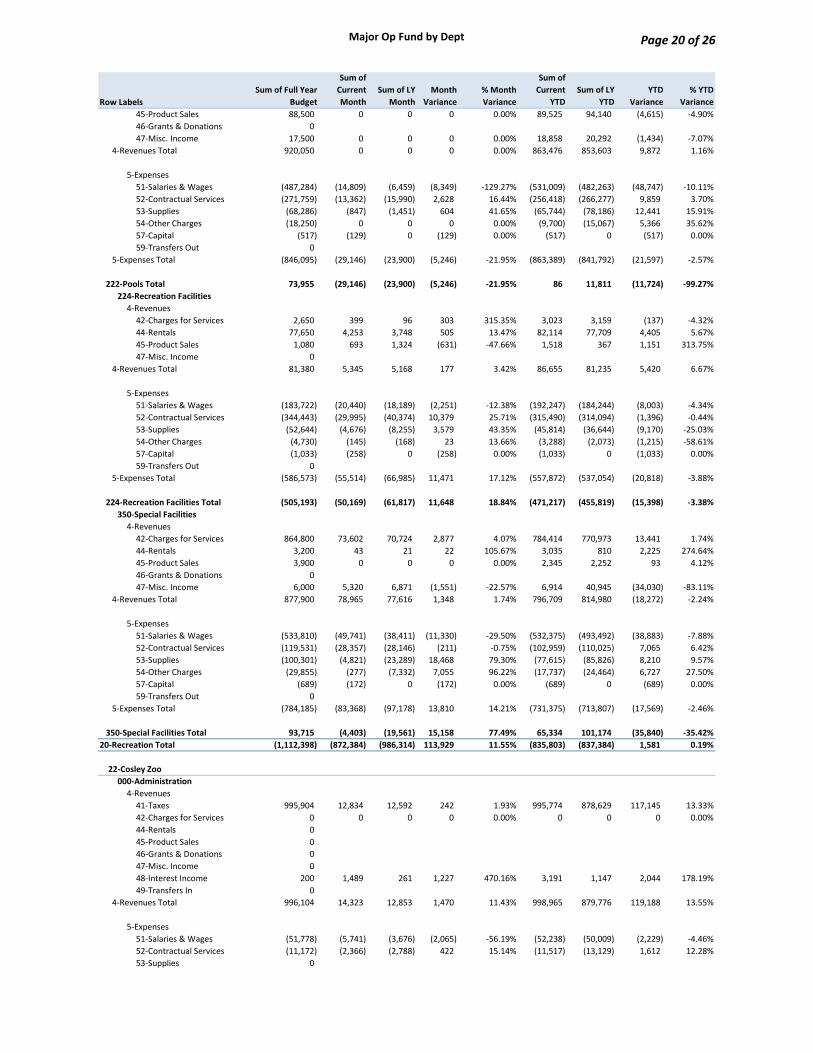
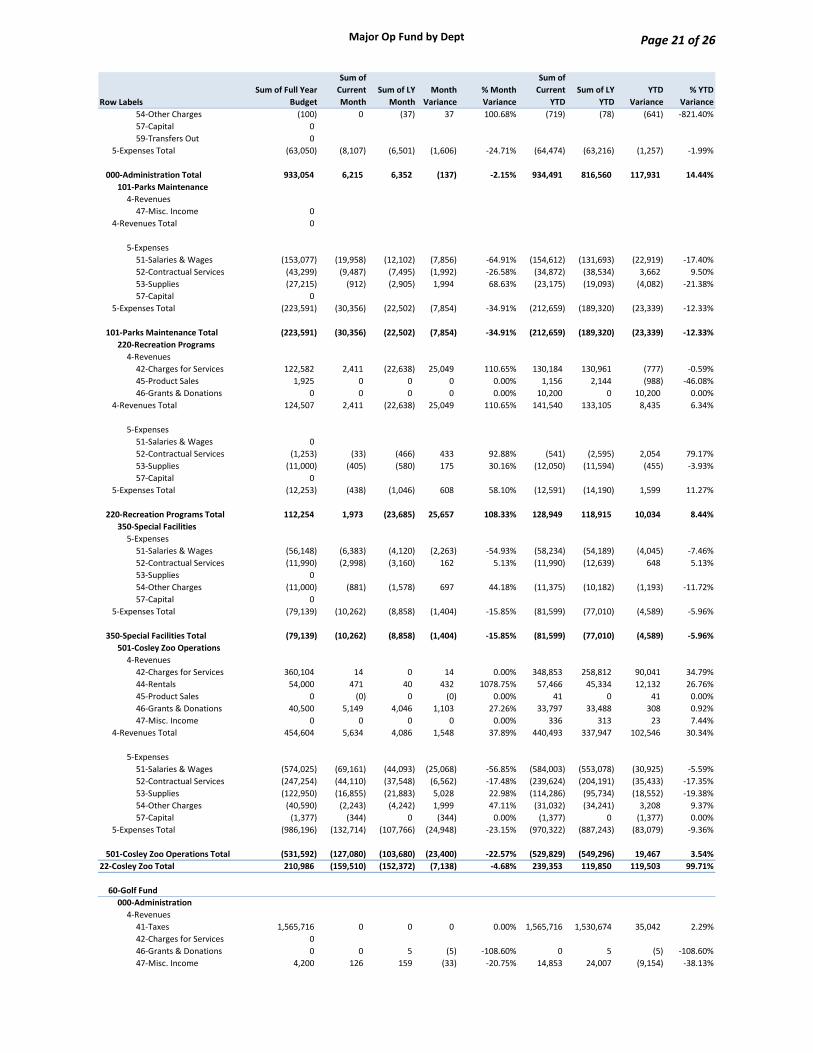
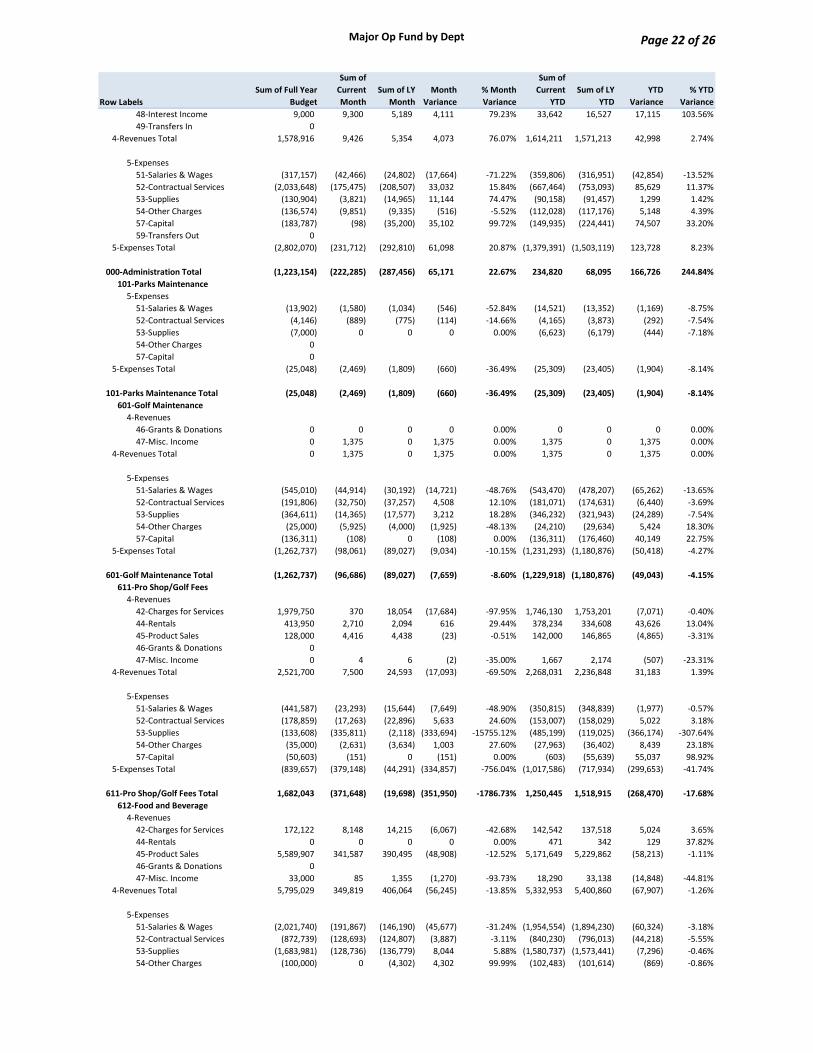
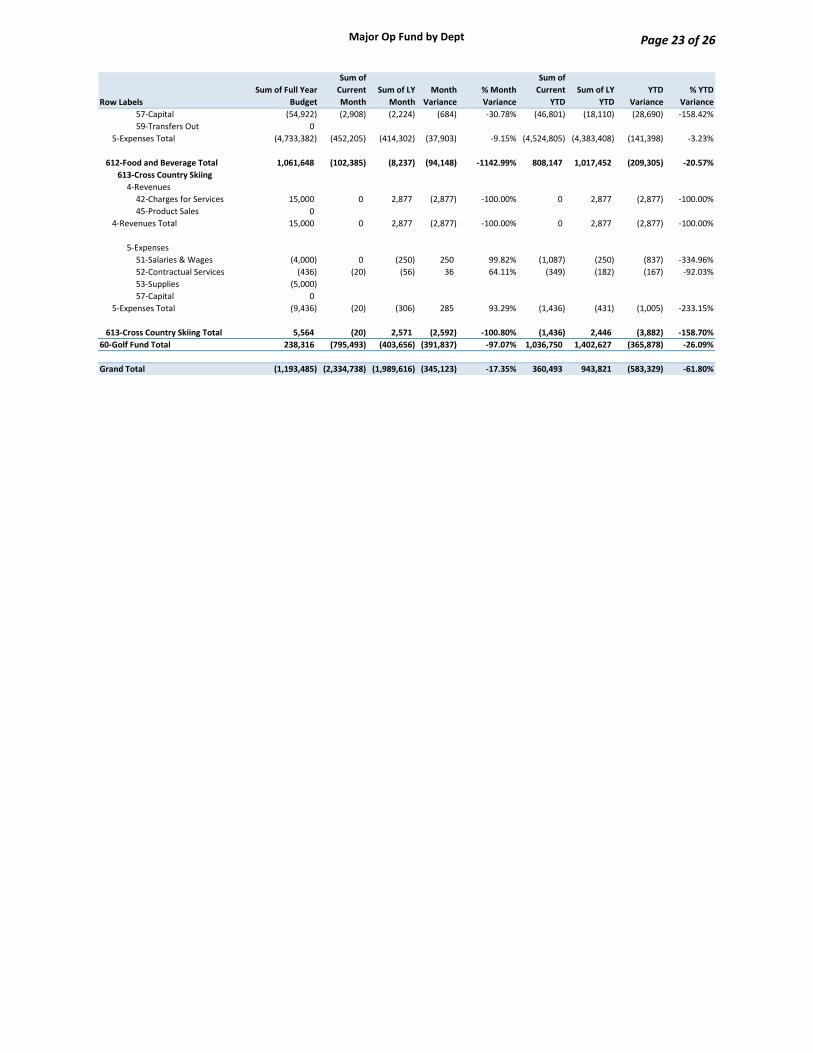
Major Op Fund by Dept
Row Labels
Sum of Full Year
Budget
Sum of
Current
Month
Sum of LY
Month
Month
Variance
% Month
Variance
Sum of
Current
YTD
Sum of LY
YTD
YTD
Variance
% YTD
Variance
10‐General
000‐Administration
4‐Revenues
41‐Taxes 1,976,333 25,470 28,425 (2,955) ‐10.40% 1,976,132 1,982,682 (6,551) ‐0.33%
42‐Charges for Services 224,650 0 0 0 0.00% 213,376 219,760 (6,384) ‐2.91%
43‐Debt Proceeds 0
44‐Rentals 81,000 6,750 0 6,750 0.00% 81,000 81,000 0 0.00%
45‐Product Sales 16,200 200 0 200 0.00% 16,504 14,127 2,377 16.83%
46‐Grants & Donations 0 0 0 0 0.00% 3,361 0 3,361 0.00%
47‐Misc. Income 700 0 1,500 (1,500) ‐100.00% 957 2,388 (1,431) ‐59.91%
48‐Interest Income 6,500 3,481 4,803 (1,321) ‐27.51% 19,612 13,569 6,044 44.54%
49‐Transfers In 0
4‐Revenues Total 2,305,383 35,901 34,728 1,173 3.38% 2,310,942 2,313,526 (2,584) ‐0.11%
5‐Expenses
51‐Salaries & Wages (543,585) (57,679) (38,500) (19,179) ‐49.82% (552,667) (526,560) (26,107) ‐4.96%
52‐Contractual Services (546,713) (57,053) (57,428) 375 0.65% (443,042) (438,643) (4,399) ‐1.00%
53‐Supplies (109,299) (7,936) (10,417) 2,482 23.82% (95,935) (101,539) 5,604 5.52%
54‐Other Charges (282,242) (19,121) (23,728) 4,607 19.42% (223,696) (162,452) (61,243) ‐37.70%
57‐Capital (5,681) (517) 0 (517) 0.00% (2,066) 0 (2,066) 0.00%
59‐Transfers Out (601,391) (150,348) (125,000) (25,348) ‐20.28% (601,391) (500,000) (101,391) ‐20.28%
5‐Expenses Total (2,088,912) (292,653) (255,073) (37,580) ‐14.73% (1,918,797) (1,729,194) (189,603) ‐10.96%
000‐Administration Total 216,471 (256,752) (220,346) (36,407) ‐16.52% 392,145 584,333 (192,188) ‐32.89%
101‐Parks Maintenance
4‐Revenues
41‐Taxes 1,976,333 25,469 28,403 (2,934) ‐10.33% 1,976,052 1,982,626 (6,575) ‐0.33%
42‐Charges for Services 5,000 0 0 0 0.00% 0 5,058 (5,058) ‐100.00%
46‐Grants & Donations 0
47‐Misc. Income 5,000 0 0 0 0.00% 56,559 25,926 30,633 118.15%
49‐Transfers In 0
4‐Revenues Total 1,986,333 25,469 28,403 (2,934) ‐10.33% 2,032,611 2,013,610 19,000 0.94%
5‐Expenses
51‐Salaries & Wages (1,507,655) (130,364) (80,170) (50,194) ‐62.61% (1,474,314) (1,360,276) (114,038) ‐8.38%
52‐Contractual Services (552,698) (100,806) (116,067) 15,260 13.15% (507,475) (557,688) 50,213 9.00%
53‐Supplies (388,339) (37,155) (46,496) 9,341 20.09% (284,592) (288,720) 4,129 1.43%
54‐Other Charges (11,000) (485) 0 (485) 0.00% (5,537) (7,716) 2,179 28.25%
57‐Capital (265,707) (301) 0 (301) 0.00% (222,372) (121,893) (100,478) ‐82.43%
59‐Transfers Out 0
5‐Expenses Total (2,725,399) (269,112) (242,733) (26,379) ‐10.87% (2,494,290) (2,336,294) (157,996) ‐6.76%
101‐Parks Maintenance Total (739,066) (243,643) (214,329) (29,313) ‐13.68% (461,679) (322,683) (138,996) ‐43.07%
430‐Historical Museum
4‐Revenues
42‐Charges for Services 45,550 10,284 8,059 2,225 27.60% 39,454 42,647 (3,193) ‐7.49%
44‐Rentals 6,500 0 0 0 0.00% 2,120 2,244 (124) ‐5.54%
45‐Product Sales 2,700 86 111 (24) ‐21.84% 1,297 1,414 (116) ‐8.23%
46‐Grants & Donations 156,900 11,713 703 11,010 1566.19% 146,458 139,403 7,055 5.06%
47‐Misc. Income 0 0 0 0 0.00% 523 320 203 63.44%
4‐Revenues Total 211,650 22,083 8,873 13,211 148.89% 189,853 186,028 3,824 2.06%
5‐Expenses
51‐Salaries & Wages (116,413) (12,626) (7,100) (5,526) ‐77.83% (112,492) (105,162) (7,330) ‐6.97%
52‐Contractual Services (75,851) (10,801) (10,978) 178 1.62% (68,405) (67,490) (915) ‐1.36%
53‐Supplies (18,676) (4,936) (3,153) (1,783) ‐56.56% (14,245) (11,496) (2,749) ‐23.92%
54‐Other Charges (7,987) (547) (241) (306) ‐127.05% (4,466) (4,802) 336 7.00%
57‐Capital (517) (129) 0 (129) 0.00% (517) 0 (517) 0.00%
5‐Expenses Total (219,444) (29,039) (21,471) (7,567) ‐35.24% (200,125) (188,950) (11,176) ‐5.91%
430‐Historical Museum Total (7,794) (6,955) (12,599) 5,644 44.79% (10,273) (2,921) (7,351) ‐251.67%
10‐General Total (530,389) (507,350) (447,274) (60,076) ‐13.43% (79,807) 258,728 (338,535) ‐130.85%
20‐Recreation
000‐Administration
4‐Revenues
41‐Taxes 3,900,913 50,256 56,080 (5,824) ‐10.39% 3,899,193 3,913,134 (13,940) ‐0.36%
42‐Charges for Services 141,025 0 0 0 0.00% 110,504 99,926 10,578 10.59%
44‐Rentals 34,639 11,652 1,260 10,392 824.76% 55,783 22,583 33,200 147.01%
45‐Product Sales 46,800 0 278 (278) ‐100.00% 61,994 49,743 12,251 24.63%
46‐Grants & Donations 27,795 125 217 (92) ‐42.40% 18,637 17,637 1,001 5.67%
Page 18 of 26
Major Op Fund by Dept
Row Labels
Sum of Full Year
Budget
Sum of
Current
Month
Sum of LY
Month
Month
Variance
% Month
Variance
Sum of
Current
YTD
Sum of LY
YTD
YTD
Variance
% YTD
Variance
47‐Misc. Income 3,641 36 61 (25) ‐40.66% 4,048 3,622 426 11.75%
48‐Interest Income 20,000 6,262 5,112 1,150 22.49% 27,636 26,439 1,197 4.53%
49‐Transfers In 83,000
4‐Revenues Total 4,257,813 68,331 63,008 5,323 8.45% 4,177,795 4,133,083 44,712 1.08%
5‐Expenses
51‐Salaries & Wages (1,324,720) (136,118) (90,861) (45,258) ‐49.81% (1,269,841) (1,234,215) (35,627) ‐2.89%
52‐Contractual Services (842,425) (109,294) (108,783) (511) ‐0.47% (763,712) (788,782) 25,070 3.18%
53‐Supplies (164,555) (10,864) (59,266) 48,402 81.67% (148,713) (150,215) 1,502 1.00%
54‐Other Charges (128,291) (5,275) (1,947) (3,328) ‐170.91% (100,203) (90,718) (9,484) ‐10.45%
57‐Capital (6,112) (624) 0 (624) 0.00% (2,497) 0 (2,497) 0.00%
59‐Transfers Out (1,782,883) (445,721) (500,000) 54,279 10.86% (1,782,883) (2,000,000) 217,117 10.86%
5‐Expenses Total (4,248,986) (707,896) (760,856) 52,960 6.96% (4,067,849) (4,263,929) 196,080 4.60%
000‐Administration Total 8,827 (639,566) (697,849) 58,283 8.35% 109,947 (130,846) 240,793 184.03%
101‐Parks Maintenance
4‐Revenues
42‐Charges for Services 0 0 0 0 0.00% 4,249 0 4,249 0.00%
44‐Rentals 12,261 240 420 (180) ‐42.86% 13,813 19,435 (5,623) ‐28.93%
45‐Product Sales 0 0 0 0 0.00% 0 0 0 0.00%
47‐Misc. Income 0
4‐Revenues Total 12,261 240 420 (180) ‐42.86% 18,062 19,435 (1,373) ‐7.07%
5‐Expenses
51‐Salaries & Wages (696,585) (93,366) (63,926) (29,440) ‐46.05% (733,093) (602,981) (130,111) ‐21.58%
52‐Contractual Services (338,272) (41,522) (58,840) 17,318 29.43% (275,826) (326,409) 50,583 15.50%
53‐Supplies (305,392) (4,626) (14,540) 9,914 68.18% (187,693) (189,062) 1,368 0.72%
57‐Capital (86) (22) 0 (22) 0.00% (86) 0 (86) 0.00%
5‐Expenses Total (1,340,335) (139,536) (137,306) (2,230) ‐1.62% (1,196,698) (1,118,452) (78,246) ‐7.00%
101‐Parks Maintenance Total (1,328,074) (139,296) (136,886) (2,410) ‐1.76% (1,178,637) (1,099,017) (79,620) ‐7.24%
220‐Recreation Programs
4‐Revenues
42‐Charges for Services 2,971,316 177,943 160,807 17,135 10.66% 2,978,279 2,921,527 56,752 1.94%
44‐Rentals 79,284 4,593 5,858 (1,265) ‐21.60% 97,198 84,995 12,204 14.36%
45‐Product Sales 24,761 351 1,756 (1,405) ‐80.03% 10,939 20,899 (9,960) ‐47.66%
46‐Grants & Donations 0 0 0 0 0.00% 156 1,094 (938) ‐85.74%
47‐Misc. Income 0 0 0 0 0.00% 0 383 (383) ‐100.05%
4‐Revenues Total 3,075,362 182,886 168,421 14,465 8.59% 3,086,572 3,028,897 57,674 1.90%
5‐Expenses
51‐Salaries & Wages (1,143,540) (101,990) (64,638) (37,352) ‐57.79% (1,209,468) (1,073,322) (136,146) ‐12.68%
52‐Contractual Services (1,197,161) (77,597) (120,637) 43,039 35.68% (1,106,559) (1,076,344) (30,215) ‐2.81%
53‐Supplies (188,173) (5,766) (15,345) 9,578 62.42% (153,768) (159,393) 5,625 3.53%
54‐Other Charges (2,200) (225) (150) (75) ‐50.00% (1,071) (918) (153) ‐16.63%
57‐Capital 0
5‐Expenses Total (2,531,074) (185,579) (200,769) 15,191 7.57% (2,470,866) (2,309,977) (160,889) ‐6.96%
220‐Recreation Programs Total 544,288 (2,693) (32,348) 29,655 91.68% 615,706 718,921 (103,214) ‐14.36%
221‐Athletics
4‐Revenues
42‐Charges for Services 415,201 7,913 2,406 5,507 228.89% 400,866 413,629 (12,763) ‐3.09%
45‐Product Sales 29,705 (57) 901 (958) ‐106.33% 19,868 31,736 (11,868) ‐37.39%
47‐Misc. Income 0 397 0 397 0.00% 8,466 0 8,466 0.00%
49‐Transfers In 65,000
4‐Revenues Total 509,906 8,253 3,307 4,946 149.56% 429,201 445,365 (16,164) ‐3.63%
5‐Expenses
51‐Salaries & Wages (73,836) (8,756) (6,507) (2,249) ‐34.56% (70,291) (75,274) 4,983 6.62%
52‐Contractual Services (143,279) (5,906) (5,581) (325) ‐5.83% (108,286) (103,352) (4,934) ‐4.77%
53‐Supplies (250,722) (704) (4,429) 3,725 84.11% (187,496) (212,032) 24,536 11.57%
54‐Other Charges (41,985) 0 (743) 743 100.06% (40,150) (38,314) (1,836) ‐4.79%
57‐Capital 0
59‐Transfers Out 0
5‐Expenses Total (509,822) (15,366) (17,260) 1,894 10.97% (406,223) (428,972) 22,749 5.30%
221‐Athletics Total 84 (7,113) (13,953) 6,840 49.02% 22,978 16,393 6,585 40.17%
222‐Pools
4‐Revenues
42‐Charges for Services 790,000 0 0 0 0.00% 734,830 715,428 19,402 2.71%
44‐Rentals 24,050 0 0 0 0.00% 20,262 23,743 (3,481) ‐14.66%
Page 19 of 26
Major Op Fund by Dept
Row Labels
Sum of Full Year
Budget
Sum of
Current
Month
Sum of LY
Month
Month
Variance
% Month
Variance
Sum of
Current
YTD
Sum of LY
YTD
YTD
Variance
% YTD
Variance
45‐Product Sales 88,500 0 0 0 0.00% 89,525 94,140 (4,615) ‐4.90%
46‐Grants & Donations 0
47‐Misc. Income 17,500 0 0 0 0.00% 18,858 20,292 (1,434) ‐7.07%
4‐Revenues Total 920,050 0 0 0 0.00% 863,476 853,603 9,872 1.16%
5‐Expenses
51‐Salaries & Wages (487,284) (14,809) (6,459) (8,349) ‐129.27% (531,009) (482,263) (48,747) ‐10.11%
52‐Contractual Services (271,759) (13,362) (15,990) 2,628 16.44% (256,418) (266,277) 9,859 3.70%
53‐Supplies (68,286) (847) (1,451) 604 41.65% (65,744) (78,186) 12,441 15.91%
54‐Other Charges (18,250) 0 0 0 0.00% (9,700) (15,067) 5,366 35.62%
57‐Capital (517) (129) 0 (129) 0.00% (517) 0 (517) 0.00%
59‐Transfers Out 0
5‐Expenses Total (846,095) (29,146) (23,900) (5,246) ‐21.95% (863,389) (841,792) (21,597) ‐2.57%
222‐Pools Total 73,955 (29,146) (23,900) (5,246) ‐21.95% 86 11,811 (11,724) ‐99.27%
224‐Recreation Facilities
4‐Revenues
42‐Charges for Services 2,650 399 96 303 315.35% 3,023 3,159 (137) ‐4.32%
44‐Rentals 77,650 4,253 3,748 505 13.47% 82,114 77,709 4,405 5.67%
45‐Product Sales 1,080 693 1,324 (631) ‐47.66% 1,518 367 1,151 313.75%
47‐Misc. Income 0
4‐Revenues Total 81,380 5,345 5,168 177 3.42% 86,655 81,235 5,420 6.67%
5‐Expenses
51‐Salaries & Wages (183,722) (20,440) (18,189) (2,251) ‐12.38% (192,247) (184,244) (8,003) ‐4.34%
52‐Contractual Services (344,443) (29,995) (40,374) 10,379 25.71% (315,490) (314,094) (1,396) ‐0.44%
53‐Supplies (52,644) (4,676) (8,255) 3,579 43.35% (45,814) (36,644) (9,170) ‐25.03%
54‐Other Charges (4,730) (145) (168) 23 13.66% (3,288) (2,073) (1,215) ‐58.61%
57‐Capital (1,033) (258) 0 (258) 0.00% (1,033) 0 (1,033) 0.00%
59‐Transfers Out 0
5‐Expenses Total (586,573) (55,514) (66,985) 11,471 17.12% (557,872) (537,054) (20,818) ‐3.88%
224‐Recreation Facilities Total (505,193) (50,169) (61,817) 11,648 18.84% (471,217) (455,819) (15,398) ‐3.38%
350‐Special Facilities
4‐Revenues
42‐Charges for Services 864,800 73,602 70,724 2,877 4.07% 784,414 770,973 13,441 1.74%
44‐Rentals 3,200 43 21 22 105.67% 3,035 810 2,225 274.64%
45‐Product Sales 3,900 0 0 0 0.00% 2,345 2,252 93 4.12%
46‐Grants & Donations 0
47‐Misc. Income 6,000 5,320 6,871 (1,551) ‐22.57% 6,914 40,945 (34,030) ‐83.11%
4‐Revenues Total 877,900 78,965 77,616 1,348 1.74% 796,709 814,980 (18,272) ‐2.24%
5‐Expenses
51‐Salaries & Wages (533,810) (49,741) (38,411) (11,330) ‐29.50% (532,375) (493,492) (38,883) ‐7.88%
52‐Contractual Services (119,531) (28,357) (28,146) (211) ‐0.75% (102,959) (110,025) 7,065 6.42%
53‐Supplies (100,301) (4,821) (23,289) 18,468 79.30% (77,615) (85,826) 8,210 9.57%
54‐Other Charges (29,855) (277) (7,332) 7,055 96.22% (17,737) (24,464) 6,727 27.50%
57‐Capital (689) (172) 0 (172) 0.00% (689) 0 (689) 0.00%
59‐Transfers Out 0
5‐Expenses Total (784,185) (83,368) (97,178) 13,810 14.21% (731,375) (713,807) (17,569) ‐2.46%
350‐Special Facilities Total 93,715 (4,403) (19,561) 15,158 77.49% 65,334 101,174 (35,840) ‐35.42%
20‐Recreation Total (1,112,398) (872,384) (986,314) 113,929 11.55% (835,803) (837,384) 1,581 0.19%
22‐Cosley Zoo
000‐Administration
4‐Revenues
41‐Taxes 995,904 12,834 12,592 242 1.93% 995,774 878,629 117,145 13.33%
42‐Charges for Services 0 0 0 0 0.00% 0 0 0 0.00%
44‐Rentals 0
45‐Product Sales 0
46‐Grants & Donations 0
47‐Misc. Income 0
48‐Interest Income 200 1,489 261 1,227 470.16% 3,191 1,147 2,044 178.19%
49‐Transfers In 0
4‐Revenues Total 996,104 14,323 12,853 1,470 11.43% 998,965 879,776 119,188 13.55%
5‐Expenses
51‐Salaries & Wages (51,778) (5,741) (3,676) (2,065) ‐56.19% (52,238) (50,009) (2,229) ‐4.46%
52‐Contractual Services (11,172) (2,366) (2,788) 422 15.14% (11,517) (13,129) 1,612 12.28%
53‐Supplies 0
Page 20 of 26
Major Op Fund by Dept
Row Labels
Sum of Full Year
Budget
Sum of
Current
Month
Sum of LY
Month
Month
Variance
% Month
Variance
Sum of
Current
YTD
Sum of LY
YTD
YTD
Variance
% YTD
Variance
54‐Other Charges (100) 0 (37) 37 100.68% (719) (78) (641) ‐821.40%
57‐Capital 0
59‐Transfers Out 0
5‐Expenses Total (63,050) (8,107) (6,501) (1,606) ‐24.71% (64,474) (63,216) (1,257) ‐1.99%
000‐Administration Total 933,054 6,215 6,352 (137) ‐2.15% 934,491 816,560 117,931 14.44%
101‐Parks Maintenance
4‐Revenues
47‐Misc. Income 0
4‐Revenues Total 0
5‐Expenses
51‐Salaries & Wages (153,077) (19,958) (12,102) (7,856) ‐64.91% (154,612) (131,693) (22,919) ‐17.40%
52‐Contractual Services (43,299) (9,487) (7,495) (1,992) ‐26.58% (34,872) (38,534) 3,662 9.50%
53‐Supplies (27,215) (912) (2,905) 1,994 68.63% (23,175) (19,093) (4,082) ‐21.38%
57‐Capital 0
5‐Expenses Total (223,591) (30,356) (22,502) (7,854) ‐34.91% (212,659) (189,320) (23,339) ‐12.33%
101‐Parks Maintenance Total (223,591) (30,356) (22,502) (7,854) ‐34.91% (212,659) (189,320) (23,339) ‐12.33%
220‐Recreation Programs
4‐Revenues
42‐Charges for Services 122,582 2,411 (22,638) 25,049 110.65% 130,184 130,961 (777) ‐0.59%
45‐Product Sales 1,925 0 0 0 0.00% 1,156 2,144 (988) ‐46.08%
46‐Grants & Donations 0 0 0 0 0.00% 10,200 0 10,200 0.00%
4‐Revenues Total 124,507 2,411 (22,638) 25,049 110.65% 141,540 133,105 8,435 6.34%
5‐Expenses
51‐Salaries & Wages 0
52‐Contractual Services (1,253) (33) (466) 433 92.88% (541) (2,595) 2,054 79.17%
53‐Supplies (11,000) (405) (580) 175 30.16% (12,050) (11,594) (455) ‐3.93%
57‐Capital 0
5‐Expenses Total (12,253) (438) (1,046) 608 58.10% (12,591) (14,190) 1,599 11.27%
220‐Recreation Programs Total 112,254 1,973 (23,685) 25,657 108.33% 128,949 118,915 10,034 8.44%
350‐Special Facilities
5‐Expenses
51‐Salaries & Wages (56,148) (6,383) (4,120) (2,263) ‐54.93% (58,234) (54,189) (4,045) ‐7.46%
52‐Contractual Services (11,990) (2,998) (3,160) 162 5.13% (11,990) (12,639) 648 5.13%
53‐Supplies 0
54‐Other Charges (11,000) (881) (1,578) 697 44.18% (11,375) (10,182) (1,193) ‐11.72%
57‐Capital 0
5‐Expenses Total (79,139) (10,262) (8,858) (1,404) ‐15.85% (81,599) (77,010) (4,589) ‐5.96%
350‐Special Facilities Total (79,139) (10,262) (8,858) (1,404) ‐15.85% (81,599) (77,010) (4,589) ‐5.96%
501‐Cosley Zoo Operations
4‐Revenues
42‐Charges for Services 360,104 14 0 14 0.00% 348,853 258,812 90,041 34.79%
44‐Rentals 54,000 471 40 432 1078.75% 57,466 45,334 12,132 26.76%
45‐Product Sales 0 (0) 0 (0) 0.00% 41 0 41 0.00%
46‐Grants & Donations 40,500 5,149 4,046 1,103 27.26% 33,797 33,488 308 0.92%
47‐Misc. Income 0 0 0 0 0.00% 336 313 23 7.44%
4‐Revenues Total 454,604 5,634 4,086 1,548 37.89% 440,493 337,947 102,546 30.34%
5‐Expenses
51‐Salaries & Wages (574,025) (69,161) (44,093) (25,068) ‐56.85% (584,003) (553,078) (30,925) ‐5.59%
52‐Contractual Services (247,254) (44,110) (37,548) (6,562) ‐17.48% (239,624) (204,191) (35,433) ‐17.35%
53‐Supplies (122,950) (16,855) (21,883) 5,028 22.98% (114,286) (95,734) (18,552) ‐19.38%
54‐Other Charges (40,590) (2,243) (4,242) 1,999 47.11% (31,032) (34,241) 3,208 9.37%
57‐Capital (1,377) (344) 0 (344) 0.00% (1,377) 0 (1,377) 0.00%
5‐Expenses Total (986,196) (132,714) (107,766) (24,948) ‐23.15% (970,322) (887,243) (83,079) ‐9.36%
501‐Cosley Zoo Operations Total (531,592) (127,080) (103,680) (23,400) ‐22.57% (529,829) (549,296) 19,467 3.54%
22‐Cosley Zoo Total 210,986 (159,510) (152,372) (7,138) ‐4.68% 239,353 119,850 119,503 99.71%
60‐Golf Fund
000‐Administration
4‐Revenues
41‐Taxes 1,565,716 0 0 0 0.00% 1,565,716 1,530,674 35,042 2.29%
42‐Charges for Services 0
46‐Grants & Donations 0 0 5 (5) ‐108.60% 0 5 (5) ‐108.60%
47‐Misc. Income 4,200 126 159 (33) ‐20.75% 14,853 24,007 (9,154) ‐38.13%
Page 21 of 26
Major Op Fund by Dept
Row Labels
Sum of Full Year
Budget
Sum of
Current
Month
Sum of LY
Month
Month
Variance
% Month
Variance
Sum of
Current
YTD
Sum of LY
YTD
YTD
Variance
% YTD
Variance
48‐Interest Income 9,000 9,300 5,189 4,111 79.23% 33,642 16,527 17,115 103.56%
49‐Transfers In 0
4‐Revenues Total 1,578,916 9,426 5,354 4,073 76.07% 1,614,211 1,571,213 42,998 2.74%
5‐Expenses
51‐Salaries & Wages (317,157) (42,466) (24,802) (17,664) ‐71.22% (359,806) (316,951) (42,854) ‐13.52%
52‐Contractual Services (2,033,648) (175,475) (208,507) 33,032 15.84% (667,464) (753,093) 85,629 11.37%
53‐Supplies (130,904) (3,821) (14,965) 11,144 74.47% (90,158) (91,457) 1,299 1.42%
54‐Other Charges (136,574) (9,851) (9,335) (516) ‐5.52% (112,028) (117,176) 5,148 4.39%
57‐Capital (183,787) (98) (35,200) 35,102 99.72% (149,935) (224,441) 74,507 33.20%
59‐Transfers Out 0
5‐Expenses Total (2,802,070) (231,712) (292,810) 61,098 20.87% (1,379,391) (1,503,119) 123,728 8.23%
000‐Administration Total (1,223,154) (222,285) (287,456) 65,171 22.67% 234,820 68,095 166,726 244.84%
101‐Parks Maintenance
5‐Expenses
51‐Salaries & Wages (13,902) (1,580) (1,034) (546) ‐52.84% (14,521) (13,352) (1,169) ‐8.75%
52‐Contractual Services (4,146) (889) (775) (114) ‐14.66% (4,165) (3,873) (292) ‐7.54%
53‐Supplies (7,000) 0 0 0 0.00% (6,623) (6,179) (444) ‐7.18%
54‐Other Charges 0
57‐Capital 0
5‐Expenses Total (25,048) (2,469) (1,809) (660) ‐36.49% (25,309) (23,405) (1,904) ‐8.14%
101‐Parks Maintenance Total (25,048) (2,469) (1,809) (660) ‐36.49% (25,309) (23,405) (1,904) ‐8.14%
601‐Golf Maintenance
4‐Revenues
46‐Grants & Donations 0 0 0 0 0.00% 0 0 0 0.00%
47‐Misc. Income 0 1,375 0 1,375 0.00% 1,375 0 1,375 0.00%
4‐Revenues Total 0 1,375 0 1,375 0.00% 1,375 0 1,375 0.00%
5‐Expenses
51‐Salaries & Wages (545,010) (44,914) (30,192) (14,721) ‐48.76% (543,470) (478,207) (65,262) ‐13.65%
52‐Contractual Services (191,806) (32,750) (37,257) 4,508 12.10% (181,071) (174,631) (6,440) ‐3.69%
53‐Supplies (364,611) (14,365) (17,577) 3,212 18.28% (346,232) (321,943) (24,289) ‐7.54%
54‐Other Charges (25,000) (5,925) (4,000) (1,925) ‐48.13% (24,210) (29,634) 5,424 18.30%
57‐Capital (136,311) (108) 0 (108) 0.00% (136,311) (176,460) 40,149 22.75%
5‐Expenses Total (1,262,737) (98,061) (89,027) (9,034) ‐10.15% (1,231,293) (1,180,876) (50,418) ‐4.27%
601‐Golf Maintenance Total (1,262,737) (96,686) (89,027) (7,659) ‐8.60% (1,229,918) (1,180,876) (49,043) ‐4.15%
611‐Pro Shop/Golf Fees
4‐Revenues
42‐Charges for Services 1,979,750 370 18,054 (17,684) ‐97.95% 1,746,130 1,753,201 (7,071) ‐0.40%
44‐Rentals 413,950 2,710 2,094 616 29.44% 378,234 334,608 43,626 13.04%
45‐Product Sales 128,000 4,416 4,438 (23) ‐0.51% 142,000 146,865 (4,865) ‐3.31%
46‐Grants & Donations 0
47‐Misc. Income 0 4 6 (2) ‐35.00% 1,667 2,174 (507) ‐23.31%
4‐Revenues Total 2,521,700 7,500 24,593 (17,093) ‐69.50% 2,268,031 2,236,848 31,183 1.39%
5‐Expenses
51‐Salaries & Wages (441,587) (23,293) (15,644) (7,649) ‐48.90% (350,815) (348,839) (1,977) ‐0.57%
52‐Contractual Services (178,859) (17,263) (22,896) 5,633 24.60% (153,007) (158,029) 5,022 3.18%
53‐Supplies (133,608) (335,811) (2,118) (333,694) ‐15755.12% (485,199) (119,025) (366,174) ‐307.64%
54‐Other Charges (35,000) (2,631) (3,634) 1,003 27.60% (27,963) (36,402) 8,439 23.18%
57‐Capital (50,603) (151) 0 (151) 0.00% (603) (55,639) 55,037 98.92%
5‐Expenses Total (839,657) (379,148) (44,291) (334,857) ‐756.04% (1,017,586) (717,934) (299,653) ‐41.74%
611‐Pro Shop/Golf Fees Total 1,682,043 (371,648) (19,698) (351,950) ‐1786.73% 1,250,445 1,518,915 (268,470) ‐17.68%
612‐Food and Beverage
4‐Revenues
42‐Charges for Services 172,122 8,148 14,215 (6,067) ‐42.68% 142,542 137,518 5,024 3.65%
44‐Rentals 0 0 0 0 0.00% 471 342 129 37.82%
45‐Product Sales 5,589,907 341,587 390,495 (48,908) ‐12.52% 5,171,649 5,229,862 (58,213) ‐1.11%
46‐Grants & Donations 0
47‐Misc. Income 33,000 85 1,355 (1,270) ‐93.73% 18,290 33,138 (14,848) ‐44.81%
4‐Revenues Total 5,795,029 349,819 406,064 (56,245) ‐13.85% 5,332,953 5,400,860 (67,907) ‐1.26%
5‐Expenses
51‐Salaries & Wages (2,021,740) (191,867) (146,190) (45,677) ‐31.24% (1,954,554) (1,894,230) (60,324) ‐3.18%
52‐Contractual Services (872,739) (128,693) (124,807) (3,887) ‐3.11% (840,230) (796,013) (44,218) ‐5.55%
53‐Supplies (1,683,981) (128,736) (136,779) 8,044 5.88% (1,580,737) (1,573,441) (7,296) ‐0.46%
54‐Other Charges (100,000) 0 (4,302) 4,302 99.99% (102,483) (101,614) (869) ‐0.86%
Page 22 of 26
Major Op Fund by Dept
Row Labels
Sum of Full Year
Budget
Sum of
Current
Month
Sum of LY
Month
Month
Variance
% Month
Variance
Sum of
Current
YTD
Sum of LY
YTD
YTD
Variance
% YTD
Variance
57‐Capital (54,922) (2,908) (2,224) (684) ‐30.78% (46,801) (18,110) (28,690) ‐158.42%
59‐Transfers Out 0
5‐Expenses Total (4,733,382) (452,205) (414,302) (37,903) ‐9.15% (4,524,805) (4,383,408) (141,398) ‐3.23%
612‐Food and Beverage Total 1,061,648 (102,385) (8,237) (94,148) ‐1142.99% 808,147 1,017,452 (209,305) ‐20.57%
613‐Cross Country Skiing
4‐Revenues
42‐Charges for Services 15,000 0 2,877 (2,877) ‐100.00% 0 2,877 (2,877) ‐100.00%
45‐Product Sales 0
4‐Revenues Total 15,000 0 2,877 (2,877) ‐100.00% 0 2,877 (2,877) ‐100.00%
5‐Expenses
51‐Salaries & Wages (4,000) 0 (250) 250 99.82% (1,087) (250) (837) ‐334.96%
52‐Contractual Services (436) (20) (56) 36 64.11% (349) (182) (167) ‐92.03%
53‐Supplies (5,000)
57‐Capital 0
5‐Expenses Total (9,436) (20) (306) 285 93.29% (1,436) (431) (1,005) ‐233.15%
613‐Cross Country Skiing Total 5,564 (20) 2,571 (2,592) ‐100.80% (1,436) 2,446 (3,882) ‐158.70%
60‐Golf Fund Total 238,316 (795,493) (403,656) (391,837) ‐97.07% 1,036,750 1,402,627 (365,878) ‐26.09%
Grand Total (1,193,485) (2,334,738) (1,989,616) (345,123) ‐17.35% 360,493 943,821 (583,329) ‐61.80%
Page 23 of 26
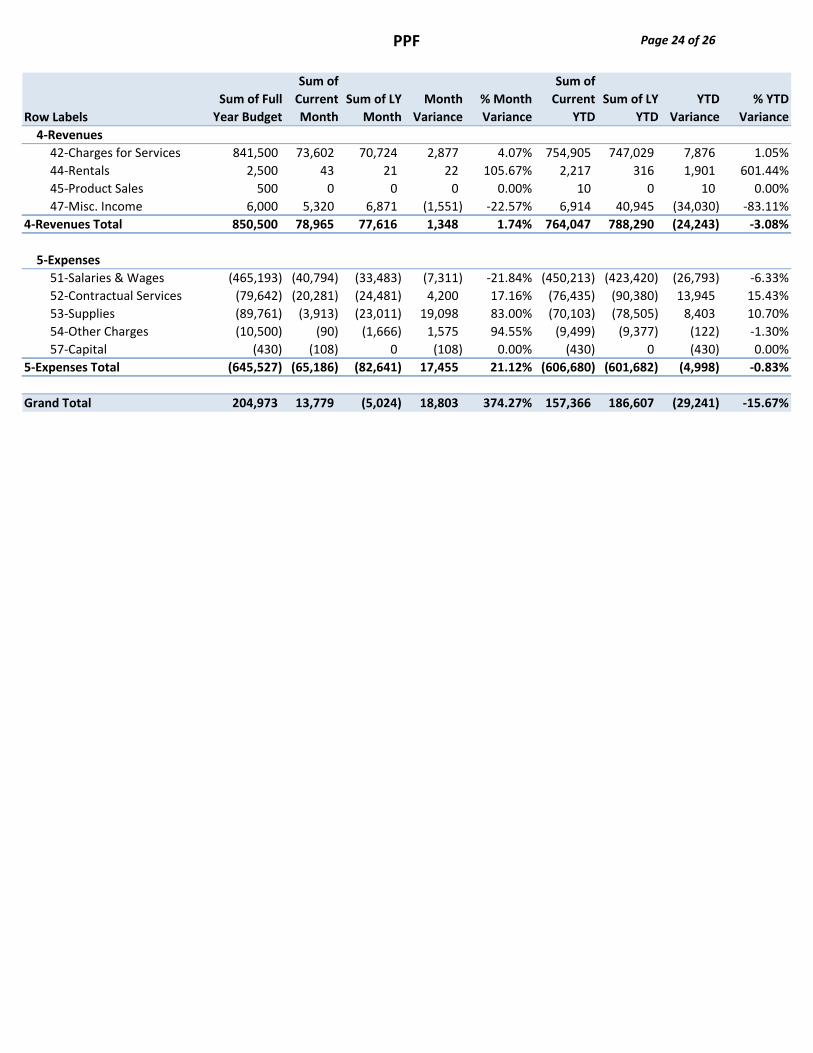
PPF
Row Labels
Sum of Full
Year Budget
Sum of
Current
Month
Sum of LY
Month
Month
Variance
% Month
Variance
Sum of
Current
YTD
Sum of LY
YTD
YTD
Variance
% YTD
Variance
4‐Revenues
42‐Charges for Services 841,500 73,602 70,724 2,877 4.07% 754,905 747,029 7,876 1.05%
44‐Rentals 2,500 43 21 22 105.67% 2,217 316 1,901 601.44%
45‐Product Sales 500 0 0 0 0.00% 10 0 10 0.00%
47‐Misc. Income 6,000 5,320 6,871 (1,551) ‐22.57% 6,914 40,945 (34,030) ‐83.11%
4‐Revenues Total 850,500 78,965 77,616 1,348 1.74% 764,047 788,290 (24,243) ‐3.08%
5‐Expenses
51‐Salaries & Wages (465,193) (40,794) (33,483) (7,311) ‐21.84% (450,213) (423,420) (26,793) ‐6.33%
52‐Contractual Services (79,642) (20,281) (24,481) 4,200 17.16% (76,435) (90,380) 13,945 15.43%
53‐Supplies (89,761) (3,913) (23,011) 19,098 83.00% (70,103) (78,505) 8,403 10.70%
54‐Other Charges (10,500) (90) (1,666) 1,575 94.55% (9,499) (9,377) (122) ‐1.30%
57‐Capital (430) (108) 0 (108) 0.00% (430) 0 (430) 0.00%
5‐Expenses Total (645,527) (65,186) (82,641) 17,455 21.12% (606,680) (601,682) (4,998) ‐0.83%
Grand Total 204,973 13,779 (5,024) 18,803 374.27% 157,366 186,607 (29,241) ‐15.67%
Page 24 of 26
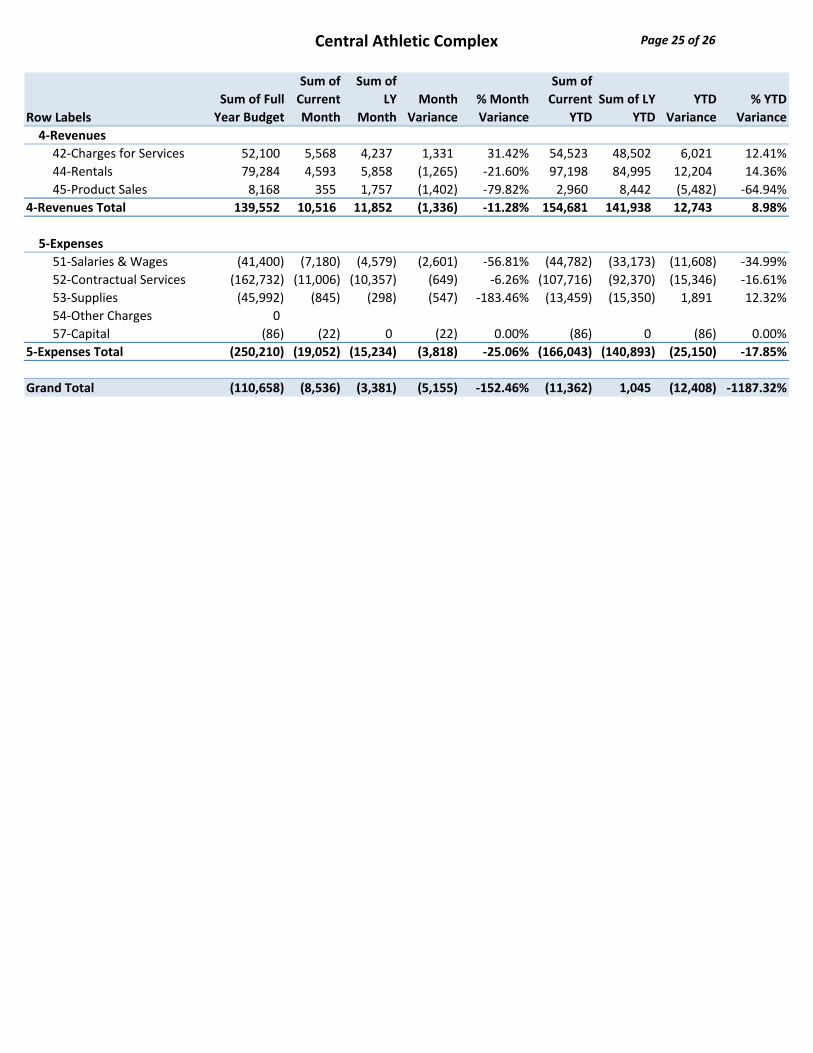
Central Athletic Complex
Row Labels
Sum of Full
Year Budget
Sum of
Current
Month
Sum of
LY
Month
Month
Variance
% Month
Variance
Sum of
Current
YTD
Sum of LY
YTD
YTD
Variance
% YTD
Variance
4‐Revenues
42‐Charges for Services 52,100 5,568 4,237 1,331 31.42% 54,523 48,502 6,021 12.41%
44‐Rentals 79,284 4,593 5,858 (1,265) ‐21.60% 97,198 84,995 12,204 14.36%
45‐Product Sales 8,168 355 1,757 (1,402) ‐79.82% 2,960 8,442 (5,482) ‐64.94%
4‐Revenues Total 139,552 10,516 11,852 (1,336) ‐11.28% 154,681 141,938 12,743 8.98%
5‐Expenses
51‐Salaries & Wages (41,400) (7,180) (4,579) (2,601) ‐56.81% (44,782) (33,173) (11,608) ‐34.99%
52‐Contractual Services (162,732) (11,006) (10,357) (649) ‐6.26% (107,716) (92,370) (15,346) ‐16.61%
53‐Supplies (45,992) (845) (298) (547) ‐183.46% (13,459) (15,350) 1,891 12.32%
54‐Other Charges 0
57‐Capital (86) (22) 0 (22) 0.00% (86) 0 (86) 0.00%
5‐Expenses Total (250,210) (19,052) (15,234) (3,818) ‐25.06% (166,043) (140,893) (25,150) ‐17.85%
Grand Total (110,658) (8,536) (3,381) (5,155) ‐152.46% (11,362) 1,045 (12,408) ‐1187.32%
Page 25 of 26
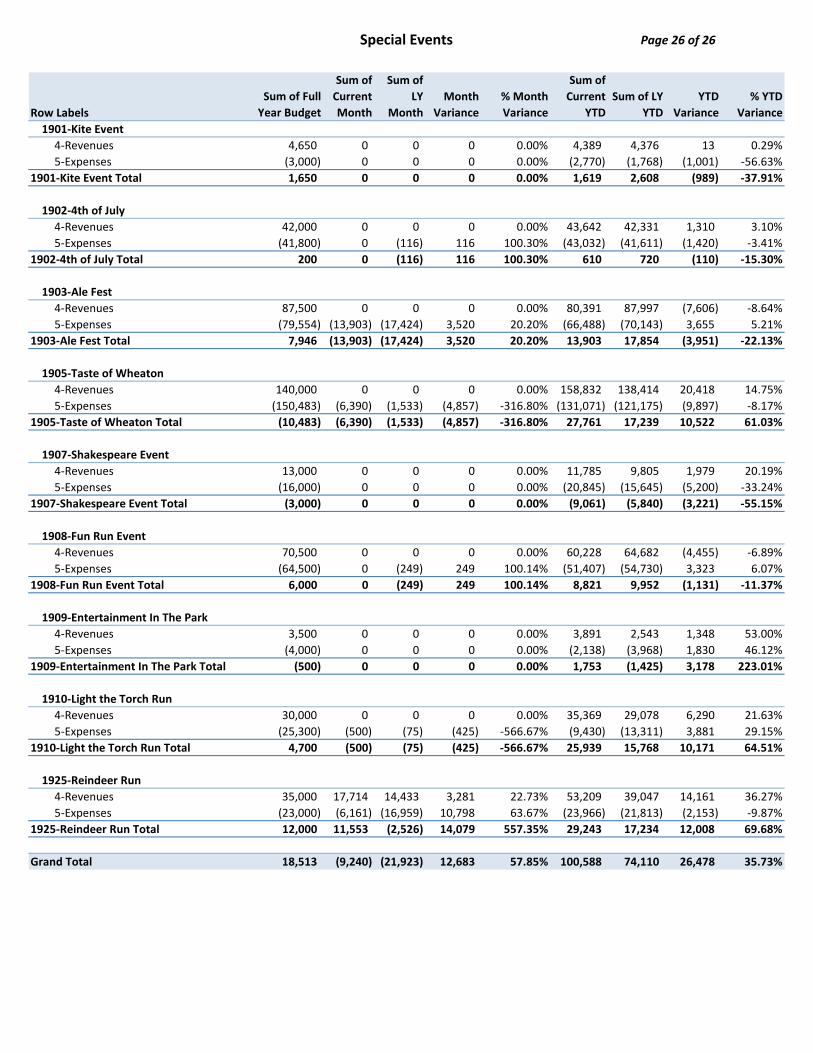
Special Events
Row Labels
Sum of Full
Year Budget
Sum of
Current
Month
Sum of
LY
Month
Month
Variance
% Month
Variance
Sum of
Current
YTD
Sum of LY
YTD
YTD
Variance
% YTD
Variance
1901‐Kite Event
4‐Revenues 4,650 0 0 0 0.00% 4,389 4,376 13 0.29%
5‐Expenses (3,000) 0 0 0 0.00% (2,770) (1,768) (1,001) ‐56.63%
1901‐Kite Event Total 1,650 0 0 0 0.00% 1,619 2,608 (989) ‐37.91%
1902‐4th of July
4‐Revenues 42,000 0 0 0 0.00% 43,642 42,331 1,310 3.10%
5‐Expenses (41,800) 0 (116) 116 100.30% (43,032) (41,611) (1,420) ‐3.41%
1902‐4th of July Total 200 0 (116) 116 100.30% 610 720 (110) ‐15.30%
1903‐Ale Fest
4‐Revenues 87,500 0 0 0 0.00% 80,391 87,997 (7,606) ‐8.64%
5‐Expenses (79,554) (13,903) (17,424) 3,520 20.20% (66,488) (70,143) 3,655 5.21%
1903‐Ale Fest Total 7,946 (13,903) (17,424) 3,520 20.20% 13,903 17,854 (3,951) ‐22.13%
1905‐Taste of Wheaton
4‐Revenues 140,000 0 0 0 0.00% 158,832 138,414 20,418 14.75%
5‐Expenses (150,483) (6,390) (1,533) (4,857) ‐316.80% (131,071) (121,175) (9,897) ‐8.17%
1905‐Taste of Wheaton Total (10,483) (6,390) (1,533) (4,857) ‐316.80% 27,761 17,239 10,522 61.03%
1907‐Shakespeare Event
4‐Revenues 13,000 0 0 0 0.00% 11,785 9,805 1,979 20.19%
5‐Expenses (16,000) 0 0 0 0.00% (20,845) (15,645) (5,200) ‐33.24%
1907‐Shakespeare Event Total (3,000) 0 0 0 0.00% (9,061) (5,840) (3,221) ‐55.15%
1908‐Fun Run Event
4‐Revenues 70,500 0 0 0 0.00% 60,228 64,682 (4,455) ‐6.89%
5‐Expenses (64,500) 0 (249) 249 100.14% (51,407) (54,730) 3,323 6.07%
1908‐Fun Run Event Total 6,000 0 (249) 249 100.14% 8,821 9,952 (1,131) ‐11.37%
1909‐Entertainment In The Park
4‐Revenues 3,500 0 0 0 0.00% 3,891 2,543 1,348 53.00%
5‐Expenses (4,000) 0 0 0 0.00% (2,138) (3,968) 1,830 46.12%
1909‐Entertainment In The Park Total (500) 0 0 0 0.00% 1,753 (1,425) 3,178 223.01%
1910‐Light the Torch Run
4‐Revenues 30,000 0 0 0 0.00% 35,369 29,078 6,290 21.63%
5‐Expenses (25,300) (500) (75) (425) ‐566.67% (9,430) (13,311) 3,881 29.15%
1910‐Light the Torch Run Total 4,700 (500) (75) (425) ‐566.67% 25,939 15,768 10,171 64.51%
1925‐Reindeer Run
4‐Revenues 35,000 17,714 14,433 3,281 22.73% 53,209 39,047 14,161 36.27%
5‐Expenses (23,000) (6,161) (16,959) 10,798 63.67% (23,966) (21,813) (2,153) ‐9.87%
1925‐Reindeer Run Total 12,000 11,553 (2,526) 14,079 557.35% 29,243 17,234 12,008 69.68%
Grand Total 18,513 (9,240) (21,923) 12,683 57.85% 100,588 74,110 26,478 35.73%
Page 26 of 26