Embed Size (px)
Citation preview

What’s Next on the Mega Catastrophe Event Front?
Inundation, Litigation & Politicization
DRI Insurance Coverage and Practice SymposiumNew York, NY
December 12, 2013Download at www.iii.org/presentations
Robert P. Hartwig, Ph.D., CPCU, President & EconomistInsurance Information Institute 110 William Street New York, NY 10038
Tel: 212.346.5520 Cell: 917.453.1885 [email protected] www.iii.org

2
Presentation Outline
U.S. Insured Catastrophe Loss Trends More CATs, More Disputes?
Hurricane Sandy Overview Issues and Concerns
Public Opinion Survey: Catastrophes and Insurance
Terrorism and TRIA Terrorism Risk Insurance Program expires 12/31/14
Tort Trends BP and the Deepwater Horizon Litigation

3
U.S. Insured Catastrophe Loss Update
Catastrophe Losses in Recent Years Have Been Very High
Events Like Sandy Attract Trial Lawyers
3

4
Catastrophe Loss Summary
The Number and Cost of Natural Catastrophes is Generally Rising
Flooding events in particular may increase even more quickly
Disasters Have Become Highly Politicized Events
Media Attention to Disasters Is Rising Increasing
“Storm Chasing” Not Just for Meteorologists Anymore Becoming a Trial Bar Practice Area
Density of Population in CAT-Prone Area is Increasing
State/Federal Government Still Subsidize Coastal Living Some improvements w/ FL Citizens depop and BW-12 Biggert-Waters NFIP reform is under siege
Large Gaps Between Insured and Economic Loss Persist for Some Types of CATs
Breeding ground for disputes and litigation

5
$1
2.6
$1
1.0
$3
.8
$1
4.3
$1
1.6
$6
.1
$3
4.7
$7
.6
$1
6.3
$3
3.7
$7
3.4
$1
0.5
$7
.5
$2
9.2
$1
1.5
$1
4.4
$3
3.6
$3
5.0
$1
0.9
$1
4.0
$4
.8
$8
.0
$3
7.8
$8
.8
$2
6.4
$0
$10
$20
$30
$40
$50
$60
$70
$80
89 90 91 92 93 94 95 96 97 98 99 00 01 02 03 04 05 06 07 08 09 10 11 12 13*
U.S. Insured Catastrophe Losses
*Through 8/31/13. Includes $9.7B for 2013:H1 (PCS) and $1.2B I.I.I. estimate for the period 7/1 – 8/31/13.Note: 2001 figure includes $20.3B for 9/11 losses reported through 12/31/01 ($25.9B 2011 dollars). Includes only business and personal property claims, business interruption and auto claims. Non-prop/BI losses = $12.2B ($15.6B in 2011 dollars.) Sources: Property Claims Service/ISO; Insurance Information Institute.
2012 Was the 3rd Highest Year on Record for Insured Losses in U.S. History on an Inflation-Adj. Basis. 2011 Losses Were the 6th Highest. YTD 2013 Running Well
Below 2011 and 2012 YTD Totals.
2012 was the third most expensive year ever for insured CAT
losses
Record tornado losses caused
2011 CAT losses to surge
($ Billions, $ 2012)
5
6
ROE: Property/Casualty Insurance vs. Fortune 500, 1987–2013E*
* Excludes Mortgage & Financial Guarantee in 2008 – 2013E. 2013 P/C ROE is through 2013:Q2. Sources: ISO, Fortune; Insurance Information Institute.
-5%
0%
5%
10%
15%
20%
87 88 89 90 91 92 93 94 95 96 97 98 99 00 01 02 03 04 05 06 07 08 09 10 11 12 13E
P/C Profitability Is Both by Cyclicality and Ordinary Volatility
Hugo
Andrew
Northridge
Lowest CAT Losses in 15 Years
Sept. 11
Katrina, Rita, Wilma
4 Hurricanes
Financial Crisis*
(Percent)
Record Tornado Losses
Sandy

7
Combined Ratio Points Associated with Catastrophe Losses: 1960 – 2012*
Notes: Private carrier losses only. Excludes loss adjustment expenses and reinsurance reinstatement premiums. Figures are adjusted for losses ultimately paid by foreign insurers and reinsurers.Source: ISO (1960-2011); A.M. Best (2012E) Insurance Information Institute.
0.4
1.2
0.4 0.
8 1.3
0.3 0.4 0.
71.
51.
00.
40.
4 0.7
1.8
1.1
0.6
1.4 2.
01.
3 2.0
0.5
0.5 0.7
3.0
1.2
2.1
8.8
2.3
5.9
3.3
2.8
1.0
3.6
2.9
1.6
5.4
1.6
3.3
3.3
8.1
2.7
1.6
5.0
2.6
3.4
8.7 9.
4
3.6
0.9
0.1
1.1
1.1
0.8
0
1
2
3
4
5
6
7
8
9
10
1960
1962
1964
1966
1968
1970
1972
1974
1976
1978
1980
1982
1984
1986
1988
1990
1992
1994
1996
1998
2000
2002
2004
2006
2008
2010
2012
E
The Catastrophe Loss Component of Private Insurer Losses Has Increased Sharply in Recent Decades
Avg. CAT Loss Component of the Combined Ratio
by Decade
1960s: 1.04 1970s: 0.85 1980s: 1.31 1990s: 3.39 2000s: 3.52 2010s: 7.20*
Combined Ratio Points Catastrophe losses as a share of all losses reached
a record high in 2012

Homeowners Insurance Combined Ratio: 1990–2015F
11
3.0
11
7.7
15
8.4
11
3.6
10
1.0 10
9.4
10
8.2
11
1.4 1
21
.7
10
9.3
98
.2
94
.4 10
0.3
89
.0 95
.6
11
6.6
10
5.8
10
6.9
12
2.3
10
4.1
10
1.2
10
0.5
99
.7
11
8.4
11
2.7 12
1.7
80
90
100
110
120
130
140
150
160
170
90 91 92 93 94 95 96 97 98 99 00 01 02 03 04 05 06 07 08 09 10 11 12 13F 14F 15F
1
Homeowners Performance in 2011/12 Impacted by Large Cat Losses. Extreme Regional Variation Can Be Expected Due to
Local Catastrophe Loss Activity
Sources: A.M. Best (1990-2012);Conning (2013E-2015F); Insurance Information Institute. 8
Hurricane Ike
Hurricane Sandy
Record tornado activity
Hurricane Andrew

9
Reasons for US P/C Insurer Impairments, 1969–2010
3.6%4.0%
8.6%
7.3%
7.8%
7.1%
7.8%13.6%
40.3%
Source: A.M. Best: 1969-2010 Impairment Review, Special Report, April 2011.
Historically, Deficient Loss Reserves and Inadequate Pricing AreBy Far the Leading Cause of P-C Insurer Impairments.
Investment and Catastrophe Losses Play a Much Smaller Role
Deficient Loss Reserves/Inadequate Pricing
Reinsurance Failure
Rapid GrowthAlleged Fraud
Catastrophe Losses
Affiliate Impairment
Investment Problems (Overstatement of Assets)
Misc.
Sig. Change in Business

10
Top States by Inflation-Adjusted Insured Catastrophe Losses, 1983–2012
9.0%
10.4%
14.3%66.3%
Source: PCS unit of ISO, Verisk Company.; Insurance Information Institute.
Over the Past 30 Years Florida Has Accounted for the Largest Share of Catastrophe Losses in the U.S., Followed by Texas and Louisiana
Rest of the U.S.$309.9BFlorida
$66.7B
Texas$48.8B
Louisiana$42.0B
Total: $467.5 Billion, an average of
$16.6B per year or $1.3B per month
11
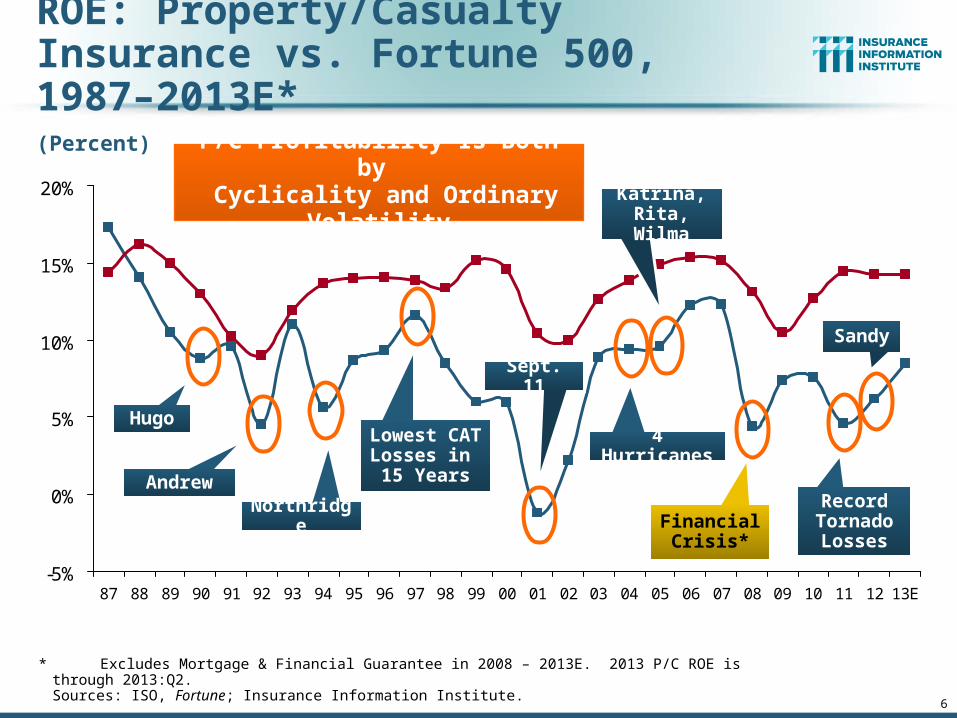
$9,756
$6,369
$2,318$1,511 $1,440
$0
$2,000
$4,000
$6,000
$8,000
$10,000
$12,000
New York New Jersey Texas Kentucky Colorado
*Includes catastrophe losses of at least $25 million.Sources: PCS unit of ISO; Insurance Information Institute.
Top 5 States by Insured Catastrophe Losses in 2012*
NY and NJ led the country for privately insured CAT losses
in 2012 due to Sandy
(2012, $ Billions)
12
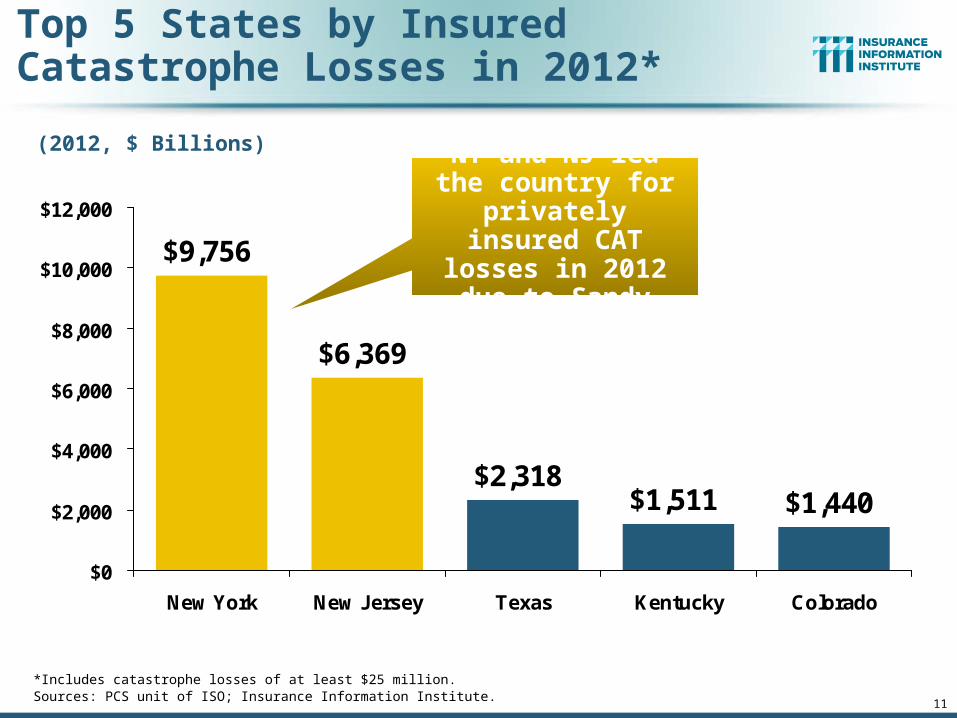
Inflation Adjusted U.S. Catastrophe Losses by Cause of Loss, 1993–20121
0.1%
1.7%
3.8%4.7%
6.3%
7.1%
36.0%
40.4%
1. Catastrophes are defined as events causing direct insured losses to property of $25 million or more in 2012 dollars.2. Excludes snow.3. Does not include NFIP flood losses4. Includes wildland fires5. Includes civil disorders, water damage, utility disruptions and non-property losses such as those covered by workers compensation.Source: ISO’s Property Claim Services Unit.
Hurricanes & Tropical Storms, $158.2
Fires (4), $6.5
Tornadoes (2), $140.9
Winter Storms, $27.8
Terrorism, $24.8
Geological Events, $18.4
Wind/Hail/Flood (3), $14.9
Other (5), $0.2
Wind losses are by far cause the most catastrophe losses,
even if hurricanes/TS are excluded.
Tornado share of CAT losses is
rising
Insured cat losses from 1993-2012
totaled $391.7B, an average of $19.6B per year or $1.6B
per month
13
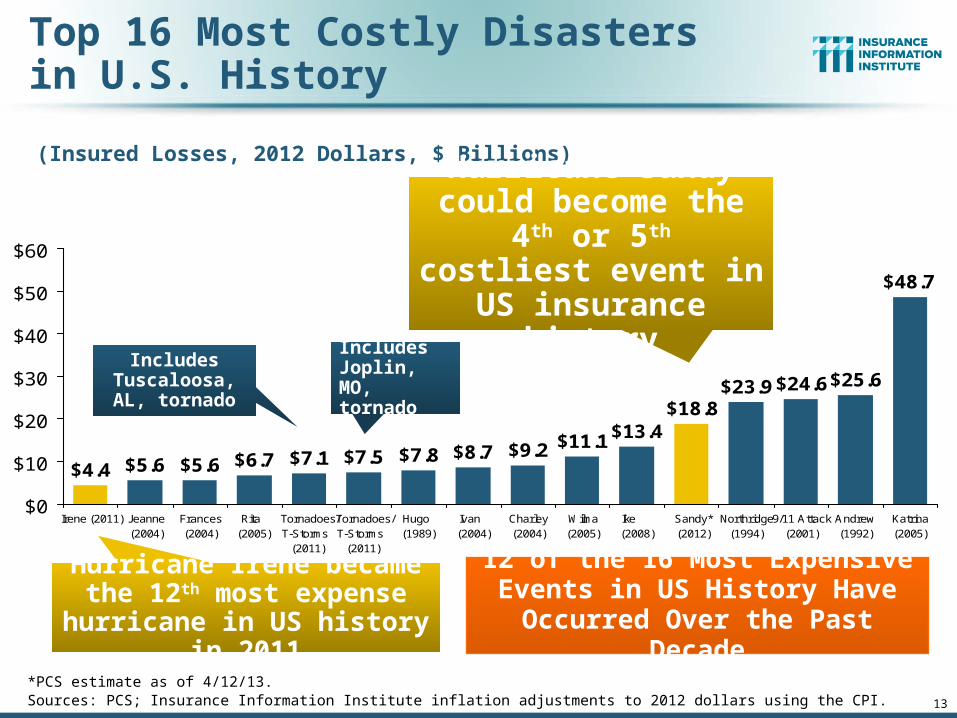
Top 16 Most Costly Disastersin U.S. History
(Insured Losses, 2012 Dollars, $ Billions)
$7.8 $8.7 $9.2 $11.1$13.4$18.8
$23.9 $24.6$25.6
$48.7
$7.5$7.1$6.7$5.6$5.6$4.4
$0
$10
$20
$30
$40
$50
$60
Irene (2011) Jeanne(2004)
Frances(2004)
Rita (2005)
Tornadoes/T-Storms
(2011)
Tornadoes/T-Storms
(2011)
Hugo (1989)
Ivan (2004)
Charley(2004)
Wilma(2005)
Ike (2008)
Sandy*(2012)
Northridge(1994)
9/11 Attack(2001)
Andrew(1992)
Katrina(2005)
Hurricane Sandy could become the 4th or 5th costliest event in US
insurance history
Hurricane Irene became the 12th most expense hurricane
in US history in 2011
Includes Tuscaloosa, AL,
tornado
Includes Joplin, MO, tornado
12 of the 16 Most Expensive Events in US History Have
Occurred Over the Past Decade
*PCS estimate as of 4/12/13.Sources: PCS; Insurance Information Institute inflation adjustments to 2012 dollars using the CPI.

14
Top 16 Most Costly World Insurance Losses, 1970-2012*
(Insured Losses, 2012 Dollars, $ Billions)
*Figures do not include federally insured flood losses.**Estimate based on PCS value of $18.75B as of 4/12/13.Sources: Munich Re; Swiss Re; Insurance Information Institute research.
$11.1$13.4 $13.4$13.4$18.8
$23.9 $24.6$25.6
$38.6
$48.7
$7.8 $8.1 $8.5 $8.7 $9.2 $9.6
$0
$10
$20
$30
$40
$50
$60
Hugo (1989)
WinterStormDaria(1991)
ChileQuake(2010)
Ivan (2004)
Charley(2004)
TyphoonMirielle(1991)
Wilma(2005)
ThailandFloods(2011)
NewZealandQuake(2011)
Ike (2008)
Sandy(2012)**
Northridge(1994)
WTC TerrorAttack(2001)
Andrew(1992)
JapanQuake,
Tsunami(2011)**
Katrina(2005)
5 of the top 14 most expensive catastrophes in
world history have occurred within the past 3 years
(2010-2012)
Hurricane Sandy is now the 6th costliest event in global
insurance history
2012 insured CAT Losses totaled $60B; Economic losses totaled $140B, according to Swiss Re

Nu
mb
er
Geophysical (earthquake, tsunami, volcanic activity)
Climatological (temperature extremes, drought, wildfire)
Meteorological (storm)
Hydrological (flood, mass movement)
Natural Disasters in the United States, 1980 – June 2013*Number of Events (Annual Totals 1980 – June 2013*)
*Through June 30, 2013.Source: MR NatCatSERVICE 15
41
19
121
3
50
100
150
200
250
300
1980 1982 1984 1986 1988 1990 1992 1994 1996 1998 2000 2002 2004 2006 2008 2010 2012
There were 68 natural disaster events in the
first half of 2013

Losses Due to Natural Disasters in the US, 1980–2013 (Jan.-June Only)
16
Overall losses (in 2012 values) Insured losses (in 2012 values)
Source: MR NatCatSERVICE
(2012 Dollars, $ Billions)(Overall and Insured Losses)
10
20
30
40
50
60
70
80
90
1980 1982 1984 1986 1988 1990 1992 1994 1996 1998 2000 2002 2004 2006 2008 2010 2012
First Half 2013 losses were running below 2011 and 2012 but
were consistent with the decade prior.
Approximately 57% of the overall cost of
catastrophes in the US was covered by
insurance in 2013:H1
2013 First Half Losses
Overall : $13.8B
Insured: $7.9B
Indicates a great deal of losses are uninsured (~40%-50% in the US).
This gap is sometimes a
breeding ground for disputes and
litigation

Geophysical (earthquake, tsunami, volcanic activity)
Climatological (temperature extremes, drought, wildfire)
Meteorological (storm)
Hydrological (flood, mass movement)
Natural Disasters Worldwide,1980 – 2013* (Number of Events)
*Through June 30, 2013.Source: MR NatCatSERVICE 18
41
19
121
3
200
400
600
800
1 000
1 200
1980 1982 1984 1986 1988 1990 1992 1994 1996 1998 2000 2002 2004 2006 2008 2010 2012
Nu
mb
er
There were 460 natural disaster events globally in the first half of 2013
and 905 for full-year 2012

Losses Due to Natural Disasters Worldwide, 1980–2013* (Overall & Insured Losses)
19
Overall losses (in 2012 values) Insured losses (in 2012 values)
*Through June 30, 2013.Source: MR NatCatSERVICE
(2012 Dollars, $ Billions)(Overall and Insured Losses)
50
100
150
200
250
300
350
400
450
1980 1982 1984 1986 1988 1990 1992 1994 1996 1998 2000 2002 2004 2006 2008 2010 2012
2012 Losses
Overall : $101.1B
Insured: $57.9B
There is a clear upward trend in both insured and overall losses over the past
30+ years
2013: 1st Half Losses
Overall : $45B
Insured: $13B

23
Top 12 Most Costly Hurricanesin U.S. History
(Insured Losses, 2012 Dollars, $ Billions)
*PCS estimate as of 4/12/13.Sources: PCS; Insurance Information Institute inflation adjustments to 2012 dollars using the CPI.
$9.2 $11.1$13.4
$18.8
$25.6
$48.7
$8.7$7.8$6.7$5.6$5.6$4.4
$0
$10
$20
$30
$40
$50
$60
Irene(2011)
Jeanne(2004)
Frances(2004)
Rita (2005)
Hugo (1989)
Ivan (2004)
Charley(2004)
Wilma(2005)
Ike (2008)
Sandy*(2012)
Andrew(1992)
Katrina(2005)
Hurricane Sandy became the 3rd costliest hurricane in US
insurance historyHurricane Irene
became the 12th most expensive hurricane in US history in 2011
10 of the 12 most costly hurricanes in insurance history occurred over the past 9 years (2004—2012)

24
Total Value of Insured Coastal Exposure in 2012
(2012, $ Billions)
Source: AIR Worldwide
$293.5$239.3
$182.3$164.6$163.5
$118.2$106.7$81.9$64.0$60.6$58.3
$17.3
$567.8$713.9
$849.6$1,175.3
$2,862.3$2,923.1
$0 $500 $1,000 $1,500 $2,000 $2,500 $3,000 $3,500
New YorkFloridaTexas
MassachusettsNew JerseyConnecticut
LouisianaS. Carolina
VirginiaMaine
North CarolinaAlabamaGeorgia
DelawareNew Hampshire
MississippiRhode Island
Maryland
In 2012, New York Ranked as the #1 Most Exposed State to Hurricane Loss, Overtaking Florida with $2.862 Trillion. Texas is very exposed too, and
ranked #3 with $1.175 Trillionin insured coastal exposure
The Insured Value of All Coastal Property Was $10.6 Trillion in 2012 , Up 20% from $8.9 Trillion in 2007 and
Up 48% from $7.2 Trillion in 2004
The value of insured coastal exposure in NY is now highest in the US for
the first time.

26
Total Potential Home Value Exposure to Storm Surge Risk in 2013*
($ Billions)
*Insured and uninsured property. Based on estimated property values as of April 2013.Source: Storm Surge Report 2013, CoreLogic.
$65.2$51.0$50.3
$35.0$22.4$20.5
$15.9$10.4$7.2$4.7$3.1$2.7$2.6$0.6
$65.6$72.0$78.0
$118.8$135.0
$386.5
$0 $50 $100 $150 $200 $250 $300 $350 $400 $450
FloridaNew York
New JerseyVirginia
LouisianaS. CarolinaN. Carolina
TexasMassachusetts
ConnecticutMarylandGeorgia
DelawareMississippi
Rhode IslandAlabama
MaineNew
PennsylvaniaDC
The Value of Homes Exposed to Storm Surge was $1.147 Trillion in 2013.* Only a fraction of this is insured, hence the huge demand for federal aid
following major coastal flooding events.
Florida is by the state most vulnerable to storm surge.

NHC shooting for mid-season for deployment. First of many ways of distributing storm-surge
forecasts.
Storm Surge Inundation Graphic
28
The combined ratios for both personal and commercial lines
improved substantially in 2013:H1
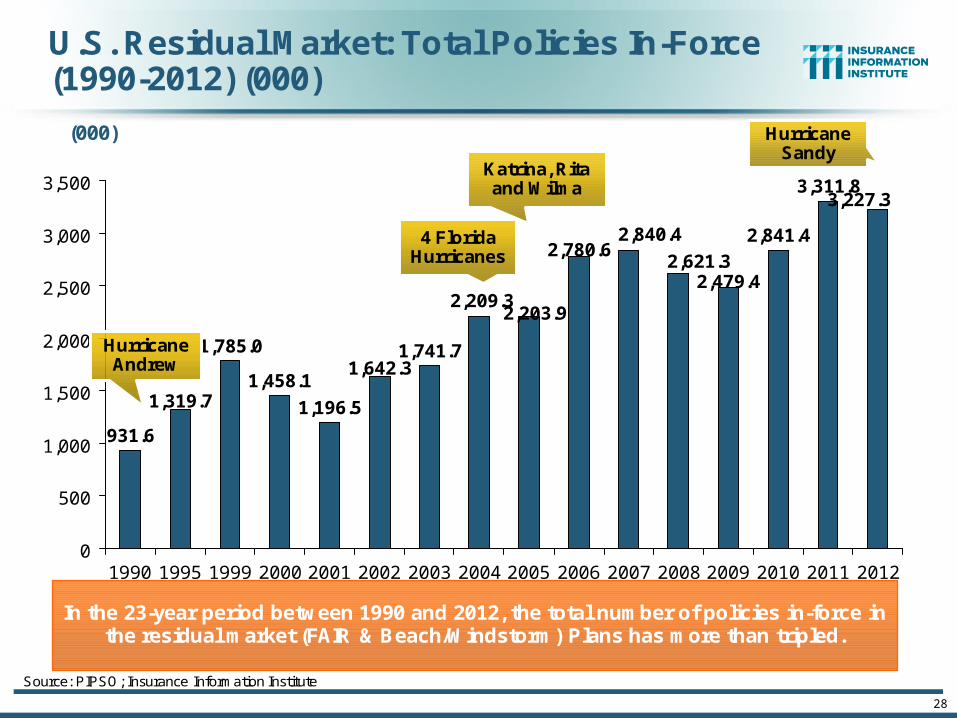
U.S. Residual Market: Total Policies In-Force (1990-2012) (000)
Source: PIPSO; Insurance Information Institute
931.6
1,785.0
1,458.1
1,196.5
1,741.7
2,841.4
3,311.83,227.3
2,479.4
1,319.7
2,621.32,780.6
1,642.3
2,840.4
2,209.32,203.9
0
500
1,000
1,500
2,000
2,500
3,000
3,500
1990 1995 1999 2000 2001 2002 2003 2004 2005 2006 2007 2008 2009 2010 2011 2012
(000)
Hurricane Andrew
4 Florida Hurricanes
Katrina, Rita and Wilma
In the 23-year period between 1990 and 2012, the total number of policies in-force in the residual market (FAIR & Beach/Windstorm) Plans has more than tripled.
Hurricane Sandy

29
U.S. Residual Market Exposure to Loss(1990-2012) ($ Billions)
Source: PIPSO; Insurance Information Institute (I.I.I.).
$281.8
$884.7
$757.9$818.1
$430.5$372.3
$54.7
$150.0
$292.0$244.2$221.3
$419.5
$656.7 $696.4
$771.9
$703.0
$0
$100
$200
$300
$400
$500
$600
$700
$800
$900
$1,000
1990 1995 1999 2000 2001 2002 2003 2004 2005 2006 2007 2008 2009 2010 2011 2012
($ Billions)
In the 23-year period between 1990 and 2012, total exposure to loss in the residual market (FAIR & Beach/Windstorm) Plans has surged from $54.7
billion in 1990 to $818.1 billion in 2012.
Hurricane Andrew
4 Florida Hurricanes
Katrina, Rita and Wilma
Hurricane Sandy

U.S. Thunderstorm Loss Trends, 1980 – June 30, 2013
31Source: Property Claims Service, MR NatCatSERVICE
Average thunderstorm
losses are up 7 fold since the early
1980s. The 5- year running average
loss is up sharply.
Hurricanes get all the headlines, but thunderstorms are consistent
producers of large scale loss. 2008-2012 are the most expensive
years on record.
1st Half 2013 thunderstorm losses total $6.325B; The
system that included the EF-5 tornado in Moore, OK, accounted for $1.575B

Convective Loss Events in the U.S. Overall and insured losses 1980 – 2012 and First Half 2013
Overall losses (in 2012 values) Insured losses (in 2012 values)
(Bill. US$)
Analysis contains: straight-line winds, tornadoes, hail, heavy precipitation, flash floods, lightning.
5
10
15
20
25
30
35
40
45
50
1980 1982 1984 1986 1988 1990 1992 1994 1996 1998 2000 2002 2004 2006 2008 2010 2012
32Source: Geo Risks Research, NatCatSERVICE – As at July 2013
Convective events are those caused by straight-line winds,
tornadoes, hail, heavy precipitation,
flash floods and lightning
The insured and total economic cost of
convective events has rising tremendously
over the past 30+ years

Hurricane Sandy Summary
34
Sandy Became One of the Most Expensive Events in
Insurance History
34
35
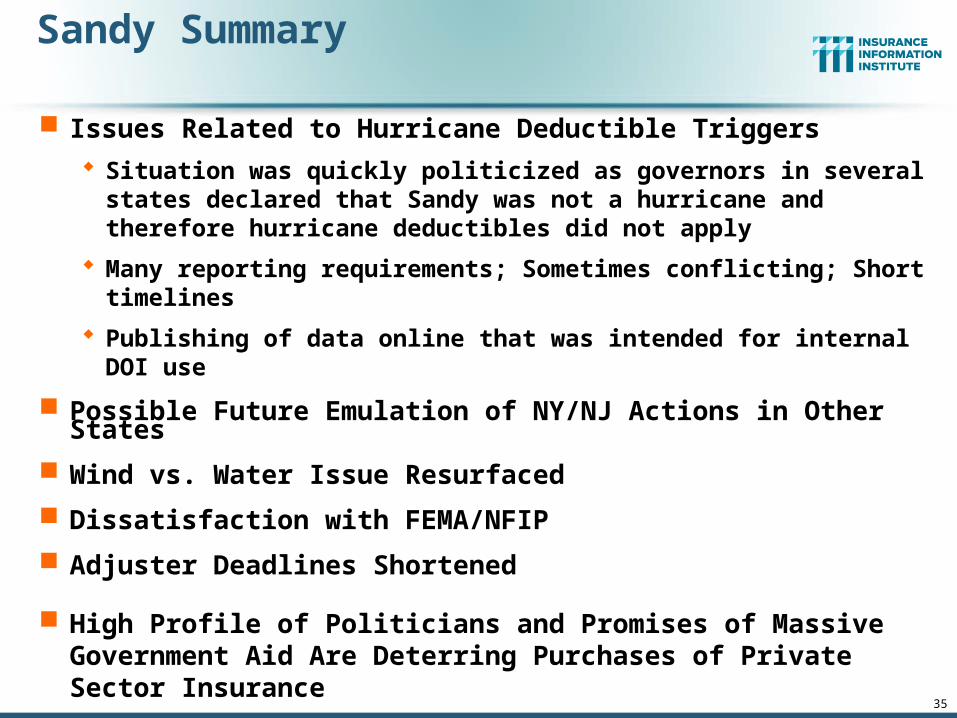
Sandy Summary
Issues Related to Hurricane Deductible Triggers
Situation was quickly politicized as governors in several states declared that Sandy was not a hurricane and therefore hurricane deductibles did not apply
Many reporting requirements; Sometimes conflicting; Short timelines
Publishing of data online that was intended for internal DOI use
Possible Future Emulation of NY/NJ Actions in Other States
Wind vs. Water Issue Resurfaced
Dissatisfaction with FEMA/NFIP
Adjuster Deadlines Shortened
High Profile of Politicians and Promises of Massive Government Aid Are Deterring Purchases of Private Sector Insurance
Overreliance on government aid frequently results in frustration, disappointment and can contribute litigation
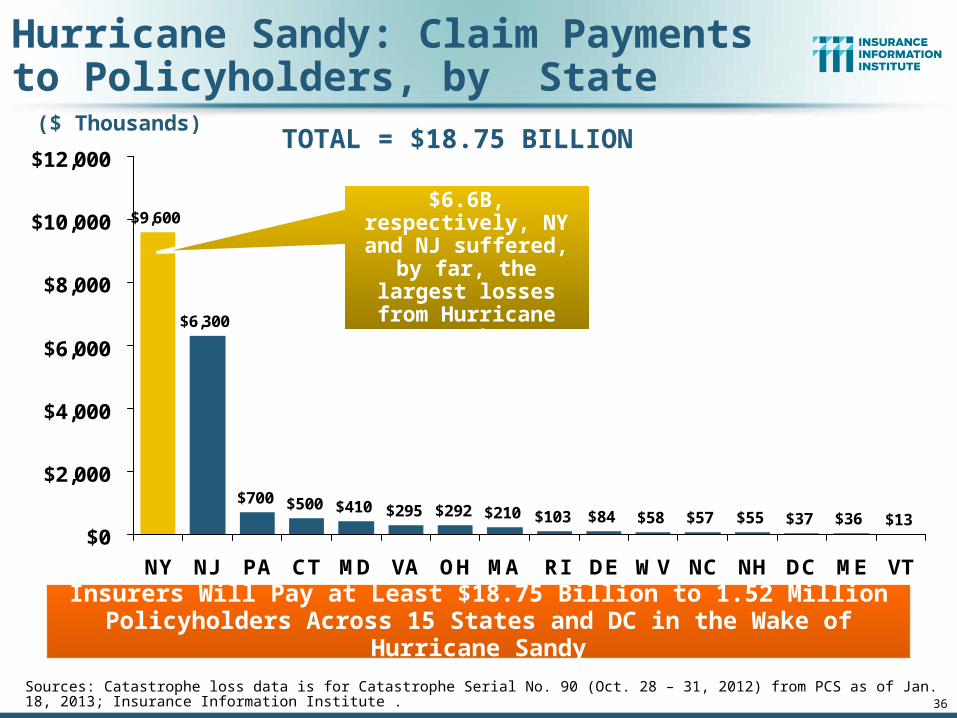
Hurricane Sandy: Claim Payments to Policyholders, by State
$9,600
$6,300
$700 $500 $410 $295 $292 $210 $103 $84 $57 $55 $37 $36 $13$58$0
$2,000
$4,000
$6,000
$8,000
$10,000
$12,000
NY NJ PA CT MD VA OH MA RI DE WV NC NH DC ME VT
Insurers Will Pay at Least $18.75 Billion to 1.52 Million Policyholders Across 15 States and DC in the Wake of Hurricane Sandy
36
At $9.6B and $6.6B, respectively, NY and NJ suffered, by far, the largest losses
from Hurricane Sandy
TOTAL = $18.75 BILLION($ Thousands)
Sources: Catastrophe loss data is for Catastrophe Serial No. 90 (Oct. 28 – 31, 2012) from PCS as of Jan. 18, 2013; Insurance Information Institute .

Auto, 250,500 ,
16%
Commercial, 202,500 ,
13%
Homeowner, 1,067,000 ,
71%
Hurricane Sandy resulted in an
estimated 1.52 million privately insured
claims resulting in an estimated $18.75 to
$25 billion in insured losses. Hurricane
Katrina produced 1.74 million claims and
$48.7B in losses (in 2012 $)
Hurricane Sandy: Number of Claims by Type*
*PCS claim count estimate s as of 1/18/13. Loss estimate represents PCS total ($18.75B) and upper end of range estimates by risk modelers RMS, Eqecat and AIR. All figures exclude losses paid by the NFIP.Source: PCS; AIR, Eqecat, AIR Worldwide; Insurance Information Institute. 37
Sandy is a high HO frequency, (relatively
low) severity event (avg. severity <50% Katrina)
Total Claims = 1.52 Million*

Auto, $2,729 , 15%
Commercial, $9,024 ,
48%
Homeowner, $6,997 ,
37%
Although Commercial Lines accounted for
only 13% of total claims, they account for 48% of all claim
dollars paid. In most hurricanes,
Commercial Lines accounts for about
1/3 of insured losses.
Hurricane Sandy: Insured Loss byClaim Type* ($ Millions)
*PCS insured loss estimates as of 1/18/13. Catastrophe modeler estimates range up to $25 billion. All figures exclude losses paid by the NFIP.Source: PCS; Insurance Information Institute. 38
Total Claim Value = $18.75 Billion*

39
U.S. Insured Catastrophe Losses by Cause of Loss, 2011 ($ Millions)
2.8%
1.5%5.6%
72.1%
15.4%
.Source: ISO’s Property Claim Services Unit, Munich Re; Insurance Information Institute.
Hurricanes & Tropical Storms, $5,510
Wildfires, $855
Thunderstorms (Incl. Tornadoes , $25,813
Winter Storms, $2,017
Geological Events, $50, (0.1%)Flood , $535, (1.5%) Other, $1,000
2011’s insured loss distribution was
unusual with tornado and thunderstorm accounting for the
vast majority of loss
Thunderstorm/ Tornado losses were 2.5 times above the 30-year average

40
Inflation Adjusted U.S. Catastrophe Losses by Cause of Loss, 1992–20111
0.4%
1.6%
3.8%4.7%
6.3%
7.3%
33.9%
42.0%
1. Catastrophes are defined as events causing direct insured losses to property of $25 million or more in 2009 dollars.2. Excludes snow.3. Does not include NFIP flood losses4. Includes wildland fires5. Includes civil disorders, water damage, utility disruptions and non-property losses such as those covered by workers compensation.Source: ISO’s Property Claim Services Unit.
Hurricanes & Tropical Storms, $161.3
Fires (4), $6.0
Tornadoes (2), $130.2
Winter Storms, $28.2
Terrorism, $24.4
Geological Events, $18.2
Wind/Hail/Flood (3), $14.8
Other (5), $1.4
Wind losses are by far cause the most catastrophe losses,
even if hurricanes/TS are excluded.
Tornado share of CAT losses is
rising
Insured cat losses from 1992-2011
totaled $384.3B, an average of $19.2B per year or $1.6B
per month

Homeowners Insurance Catastrophe-Related Claim Frequency and Severity, 1997—2012*
*All policy forms combined, countrywide.Source: Insurance Research Council, Trends in Homeowners Insurance Claims, Sept. 2012 from ISO Fast Track data. 41
Avg. catastrophe claim cost rose
approximately 200% from 1997-2011
Cat claim frequency in 2011 was at historic highs and more than
double the rate in 1997

42
Combined Ratio Points Associated with Catastrophe Losses: 1960 – 2012*
Notes: Private carrier losses only. Excludes loss adjustment expenses and reinsurance reinstatement premiums. Figures are adjusted for losses ultimately paid by foreign insurers and reinsurers.Source: ISO (1960-2011); A.M. Best (2012E) Insurance Information Institute.
0.4
1.2
0.4 0.
8 1.3
0.3 0.4 0.
71.
51.
00.
40.
4 0.7
1.8
1.1
0.6
1.4 2.
01.
3 2.0
0.5
0.5 0.7
3.0
1.2
2.1
8.8
2.3
5.9
3.3
2.8
1.0
3.6
2.9
1.6
5.4
1.6
3.3
3.3
8.1
2.7
1.6
5.0
2.6
3.4
8.7 9.
4
3.6
0.9
0.1
1.1
1.1
0.8
0
1
2
3
4
5
6
7
8
9
10
1960
1962
1964
1966
1968
1970
1972
1974
1976
1978
1980
1982
1984
1986
1988
1990
1992
1994
1996
1998
2000
2002
2004
2006
2008
2010
2012
E
The Catastrophe Loss Component of Private Insurer Losses Has Increased Sharply in Recent Decades
Avg. CAT Loss Component of the Combined Ratio
by Decade
1960s: 1.04 1970s: 0.85 1980s: 1.31 1990s: 3.39 2000s: 3.52 2010s: 7.20*
Combined Ratio Points Catastrophe losses as a share of all losses reached
a record high in 2012

Homeowners Insurance Combined Ratio: 1990–2015F
11
3.0
11
7.7
15
8.4
11
3.6
10
1.0 10
9.4
10
8.2
11
1.4 1
21
.7
10
9.3
98
.2
94
.4 10
0.3
89
.0 95
.7
11
6.9
10
5.8
10
6.7
12
2.2
10
4.4
10
1.7
10
1.2
10
0.7
11
8.4
11
2.7 12
1.7
80
90
100
110
120
130
140
150
160
170
90 91 92 93 94 95 96 97 98 99 00 01 02 03 04 05 06 07 08 09 10 11 12E13F 14F 15F
1
Homeowners Performance in 2011/12 Impacted by Large Cat Losses. Extreme Regional Variation Can Be Expected Due to
Local Catastrophe Loss Activity
Sources: A.M. Best (1990-2011);Conning (2012E-2015F); Insurance Information Institute. 43
Hurricane Ike
Hurricane Sandy
Record tornado activity
Hurricane Andrew
44
Federal Disaster Declarations Patterns:
1953-2013
44
Disaster Declarations Set New Records in Recent Years

Number of Federal Disaster Declarations, 1953-2013*
13 1
7 18
16
16
7 71
21
22
22
0 25
25
11
11
19
29
17
17
48
46
46
38
30
22 2
54
22
31
52
42
13
42
7 28
23
11
31
38
45
32 3
63
27
54
46
55
04
54
5 49
56
69
48 5
26
37
55
98
19
94
75
3
43
0
20
40
60
80
100
120
53
54
55
56
57
58
59
60
61
62
63
64
65
66
67
68
69
70
71
72
73
74
75
76
77
78
79
80
81
82
83
84
85
86
87
88
89
90
91
92
93
94
95
96
97
98
99
00
01
02
03
04
05
06
07
08
09
10
11
12
13
*Through December 4, 2013.Source: Federal Emergency Management Administration; http://www.fema.gov/disasters; Insurance Information Institute.
The Number of Federal Disaster Declarations Is Rising and Set New Records in 2010 and 2011. Hurricane Sandy Produced 13 Declarations in 2012/13.
The number of federal disaster declarations set a
new record in 2011, with 99, shattering 2010’s record 81
declarations.
There have been 2,142 federal disaster
declarations since 1953. The average
number of declarations per year is 35 from 1953-2012, though
there few haven’t been recorded since 1995.
53 federal disasters were declared so far in 2013*
45

46
Federal Disasters Declarations by State, 1953 – 2013: Highest 25 States*
87
78
74
67
66
60
57
56
55
54
53
52
52
51
51
50
50
49
48
47
47
46
44
43
40
0
10
20
30
40
50
60
70
80
90
100
TX CA OK NY FL LA AL KY MO AR IL MS IA TN WV MN KS PA NE VA OH WA ND SD ME
Dis
as
ter
De
cla
rati
on
s
Over the past 60 years, Texas has had the highest
number of Federal Disaster
Declarations
*Through Dec. 4, 2013. Includes Puerto Rico and the District of Columbia.Source: FEMA: http://www.fema.gov/news/disaster_totals_annual.fema; Insurance Information Institute.
47
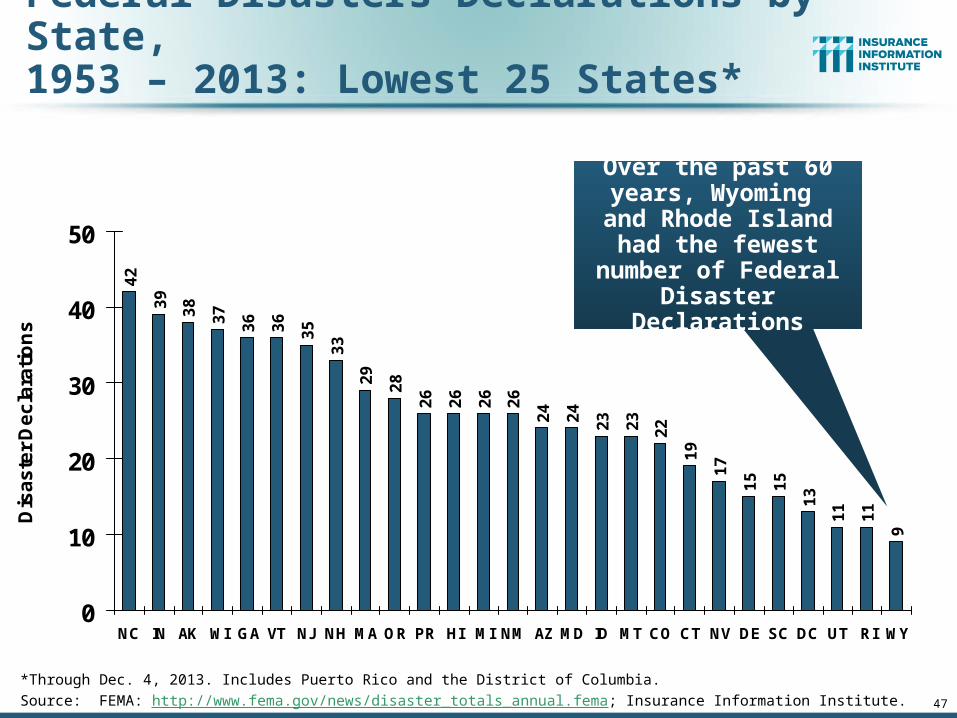
Federal Disasters Declarations by State, 1953 – 2013: Lowest 25 States*
42
39
38
37
36
36
35
33
29
28
26
26
26
26
24
24
23
23
22
19
17
15
15
13
11
11
9
0
10
20
30
40
50
NC IN AK WI GA VT NJ NH MA OR PR HI MI NM AZ MD ID MT CO CT NV DE SC DC UT RI WY
Dis
as
ter
De
cla
rati
on
s
Over the past 60 years, Wyoming and Rhode Island had the fewest
number of Federal Disaster Declarations
*Through Dec. 4, 2013. Includes Puerto Rico and the District of Columbia.Source: FEMA: http://www.fema.gov/news/disaster_totals_annual.fema; Insurance Information Institute.

48
SEVERE WEATHER REPORT UPDATE: 2013
Damage from Tornadoes, Large Hail and High Winds Keep Insurers Busy
48

Location of Tornado Reports:Through December 1, 2013
49Source: NOAA Storm Prediction Center; http://www.spc.noaa.gov/climo/online/monthly/2013_annual_summary.html#; PCS.
A deadly EF-5 tornado in May in
Moore, OK, produced insured losses of $1.575
billion. November tornadoes in the
Midwest like produced $1B in insured losses.
There were 926 tornadoes
through Dec. 1, causing
extensive property
damage in several states

Location of Large Hail Reports:Through December 1, 2013
51Source: NOAA Storm Prediction Center; http://www.spc.noaa.gov/climo/online/monthly/2013_annual_summary.html#
There were 5,456 “Large Hail” reports
through Dec. 1, causing
extensive property and
vehicle damage
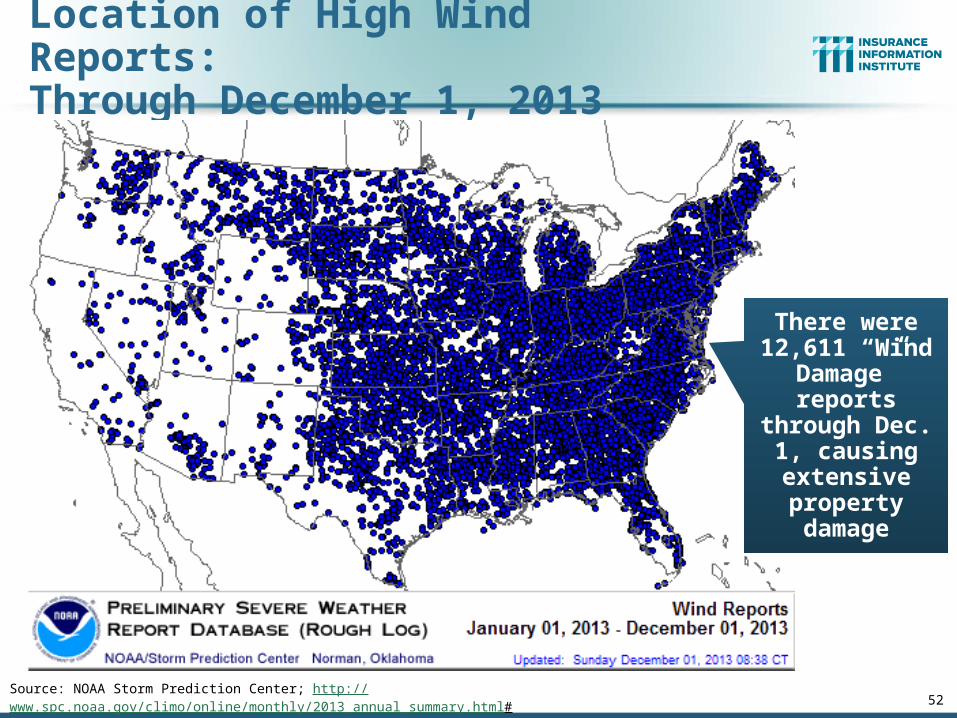
Location of High Wind Reports:Through December 1, 2013
52Source: NOAA Storm Prediction Center; http://www.spc.noaa.gov/climo/online/monthly/2013_annual_summary.html#
There were 12,611 “Wind
Damage” reports through Dec. 1, causing
extensive property damage

Severe Weather Reports:Through December 1, 2013
53Source: NOAA Storm Prediction Center; http://www.spc.noaa.gov/climo/online/monthly/2013_annual_summary.html#
Severe weather reports are
concentrated east of the Rockies
There were 18,994 severe
weather reports through Dec. 1; including 926
tornadoes; 5,456 “Large Hail” reports
and 12,611 high wind events

Public Opinion Survey
54
Disaster Preparedness Issues
54

55
I.I.I. Poll: Homeowners Insurance
Q. Do you think that it is fair that people who live in areas affected by record storms in 2011 and 2012 should pay more for their homeowners insurance in the future?
Source: Insurance Information Institute Annual Pulse Survey.
Nearly 60 percent of Americans believe that homeowners insurance premiums should not be raised as a result of recent storms in their areas.
4%
37%
59%
Don’t know
Yes
No
Public believes it is not fair to raise
premiums of homeowners due
to events they cannot control

56
I.I.I. Poll: Flood Insurance
Source: Insurance Information Institute Annual Pulse Survey.
55%46% 47%
58% 61%
0%
20%
40%
60%
80%
Total U.S. Northeast West Midwest South
Q. The federal government plans to raise the price of flood insurance so it reflects the costs of paying claims. Do you believe this is fair? [% Responding “NO”]
More than one-half of Americans do not think it is fair for the federal government to raise its flood insurance premiums to better reflect claims
payouts.
Most people believe it is unfair for government to raise flood insurance premiums, even though
they are subsidized by taxpayers

57
I.I.I. Poll: Disaster Preparedness
1Asked of those who have homeowners insurance and who responded “yes”.
Source: Insurance Information Institute Annual Pulse Survey.
16%
12%
32%
9%
20%23%
14%
32%
12%
22%24%
16%
29%
10%
21%
0%
5%
10%
15%
20%
25%
30%
35%
40%
Northeast Midwest South West Total U.S.
May-11 May-12 May-13
Q. Does your homeowners policy cover damage from flooding during a hurricane?1
The proportion of homeowners who believe their homeowners policy covers damage from flooding during a hurricane stands at 21 percent. This proportion rises eight percentage points in the South, to 29 percent.
About 20 percent of the public still believes flooding from a hurricane
is covered

58
I.I.I. Poll: Disaster Preparedness
1Asked of those who have homeowners insurance but not flood insurance.
Source: Insurance Information Institute Annual Pulse Survey.
4% 1%5%
0% 3%
96% 99%93%
100% 96%
0%
20%
40%
60%
80%
100%
Northeast Midwest South West Total U.S.
Yes No
Q. Have recent flooding events such as Hurricane Sandy or Hurricane Irene motivated you to buy flood coverage?1
Recent storms have not motivated people to buy flood insurance coverag.e
Despite recent major flood events, few people see the need to buy coverage

59
I.I.I. Poll: Disaster Preparedness
Q. If you expect some relief from the government, do you purchase less insurance coverage against these natural disasters than you would have otherwise?
Source: Insurance Information Institute Annual Pulse Survey.
Seventy-two percent of Americans would not purchase less insurance if they expect some relief from the government—but 22% would.
6%
22%
72%
Don’t know
Yes
No
More than 20 percent cut back
on insurance coverage in
expectation of government disaster aid

Terrorism Update
60
Boston Marathon Bombings Underscore the Need for Extension of the Terrorism
Risk Insurance ProgramDownload III’s Terrorism Insurance Report at: http://www.iii.org/white_papers/terrorism-risk-a-constant-threat-2013.html
60

61
Terrorism Risk Insurance Program
Reauthorization Was a Major Industry Initiative for 2013 Even Before Boston
I.I.I. Testified at First Congressional Hearing on 9/11/12 Provided testimony at NYC hearing on 6/17/13
I.I.I. Accelerated Planned Study on Terrorism Risk and Insurance in the Wake of Boston and Was Well Received Terrorism: A Constant Threat issued in June 2013

Life$1.2 (3%)
Aviation Liability
$4.3 (11%)
Other Liability
$4.9 (12%)
Biz Interruption $13.5 (33%)
Property -WTC 1 & 2*$4.4 (11%) Property -
Other$7.4 (19%)
Aviation Hull$0.6 (2%)
Event Cancellation
$1.2 (3%)Workers Comp
$2.2 (6%)
Total Insured Losses Estimate: $40.0B***Loss total does not include March 2010 New York City settlement of up to $657.5 million to compensate approximately 10,000 Ground Zero workers or any subsequent settlements.
**$32.5 billion in 2001 dollars.
Source: Insurance Information Institute.
Loss Distribution by Type of Insurancefrom Sept. 11 Terrorist Attack ($ 2011)
($ Billions)

64
TRIA Outlook
Difficult Reauthorization Battle Ahead
Very difficult to overcome antigovernment/small government, Tea Party forces in the House
Most Committee members in both houses weren’t around in 2007
House Hearings in 2012; House and Senate in late 2013
If Reauthorized, Insurer Participation Likely Increased
Some Have Attacked TRIA as “Corporate Welfare” In reality the taxpayer is 100% protected NFIP, Crop programs have led to miscomprehensions
Emphasizing Benefits to Employees Under WC is Key
Misperception by Some that Terrorism is Urban Issue
Growth Opportunity: Standalone Cover if No Reauthorization Though limited capacity will not be sufficient to meet need

I.I.I. TRIA Testimony Before US Senate Banking Committee (Sept. 25, 2013)
Robert Hartwig, Future of TRIA Program, U.S. Senate Banking Committee

66
Terrorism Insurance Take-up Rates,By Year, 2003-2012
Source: Marsh Global Analytics, 2013 Terrorism Risk Insurance Report, May 2013.
27%
49%
58% 59% 59% 57%61% 62% 64% 62%
0%
10%
20%
30%
40%
50%
60%
70%
80%
2003 2004 2005 2006 2007 2008 2009 2010 2011 2012
In 2003, the first year TRIA was in effect, the terrorism take-up rate was 27 percent. Since then, it has increased steadily, remaining in the
low 60 percent range since 2009.
Take-up rates for smaller commercial risks are lower—
potentially very low in some areas and industries
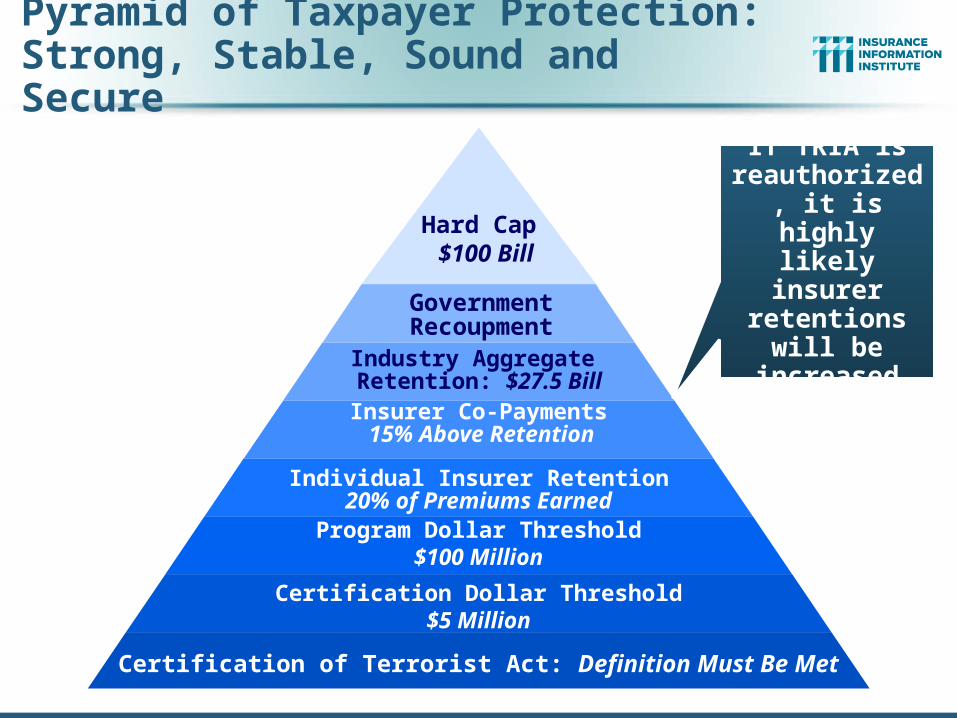
Industry Aggregate Retention: $27.5 Bill
Hard Cap $100 Bill
Government Recoupment
Insurer Co-Payments 15% Above Retention
Individual Insurer Retention20% of Premiums EarnedProgram Dollar Threshold
$100 Million
Certification Dollar Threshold$5 Million
Certification of Terrorist Act: Definition Must Be Met
Pyramid of Taxpayer Protection:Strong, Stable, Sound and Secure
If TRIA is reauthorized, it is highly likely
insurer retentions will be increased

Manmade Disasters & The Tort Environment
72
The Lessons of Deepwater Horizon
72

73
Over the Last Three Decades, Total Tort Costs as a % of GDP Appear Somewhat Cyclical, 1980-2013E
$0
$50
$100
$150
$200
$250
$300
80 82 84 86 88 90 92 94 96 98 00 02 04 06 08 10 12E
To
rt S
ys
tem
Co
sts
1.50%
1.75%
2.00%
2.25%
2.50%
To
rt Co
sts
as
% o
f GD
P
Tort Sytem Costs Tort Costs as % of GDP
($ Billions)
Sources: Towers Watson, 2011 Update on US Tort Cost Trends, Appendix 1A
Tort costs in dollar terms have remained high but relatively stable
since the mid-2000s., but are down substantially as a share of GDP
Deepwater Horizon Spike
in 2010
1.68% of GDP in 2013
2.21% of GDP in 2003
= pre-tort reform peak

Business Leaders Ranking of Liability Systems in 2012
Best States
1. Delaware
2. Nebraska
3. Wyoming
4. Minnesota
5. Kansas
6. Idaho
7. Virginia
8. North Dakota
9. Utah
10. Iowa
Worst States
41. Florida
42. Oklahoma
43. Alabama
44. New Mexico
45. Montana
46. Illinois
47. California
48. Mississippi
49. Louisiana
50. West Virginia
Source: US Chamber of Commerce 2012 State Liability Systems Ranking Study; Insurance Info. Institute.
New in 2012
Wyoming Minnesota Kansas Idaho
Drop-offs
Indiana Colorado Massachusetts South Dakota
Newly Notorious
Oklahoma
Rising Above
Arkansas
74

BP: Deepwater Settlement Process is Rife with Fraud and Abuse
75
BP is sparing no expense to fight what they view as
fraud and abuse in Deepwater Horizon
settlement litigation.
Sources: Full page ads in the Wall Street Journal and New York Times, Dec. 11, 2013 .
Sources: http://www.bp.com/en/global/corporate/gulf-of-mexico-restoration/investigations-and-legal-proceedings/US-legal-proceedings.html extracted Dec. 11, 2013; Insurance Information Institute.

www.iii.org
Thank you for your timeand your attention!
Twitter: twitter.com/bob_hartwigDownload at www.iii.org/presentations
Insurance Information Institute Online:
76