Embed Size (px)
Citation preview

What’s Killing Farmers in Canada
Don Voaklander, PhD for
The CAIR Collaborators
2
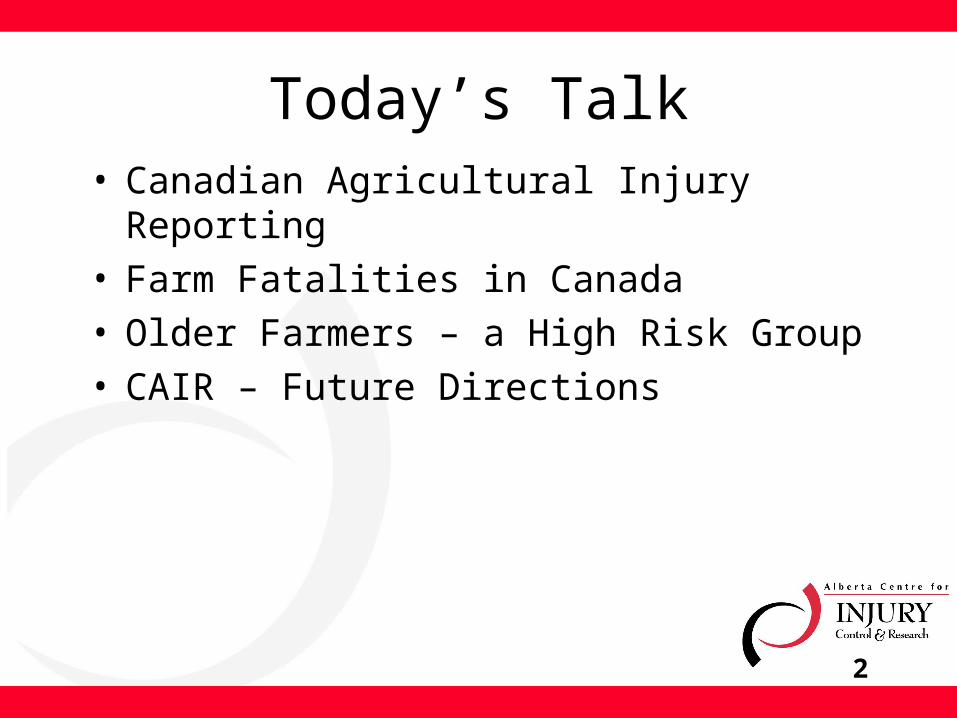
Today’s Talk• Canadian Agricultural Injury Reporting• Farm Fatalities in Canada• Older Farmers – a High Risk Group• CAIR – Future Directions
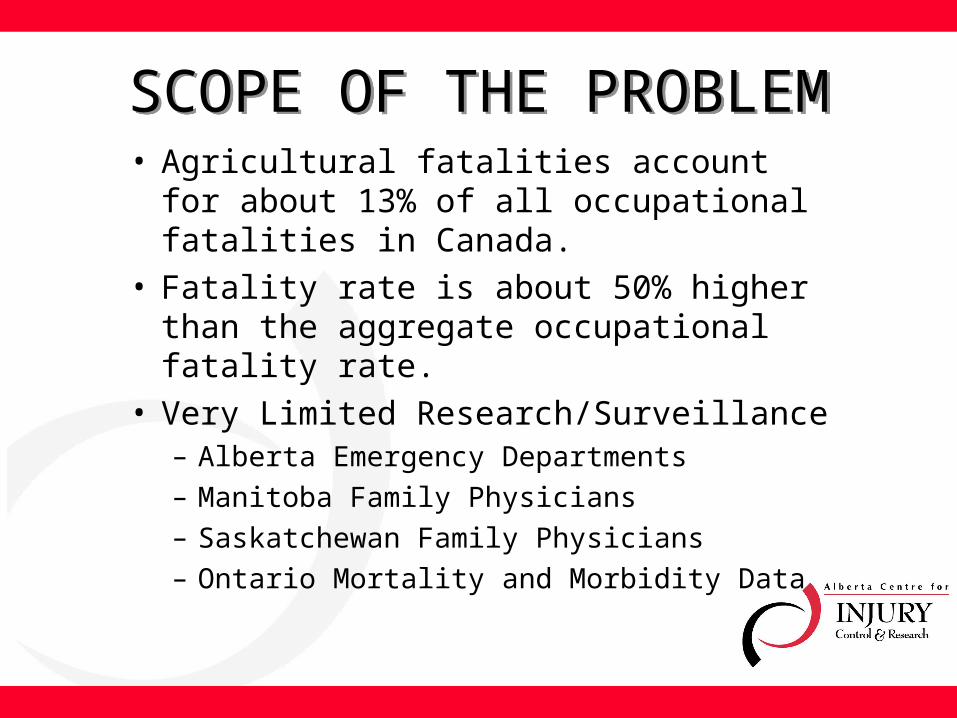
SCOPE OF THE PROBLEMSCOPE OF THE PROBLEM• Agricultural fatalities account for about 13%
of all occupational fatalities in Canada.• Fatality rate is about 50% higher than the
aggregate occupational fatality rate.• Very Limited Research/Surveillance
– Alberta Emergency Departments
– Manitoba Family Physicians
– Saskatchewan Family Physicians
– Ontario Mortality and Morbidity Data
SCOPE OF THE PROBLEMSCOPE OF THE PROBLEM
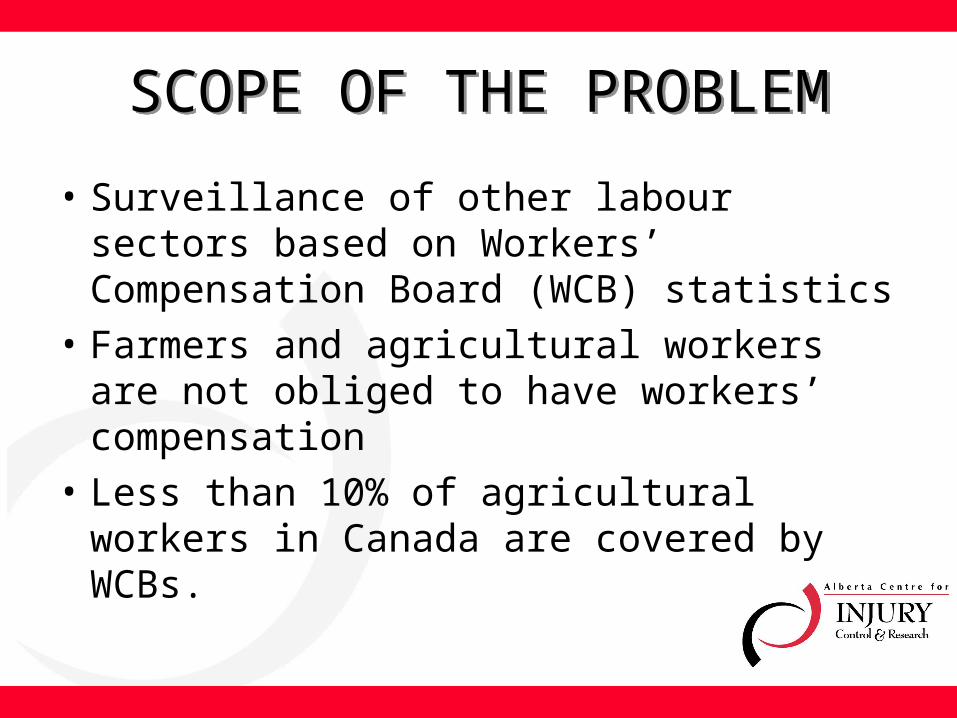
• Surveillance of other labour sectors based on Workers’ Compensation Board (WCB) statistics
• Farmers and agricultural workers are not obliged to have workers’ compensation
• Less than 10% of agricultural workers in Canada are covered by WCBs.
CANADIAN AGRICULTURAL INJURY REPORTING
CANADIAN AGRICULTURAL INJURY REPORTING
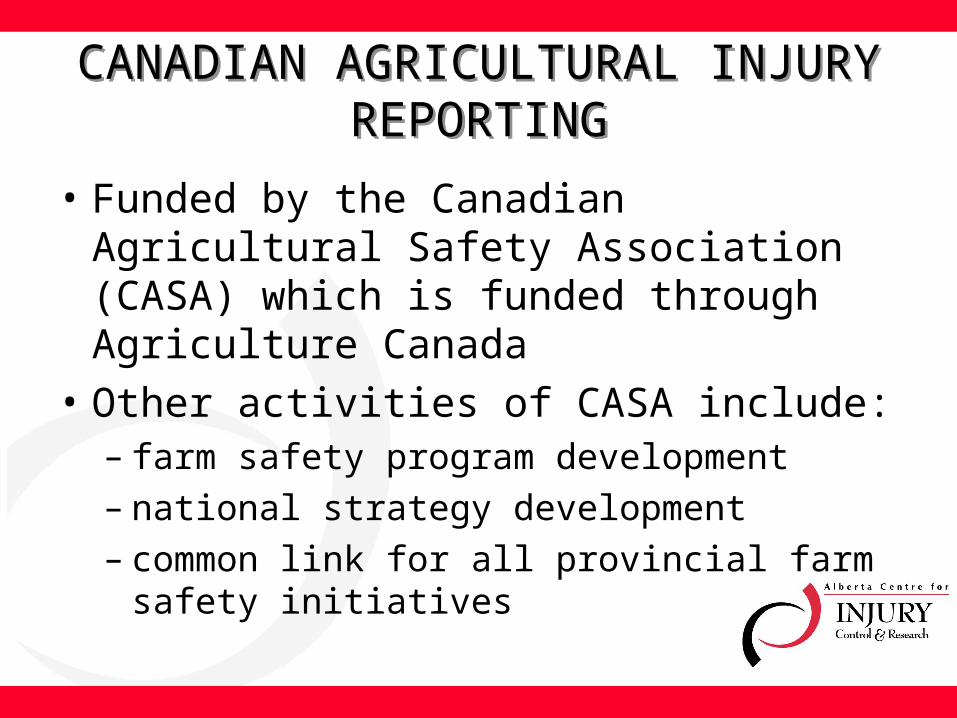
• Funded by the Canadian Agricultural Safety Association (CASA) which is funded through Agriculture Canada
• Other activities of CASA include:– farm safety program development– national strategy development– common link for all provincial farm safety
initiatives
CANADIAN AGRICULTURAL INJURY REPORTING
CANADIAN AGRICULTURAL INJURY REPORTING
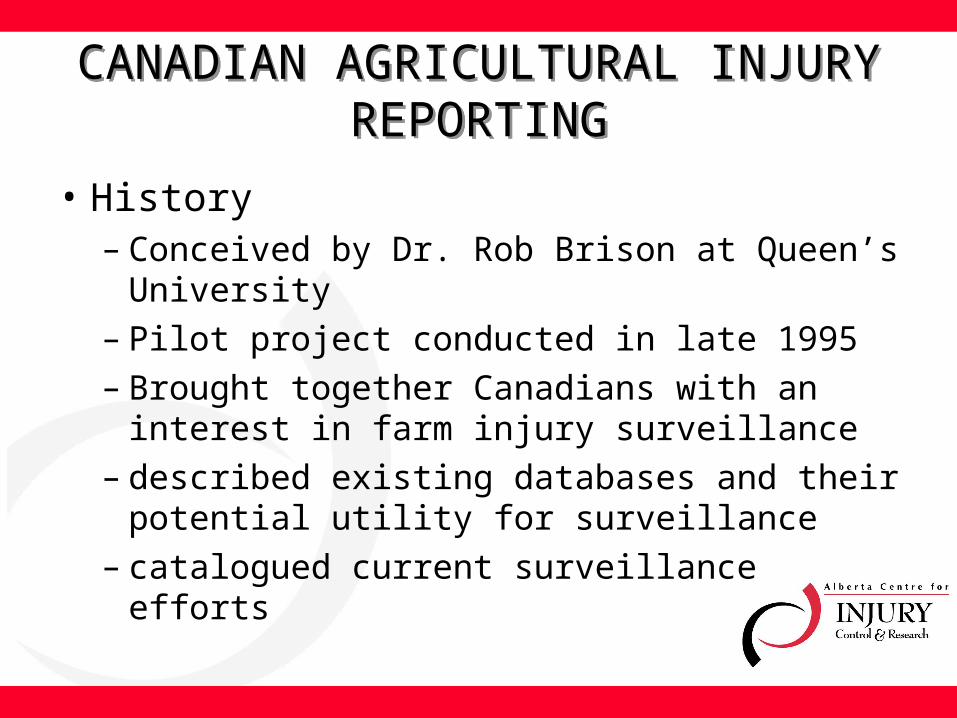
• History– Conceived by Dr. Rob Brison at Queen’s
University– Pilot project conducted in late 1995– Brought together Canadians with an interest in
farm injury surveillance– described existing databases and their potential
utility for surveillance– catalogued current surveillance efforts
CANADIAN AGRICULTURAL INJURY REPORTING
CANADIAN AGRICULTURAL INJURY REPORTING
• History (cont.)– As of January, 1997, all provinces as well as
representatives of the federal government involved.
– Broad base of experience, with representatives from the labour, agriculture, and university communities.
CANADIAN AGRICULTURAL INJURY REPORTING
CANADIAN AGRICULTURAL INJURY REPORTING
• Objectives– To develop a coordinated system for the
assembly of national farm injury surveillance data.
– To ensure that the collected information is interpreted and communicated in forms that are acceptable to potential data users in the agricultural industry
– To ensure that the surveillance system is sustained.
CAIR - METHODSCAIR - METHODS
• Denominator - all persons who either live or work on a Canadian farm that produces:– crops, livestock, poultry, animal products,
greenhouse or nursery products, mushrooms, sod, honey, or maple syrup
CAIR - METHODSCAIR - METHODS
• Fatality Data - Definition– Any accidental injury resulting in death that
occurred during activities related to the operation of a farm or that involved any hazard of a farm environment.
– This includes motor vehicles that are being used for farm work.
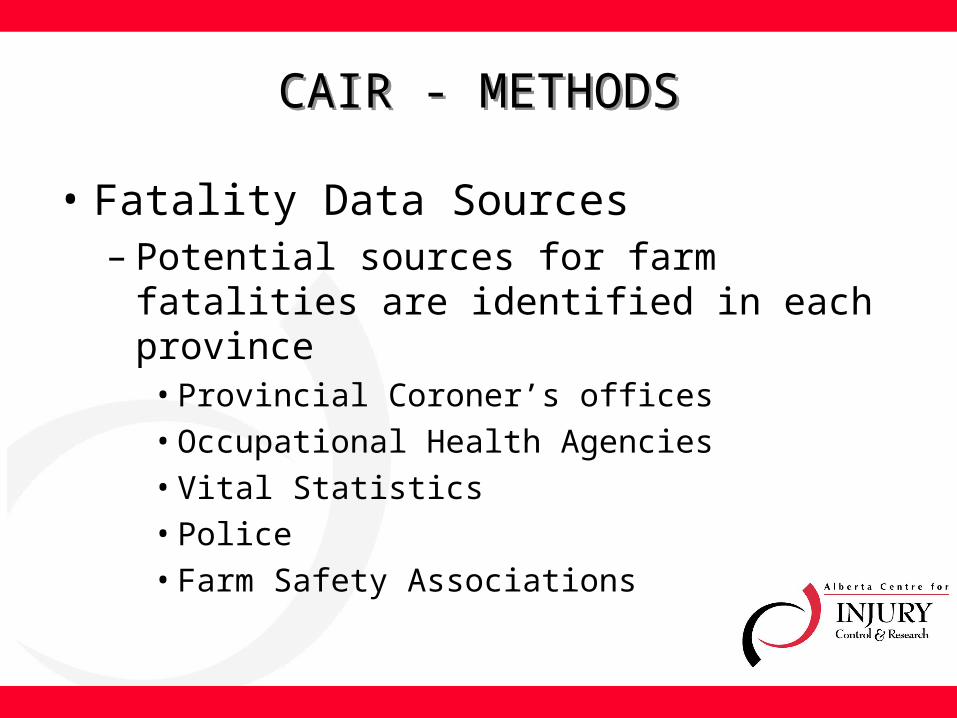
CAIR - METHODSCAIR - METHODS
• Fatality Data Sources– Potential sources for farm fatalities are identified
in each province• Provincial Coroner’s offices
• Occupational Health Agencies
• Vital Statistics
• Police
• Farm Safety Associations
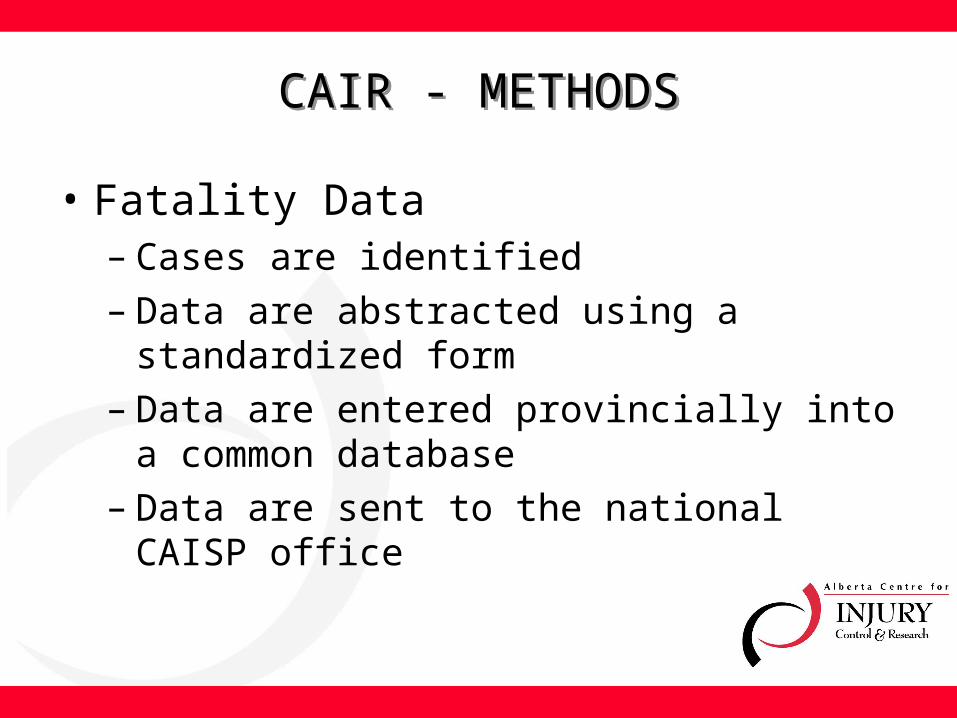
CAIR - METHODSCAIR - METHODS
• Fatality Data– Cases are identified– Data are abstracted using a standardized form– Data are entered provincially into a common
database– Data are sent to the national CAISP office
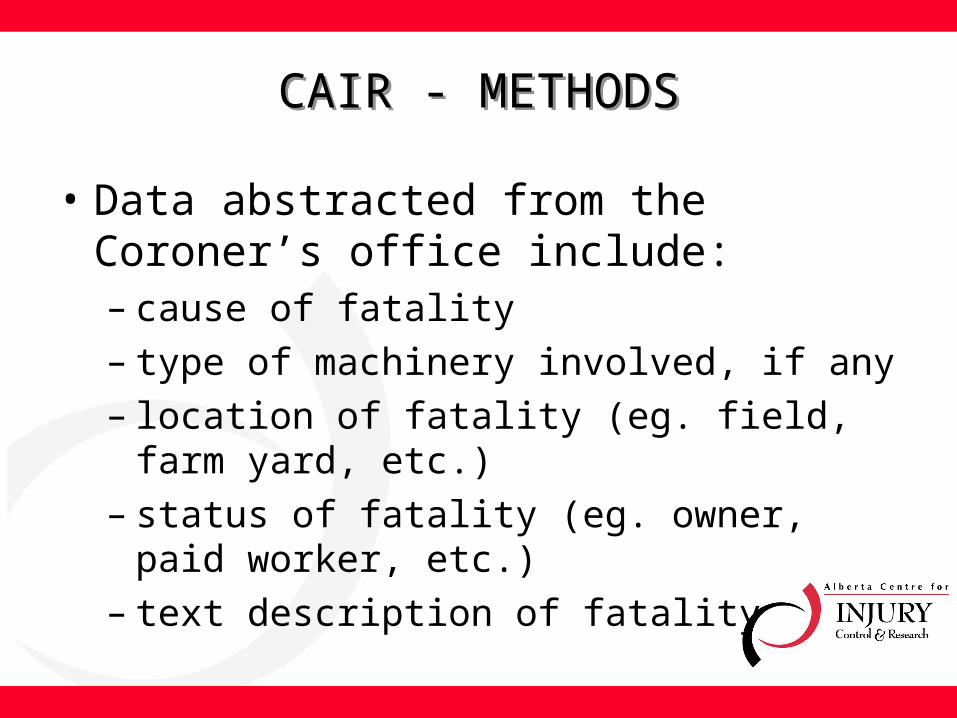
CAIR - METHODSCAIR - METHODS
• Data abstracted from the Coroner’s office include:– cause of fatality– type of machinery involved, if any– location of fatality (eg. field, farm yard, etc.)– status of fatality (eg. owner, paid worker, etc.)– text description of fatality

14
Latest Developments• Re-branding of CAISP into CAIR – Canadian
Agriculture Injury Reporting
• Transfer of CAIR from Queen’s University to the University of Alberta
15
FARM FATALIES IN CANADA
FARM FATALIES IN CANADA
16
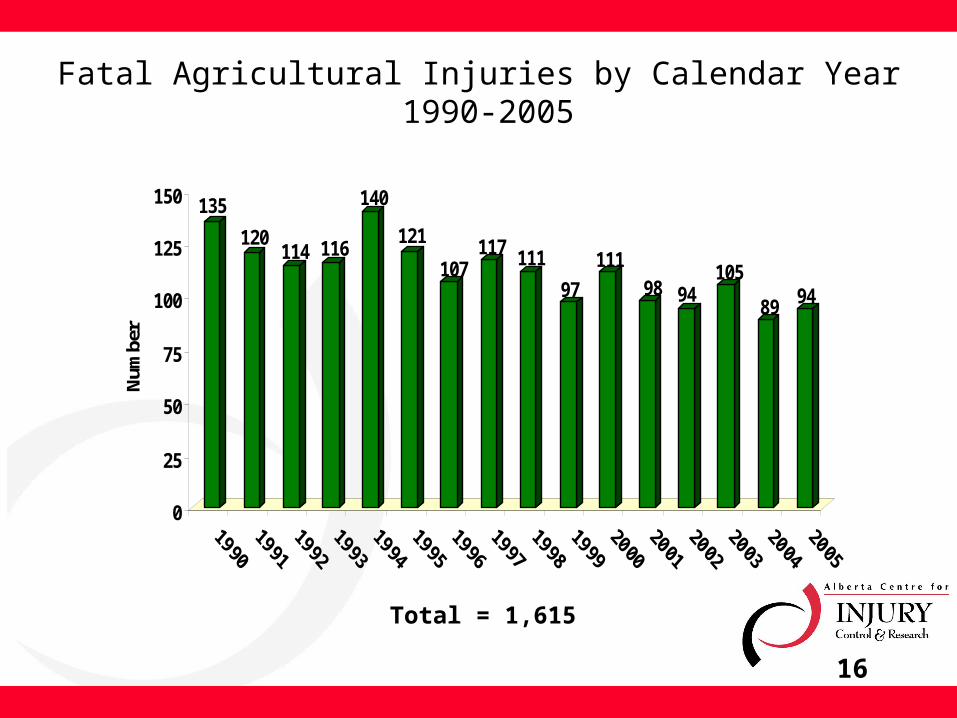
Fatal Agricultural Injuries by Calendar Year 1990-2005
135
120114 116
140
121
107117 111
97
11198 94
105
89 94
0
25
50
75
100
125
150
Num
ber
Total = 1,615
17
0
20
40
60
80
100
120
140
90-94
91-95
92-96
93-97
94-98
95-99
96-00
97-01
98-02
99-03
00-04
01-05
Time period
Nu
mb
er
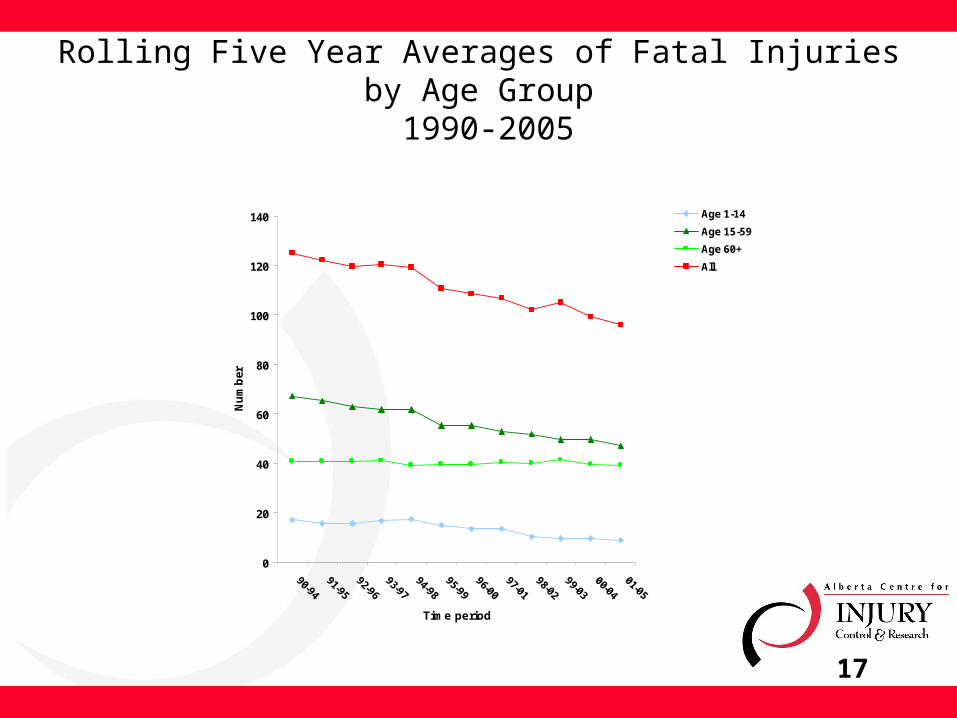
Age 1-14
Age 15-59
Age 60+
All
Rolling Five Year Averages of Fatal Injuries by Age Group 1990-2005
18
0.0
5.0
10.0
15.0
20.0
25.0
Year
Rat
e p
er 1
00,0
00 A
gric
ult
ure
Po
pu
lati
on
0
20
40
60
80
100
120
140
160
Nu
mb
er o
f F
atal
itie
s
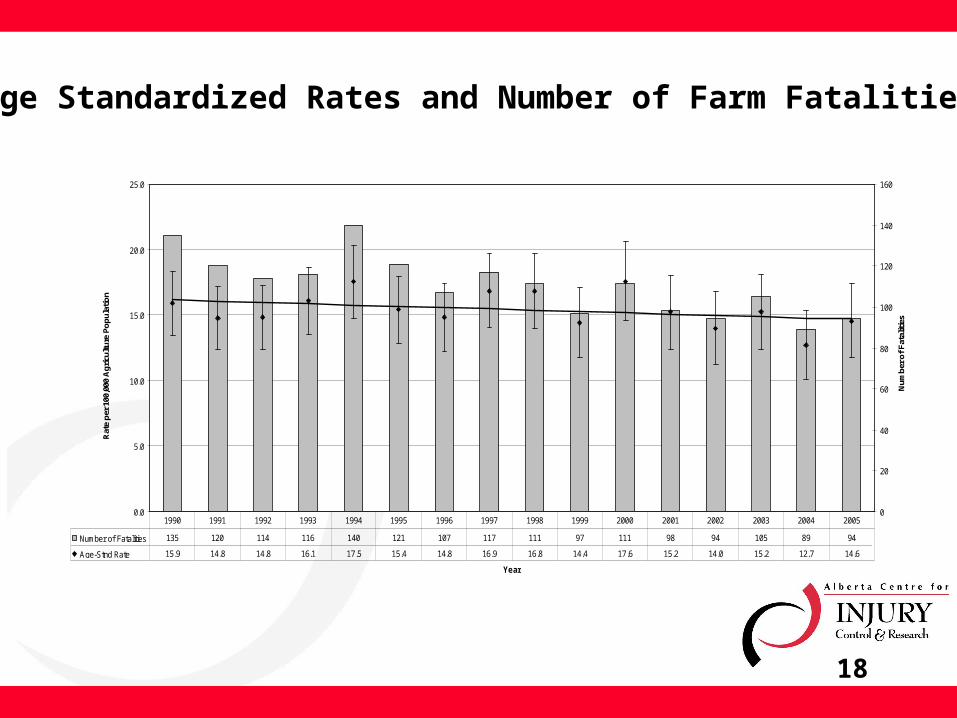
Number of Fatalities 135 120 114 116 140 121 107 117 111 97 111 98 94 105 89 94
Age-Stnd Rate 15.9 14.8 14.8 16.1 17.5 15.4 14.8 16.9 16.8 14.4 17.6 15.2 14.0 15.2 12.7 14.6
1990 1991 1992 1993 1994 1995 1996 1997 1998 1999 2000 2001 2002 2003 2004 2005
Age Standardized Rates and Number of Farm Fatalities
19
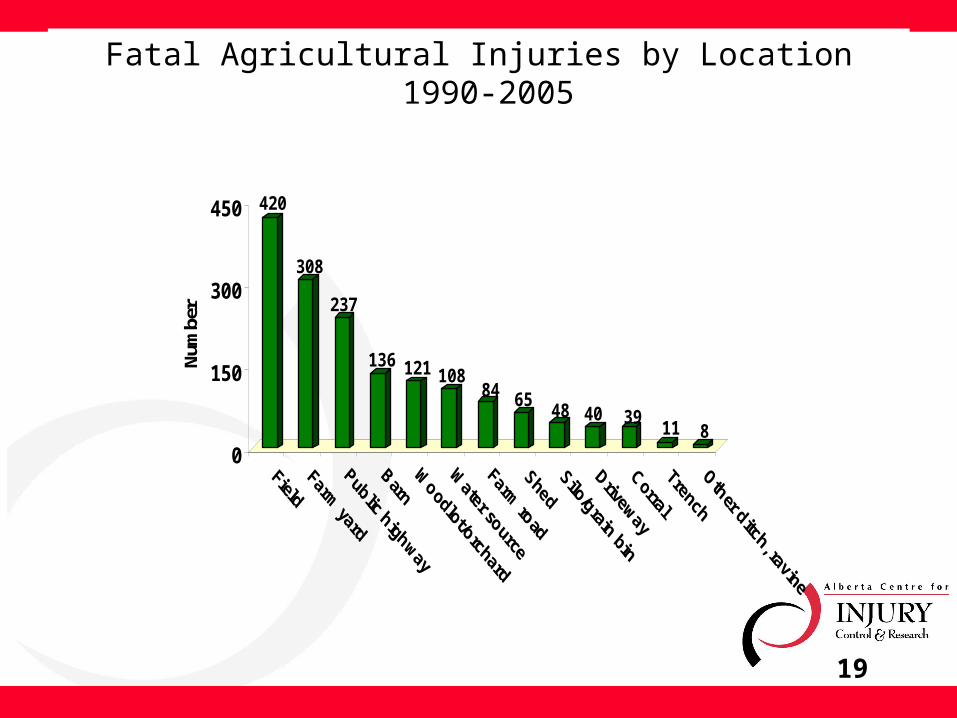
Fatal Agricultural Injuries by Location 1990-2005
420
308
237
136 121 10884 65
48 40 3911 8
0
150
300
450N
umbe
r
20
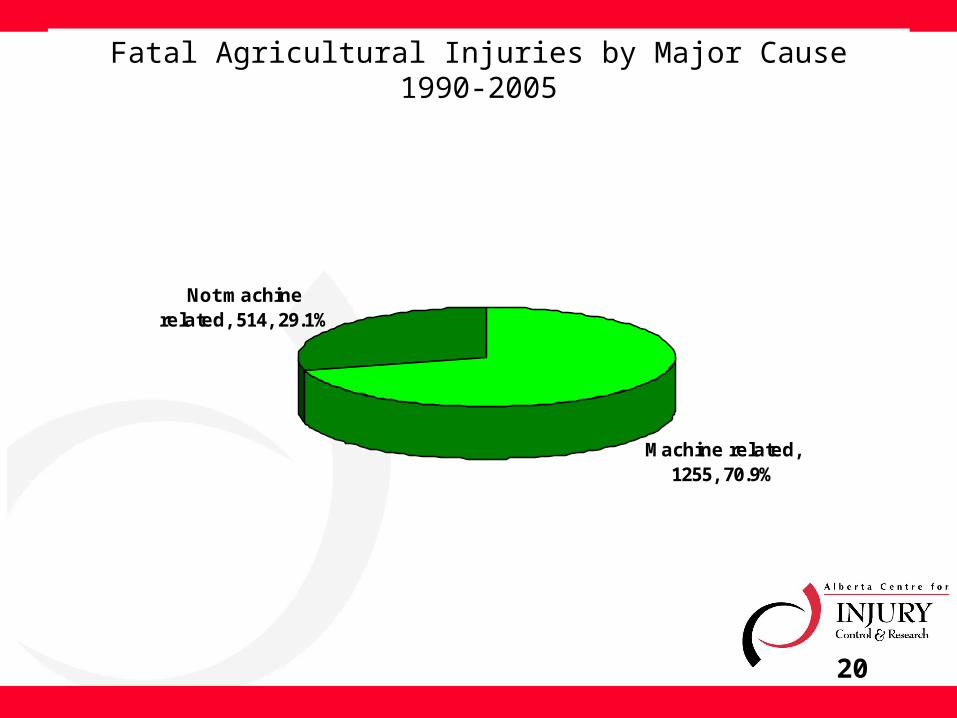
Fatal Agricultural Injuries by Major Cause1990-2005
Not machine related, 514, 29.1%
Machine related, 1255, 70.9%
21
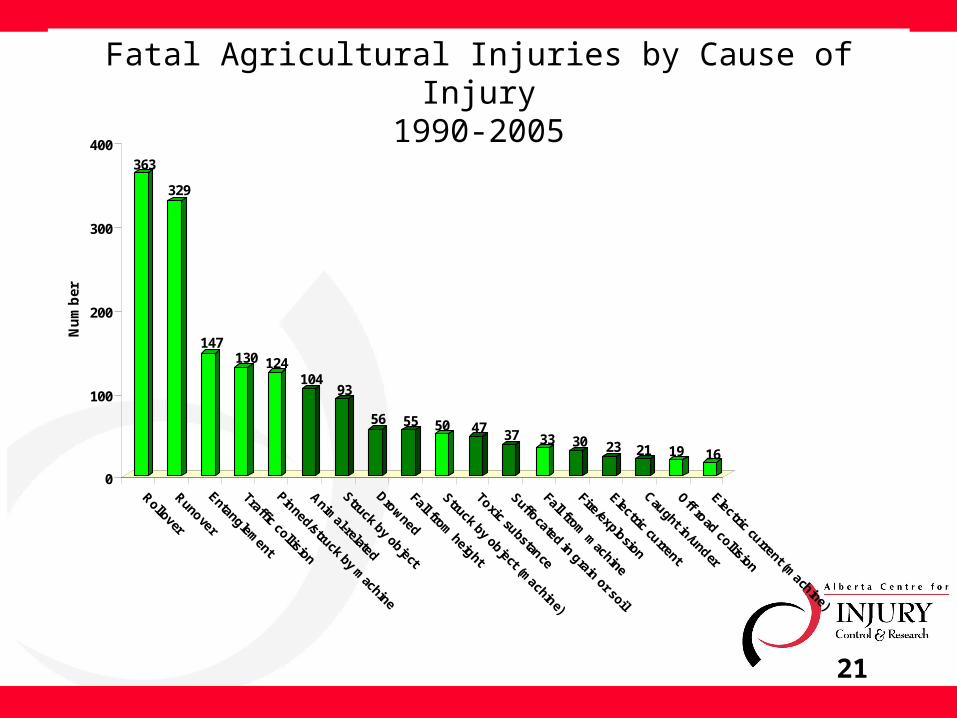
Fatal Agricultural Injuries by Cause of Injury1990-2005
363
329
147130 124
10493
56 55 50 47 37 33 30 23 21 19 16
0
100
200
300
400
Nu
mb
er
22
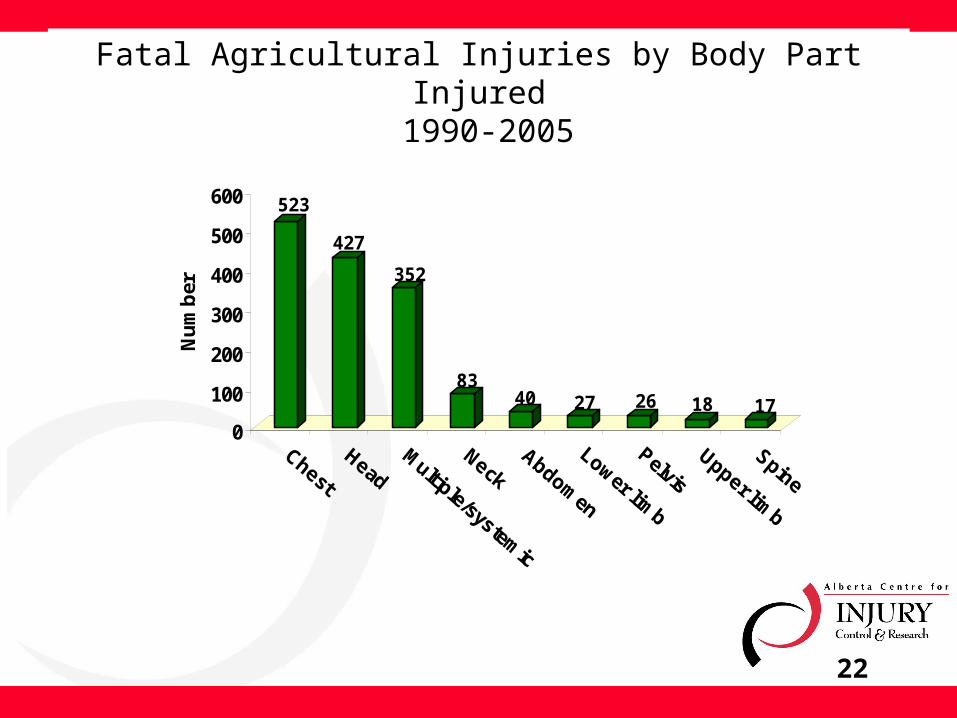
Fatal Agricultural Injuries by Body Part Injured 1990-2005
523
427
352
8340 27 26 18 17
0
100
200
300
400
500
600N
um
ber
23
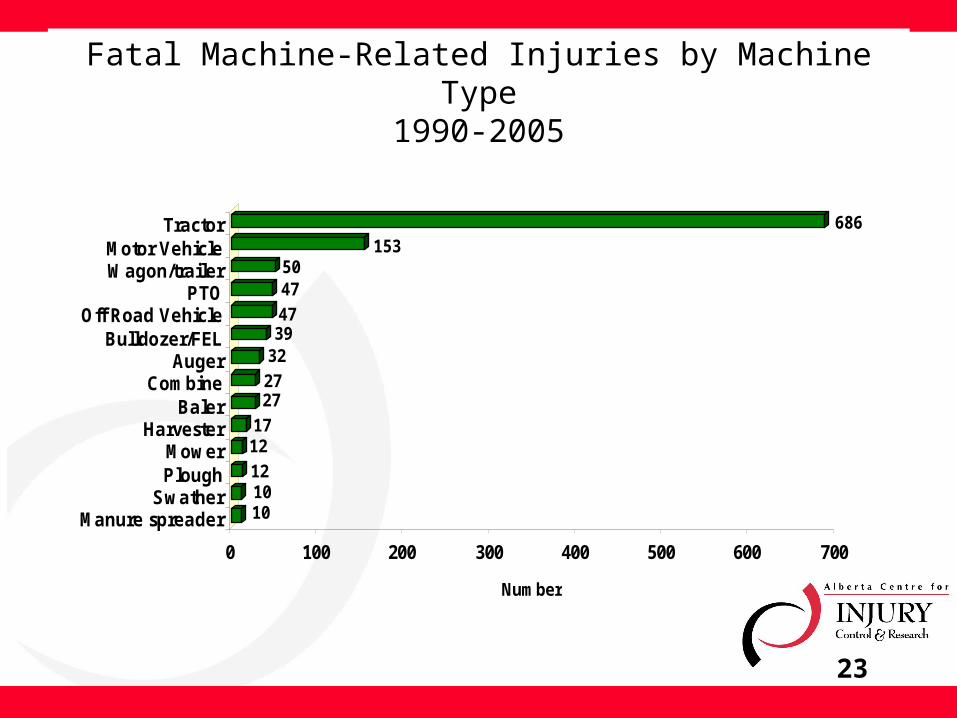
Fatal Machine-Related Injuries by Machine Type1990-2005
101012
1217
2727
323947
4750
153686
0 100 200 300 400 500 600 700
Number
Manure spreaderSwather
PloughMower
HarvesterBaler
CombineAuger
Bulldozer/FELOff Road Vehicle
PTOWagon/trailerMotor Vehicle
Tractor
24
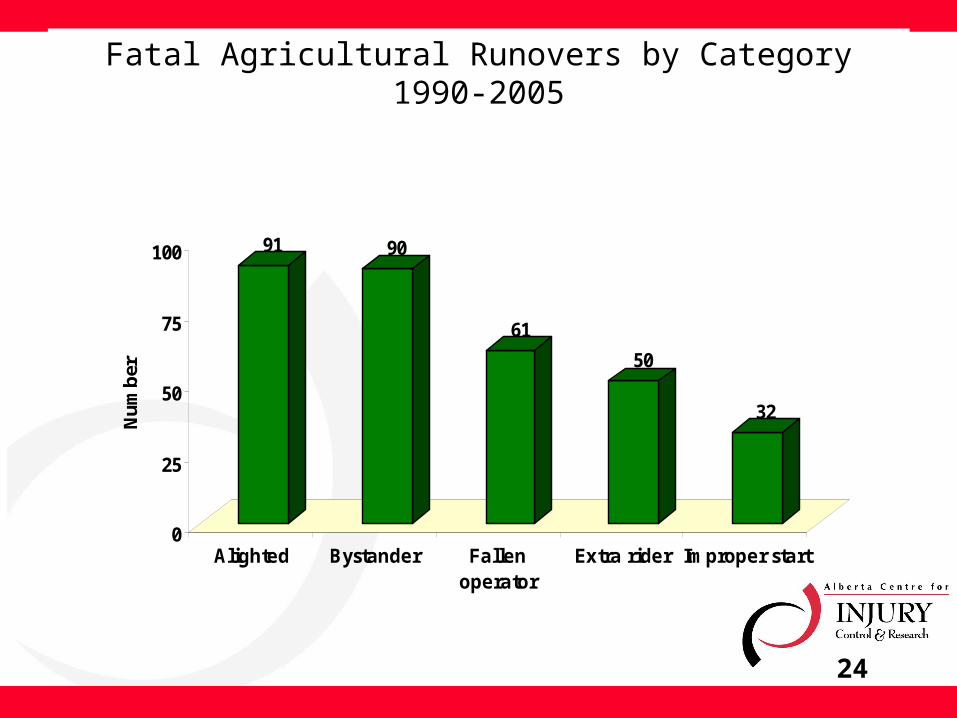
Fatal Agricultural Runovers by Category1990-2005
91 90
61
50
32
0
25
50
75
100
Nu
mb
er
Alighted Bystander Fallenoperator
Extra rider Improper start
25
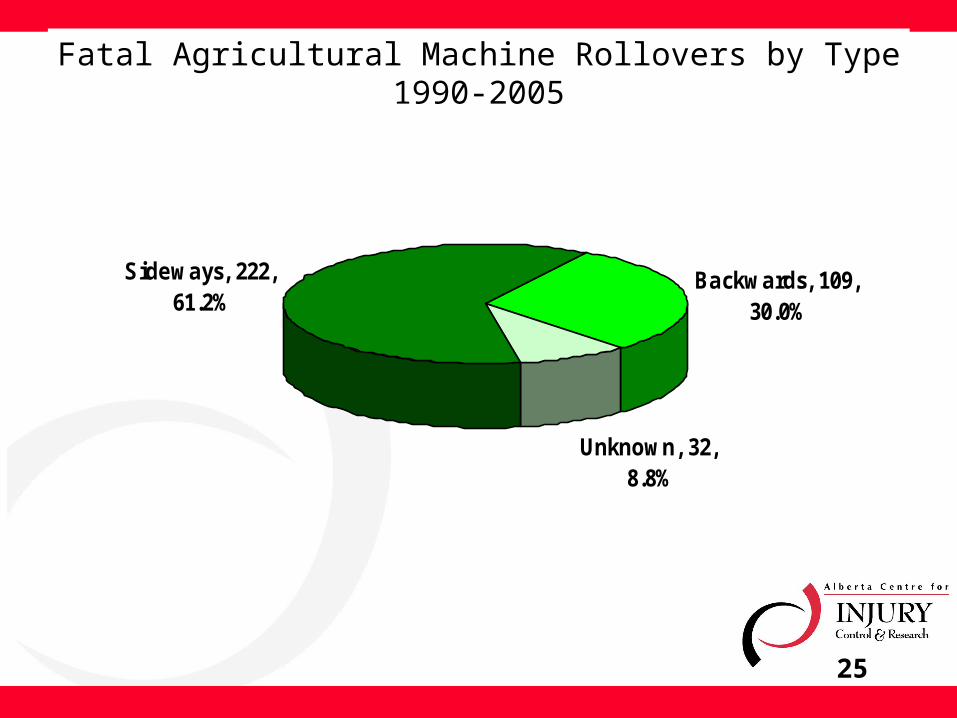
Fatal Agricultural Machine Rollovers by Type1990-2005
Sideways, 222, 61.2%
Backwards, 109, 30.0%
Unknown, 32, 8.8%
26
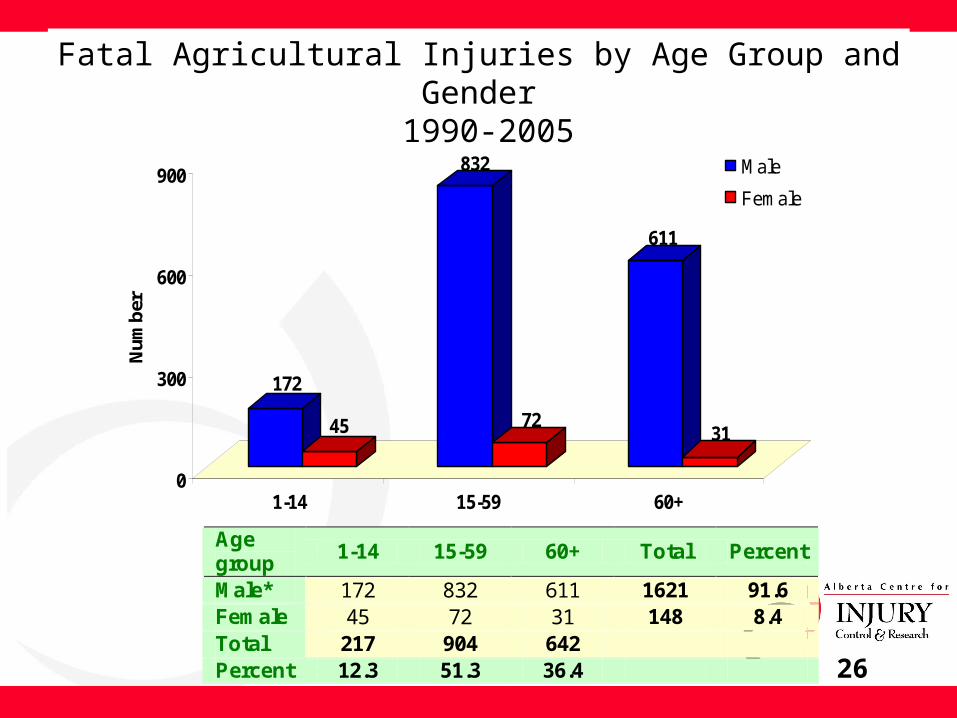
Fatal Agricultural Injuries by Age Group and Gender 1990-2005
172
45
832
72
611
31
0
300
600
900
Nu
mb
er
1-14 15-59 60+
Male
Female
Age group
1-14 15-59 60+ Total Percent
Male* 172 832 611 1621 91.6 Female 45 72 31 148 8.4 Total 217 904 642 Percent 12.3 51.3 36.4
27
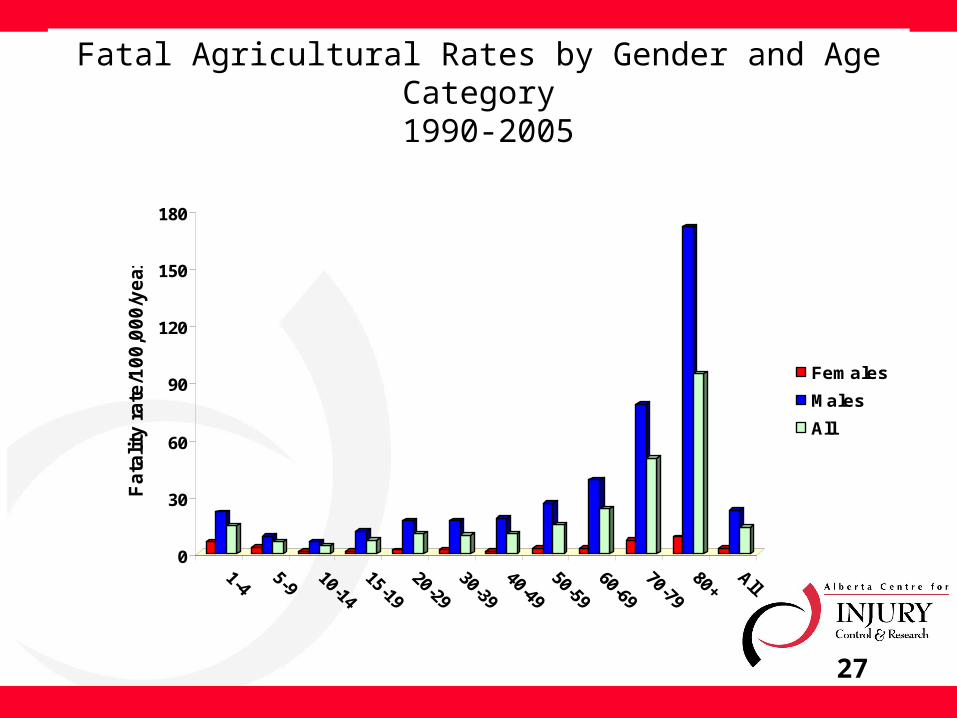
Fatal Agricultural Rates by Gender and Age Category 1990-2005
0
30
60
90
120
150
180
Fa
tali
ty r
ate
/10
0,0
00
/ye
ar
Females
Males
All

28
Older Farmers – A High Risk Group
29
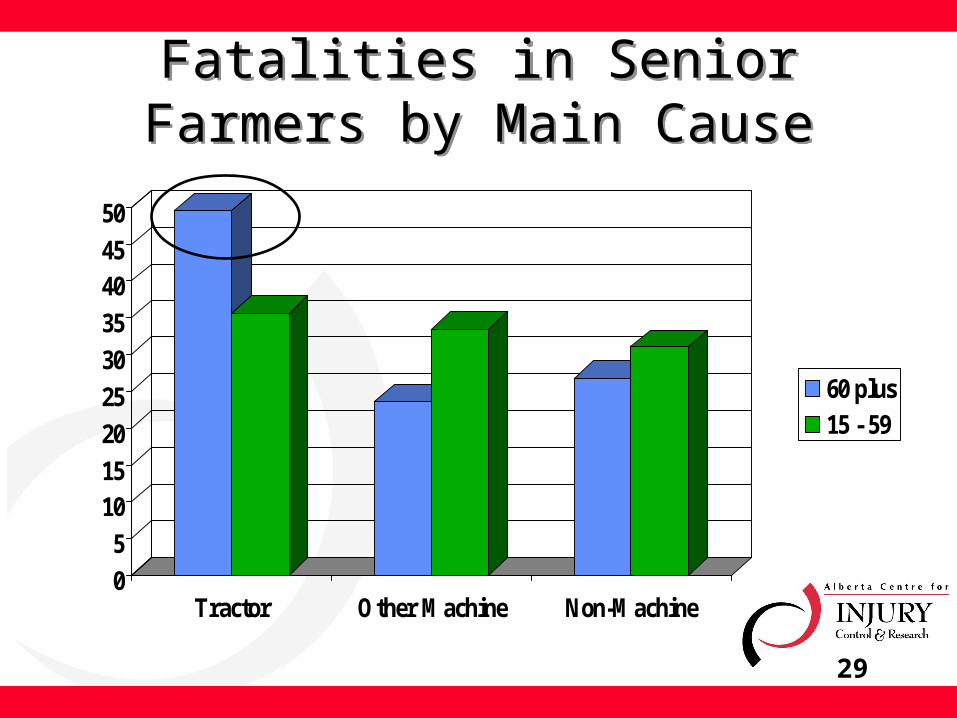
Fatalities in Senior Farmers by Main Cause
Fatalities in Senior Farmers by Main Cause
0
5
1015
20
25
30
35
4045
50
Tractor Other Machine Non-Machine
60 plus15 - 59
30
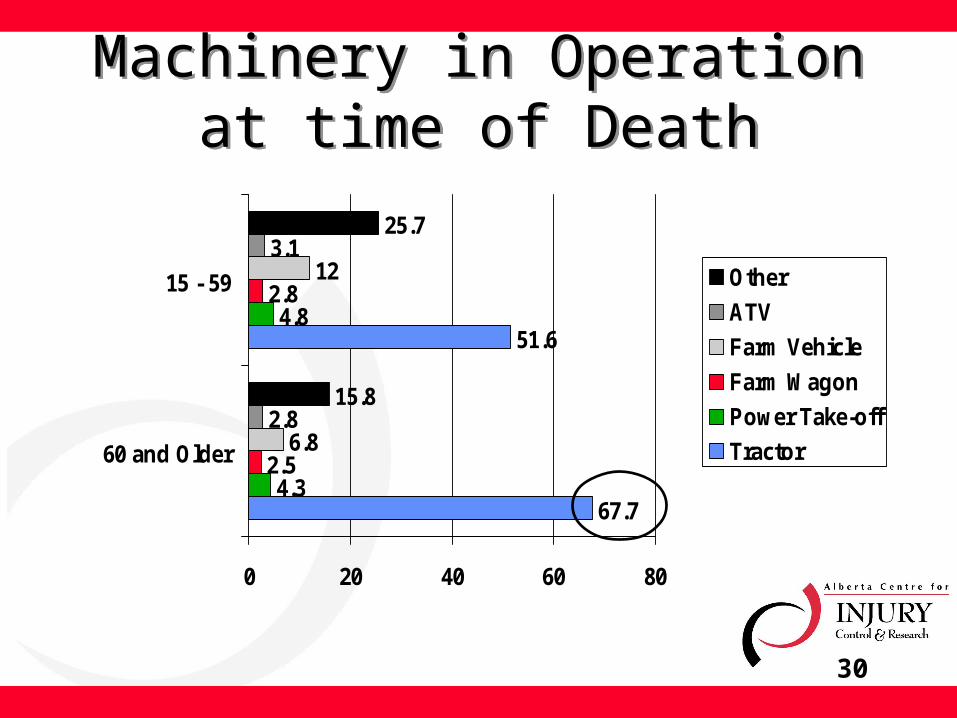
Machinery in Operation at time of Death
Machinery in Operation at time of Death
67.7
51.6
4.3
4.8
2.5
2.8
6.8
12
2.8
3.1
15.8
25.7
0 20 40 60 80
60 and Older
15 - 59 Other
ATV
Farm Vehicle
Farm Wagon
Power Take-off
Tractor
31
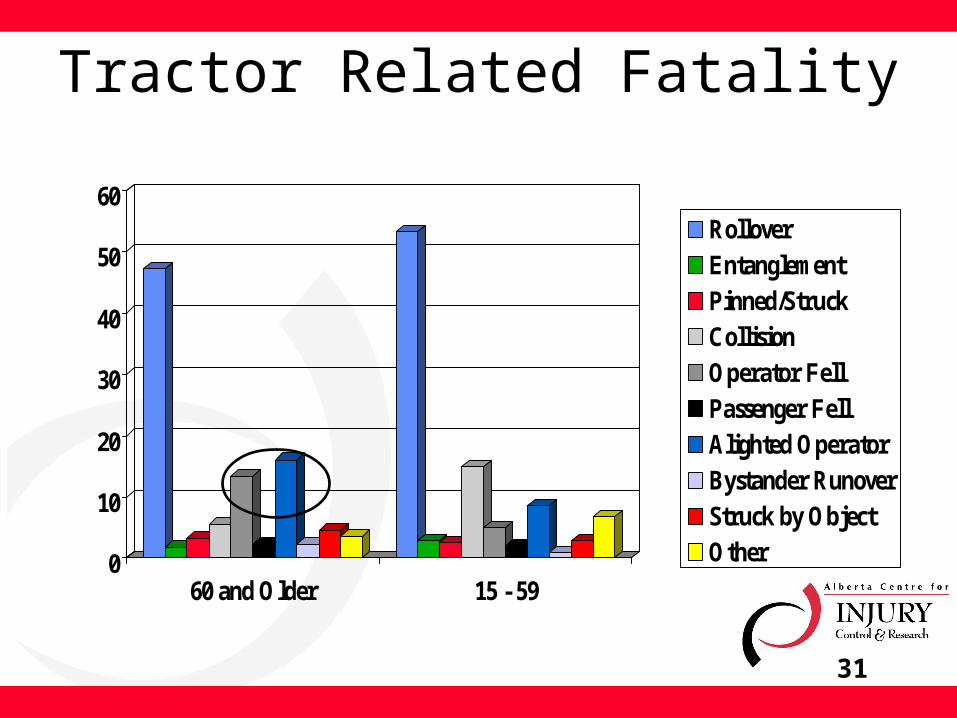
Tractor Related Fatality
0
10
20
30
40
50
60
60 and Older 15 - 59
RolloverEntanglementPinned/StruckCollisionOperator FellPassenger FellAlighted OperatorBystander RunoverStruck by ObjectOther
32
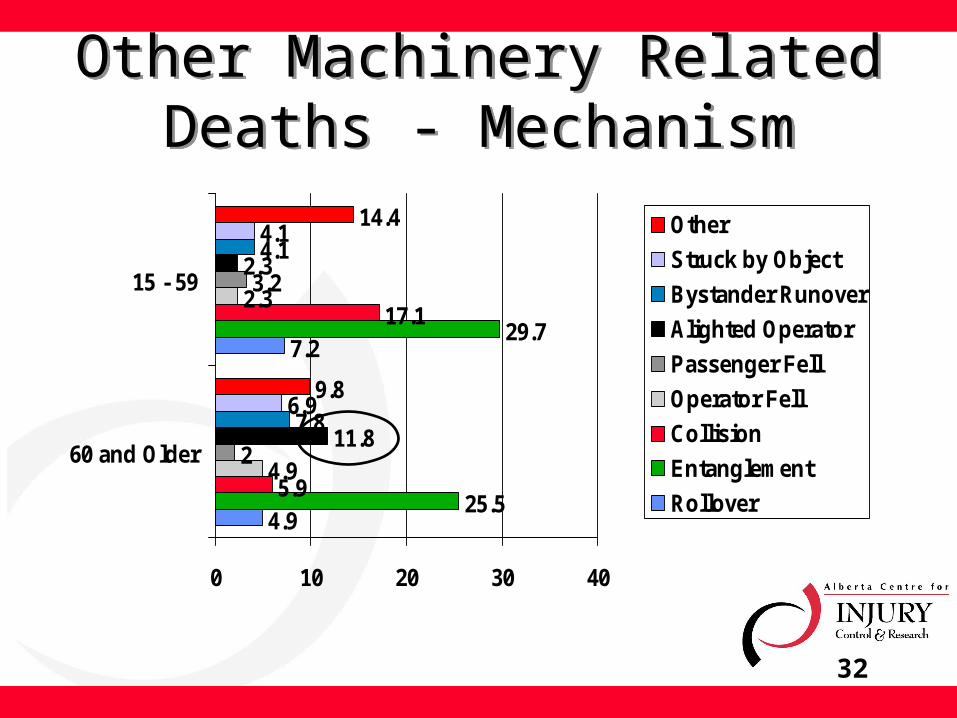
Other Machinery Related Deaths - Mechanism
Other Machinery Related Deaths - Mechanism
4.9
7.2
25.5
29.7
5.9
17.1
4.9
2.3
2
3.2
11.8
2.3
7.8
4.1
6.9
4.1
9.8
14.4
0 10 20 30 40
60 and Older
15 - 59
Other
Struck by Object
Bystander Runover
Alighted Operator
Passenger Fell
Operator Fell
Collision
Entanglement
Rollover
33
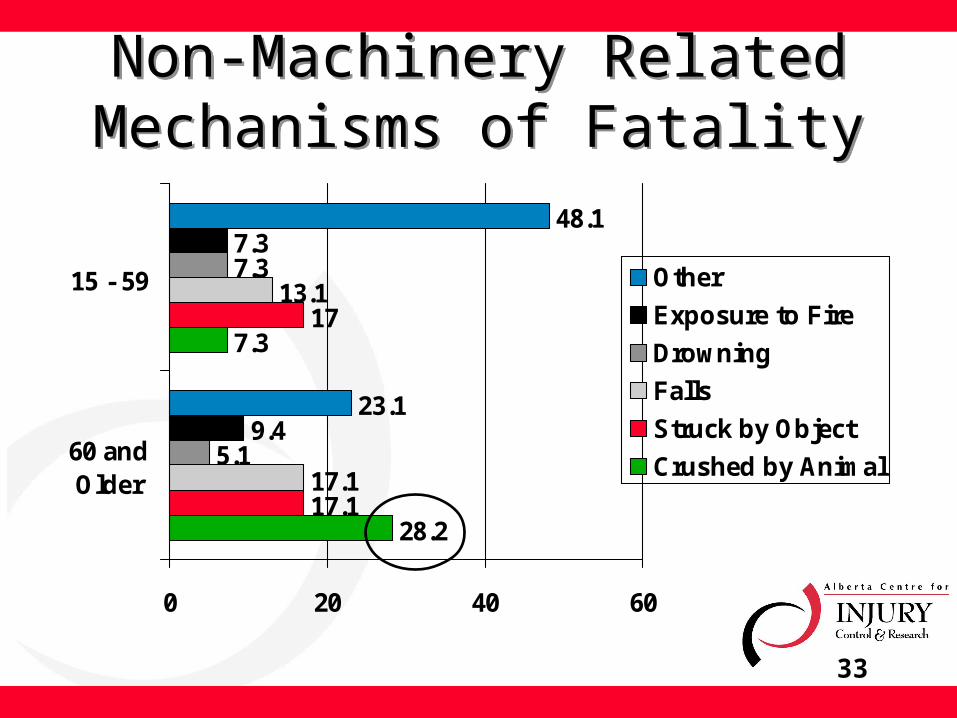
Non-Machinery Related Mechanisms of FatalityNon-Machinery Related Mechanisms of Fatality
28.2
7.3
17.1
17
17.1
13.1
5.1
7.3
9.4
7.3
23.1
48.1
0 20 40 60
60 andOlder
15 - 59 Other
Exposure to Fire
Drowning
Falls
Struck by Object
Crushed by Animal
34
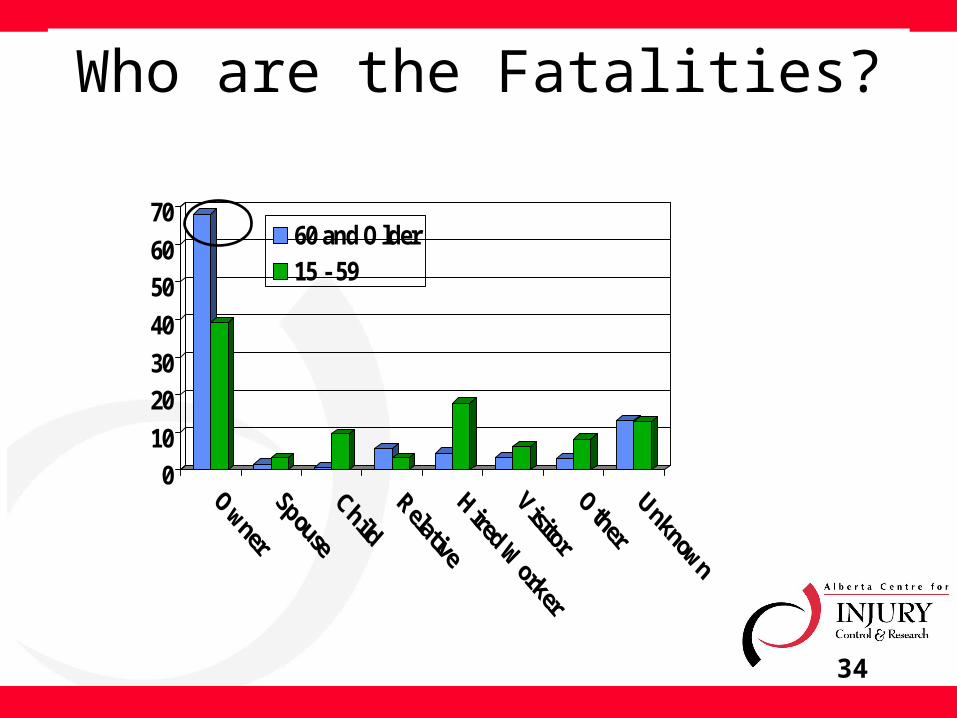
Who are the Fatalities?
0
10
20
30
40
50
60
7060 and Older15 - 59
35
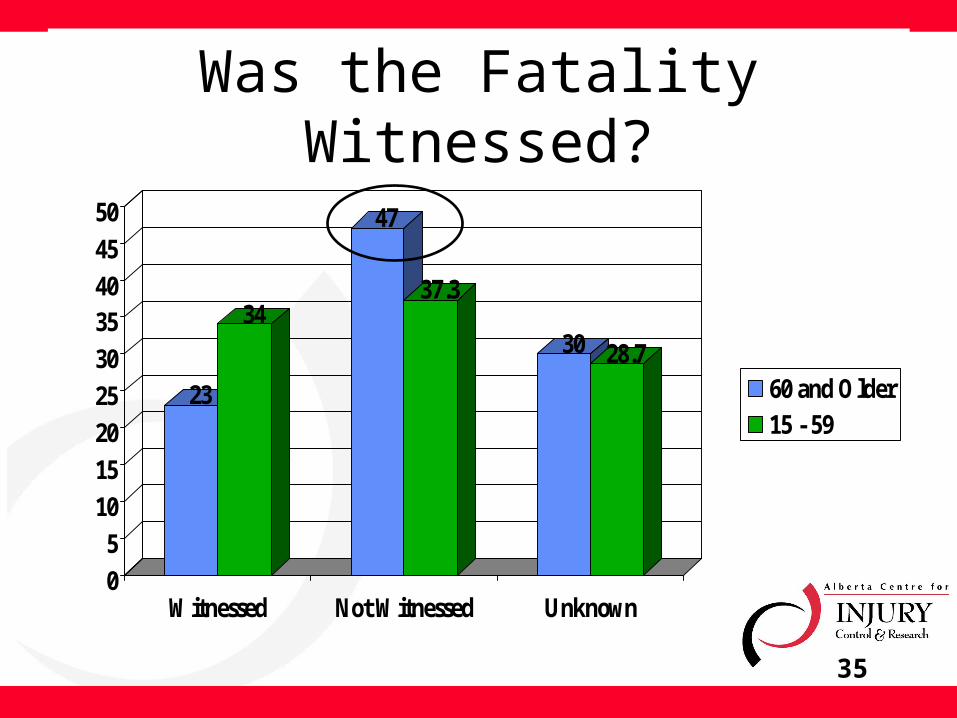
Was the Fatality Witnessed?
23
34
47
37.3
30 28.7
0
5
10
15
20
25
30
3540
45
50
Witnessed Not Witnessed Unknown
60 and Older15 - 59
Major FindingsMajor Findings
• Older farmers continue to be at a greater risk of death and injury as a result of their participation in farm activities.
• There appears to be differences in the distribution of causes of injury/fatality
• There are differences by farmer status that may contribute to fatality and injury
37
Farmer Status
• Large Male:Female Ratios– Fatalities – 25:1
• Older farmer fatalities– Owner/operators– Working alone
38
Recommendations
• More research examining older farmers’ exposure to hazards
• Older farmers should avoid working alone• Long hours running machinery should be avoided• Falls are an issue for all seniors
– Tasks where dynamic balance is needed should be avoided.
• Engineering solutions may help prevent falls off of machinery – safe access platforms
• More research into health status of older farmers
39
Future Directions for CAIR
• Re-institute hospital level data collection– Process similar to fatality data– Collection ceased in most provinces in 2000
• Work closely with the Public Health Agency of Canada– Sustainable funding– Integration with other health surveillance systems
40
THANK YOU