Embed Size (px)
Citation preview
What’s in Your Creek?
Results of the 2009 Clackamas Basin Volunteer Monitoring Effort.
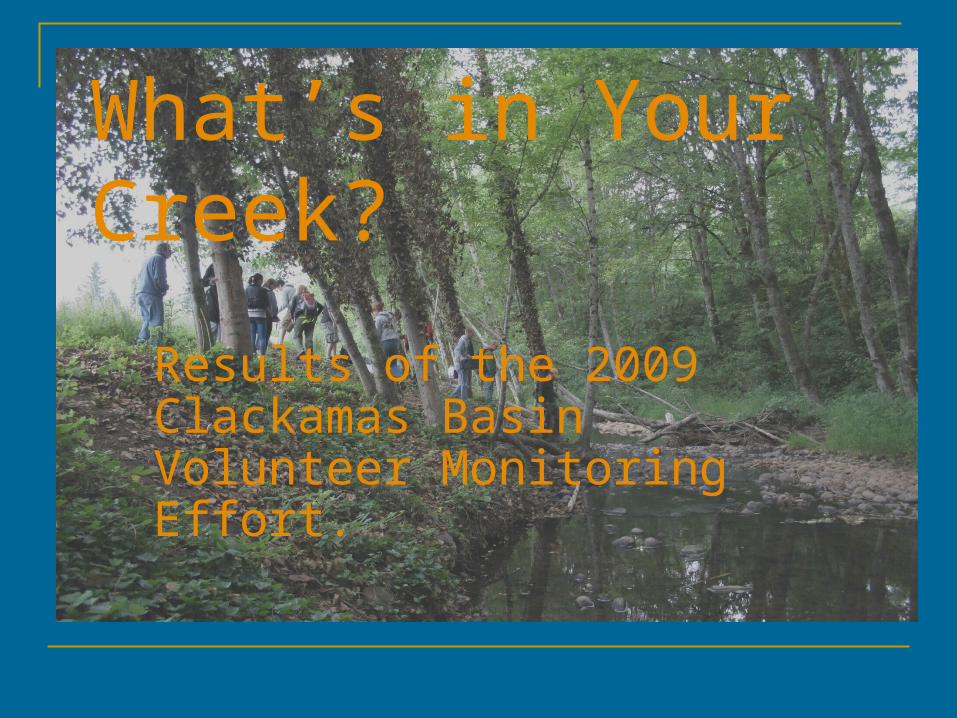
What is SWRP?
Student Watershed Research Project Started 1991
Saturday Academy National Science Foundation
Monitoring program Watershed education Data collection
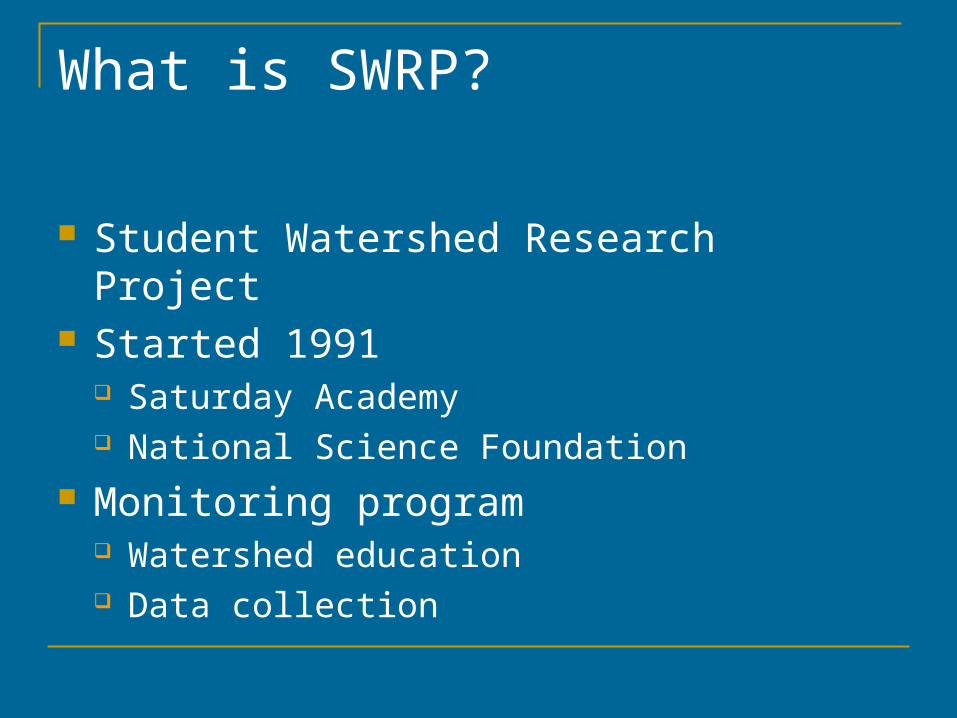
SWRP Goals
Accuracy & Reliability Reporting student findings Managing data Providing
Training Equipment Technical supplies
The Importance of Continuous Monitoring
Urbanization & agriculture Critical habitats
Short term fluctuations Maintaining a record Can help to determine the success or failure
of remediation measures

Day In Damascus – July 25, 2009
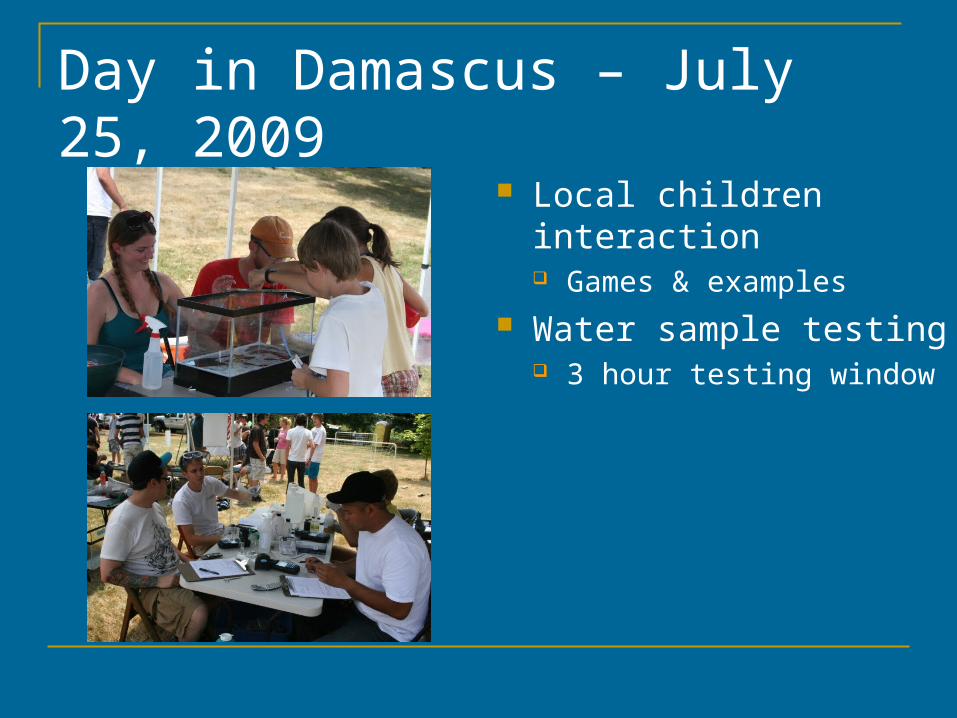
Day in Damascus – July 25, 2009
Local children interaction Games & examples
Water sample testing 3 hour testing window
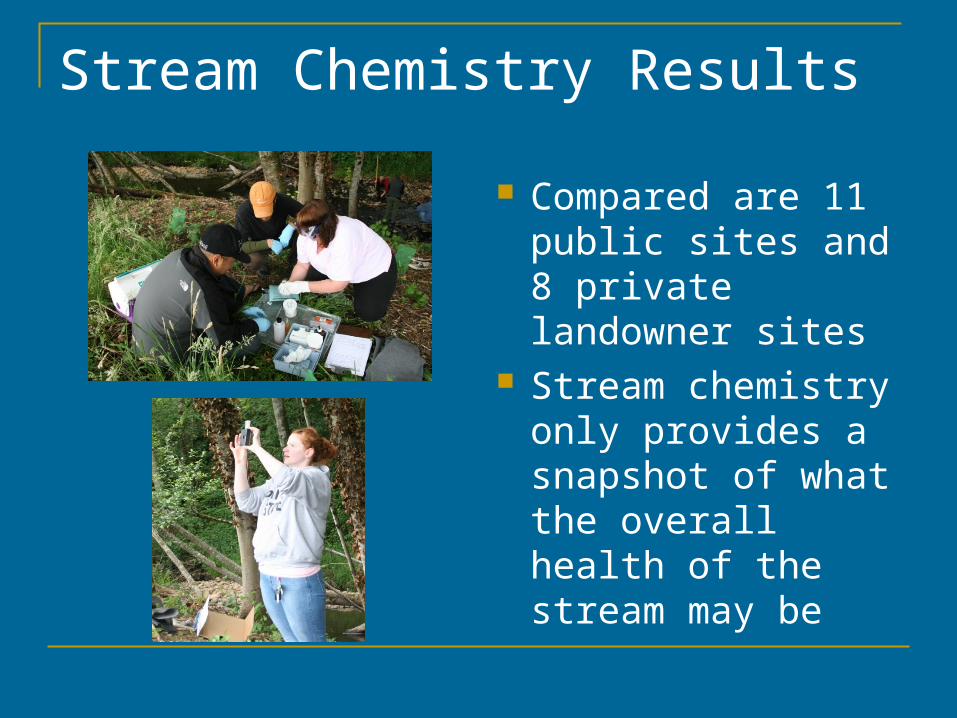
Stream Chemistry Results
Compared are 11 public sites and 8 private landowner sites
Stream chemistry only provides a snapshot of what the overall health of the stream may be
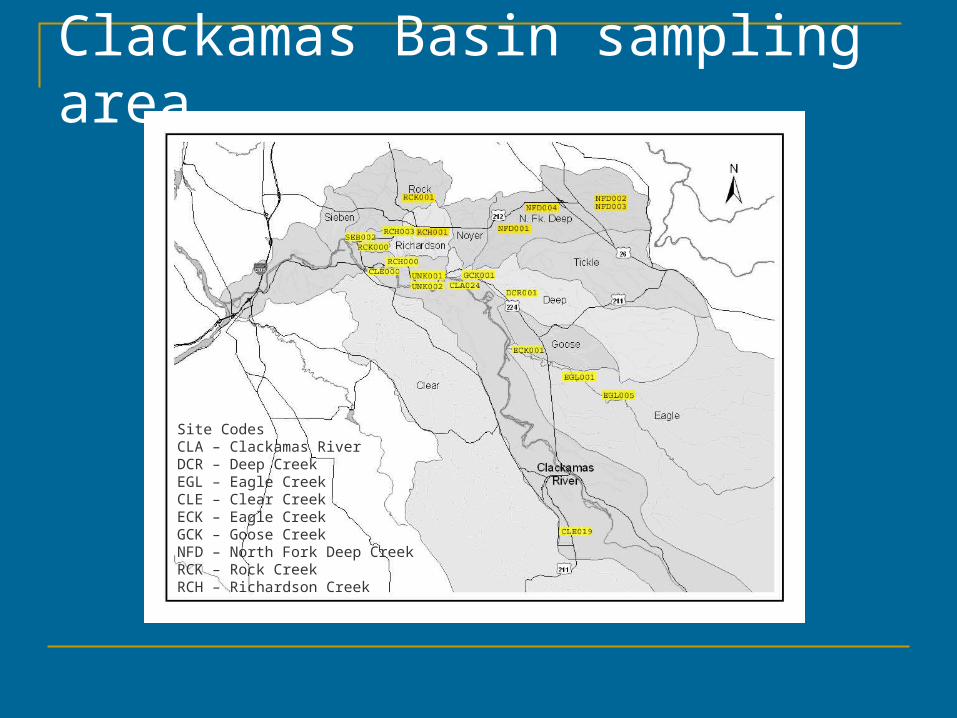
Clackamas Basin sampling area
Site CodesCLA – Clackamas RiverDCR – Deep CreekEGL – Eagle CreekCLE – Clear CreekECK – Eagle CreekGCK – Goose CreekNFD – North Fork Deep CreekRCK – Rock CreekRCH – Richardson Creek
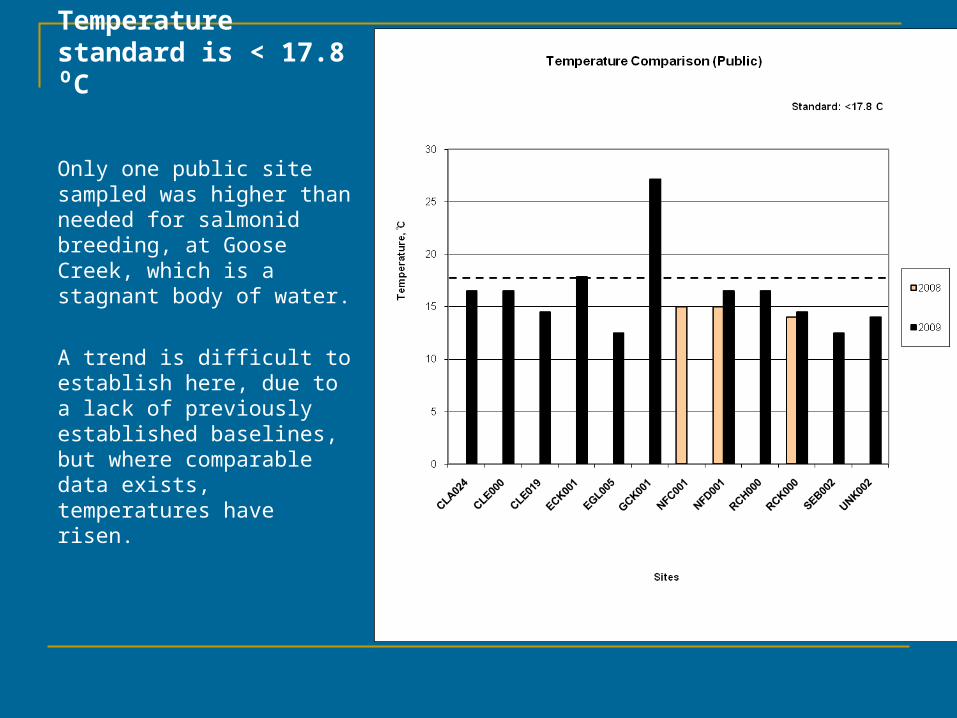
Temperature standard is < 17.8 ⁰C
Only one public site sampled was higher than needed for salmonid breeding, at Goose Creek, which is a stagnant body of water.
A trend is difficult to establish here, due to a lack of previously established baselines, but where comparable data exists, temperatures have risen.
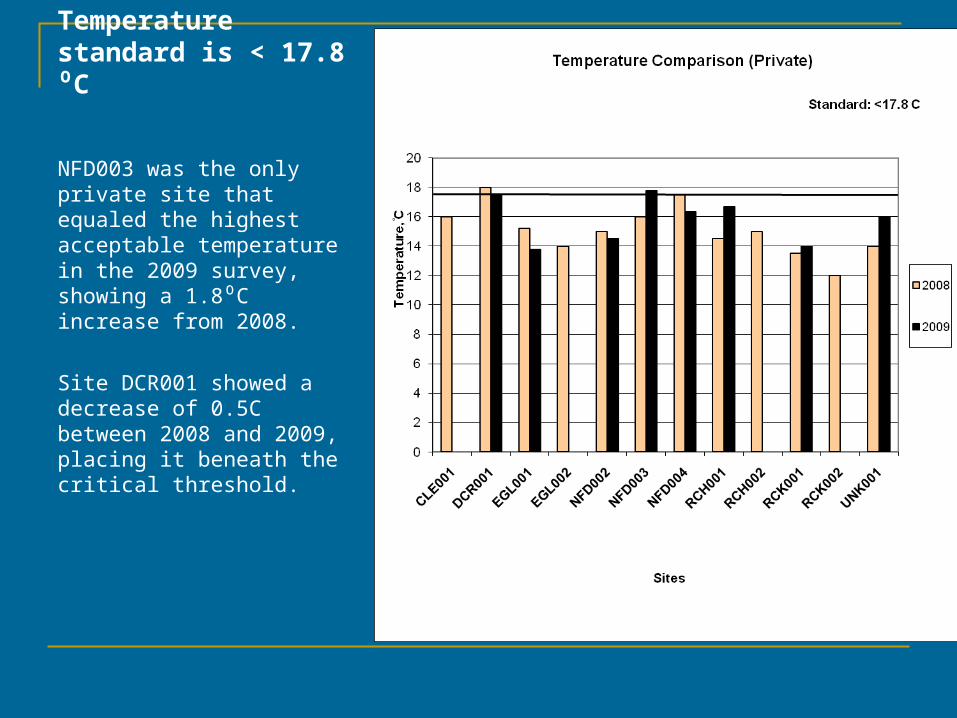
Temperature standard is < 17.8 ⁰C
NFD003 was the only private site that equaled the highest acceptable temperature in the 2009 survey, showing a 1.8⁰C increase from 2008.
Site DCR001 showed a decrease of 0.5C between 2008 and 2009, placing it beneath the critical threshold.
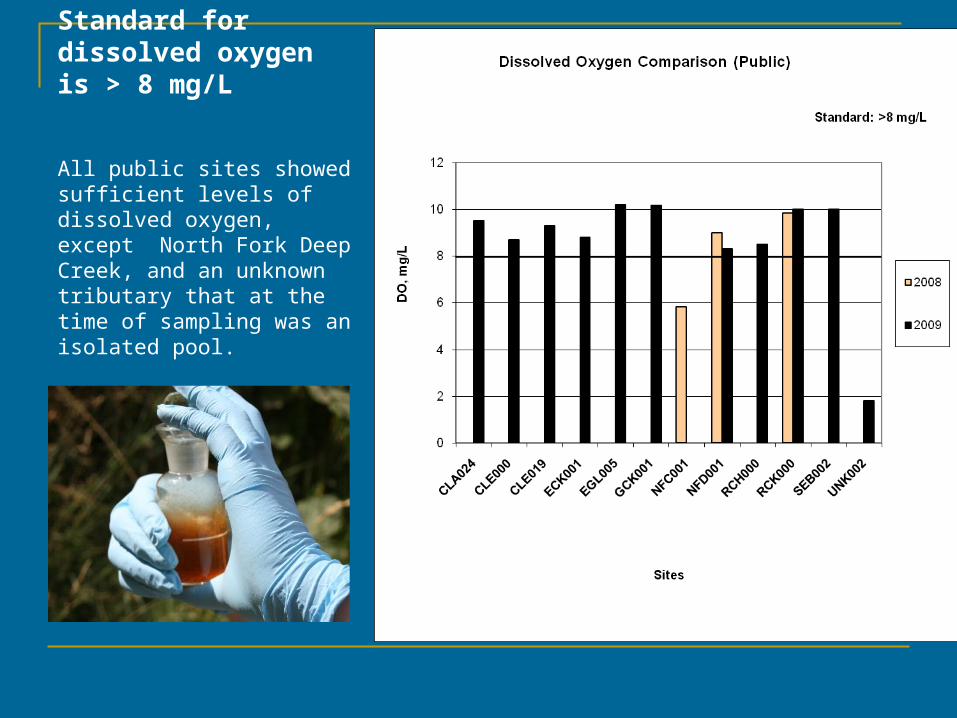
Standard for dissolved oxygen is > 8 mg/L
All public sites showed sufficient levels of dissolved oxygen, except North Fork Deep Creek, and an unknown tributary that at the time of sampling was an isolated pool.

All private sites sampled in 2009 showed dissolved oxygen levels at or above DEQ standards for fish-bearing streams.
All sites on North Fork Deep Creek showed declines in dissolved oxygen between 2008 and 2009.
Standard for DissolvedOxygen is > 8 mg/L

Standard for pH is between 6.5 – 8.5
All of the public sites sampled fell within acceptable range, with the exception of unknown tributary, which is slightly acidic at 6.4.

Standard for pH is between 6.5 – 8.5
pH readings at all private sites were within the accepted range.
All of the sample sites on Deep Creek and North Fork Deep Creek became more basic between 2008 and 2009.
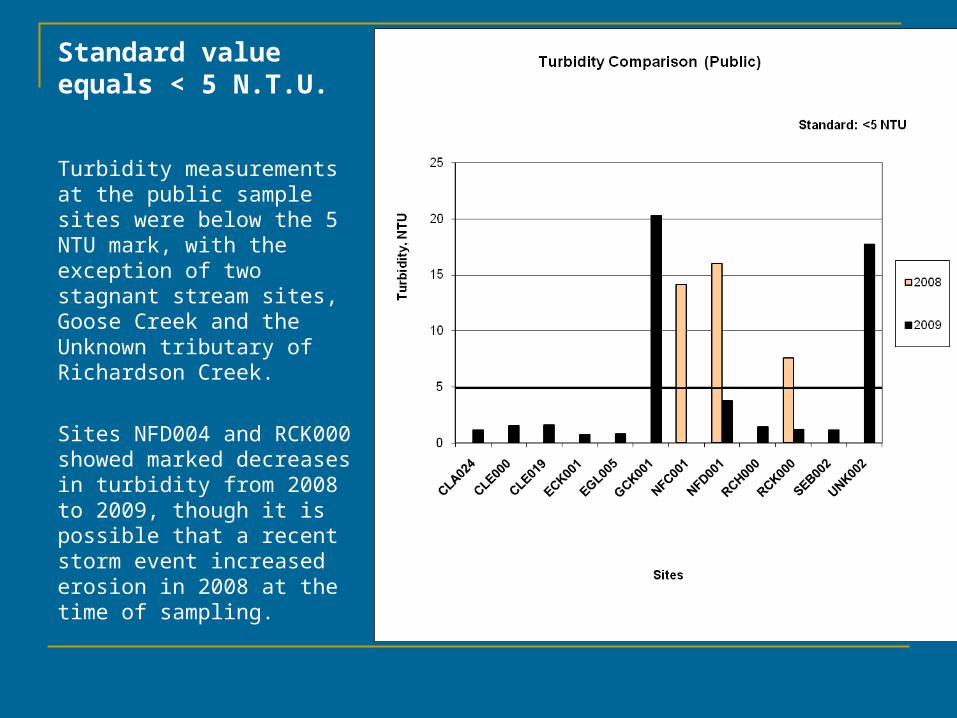
Standard value equals < 5 N.T.U.
Turbidity measurements at the public sample sites were below the 5 NTU mark, with the exception of two stagnant stream sites, Goose Creek and the Unknown tributary of Richardson Creek.
Sites NFD004 and RCK000 showed marked decreases in turbidity from 2008 to 2009, though it is possible that a recent storm event increased erosion in 2008 at the time of sampling.
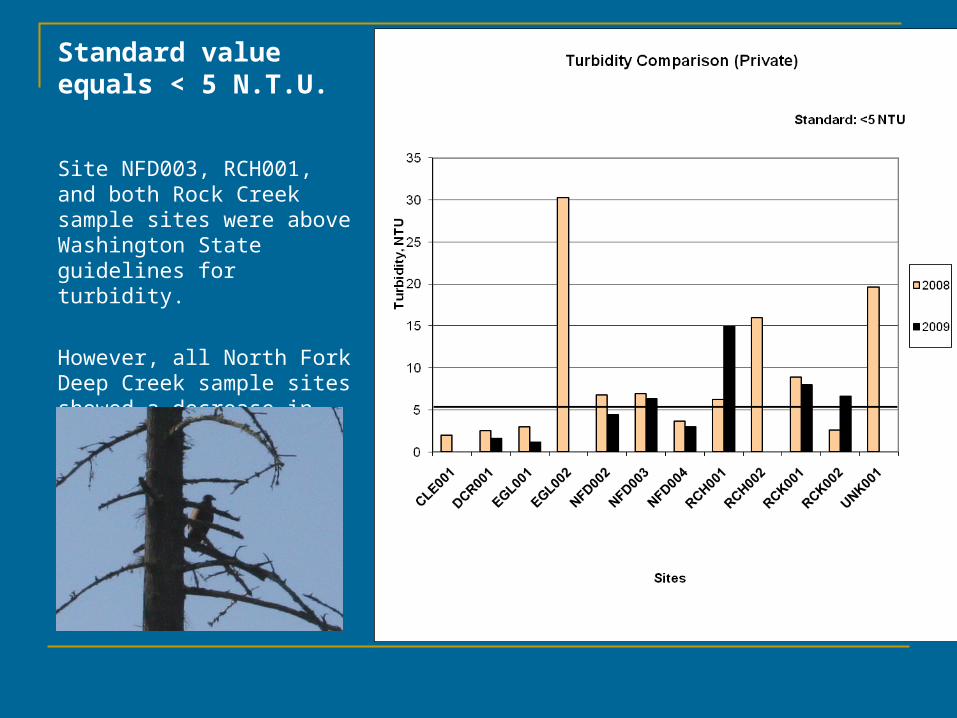
Standard value equals < 5 N.T.U.
Site NFD003, RCH001, and both Rock Creek sample sites were above Washington State guidelines for turbidity.
However, all North Fork Deep Creek sample sites showed a decrease in turbidity from 2008 to 2009.
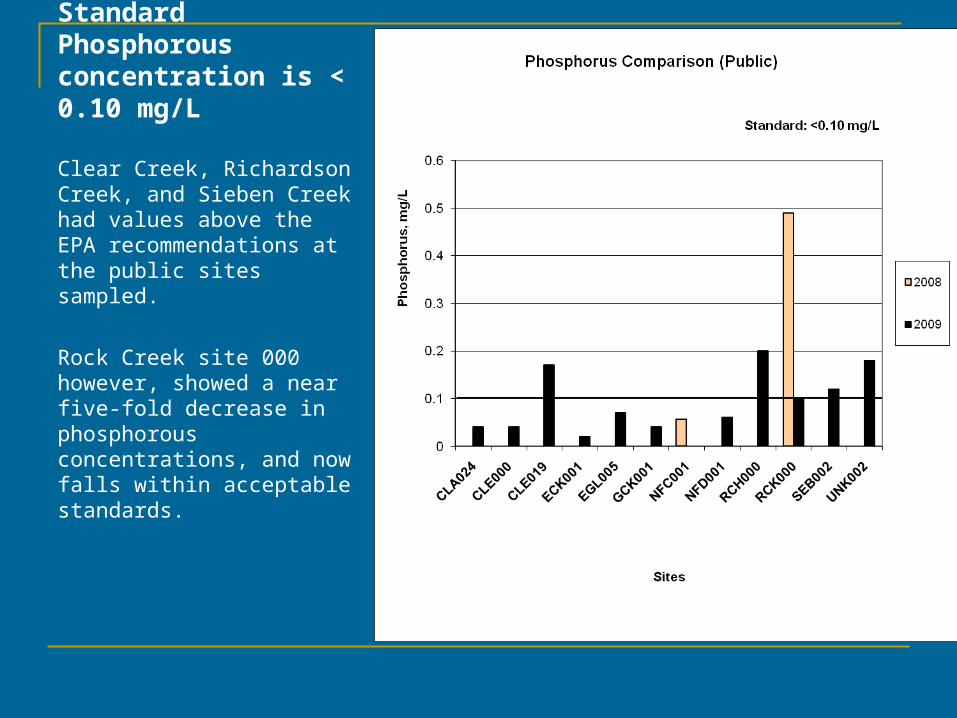
Standard Phosphorous concentration is < 0.10 mg/L
Clear Creek, Richardson Creek, and Sieben Creek had values above the EPA recommendations at the public sites sampled.
Rock Creek site 000 however, showed a near five-fold decrease in phosphorous concentrations, and now falls within acceptable standards.

Standard Phosphorous concentration is < 0.10 mg/L
Two of the private sites sampled were above the EPA recommended limit, Deep Creek 001 and the unknown tributary 001 site.
All private sites with data available from 2008 showed a significant decline in phosphorous levels in the 2009 study.
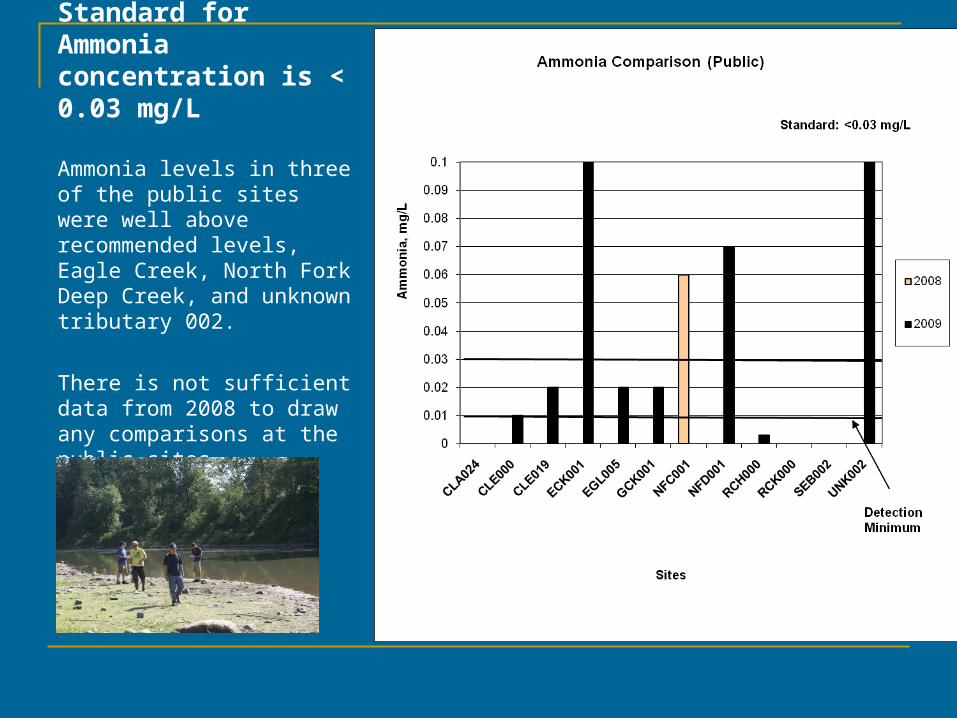
Standard for Ammonia concentration is < 0.03 mg/L
Ammonia levels in three of the public sites were well above recommended levels, Eagle Creek, North Fork Deep Creek, and unknown tributary 002.
There is not sufficient data from 2008 to draw any comparisons at the public sites.
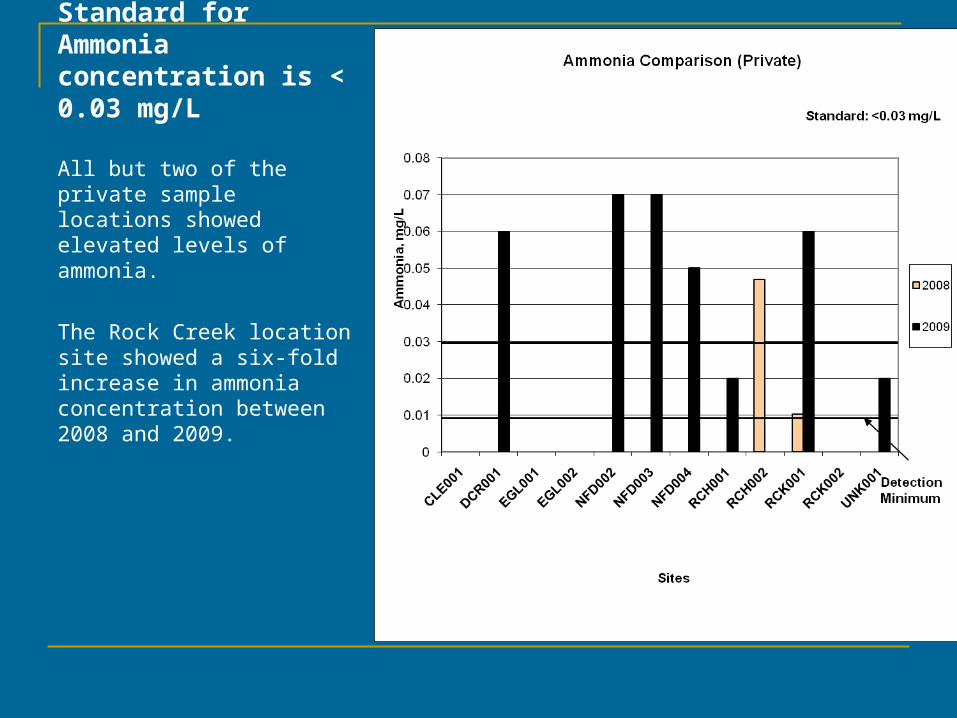
Standard for Ammonia concentration is < 0.03 mg/L
All but two of the private sample locations showed elevated levels of ammonia.
The Rock Creek location site showed a six-fold increase in ammonia concentration between 2008 and 2009.

Standard Nitrate concentration is < 10 mg/L
All public sites measured in 2009 were well below recommended surface level nitrate concentrations.
Continuous monitoring could provide trendline data, and warn of long range increases in nitrate concentrations.
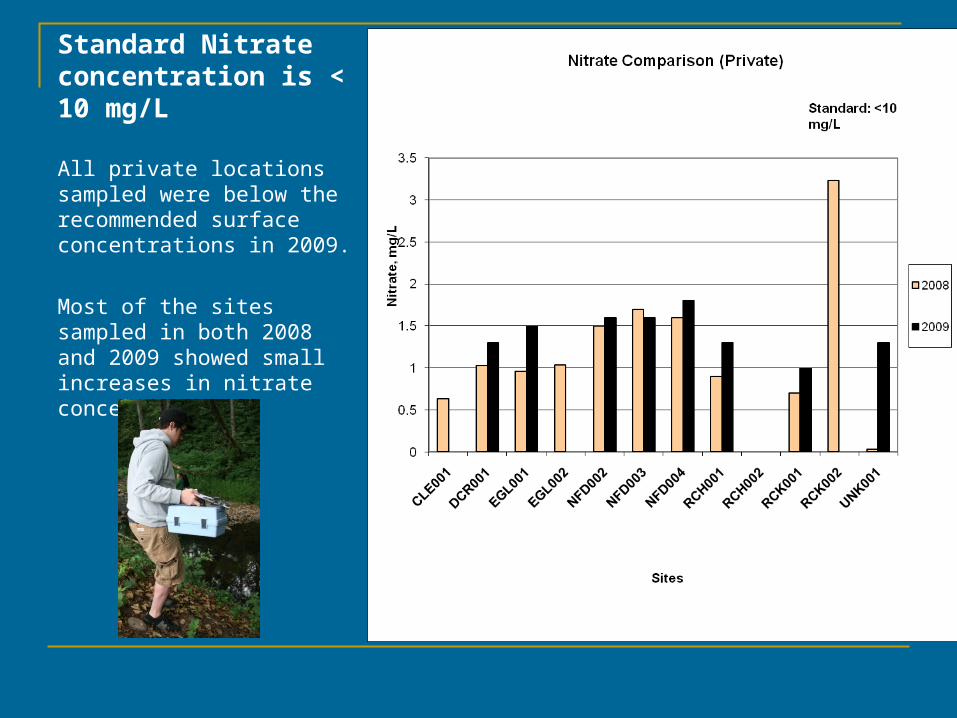
Standard Nitrate concentration is < 10 mg/L
All private locations sampled were below the recommended surface concentrations in 2009.
Most of the sites sampled in both 2008 and 2009 showed small increases in nitrate concentrations.
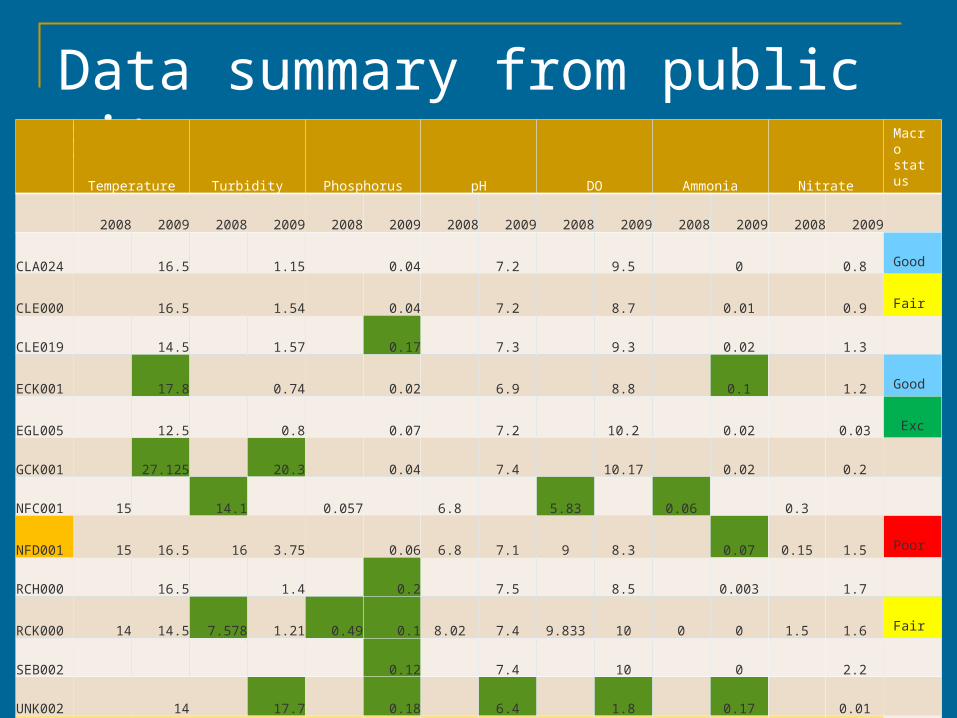
Data summary from public sitesTemperature Turbidity Phosphorus pH DO Ammonia Nitrate
Macro status
2008 2009 2008 2009 2008 2009 2008 2009 2008 2009 2008 2009 2008 2009
CLA024 16.5 1.15 0.04 7.2 9.5 0 0.8 Good
CLE000 16.5 1.54 0.04 7.2 8.7 0.01 0.9 Fair
CLE019 14.5 1.57 0.17 7.3 9.3 0.02 1.3
ECK001 17.8 0.74 0.02 6.9 8.8 0.1 1.2 Good
EGL005 12.5 0.8 0.07 7.2 10.2 0.02 0.03 Exc
GCK001 27.125 20.3 0.04 7.4 10.17 0.02 0.2
NFC001 15 14.1 0.057 6.8 5.83 0.06 0.3
NFD001 15 16.5 16 3.75 0.06 6.8 7.1 9 8.3 0.07 0.15 1.5 Poor
RCH000 16.5 1.4 0.2 7.5 8.5 0.003 1.7
RCK000 14 14.5 7.578 1.21 0.49 0.1 8.02 7.4 9.833 10 0 0 1.5 1.6 Fair
SEB002 0.12 7.4 10 0 2.2
UNK002 14 17.7 0.18 6.4 1.8 0.17 0.01
Average 14.7 16.6 12.6 5.0 0.27 0.09 7.2 7.2 8.2 8.67 0.03 0.04 0.65 1.04

Data summary from private sites
Temperature Turbidity Phosphorus pH DO Ammonia NitrateMacro status
2008 2009 2008 2009 2008 2009 2008 2009 2008 2009 2008 2009 2008 2009
CLE001 16 2 0.21 7.2 10 0 0.63
DCR001 18 17.5 2.52 1.6 0.35 0.26 7.27 7.8 10.5 10.2 0 0.06 1.03 1.3
EGL001 15.2 13.8 3 1.13 0.31 0.04 7.1 7.2 8.5 10.1 0 0.96 1.5Exc.
EGL002 14 30.3 0.19 6.75 6.5 0 1.033
NFD002 15 14.5 6.76 4.42 0.14 0.06 6.93 7 10.16 9 0 0.07 1.5 1.6
NFD003 16 17.8 6.89 6.29 0.14 0.02 6.96 7.15 9.5 8.5 0 0.07 1.7 1.6
NFD004 17.5 16.33 3.69 2.94 0.25 0.1 7.04 7.4 8.5 8 0 0.05 1.6 1.8
RCH001 14.5 16.7 6.266 15 0.14 7.34 7.1 9 9.5 0 0.02 0.9 1.3
RCH002 15 16 0.1 6.76 8.83 0.047 0
RCK001 13.5 14 8.92 8 0.27 0.08 7.28 6.9 8.33 8 0.0103 0.06 0.7 1
RCK002 12 2.62 6.6 0.34 7.16 10 0 3.23
UNK001 14 16 19.6 0.48 0.26 7.3 7.6 12.17 9 0 0.02 0.03 1.3
Average 15.1 15.8 9.1 5.8 0.24 0.12 7.1 7.3 9.3 9.0 0.03 0.05 1.11 1.4
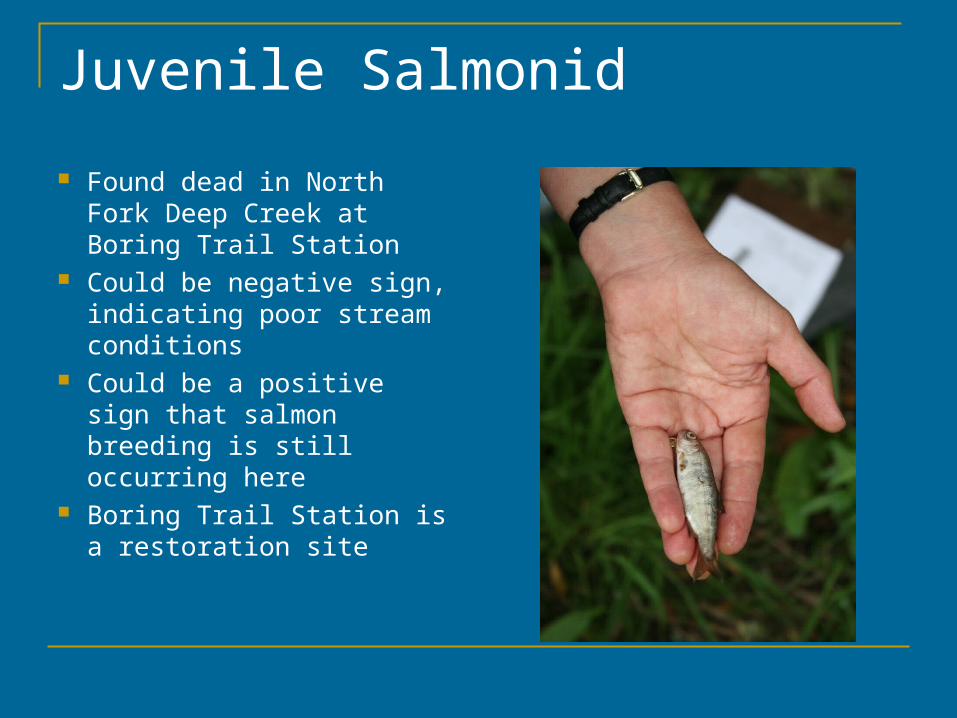
Juvenile Salmonid
Found dead in North Fork Deep Creek at Boring Trail Station
Could be negative sign, indicating poor stream conditions
Could be a positive sign that salmon breeding is still occurring here
Boring Trail Station is a restoration site
MacroinvertebratesMacroinvertebrates
Clackamas River BasinClackamas River BasinTim Vidito – Tom Provost – Clayton BuckTim Vidito – Tom Provost – Clayton Buck
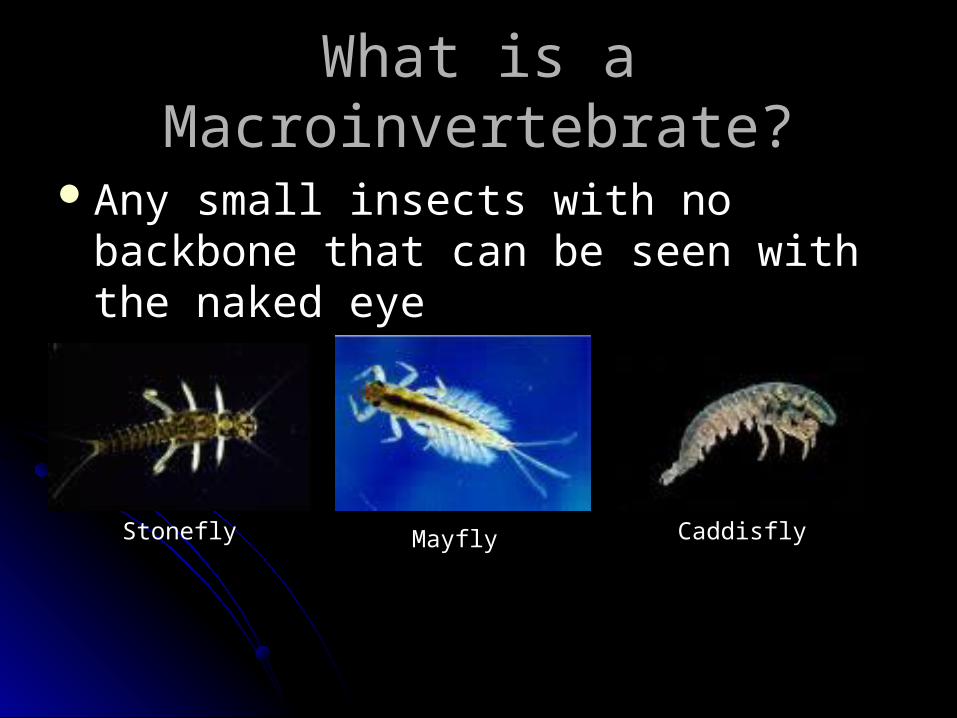
What is a Macroinvertebrate?What is a Macroinvertebrate?
Any small insects with no backbone that Any small insects with no backbone that can be seen with the naked eyecan be seen with the naked eye
Stonefly Mayfly Caddisfly

Why study Macros?Why study Macros?
Determine the physical, chemical, and Determine the physical, chemical, and biological quality of a streambiological quality of a stream
Reside in small areas throughout their Reside in small areas throughout their lifespanlifespan
Show the effects of short and long term Show the effects of short and long term pollutionpollution
Assess the potential effects water quality Assess the potential effects water quality can have on humanscan have on humans
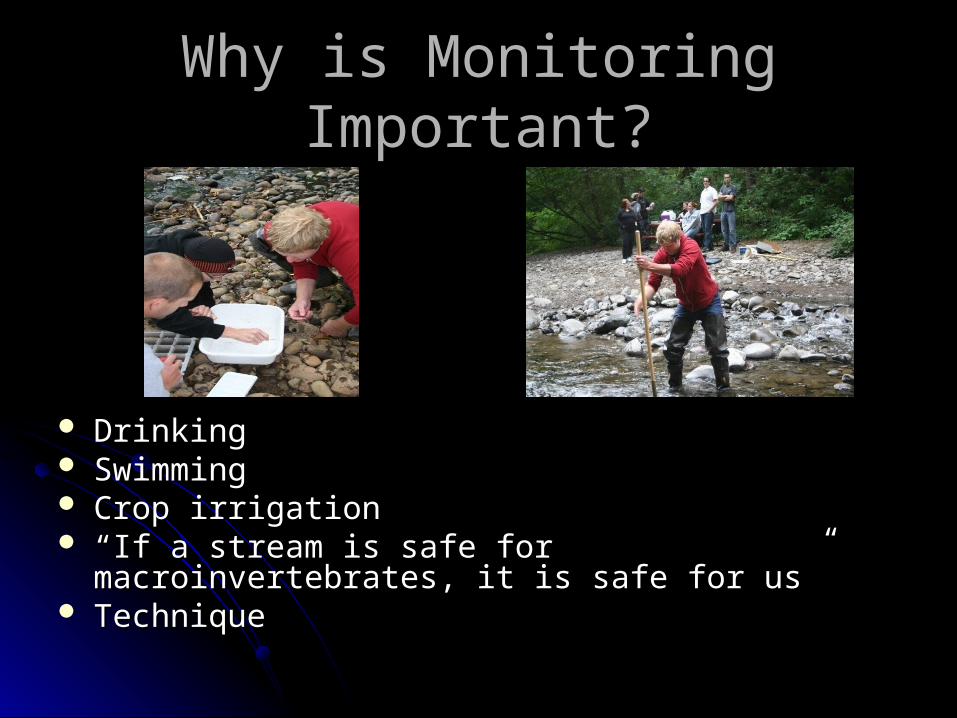
Why is Monitoring Important?Why is Monitoring Important?
DrinkingDrinking SwimmingSwimming Crop irrigationCrop irrigation ““If a stream is safe for macroinvertebrates, it is safe for If a stream is safe for macroinvertebrates, it is safe for
us”us” TechniqueTechnique

DiversityDiversity
Polluted Stream = high percentage of Polluted Stream = high percentage of pollutant tolerant macroinvertebrates and pollutant tolerant macroinvertebrates and limited amount of pollutant intolerant limited amount of pollutant intolerant presentpresent
Healthy Stream = high percentage of Healthy Stream = high percentage of pollutant intolerant vs. pollutant tolerantpollutant intolerant vs. pollutant tolerant
Stonefly/Caddisfly vs Damselfly/True FliesStonefly/Caddisfly vs Damselfly/True Flies
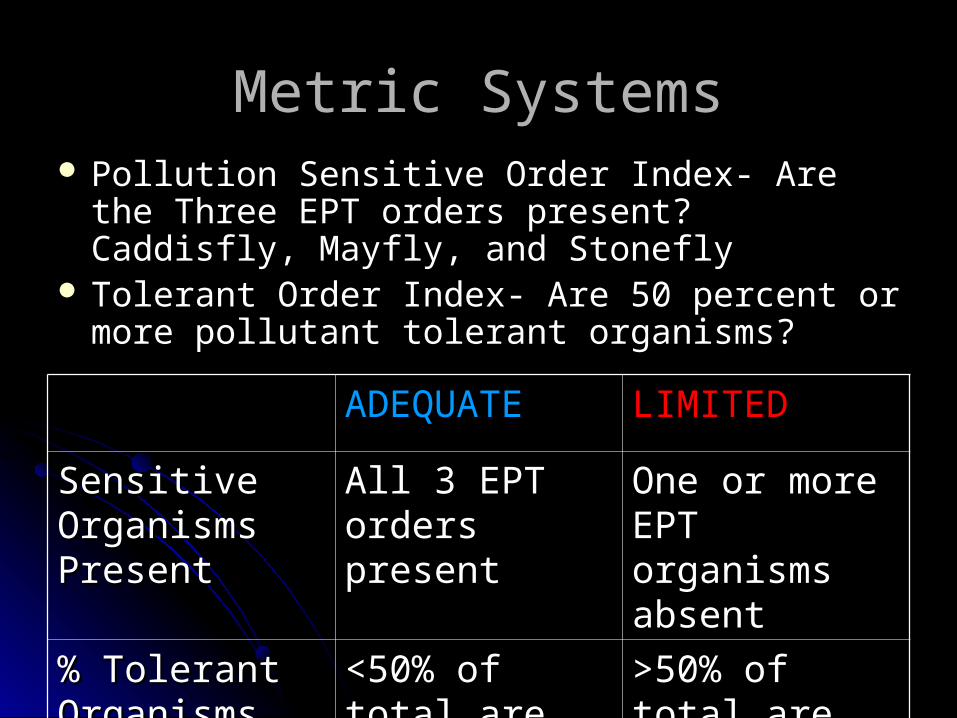
Metric SystemsMetric Systems Pollution Sensitive Order Index- Are the Three Pollution Sensitive Order Index- Are the Three
EPT orders present? Caddisfly, Mayfly, and EPT orders present? Caddisfly, Mayfly, and StoneflyStonefly
Tolerant Order Index- Are 50 percent or more Tolerant Order Index- Are 50 percent or more pollutant tolerant organisms? pollutant tolerant organisms?
ADEQUATEADEQUATE LIMITEDLIMITED
Sensitive Sensitive Organisms Organisms PresentPresent
All 3 EPT All 3 EPT orders presentorders present
One or more One or more EPT organisms EPT organisms absentabsent
% Tolerant % Tolerant OrganismsOrganisms
<50% of total <50% of total are tolerantare tolerant
>50% of total >50% of total are tolerantare tolerant

Pollution Sensitive Order IndexPollution Sensitive Order Index
AdequateAdequateEagle Fern ParkEagle Fern ParkLandowner at Eagle CreekLandowner at Eagle CreekBarton ParkBarton Park
LimitedLimitedCarver ParkCarver ParkRock CreekRock CreekBoring Trail StationBoring Trail Station
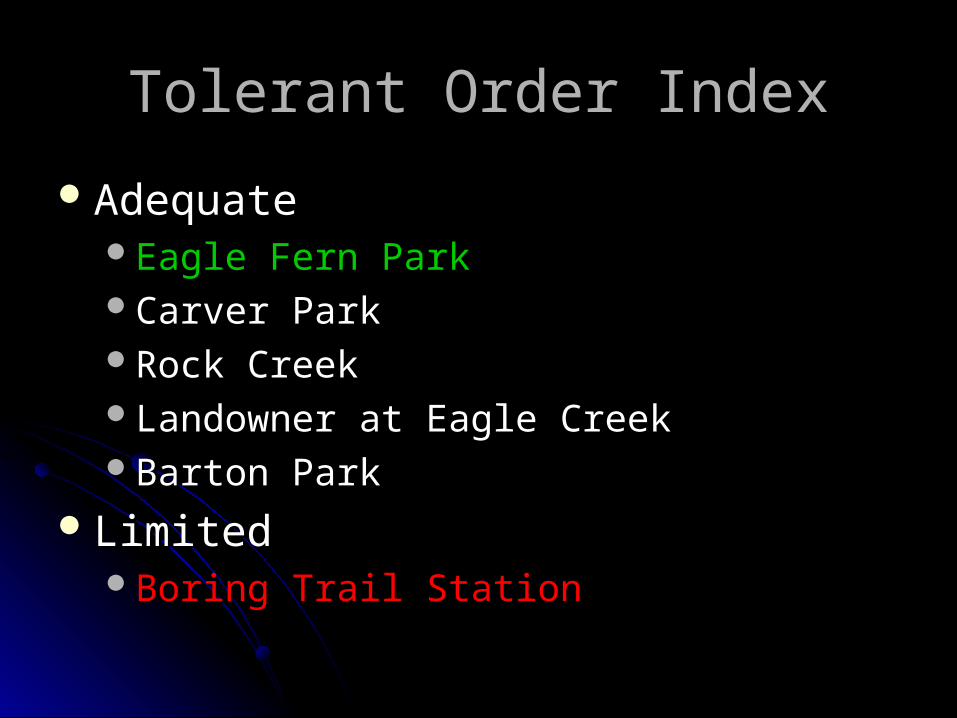
Tolerant Order IndexTolerant Order Index
AdequateAdequateEagle Fern ParkEagle Fern ParkCarver ParkCarver ParkRock CreekRock CreekLandowner at Eagle CreekLandowner at Eagle CreekBarton ParkBarton Park
LimitedLimitedBoring Trail StationBoring Trail Station
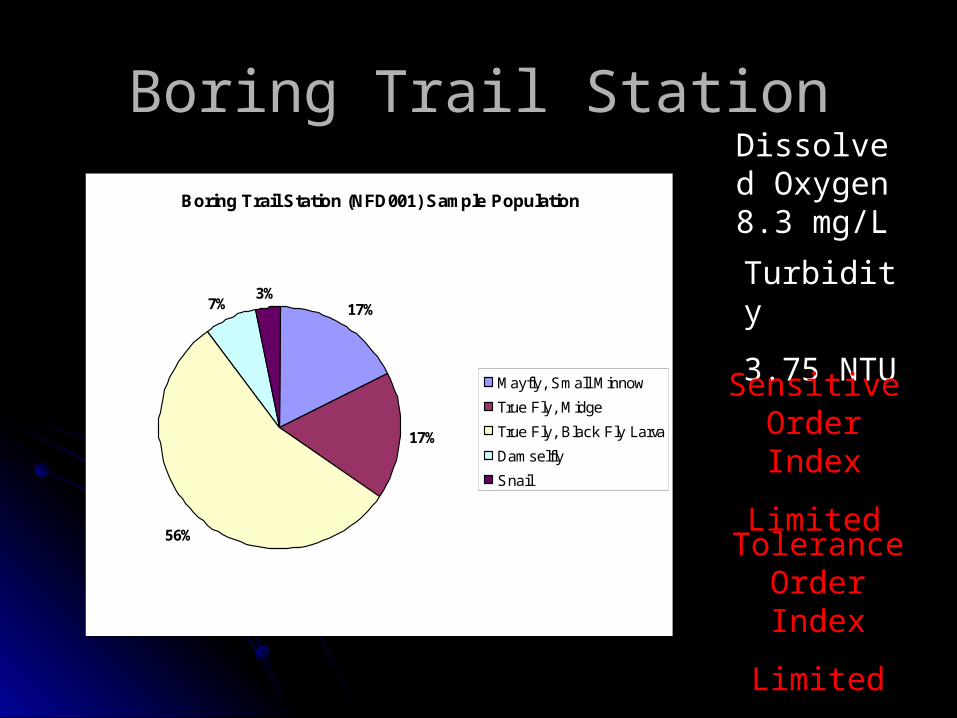
Boring Trail StationBoring Trail Station
Boring Trail Station (NFD001) Sample Population
17%
17%
56%
7%3%
Mayfly, Small Minnow
True Fly, Midge
True Fly, Black Fly Larva
Damselfly
Snail
Dissolved Oxygen 8.3 mg/L
Turbidity
3.75 NTU
Sensitive Order Index
Limited
Tolerance Order Index
Limited
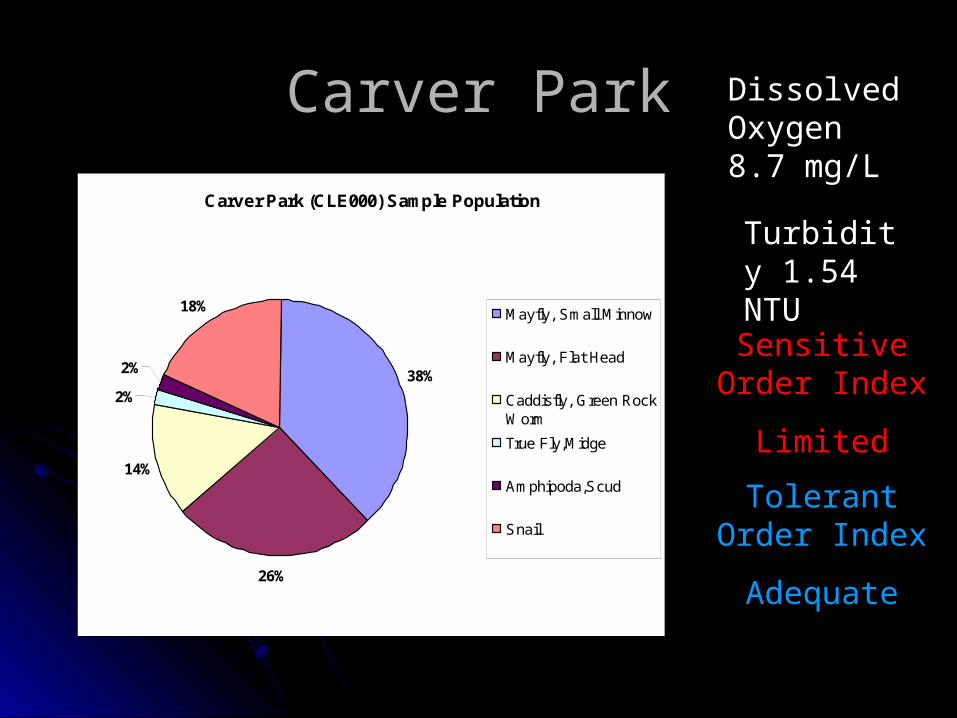
Carver ParkCarver Park
Carver Park (CLE000) Sample Population
38%
26%
14%
2%
2%
18% Mayfly, Small Minnow
Mayfly, Flat Head
Caddisfly, Green RockWorm
True Fly,Midge
Amphipoda,Scud
Snail
Dissolved Oxygen 8.7 mg/L
Turbidity 1.54 NTU
Sensitive Order Index
Limited
Tolerant Order Index
Adequate
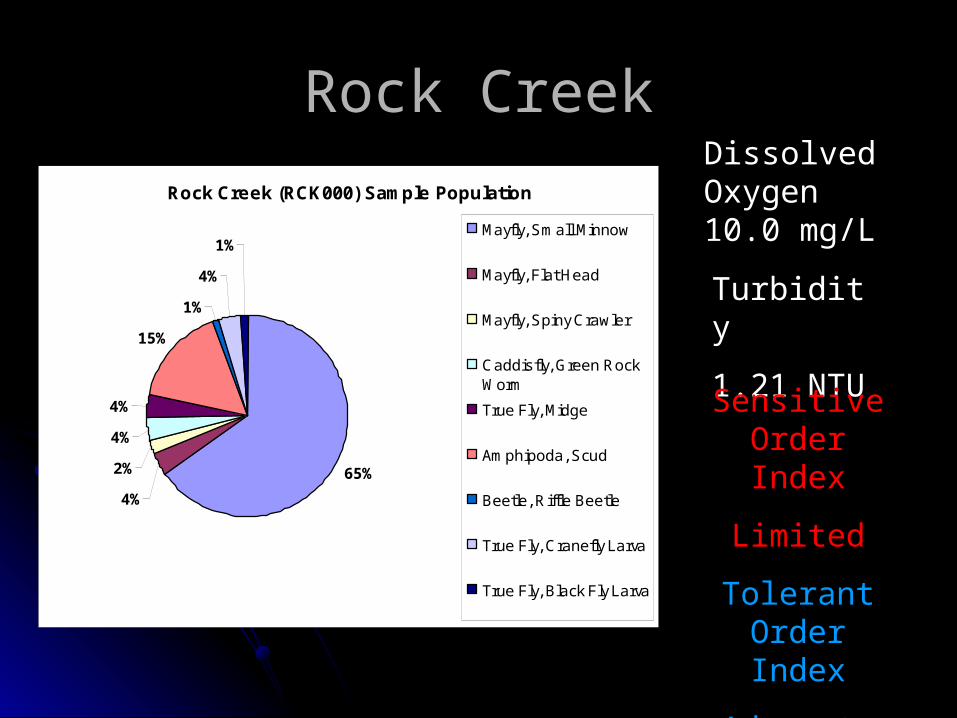
Rock CreekRock Creek
Rock Creek (RCK000) Sample Population
65%
4%
2%
4%
4%
15%
1%
4%
1%Mayfly, Small Minnow
Mayfly, Flat Head
Mayfly, Spiny Crawler
Caddisfly, Green RockWorm
True Fly, Midge
Amphipoda, Scud
Beetle, Riffle Beetle
True Fly, Cranefly Larva
True Fly, Black Fly Larva
Dissolved Oxygen 10.0 mg/L
Turbidity
1.21 NTU
Sensitive Order Index
Limited
Tolerant Order Index
Adequate
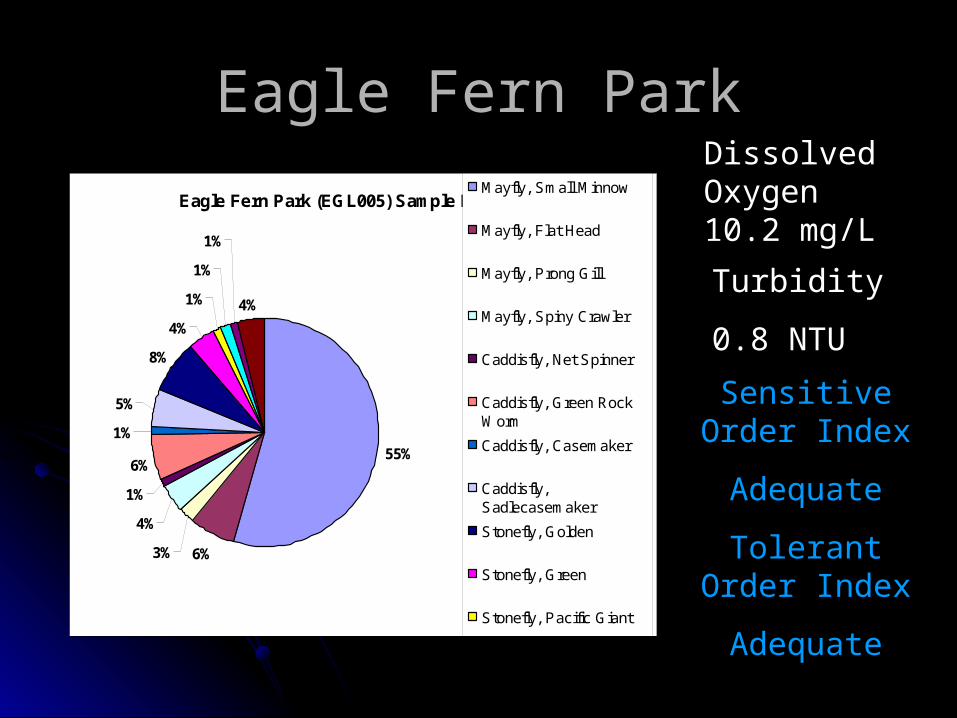
Eagle Fern ParkEagle Fern Park
Eagle Fern Park (EGL005) Sample Population
55%
6%3%
4%
1%
6%
1%
5%
8%
4%
1%
1%
1%
4%
Mayfly, Small Minnow
Mayfly, Flat Head
Mayfly, Prong Gill
Mayfly, Spiny Crawler
Caddisfly, Net Spinner
Caddisfly, Green RockWorm
Caddisfly, Casemaker
Caddisfly,Sadlecasemaker
Stonefly, Golden
Stonefly, Green
Stonefly, Pacific Giant
True Fly, Cranefly Larva
Dissolved Oxygen 10.2 mg/L
Turbidity
0.8 NTU
Sensitive Order Index
Adequate
Tolerant Order Index
Adequate
Landowner Eagle CreekLandowner Eagle Creek
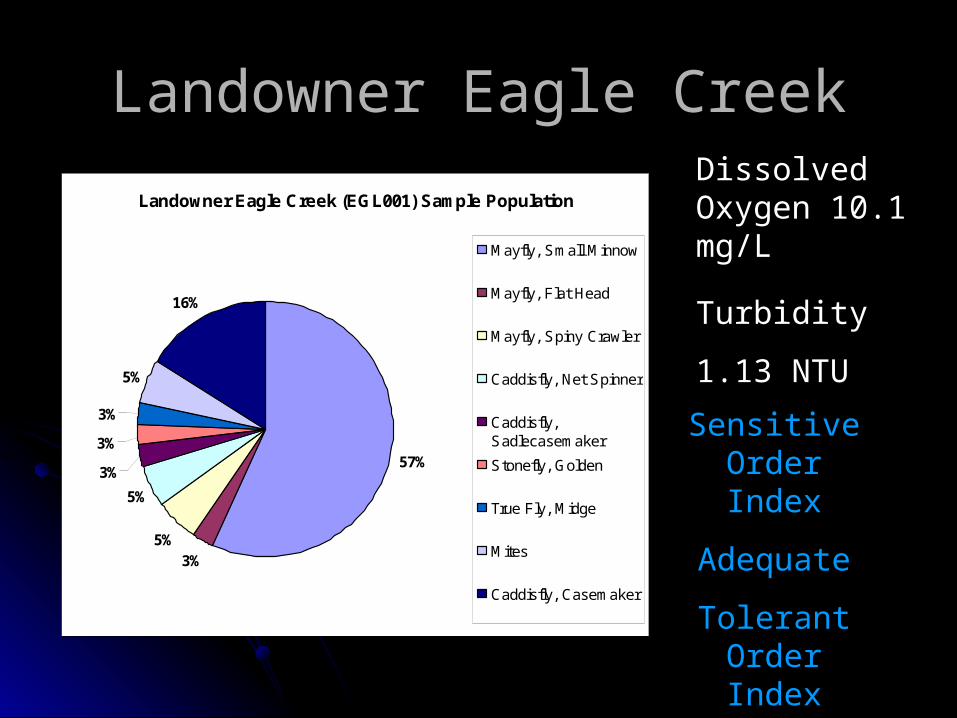
Landowner Eagle Creek (EGL001) Sample Population
57%
3%5%
5%
3%
3%
3%
5%
16%
Mayfly, Small Minnow
Mayfly, Flat Head
Mayfly, Spiny Crawler
Caddisfly, Net Spinner
Caddisfly,Sadlecasemaker
Stonefly, Golden
True Fly, Midge
Mites
Caddisfly, Casemaker
Dissolved Oxygen 10.1 mg/L
Turbidity
1.13 NTU
Sensitive Order Index
Adequate
Tolerant Order Index
Adequate
Barton ParkBarton Park
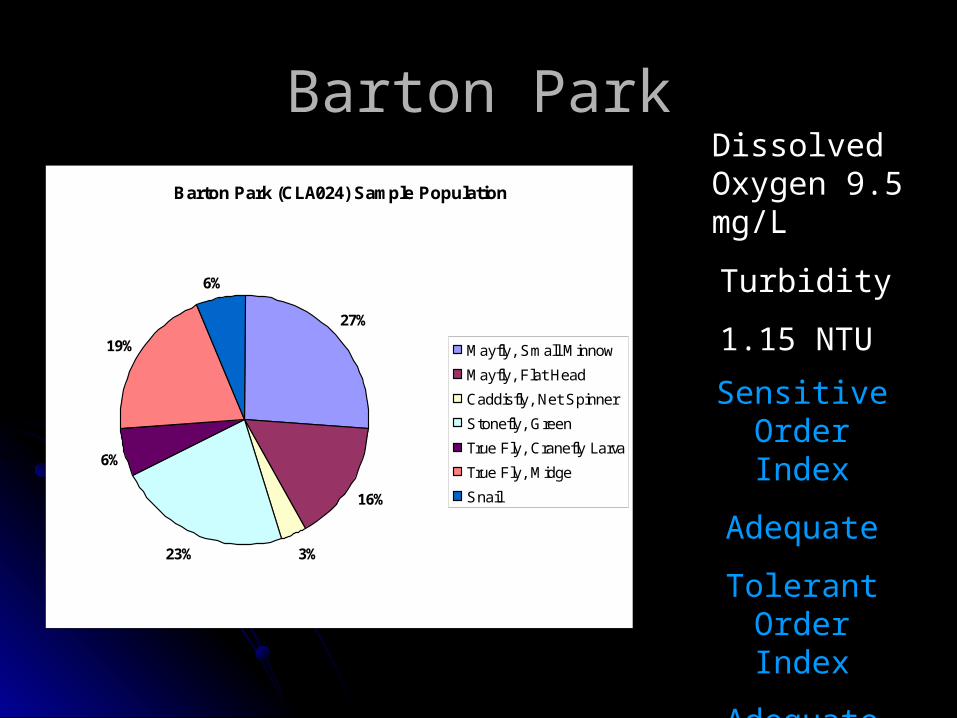
Barton Park (CLA024) Sample Population
27%
16%
3%23%
6%
19%
6%
Mayfly, Small Minnow
Mayfly, Flat Head
Caddisfly, Net Spinner
Stonefly, Green
True Fly, Cranefly Larva
True Fly, Midge
Snail
Dissolved Oxygen 9.5 mg/L
Turbidity
1.15 NTU
Sensitive Order Index
Adequate
Tolerant Order Index
Adequate
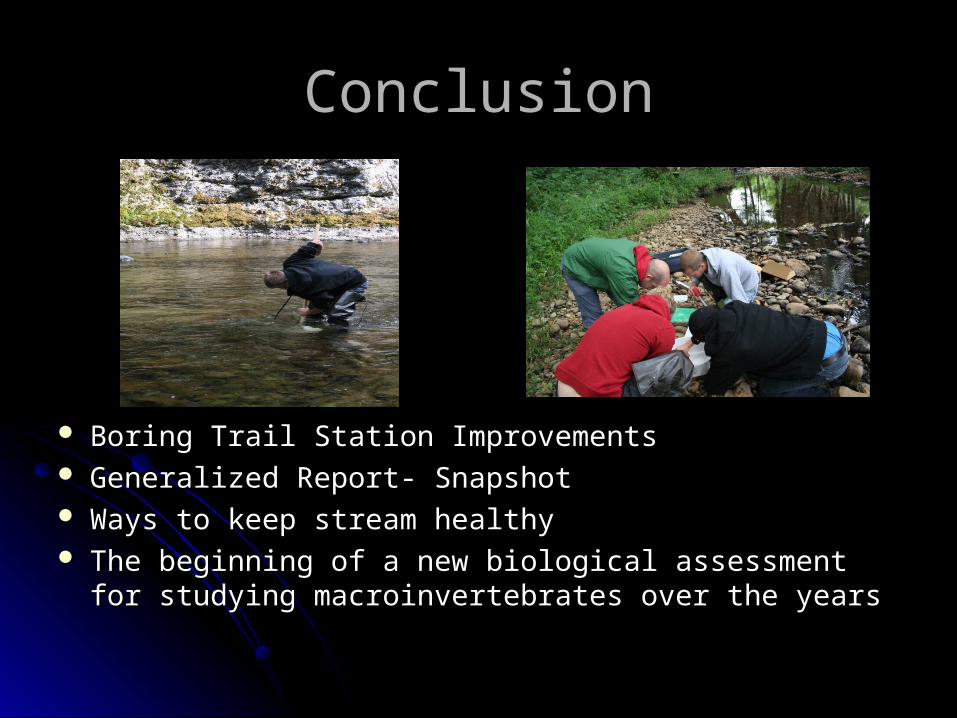
ConclusionConclusion
Boring Trail Station ImprovementsBoring Trail Station Improvements Generalized Report- SnapshotGeneralized Report- Snapshot Ways to keep stream healthyWays to keep stream healthy The beginning of a new biological assessment for The beginning of a new biological assessment for
studying macroinvertebrates over the yearsstudying macroinvertebrates over the years
Conclusions
Several trends are observed in between 2008 and 2009 data among the North Fork Deep Creek data, decreasing dissolved oxygen, increasing pH, and decreased turbidity.
All comparable data show a decrease in phosphorous concentration between 2008 and 2009.
More yearly and seasonal data is needed for adequate comparisons for all sites.

Conclusions Ammonia was a problem at several sites this
year, likely due to decreased flow Turbidity was generally lower in 2009 than 2008,
possibly due to storm events in 2008 Temperature continues to be problem, with most
sites falling within two degrees of the maximum Seasonal fluctuations must be accounted for,
and further testing would be useful at times of higher flow
Recommendations Continue monitoring of Clackamas Basin
streams Control runoff that leads to excessive
sedimentation and nutrient load Remove invasive species and replace with
native plants and trees Make sure septic systems are properly
maintained Don’t put yard debris, chemicals, or garbage
near streams or riparian zones
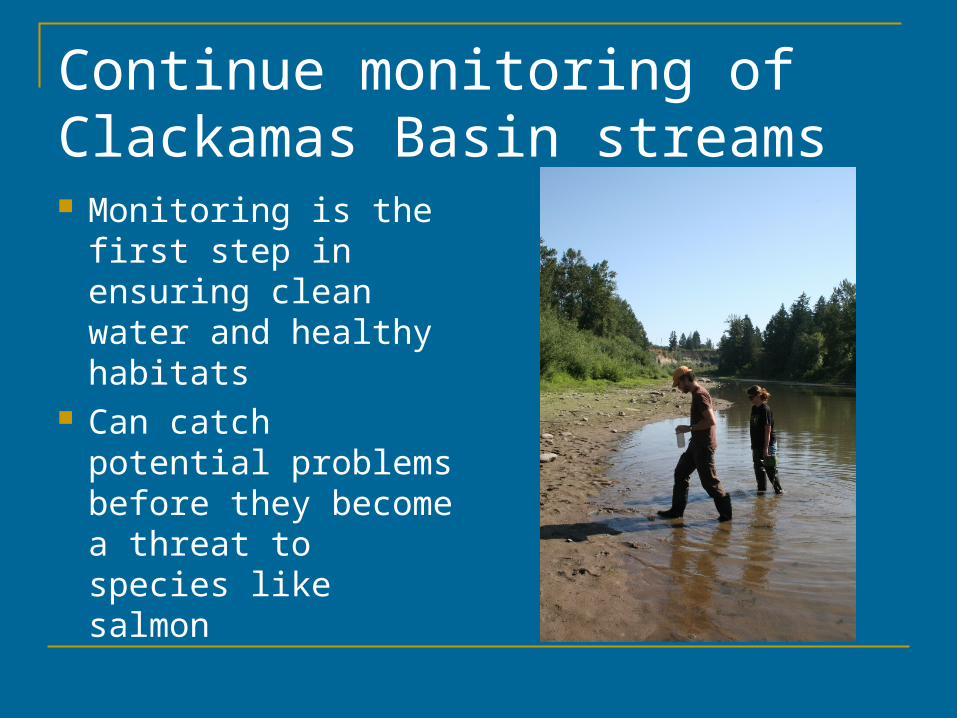
Continue monitoring of Clackamas Basin streams Monitoring is the first
step in ensuring clean water and healthy habitats
Can catch potential problems before they become a threat to species like salmon
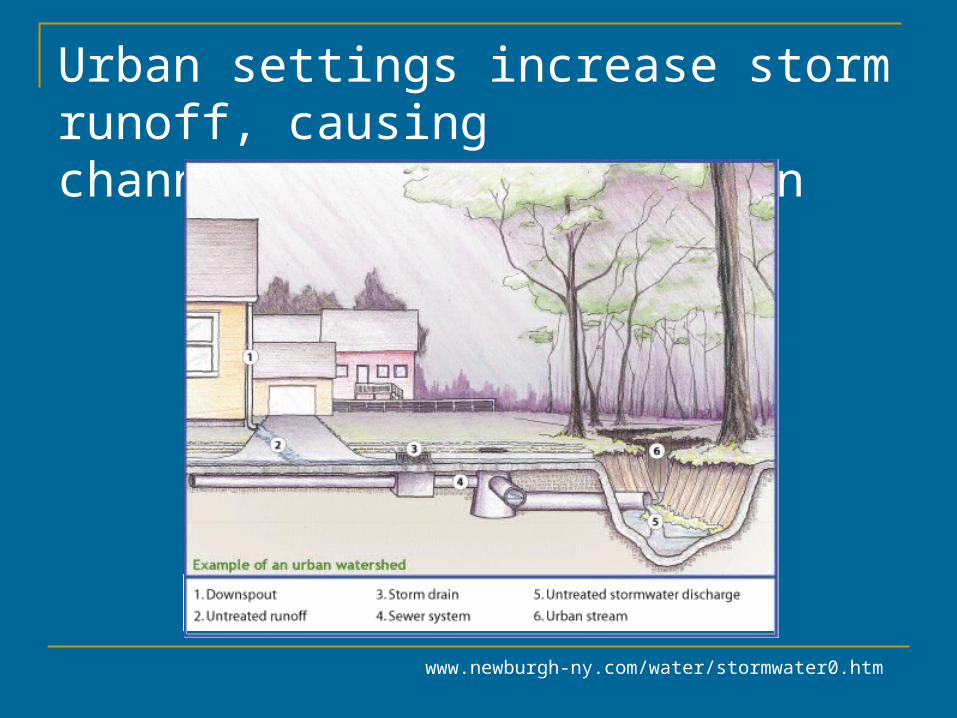
Urban settings increase storm runoff, causing channelization and erosion
www.newburgh-ny.com/water/stormwater0.htm
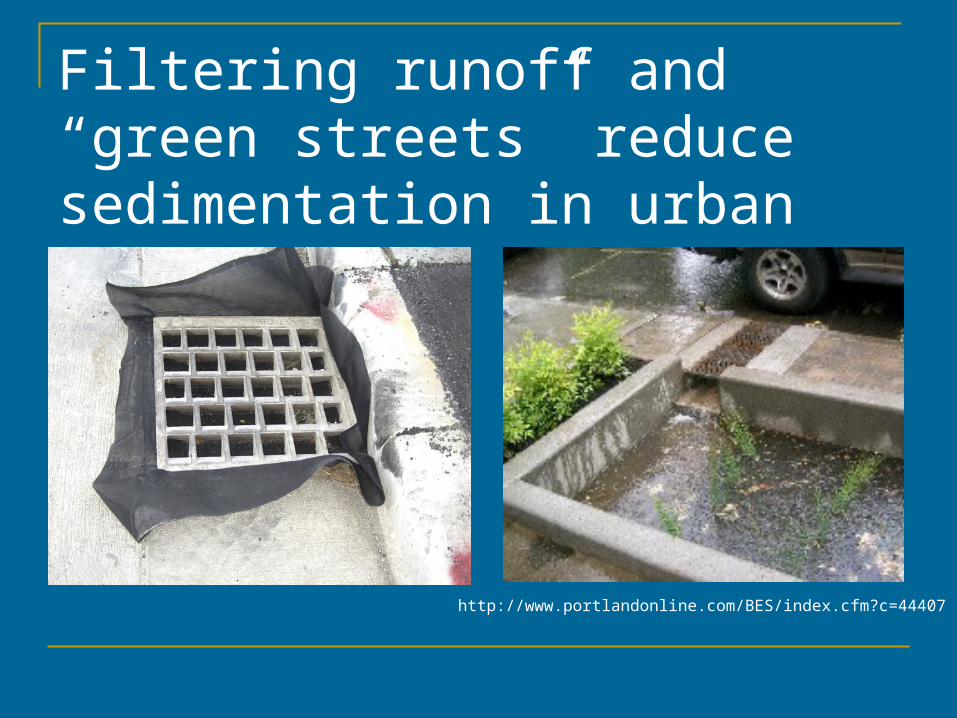
Filtering runoff and “green streets” reduce sedimentation in urban areas
http://www.portlandonline.com/BES/index.cfm?c=44407
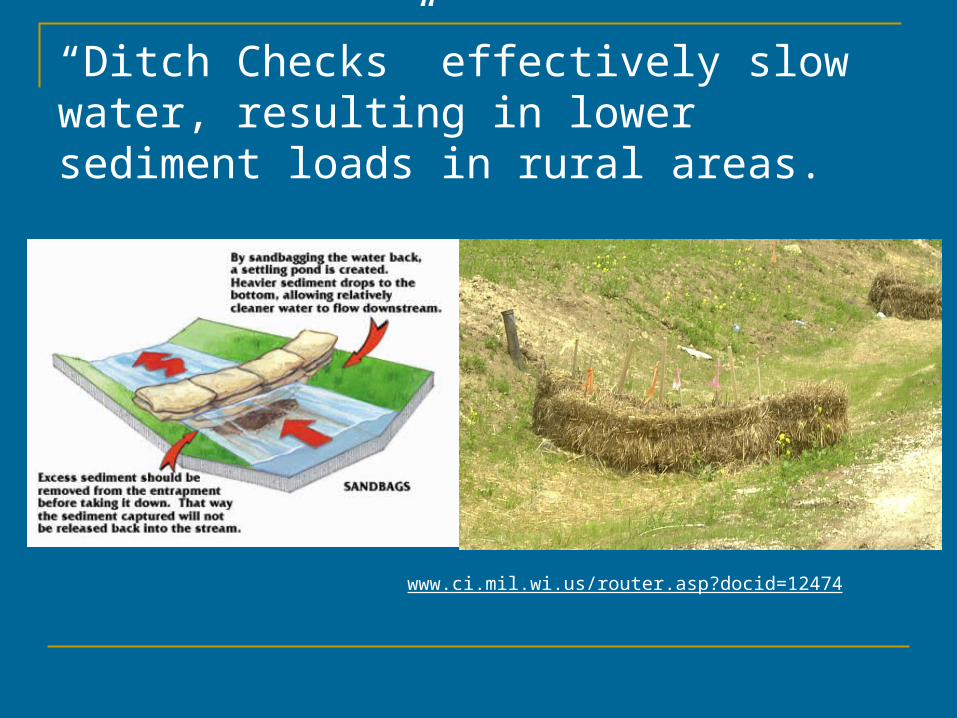
“Ditch Checks” effectively slow water, resulting in lower sediment loads in rural areas.
www.ci.mil.wi.us/router.asp?docid=12474
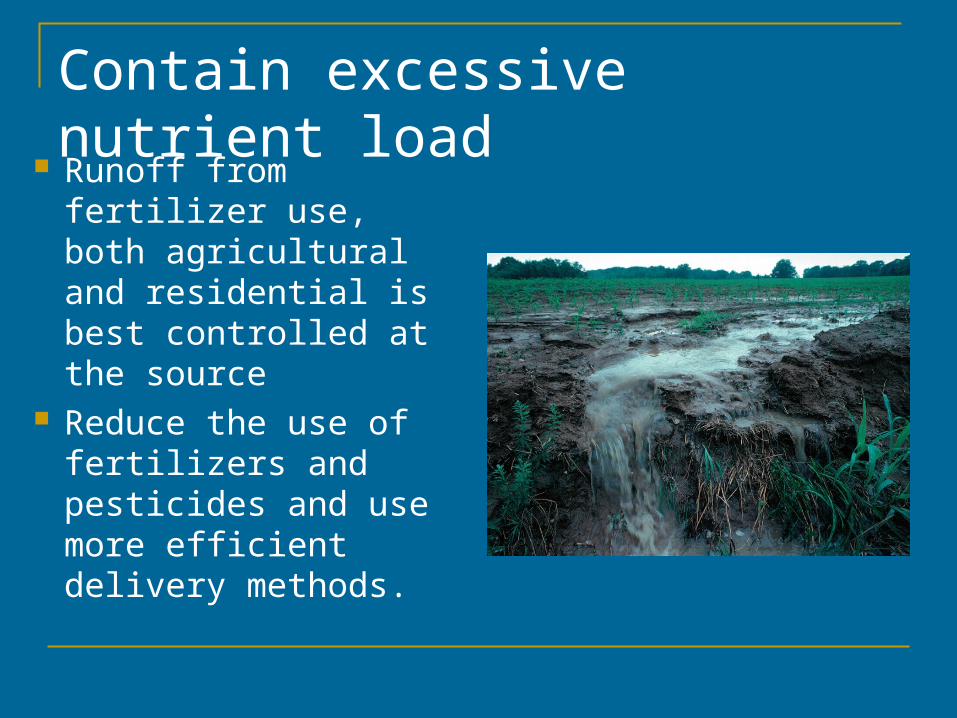
Contain excessive nutrient load
Runoff from fertilizer use, both agricultural and residential is best controlled at the source
Reduce the use of fertilizers and pesticides and use more efficient delivery methods.

Methods for improving the efficiency of irrigation systemsContour farming Holding ponds
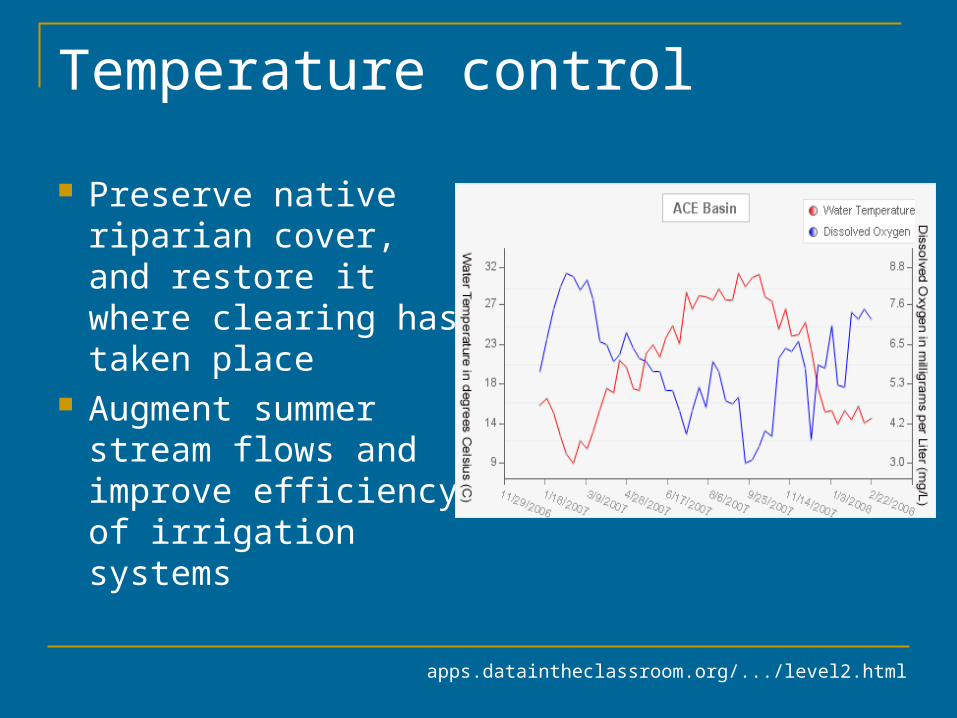
Temperature control
Preserve native riparian cover, and restore it where clearing has taken place
Augment summer stream flows and improve efficiency of irrigation systems
apps.dataintheclassroom.org/.../level2.html

The threat of inaction
Headwaters of the lower Clackamas could cease to be spawning grounds for salmon
The quality of drinking water could be affected, even becoming toxic
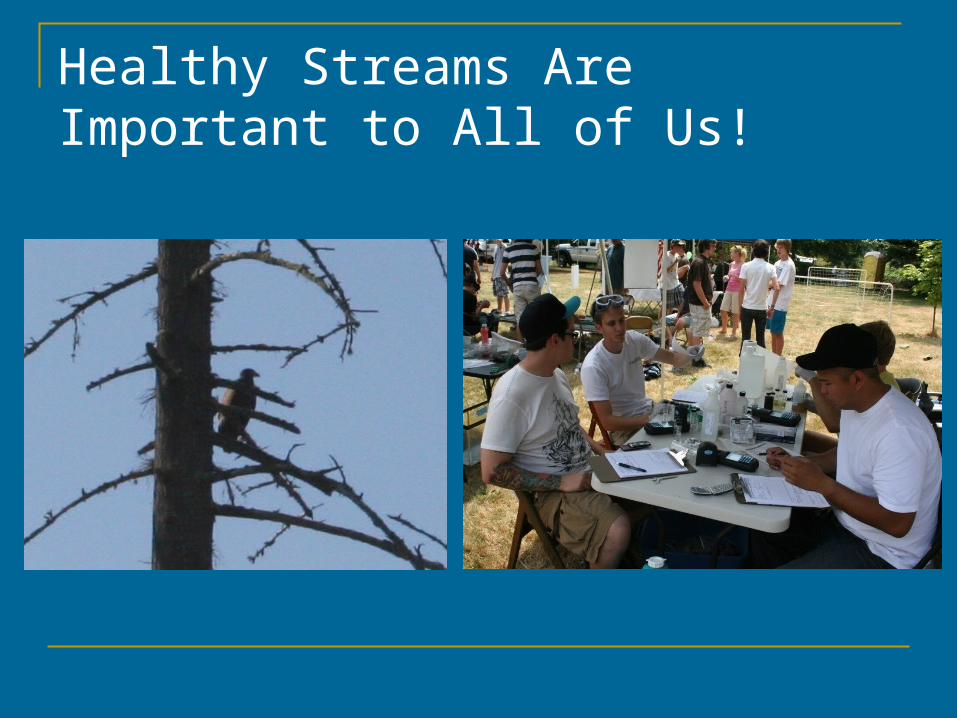
Healthy Streams Are Important to All of Us!
Ongoing Action
The more community participation, the more meaningful the results
Land owners can help by volunteering their stream frontage as a sample site
Citizens can volunteer to be stream monitors to collect data, helping to make the data more complete and conclusive

Thank you:Clackamas River Basin Council & community partners:
Clackamas River WaterWater Environment Services

Want to get involved?
Contact the Clackamas River Basin Council:
By email ~ [email protected]
By phone ~ 503-558-0550