Embed Size (px)
Citation preview
Whatever happened to the grey figure? recording crime in England and Wales,
19812004Hope, TJ
Title Whatever happened to the grey figure? recording crime in England and Wales, 19812004
Authors Hope, TJ
Type Conference or Workshop Item
URL This version is available at: http://usir.salford.ac.uk/29538/
Published Date 2010
USIR is a digital collection of the research output of the University of Salford. Where copyright permits, full text material held in the repository is made freely available online and can be read, downloaded and copied for noncommercial private study or research purposes. Please check the manuscript for any further copyright restrictions.
For more information, including our policy and submission procedure, pleasecontact the Repository Team at: [email protected].
Whatever happened to the grey figure? Recording crime in England and
Wales, 1981-2004
By Tim Hope, Professor of Criminology
University of Salford, Manchester
A crime is recorded by the police mainly because it is reported by the public, usually by victims.
In an ideal world, there should be no gap or ‘error’ between the rate of reporting incidents to the
police and the rate of recording by the police. Yet in the early days of the British Crime Survey,
it became apparent that a substantial gap or Grey Figure existed between the two (Bottomley and
Pease, 1986). In its review of crime statistics, the Home Office (2000) thought the Grey Figure
resulted from inconsistencies in recording practice between police forces. The National Crime
Recording Standard (NCRS) sought to abolish discretionary recording practices by including
further amendment of the Counting Rules, implemented from April 2002.
The rate of discretionary police crime recording is affected by a number of factors, for instance:
an obligation to record crime, due, for example, to public pressure (as in the case of sexual
violence) or in responding to insurers’ claim requirements regarding theft and loss; accounting to
the public (the NCRS principle of victim-focussed recording means counting more of what is
already recorded); and demonstrating effectiveness (between 1999 and 2004 the Home Office
obliged the police to achieve specified reductions in domestic burglary, theft of vehicles, and
robbery). The obligation to ‘do something’, therefore, leads to additional workload and
performance pressures on the police. Unfortunately, both are measured by the rate of recorded
crime. Different circumstances lead to different pressures and different discretionary
performance adjustments: when crime is going up, the pressure to do something is magnified at
the same time as workload pressure is increasing; but when it is dropping, the police can afford
to do more as long as they have the same resources at their disposal.
To test this notion, two indices were constructed (data are from Crime in England and Wales,
2003/04): (1) a Volume of Reported Crime Index ( defined as the product of the Victimisation
Rate (Table 2.02) and the proportion of incidents reported to the police (Table 3.02), with 1981 =
100); and (2) a Grey Figure Rate – the proportion of crimes reported to the police that appear to
have been recorded (defined as the ratio of offences recorded by police (Table 3.04) to
comparable crimes reported to police (Table 3.02) ). A comparison is made between the period
1981-1991, well before either the drop in crime or the implementation of the NCRS, and 1991-
2003/04, during which the number of recorded crimes dropped (indicated by the Volume
Reported Crime Index) and the NCRS was introduced.
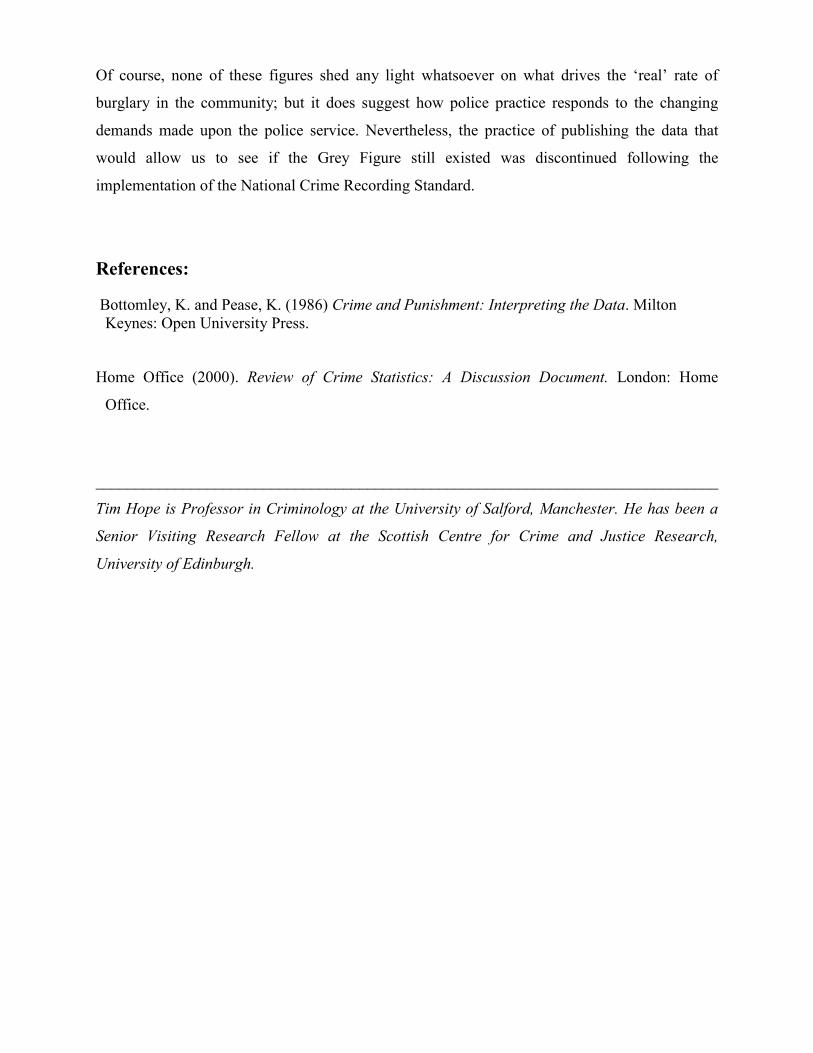
The BCS records separately Burglary with Loss and Nil-Loss Burglaries (including attempted
burglaries). Figures 1 and 2 show the different ways in which the Grey Figure responded to
changes in the volume of these offences. Both offences were subject to the same crime reduction
performance pressure. However, while Burglary involving loss also entails (insurance-required)
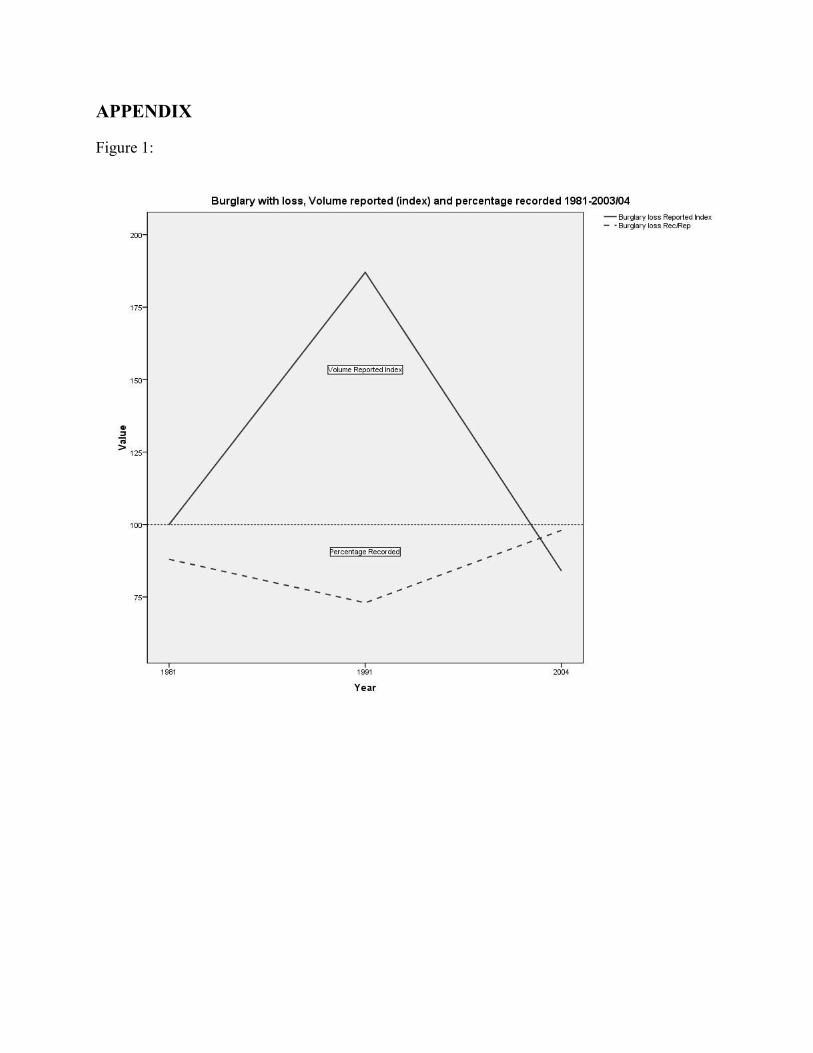
recording obligations, attempted and nil-Loss Burglaries do not. This can be seen in the much
lower recording rate for the latter. Figure 1 shows that when the volume of Burglaries with Loss
went up, the recording rate went down, presumably reflecting a workload adjustment. Happily,
when the volume of reported with loss burglaries declined in the second period and the
concomitant workload pressure subsided, the police could afford to let the recording rate rise
again (almost to the maximum), thus satisfying their recording obligation without prejudicing
their performance requirement.
Conversely, neither obligation nor crime reduction requirement apply to Attempted and Nil-Loss
Burglaries, so that the recording rate remained low and constant across both periods, irrespective
of a similar boom-and-bust trend in the volume of this crime. Furthermore, since the volume of
Attempts and Nil-Loss Burglaries reported had declined less than the volume of with-loss
burglaries, the former now become a proportionately bigger part of the total burglary figure.
This encouraged the view that the Government’s crime reduction programme might have worked
because what had been thought of as the rate of unsuccessful burglaries (i.e. those that did not
entail loss) appeared to have increased.
Of course, none of these figures shed any light whatsoever on what drives the ‘real’ rate of
burglary in the community; but it does suggest how police practice responds to the changing
demands made upon the police service. Nevertheless, the practice of publishing the data that
would allow us to see if the Grey Figure still existed was discontinued following the
implementation of the National Crime Recording Standard.
References:
Bottomley, K. and Pease, K. (1986) Crime and Punishment: Interpreting the Data. Milton
Keynes: Open University Press.
Home Office (2000). Review of Crime Statistics: A Discussion Document. London: Home
Office.
______________________________________________________________________________
Tim Hope is Professor in Criminology at the University of Salford, Manchester. He has been a
Senior Visiting Research Fellow at the Scottish Centre for Crime and Justice Research,
University of Edinburgh.
APPENDIX
Figure 1:
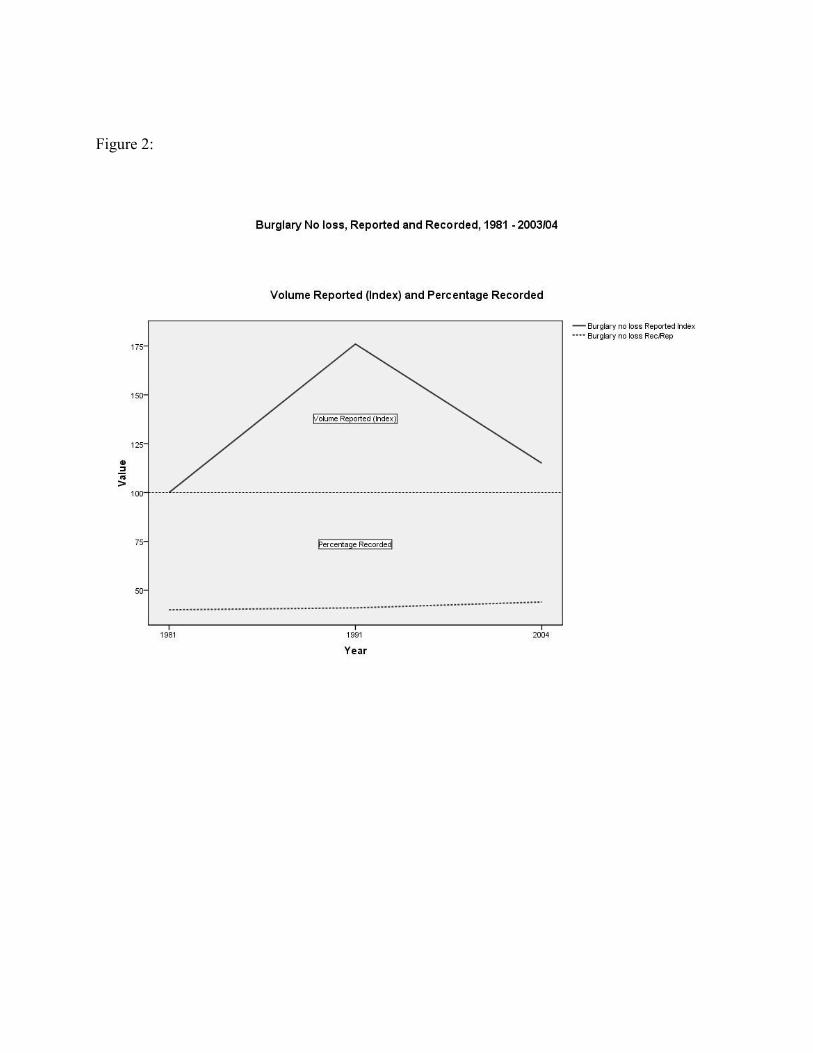
Figure 2: