Embed Size (px)
Citation preview

What we know about Onshore & Offshore
Wind Turbine Reliability with particular
reference to Future Offshore Wind Farm
Operational Performance Peter Tavner
Emeritus Professor, Durham University, UK
Past President, European Academy of Wind Energy
“The darkest regions of hell are reserved for those who remain
neutral at times of moral crisis”
Dante Alighieri
NTNU, EU FR7 MARE WINT Project
September 2013 1

Keynotes
• Aim to reduce risk, raise turbine Reliability and
Availability, Reduce offshore wind Cost of Energy;
• Wind Turbine Reliability from onshore experience;
• What we know about WT reliability;
• Wind Turbine Availability, what is happening
Offshore?
NTNU, EU FR7 MARE WINT Project
September 2013 2

Mitsubishi 1 MW,
Fixed-speed,
Stall-regulated,
Variable-pitch
Wind Turbine Power Curves
Alstom 1.67 MW,
Variable-speed,
Variable-pitch
NTNU, EU FR7 MARE WINT Project
September 2013 3

Wind
Turbine
Operation-
18 days
WT rating= 1.67MW
Variable-speed, Variable-pitch
Average output=490kW
Capacity factor =500/1670=29%

Actual Wind Power Production
UK & Spain
http://www.bmreports.com/bsp/bsp_home.htm https://demanda.ree.es/eolicaEng.html
NTNU, EU FR7 MARE WINT Project
September 2013 5

Trend in Turbine Failure Rates with Time
NTNU, EU FR7 MARE WINT Project
September 2013 6

WT Reliability and Size, EU
Small, group I Medium, group II Large, group III
NTNU, EU FR7 MARE WINT Project
September 2013 7

Reliability, Downtime and Subassemblies, EU
NTNU, EU FR7 MARE WINT Project
September 2013 8

Typical WT Generator Failure Intensities
NTNU, EU FR7 MARE WINT Project
September 2013 9

More detail on WT Generator Failures
NTNU, EU FR7 MARE WINT Project
September 2013 10
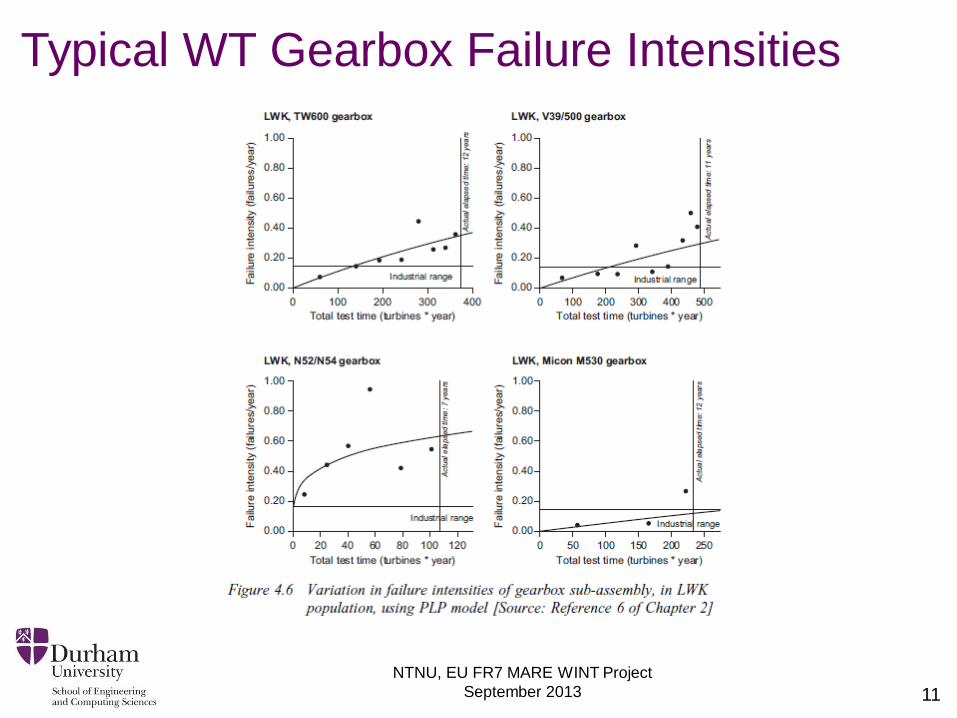
Typical WT Gearbox Failure Intensities
NTNU, EU FR7 MARE WINT Project
September 2013 11

WT Reliability-Downtime per
Assembly
-2 -1.5 -1 -0.5 0 0.5 1 1.5 2 2.5 3
Brake System
Grid
Structure
Blade System
Electrical
Converter
Generator
Ambient
Gearbox
Pitch System
Scheduled Service
Yaw System
Control System Egmond aan Zee Failure Rate, 108Turbine Years
Egmond aan Zee Downtime, 108Turbine Years
100 75 50 25 0 0.5 1 1.5 2 2.5 3
Annual Stop Frequency Downtime per Stop (days)
Stop Rate and Downtime from Egmond aan Zee Wind Farm, the Netherlands, over 3 Years
NTNU, EU FR7 MARE WINT Project
September 2013 12

Typical WT Converter Failure Intensities
NTNU, EU FR7 MARE WINT Project
September 2013 13

Data Source:
Reliawind Deliverable D.1.3 – Reliability
Profiles Figures subject to update.
Lighter larger background blocks show sub-systems;
Darker smaller foreground blocks show assemblies;
The line shows the Pareto cumulative contribution.
Reliability & Subassemblies, EU,
Reliawind
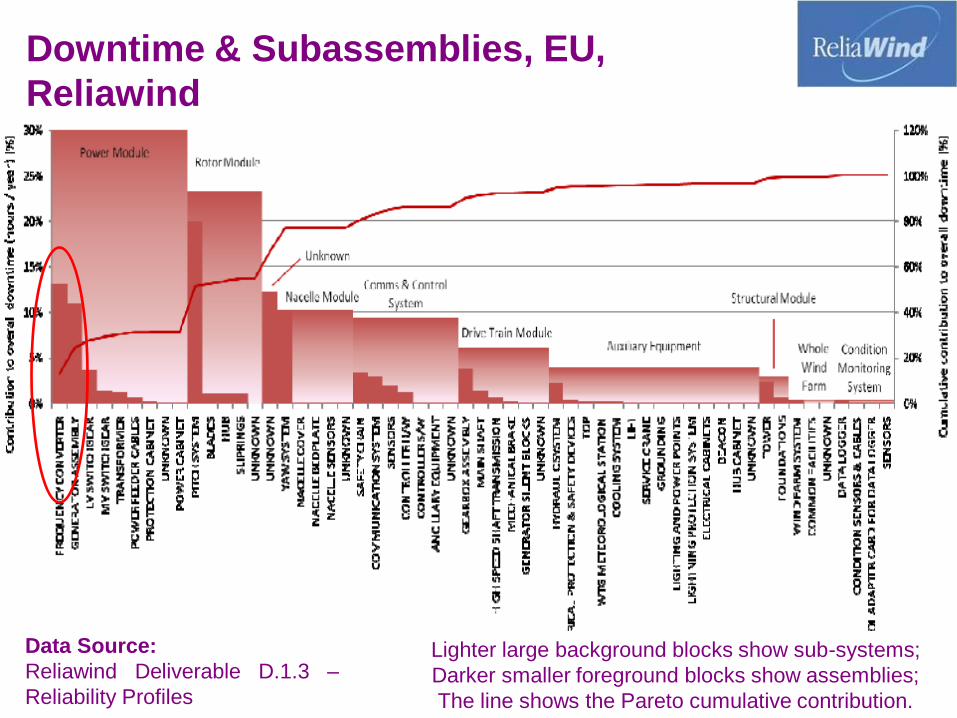
Data Source:
Reliawind Deliverable D.1.3 –
Reliability Profiles
Lighter large background blocks show sub-systems;
Darker smaller foreground blocks show assemblies;
The line shows the Pareto cumulative contribution.
Downtime & Subassemblies, EU,
Reliawind

Sub-system / Assembly
Failure Mode 1
Failure Mode 2
Failure Mode 3
Failure Mode 4
Failure Mode 5
Pitch
System
Electrical
(5 out of
13)
Battery Failure Pitch Motor
Failure
Pitch Motor
Converter Failure
Pitch Bearing
Failure
Temperature or
Humidity Sensor
Failure
Hydraulic
(5 out of 5)
Internal leakage
of proportional
valve
Internal leakage
of solenoid valve
Hydraulic
cylinder leakage
Position sensor
degraded or no
signal
Pressure control
valve sensor
degraded signal
Frequency Converter
(5 out of 18)
Generator-side or
Grid-side Inverter
Failure
Loss of
Generator Speed
Signal
Crowbar Failure Converter
Cooling Failure
Control Board
Failure
Yaw System
(5 out of 5)
Yaw gearbox &
pinion lubrication
out of
specification
Degraded wind
direction signal
Degraded
guiding element
function
Degraded
hydraulic
cylinder
function
Brake operation
valve does not
operate
Control System
(5 out of 5)
Temperature
sensor modules
malfunction
PLC analogue
input malfunction
PLC analogue
output
malfunction
PLC digital input
malfunction
PLC In Line
Controller
malfunction
Generator Assembly
(5 out of 11) Worn slip ring
brushes
Stator winding
temperature
sensor failure
Encoder failure Bearing failure External fan
failure
Gearbox Assembly
(5 out of 5) Planetary Gear
Failure
High Speed Shaft
Bearing Failure
Intermediate
Shaft Bearing
Failure
Planetary
Bearing Failure
Lubrication
System
Malfunction
Summary of least reliable sub-assemblies
& their failure modes

Studies on Different WTs
• WT Make A
– 153x1.5-2MW WTs with 3-blades, electric pitch-
regulation, geared-drive, DFIG generator and
partially-rated converter
– 6 Wind Farms
– Over 2 years
• WT Make B
– 366x2.5MW WTs with 3-blades, electric pitch-
regulation, geared-drive, synchronous generator
and fully-rated converter
– 1 year
NTNU, EU FR7 MARE WINT Project
September 2013 17

SCADA Alarm System
Performance Evaluation -KPIs
* Reference : Alarm systems, a guide to design, management and procurement No. 191 Engineering Equipment and Materials Users Association 1999 ISBN 0 8593 1076 0
• KPIs: Key Performance Indices *
– KPI 1, Average Alarm Rate: Long term average of the number of alarm triggers occurring within a 10 min SCADA interval.
– KPI 2, Maximum Alarm Rate: Maximum number of alarm triggers occurring within a 10 min SCADA interval.
• Additional Definitions *
– Alarm Shower: A single fault causing a large number of alarm triggers, in this work an Alarm Shower consists of > 10 alarm triggers
NTNU, EU FR7 MARE WINT Project
September 2013 18

Alarm KPIs from 7 Wind Farms
NTNU, EU FR7 MARE WINT Project
September 2013 19

WT Make A – Alarm System Performance
• Reactive- peak alarm rate during upset is unmanageable and alarm system
will continue to present an unhelpful distraction to the operator for long period.
• Stable- Alarms have been well defined for normal operation, but the system is
less useful during plant upset.
Wind Farms
3 & 6Wind Farm 4
Wind Farms
1 & 5Wind Farm 2
1 10000 10000010 100 1000
KPI 2, Maximum AlarmTriggers per 10 min
KP
I 1
, A
ve
ra
ge
Ala
rm
Trig
ge
rs
pe
r 1
0 m
in
10
01
00
00
.11
10
Reactive Alarms
Stable Alarms
Recommendation
for Alarm presentation
to humans Presentation
to Operators
Alarm Rates
must be pre-
processed
NTNU, EU FR7 MARE WINT Project
September 2013 20

WT Pitch Mechanism Taxonomy
NTNU, EU FR7 MARE WINT Project
September 2013 21

WT Pitch Alarm,
Relationships over 2 years,
Qiu et al
NTNU, EU FR7 MARE WINT Project
September 2013 22
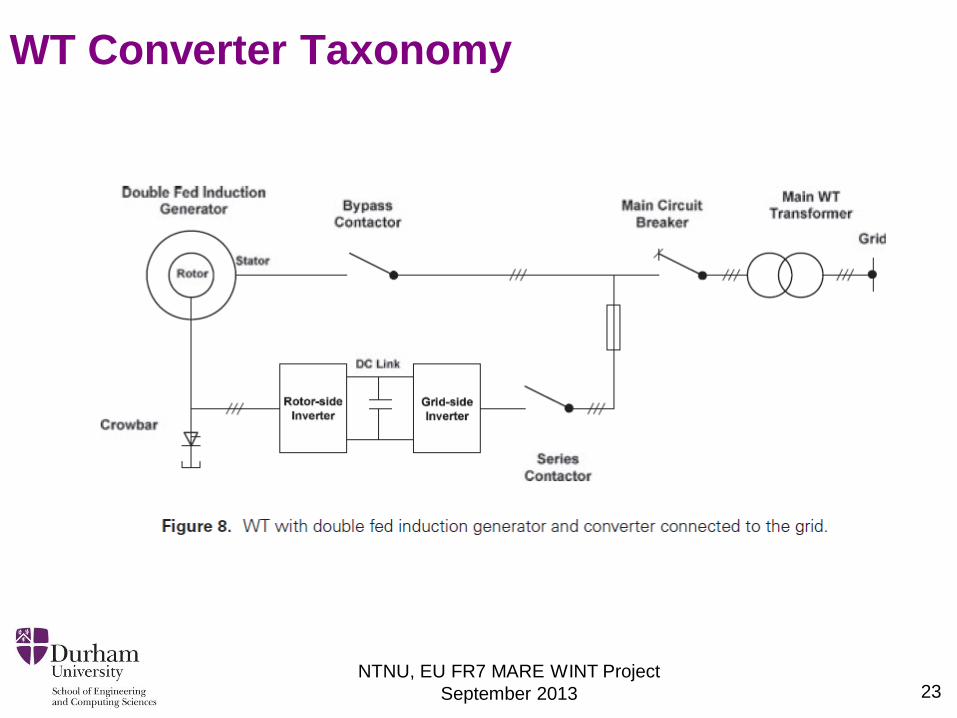
WT Converter Taxonomy
NTNU, EU FR7 MARE WINT Project
September 2013 23

369 - Pitch
372-374 - Blade1-3 Emergency322 - Inverter
338/343
Rotor-side Inverter Over-
current/
Over- temperature
349
Grid Voltage Dip
337
Grid-side
Inverter Over-
current
263
Main Switch
345
DC Overvoltage
WT Converter Alarms,
Statistical Relationships over 2 years,
Qiu et al

WT Converter Alarm
Showers,
2 years,
Qiu et al 2 years
1st grid
incident 2nd grid
incident

Power Electronics Reliability,
Measured, Wolfgang
NTNU, EU FR7 MARE WINT Project
September 2013 26

WT Unreliability & Importance of Pre-Testing
Root Causes
Failure Modes
And Effects
Analysis,
FMEA
Condition
Monitoring
Signals
SCADA
Signal
Analysis
Wind condition
Weather
Faulty design
Faulty materials
Poor maintenance
How?
Pre-Testing during Prototype Development
Or In-Service SCADA & CMS Analysis & Diagnosis
Why?
Root Cause Analysis
Failure Location
NTNU, EU FR7 MARE WINT Project
September 2013 27

Onshore
Availability and Wind Speed
0.0
20.0
40.0
60.0
80.0
100.0
0.0 2.0 4.0 6.0 8.0 10.0 12.0 14.0
Ava
ilab
ility
, %
Wind Speed, m/s
Brazos, Texas, USA, 160 MW, 160 x Mitsubishi MWT1000, 1 MW
NTNU, EU FR7 MARE WINT Project
September 2013 28

0.0
20.0
40.0
60.0
80.0
100.0
0.0 2.0 4.0 6.0 8.0 10.0 12.0 14.0
Ava
ilab
ility
, %
Wind Speed, m/s
Barrow, UK, 90 MW, 30 x Vestas V90, 3 MW
Offshore
Availability and Wind Speed
29
0.0
20.0
40.0
60.0
80.0
100.0
0.0 2.0 4.0 6.0 8.0 10.0 12.0 14.0
Ava
ilab
ility
, %
Wind Speed, m/s
Scroby Sands, UK, 60 MW, 30 x Vestas V80, 2 MW
0.0
20.0
40.0
60.0
80.0
100.0
0.0 2.0 4.0 6.0 8.0 10.0 12.0 14.0
Ava
ilab
ility
, %
Wind Speed, m/s
Kentish Flats, UK,90 MW, 30 x Vestas V90, 3 MW
0.0
20.0
40.0
60.0
80.0
100.0
0.0 2.0 4.0 6.0 8.0 10.0 12.0 14.0
Ava
ilab
ility
, %
Wind Speed, m/s
Egmond aan Zee, Netherlands, 108 MW, 36 x Vestas V90, 3 MW
0.0
20.0
40.0
60.0
80.0
100.0
0.0 2.0 4.0 6.0 8.0 10.0 12.0 14.0
Ava
ilab
ility
,%
Wind Speed, m/s
North Hoyle, UK, 60 MW, 30 x Vestas V80, 2 MW

Onshore Availability and Wind
Speed, World
40%
energy
produced
at wind
speeds
>11m/s
NTNU, EU FR7 MARE WINT Project
September 2013

North European Offshore Wind Farm Performance
0
10
20
30
40
50
60
70
80
90
100
Win
d S
pee
d, m
/s; C
apac
ity
Fact
or,
%; A
vaila
bili
ty, %
Availability
Capacity
Factor
Wind
Speed
NTNU, EU FR7 MARE WINT Project
September 2013 31
Three North European Offshore Wind Farms
Scroby Sands North Hoyle Egmond aan Zee

Relationship between Failures & Weather
NTNU, EU FR7 MARE WINT Project
September 2013 32

Relationship between Failures & Weather
NTNU, EU FR7 MARE WINT Project
September 2013 33
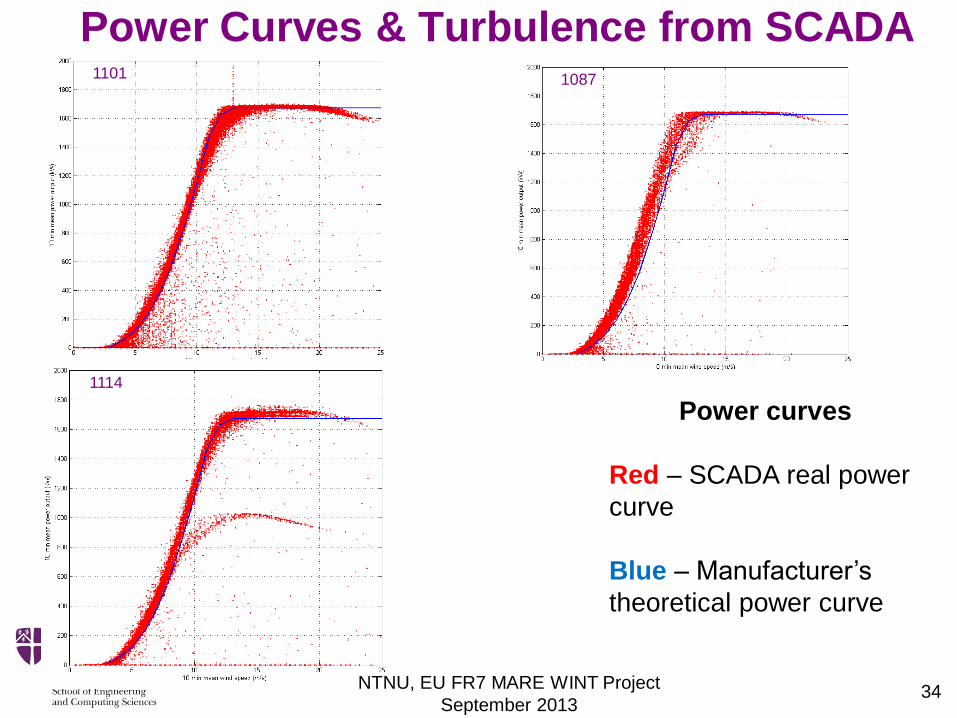
Power Curves & Turbulence from SCADA 1101 1087
1114
Power curves
Red – SCADA real power
curve
Blue – Manufacturer’s
theoretical power curve
NTNU, EU FR7 MARE WINT Project
September 2013 34

Wind Turbulence from Fast Data
Distribution of
wind velocity
Gaussian
Distribution
Is this difference
driving failures?
Probability density function of spatial transversal wind
velocity increments over a distance of 10 m, for τ=4 s
compared to a Gaussian distribution.
NTNU, EU FR7 MARE WINT Project
September 2013 35

Wind Turbulence from Slow Data
WT SCADA
Probability density function of wind velocity
from 10 min SCADA
Gaussian
Distribution
Distribution of
wind velocity
from SCADA
NTNU, EU FR7 MARE WINT Project
September 2013 36

Wind Turbulence from Slow Data
WT SCADA
NTNU, EU FR7 MARE WINT Project
September 2013 37

Turbulence in
context
But turbulence of this
dimension could affect
drive train
Turbulence of this
dimension will not
affect drive train
NTNU, EU FR7 MARE WINT Project
September 2013 38

0.0%
0.5%
1.0%
1.5%
2.0%
2.5%
0 5000 10000 15000 20000 25000
Pe
rce
nta
ge lo
ad c
han
ge o
ccu
rre
nce
s
Radial load change on left HSS gearbox bearing every 10 mins (N)
1097
1209
1221
1222
1096
1217
1202
1219
1098
1103
1114
1120
1557
1558
1560
1339
1341
1342
• Most based on 2.2 years data
• Use bin size of 100 N
• High variety between 0-6000N
• WTs are from 5 different sites
SCADA Load Changes, 18 different WTs
Courtesy: Dr Hui Long NTNU, EU FR7 MARE WINT Project
September 2013 39

0.0%
0.5%
1.0%
1.5%
2.0%
2.5%
0 1000 2000 3000 4000 5000 6000
Pe
rce
nta
ge o
f lo
ad c
han
ge o
ccu
rre
nce
s
Radial load change on left HSS gearbox bearing every 10 mins (N)
1097
1096
1098
Difference between sites, Site 1
Healthy WTs with relatively low load change
WTs from same site have similar load change
distributions
Courtesy: Dr Hui Long NTNU, EU FR7 MARE WINT Project
September 2013 40

0.0%
0.5%
1.0%
1.5%
2.0%
2.5%
0 1000 2000 3000 4000 5000 6000
Pe
rce
nta
ge o
f lo
ad c
han
ge o
ccu
rre
nce
s
Radial load change on left HSS gearbox bearing every 10 mins (N)
1209
1221
1222
1217
1202
1219
Difference between sites, Site 4
Two WTs on this site had
serious failures
Courtesy: Dr Hui Long NTNU, EU FR7 MARE WINT Project
September 2013 41
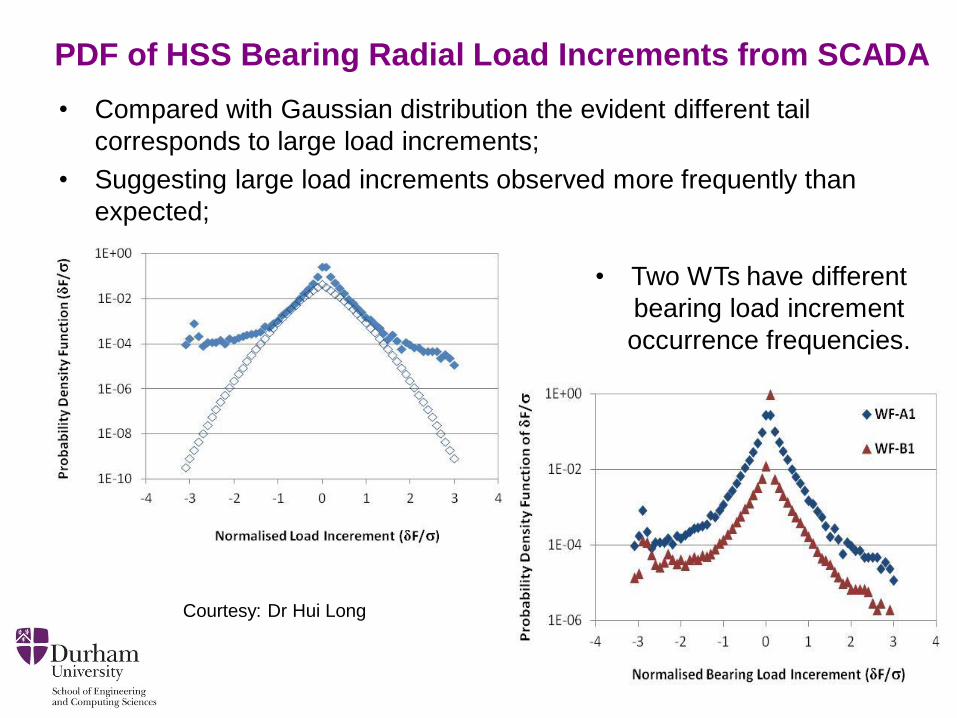
PDF of HSS Bearing Radial Load Increments from SCADA
• Compared with Gaussian distribution the evident different tail
corresponds to large load increments;
• Suggesting large load increments observed more frequently than
expected;
• Two WTs have different
bearing load increment
occurrence frequencies.
Courtesy: Dr Hui Long

Conclusions
• For onshore WTs 75% faults cause 5% downtime, 25% faults cause
95% downtime
• Pitch and Main Converters suffer from many faults but with low
downtimes.
• Pitch and Main Converters represent a significant part of the 75%.
• This behaviour could be problematic offshore.
• WT reliability is affecting offshore performance
• Sub-assemblies with high failure rates are consistent
• Turbulence seems to be causing failures
• Analysis of SCADA wind speeds, torques & shaft speeds is showing
ample evidence of turbulent effects
• Link between turbulence and failures is difficult to prove
• The mathematical tools to be used are not yet clear
NTNU, EU FR7 MARE WINT Project
September 2013 43

References Tavner PJ, Xiang JP and Spinato F, Reliability analysis for wind
turbines. Wind Energy 10(1): 1-18, 2006.
Spinato F, Tavner PJ, van Bussel GJW and Koutoulakos E, Reliability
of wind turbine subassemblies. IET Renewable, Power Generation
3(4): 1–15, 2009.
Wilkinson M, Hendriks B, Spinato F, Gomez E, Bulacio H, Roca J,
Tavner P J, Feng Y, Long H, Methodology and results of the
ReliaWind reliability field study, Scientific Track, European Wind
Energy Conference, Warsaw, 2010.
Feng Y, Tavner PJ and Long H, Early experiences with UK round 1
offshore wind farms, Proc Institution of Civil Engineers – Energy,
163(EN4): 167–181, 2010.
Tavner, P J, Faulstich, S, Hahn, B, van Bussel, G J W, Reliability &
availability of wind turbine electrical & electronic components,
European Power Electronics Journal, 20(4): 1-6, 2010.
Faulstich, S., Hahn B., Tavner, P. J., Wind turbine downtime and its
importance for offshore deployment, Wind Energy,
DOI: 10.1002/we.421, published on early view.
NTNU, EU FR7 MARE WINT Project
September 2013 44