Embed Size (px)
Citation preview
1
What We Have Learned From Retrofit Studies
Stacy Gloss, research specialistIndoor Climate Research and Training
University of Illinois

2
3
◦ Identify radon zones on EPAs radon zone map.◦ Describe differences on radon levels from two residential ventilation strategies.◦ Recognize some patterns of correlation between temperature and radon.◦ List pros and cons of different radon test methods.◦ Discuss patterns of variability of radon from multiple factors.◦ Describe impacts of different retrofit measures.
4
What is radon? How is it identified? (test methods) What do research studies tell us about radon and residential retrofit?
What policies tell us to do when practitioners find radon in a home.
Wrap up and Conclusions.

5
I am not a Ph.D. scientist. I’m not a policy wonk. I’m not an epidemiologist.
I have been spending some time in people’s crawlspaces and basements testing radon before and after residential retrofits for research.
I look forward to sharing with you what I’ve learned.
6
Do you consider yourself to have moderate to advanced level of radon knowledge?
(Raise your hand. Don’t be shy.)
7
Have you ever tested a home for radon?
8
Are you familiar with active soil depressurization and other radon mitigation techniques?
9
10
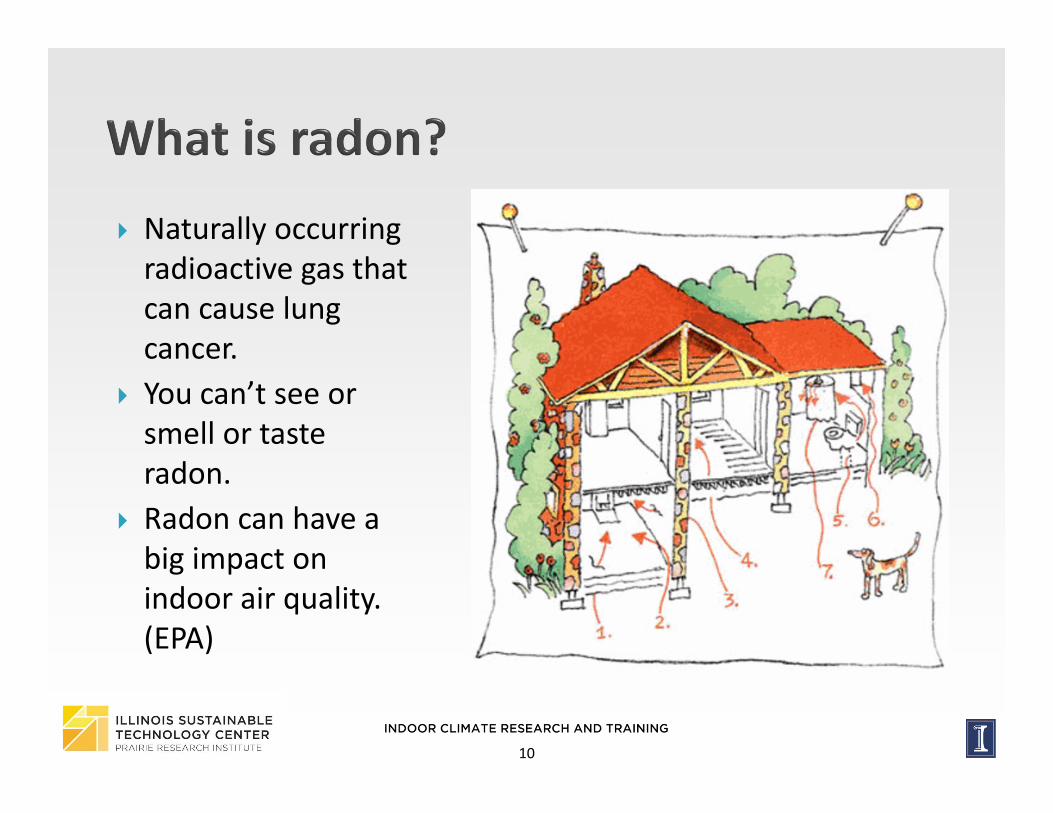
Naturally occurring radioactive gas that can cause lung cancer.
You can’t see or smell or taste radon.
Radon can have a big impact on indoor air quality. (EPA)
11
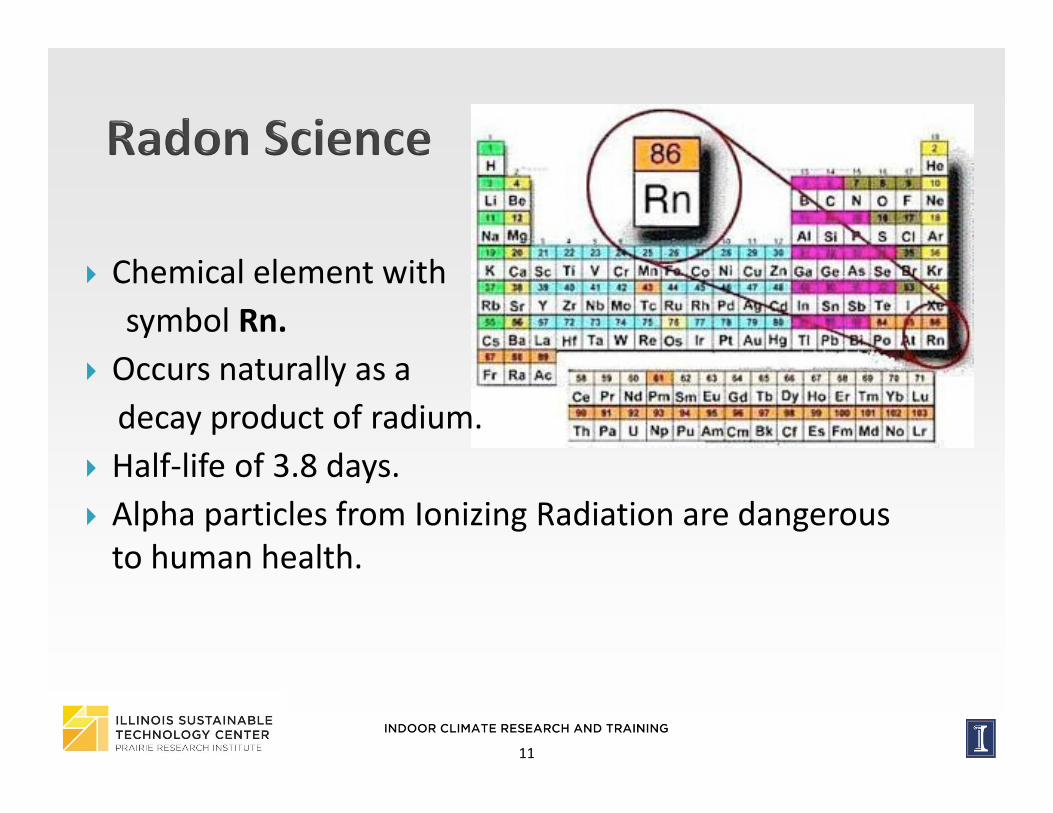
Chemical element with symbol Rn.
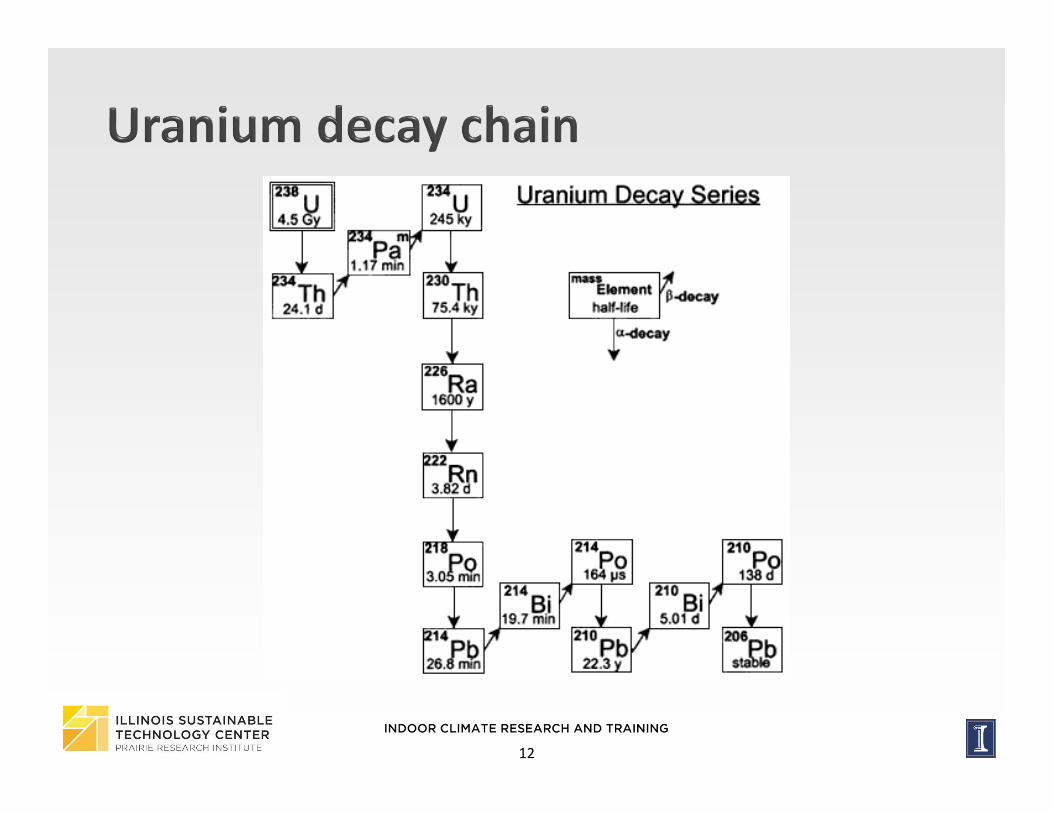
Occurs naturally as a decay product of radium.
Half‐life of 3.8 days. Alpha particles from Ionizing Radiation are dangerous to human health.
12
13
Radon decay products – alpha particles. ◦ Alpha particles are solids and can stick to surfaces such as dust particles in the air that are breathed in.
Radon can get into the lung through respiration, and can decay to radioactive solids or radon progeny.
Can damage lung cells and cause lung cancer
14
Most common unit in U.S. pCi/l = picocuries per liter◦ For each pCi/l there are 2.2 radioactive disintegrations per minute (source: radon‐faq.com)
EPA Threshold 4.0 pCi/L
15
16
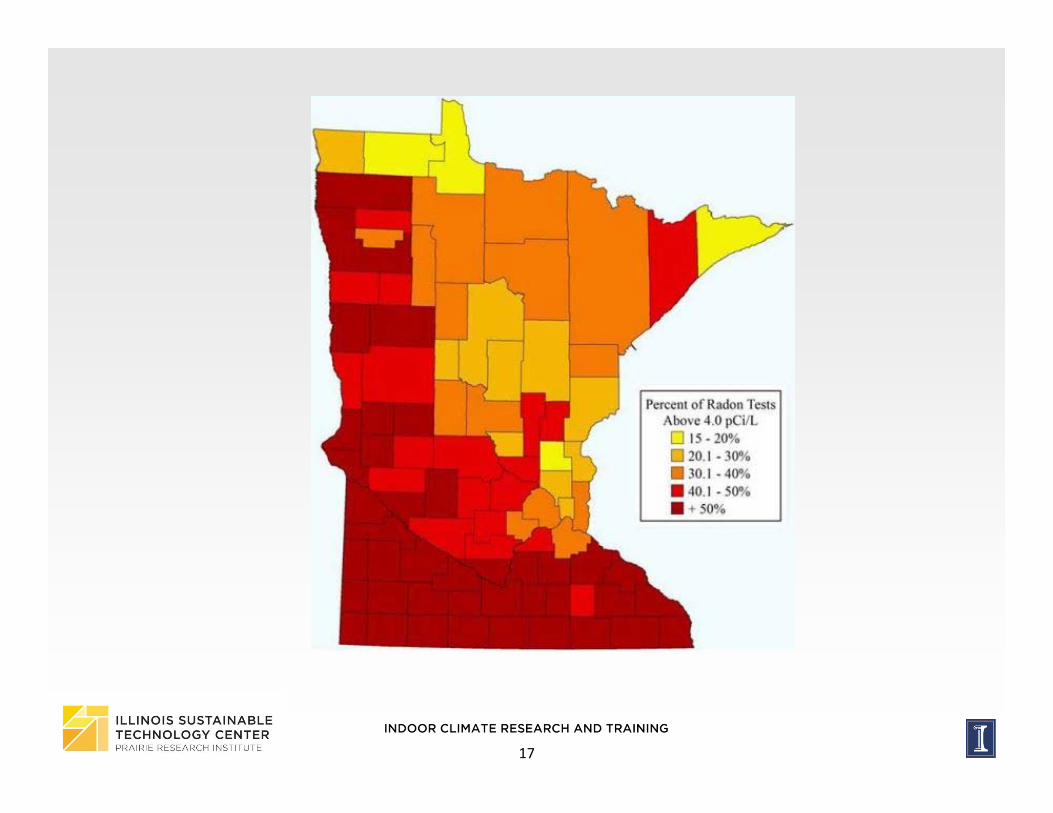
17
18
Developed in early 1980s Recommend mitigation for levels > 4 pCi/l
19
The Story of Stanley Watrous
The Watrous house tested at 2,700 picocuries per liter,700x the recommended level.
20
21
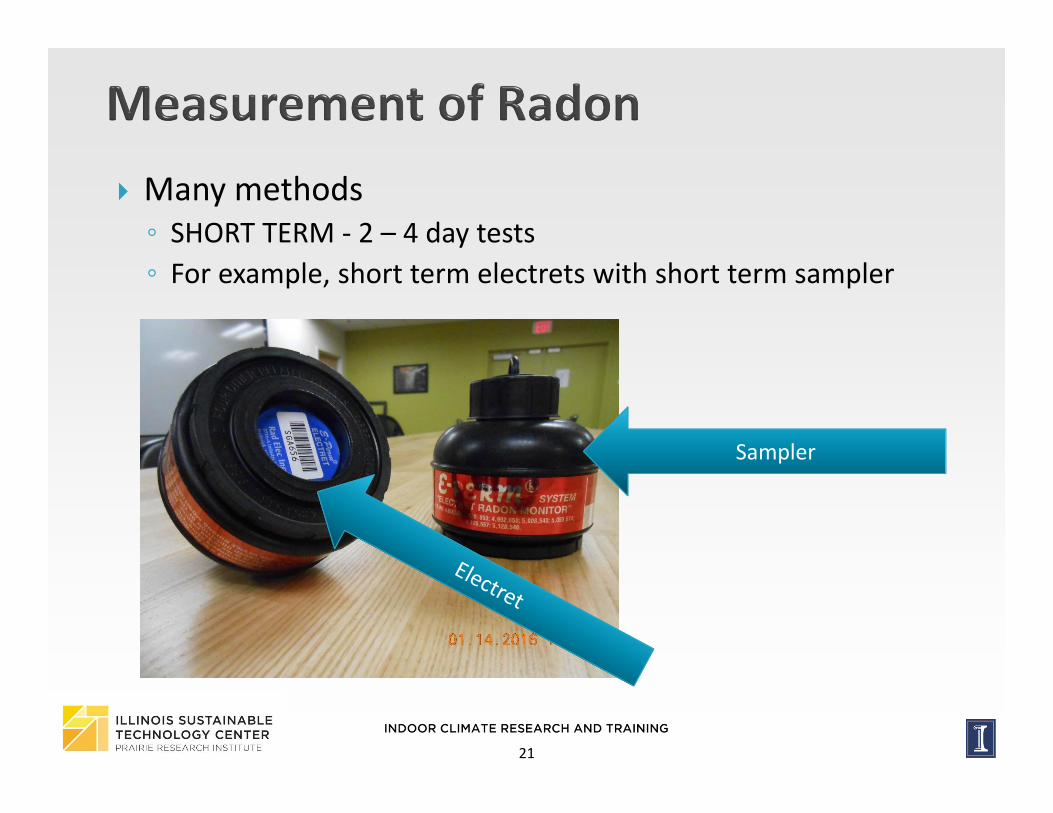
Many methods ◦ SHORT TERM ‐ 2 – 4 day tests ◦ For example, short term electrets with short term sampler
Sampler
22
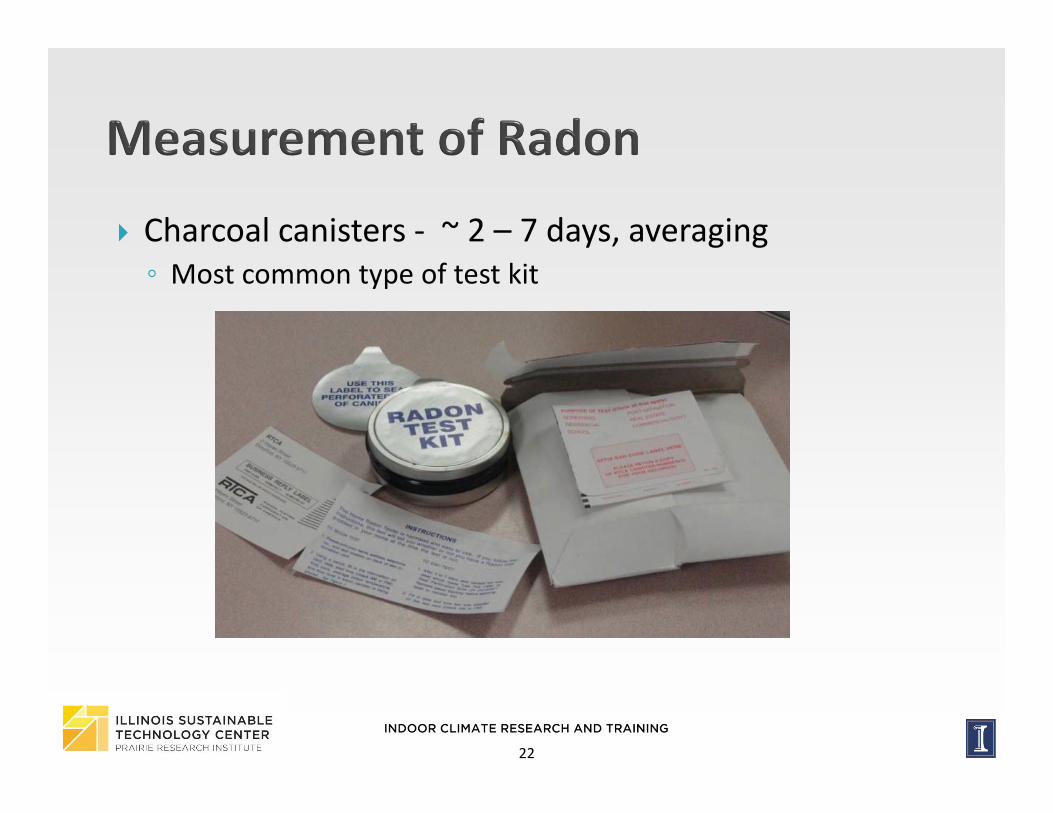
Charcoal canisters ‐ ~ 2 – 7 days, averaging◦ Most common type of test kit
23
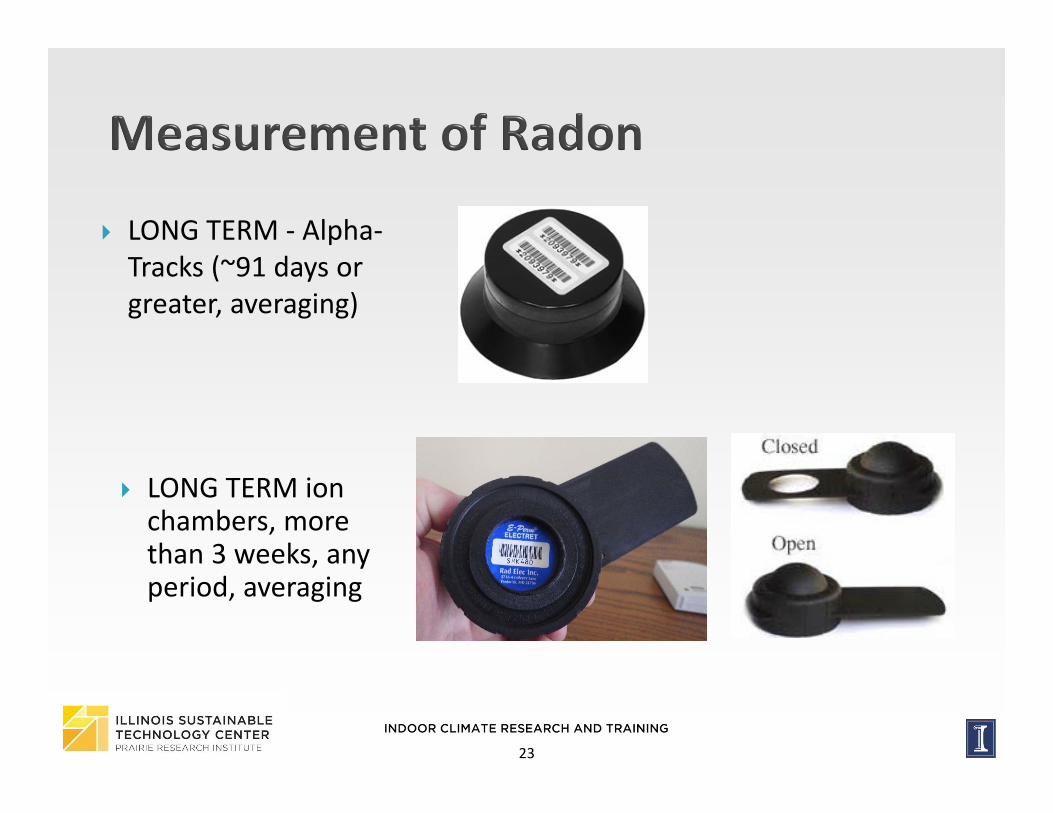
LONG TERM ‐ Alpha‐Tracks (~91 days or greater, averaging)
LONG TERM ion chambers, more than 3 weeks, any period, averaging
24
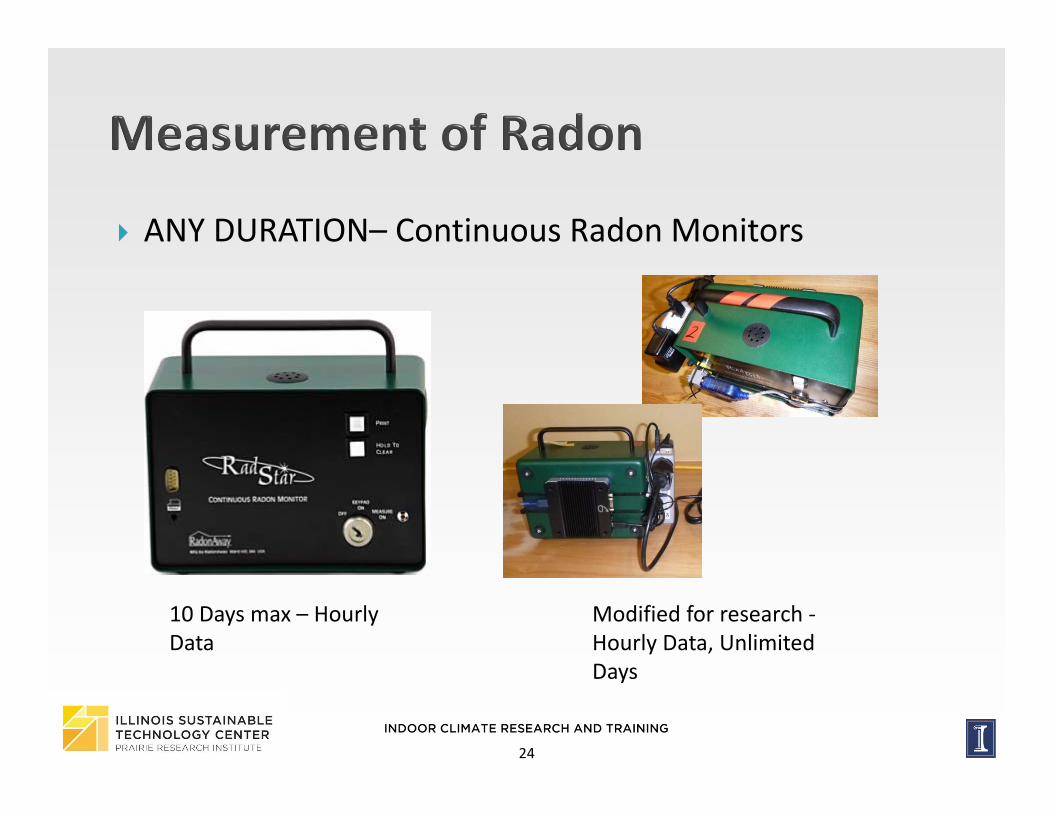
ANY DURATION– Continuous Radon Monitors
10 Days max – Hourly Data
Modified for research ‐Hourly Data, Unlimited Days
25
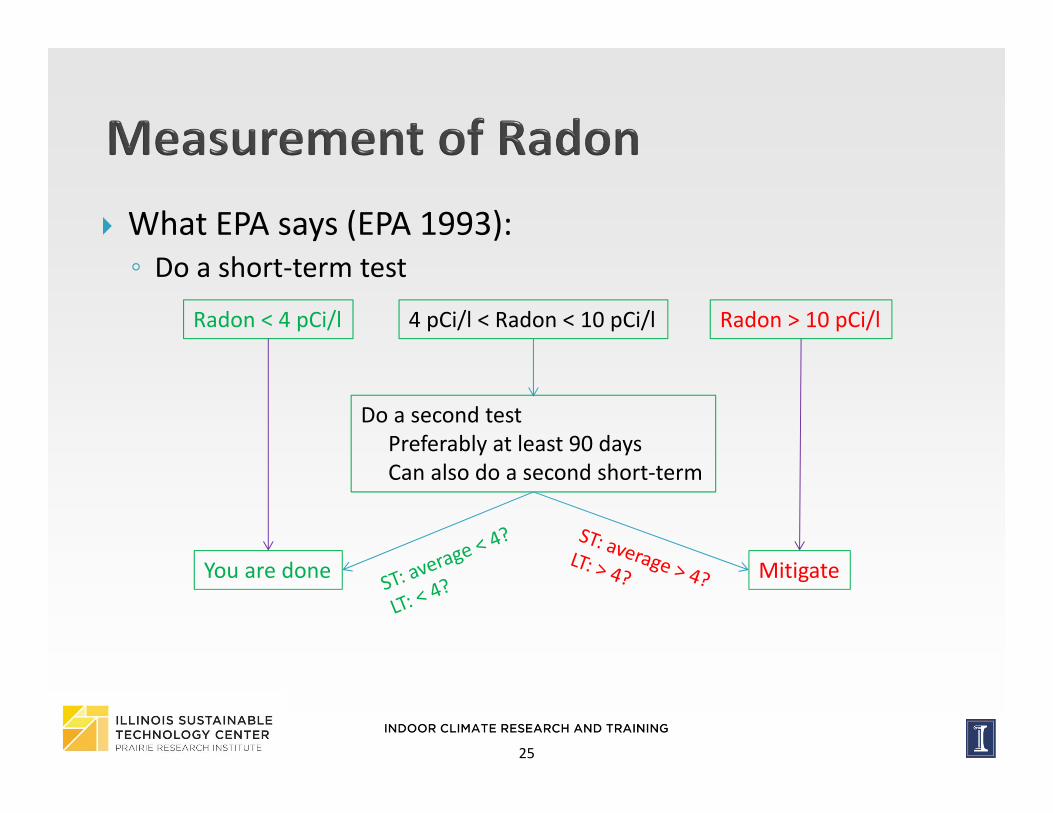
What EPA says (EPA 1993):◦ Do a short‐term test
Radon < 4 pCi/l 4 pCi/l < Radon < 10 pCi/l Radon > 10 pCi/l
You are done Mitigate
Do a second testPreferably at least 90 daysCan also do a second short‐term
26
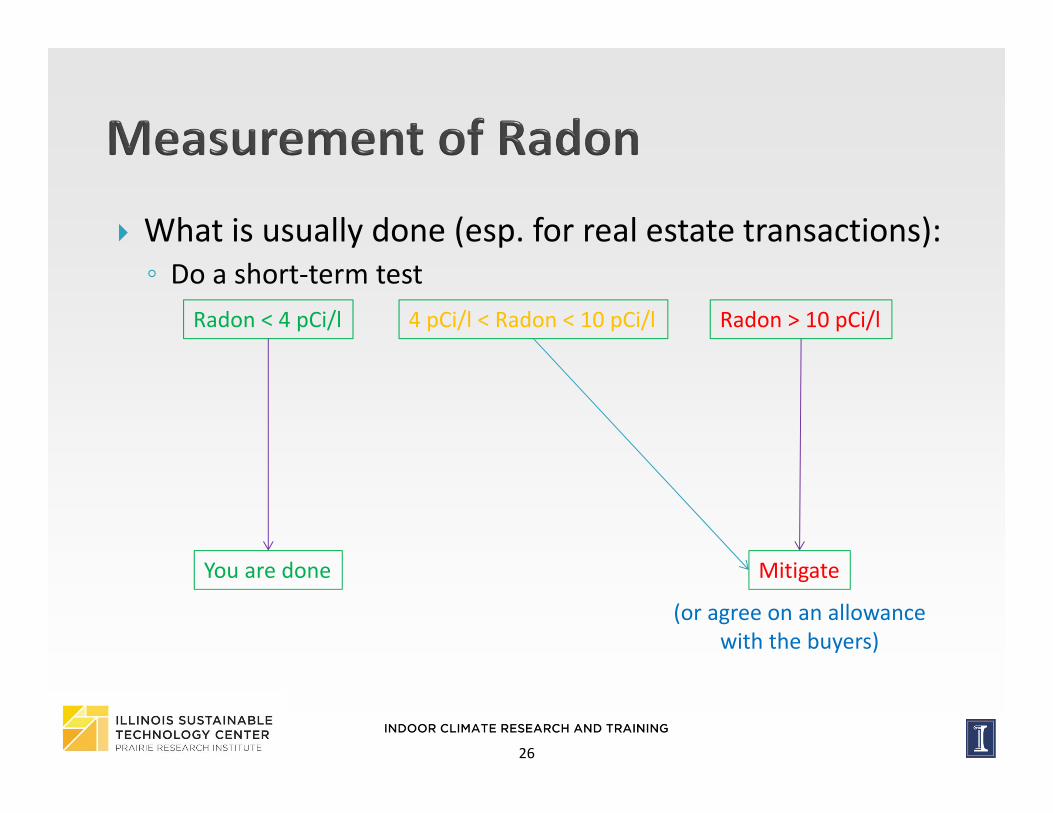
What is usually done (esp. for real estate transactions):◦ Do a short‐term test
Radon < 4 pCi/l 4 pCi/l < Radon < 10 pCi/l Radon > 10 pCi/l
You are done Mitigate
(or agree on an allowancewith the buyers)
27
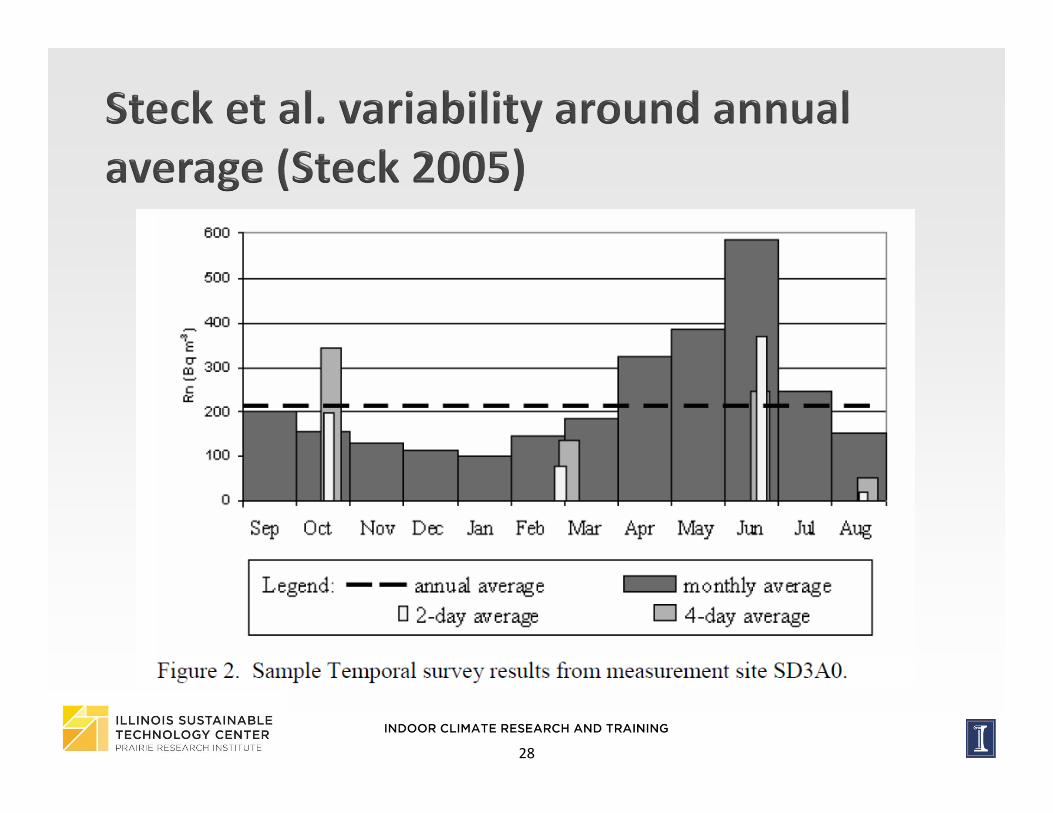
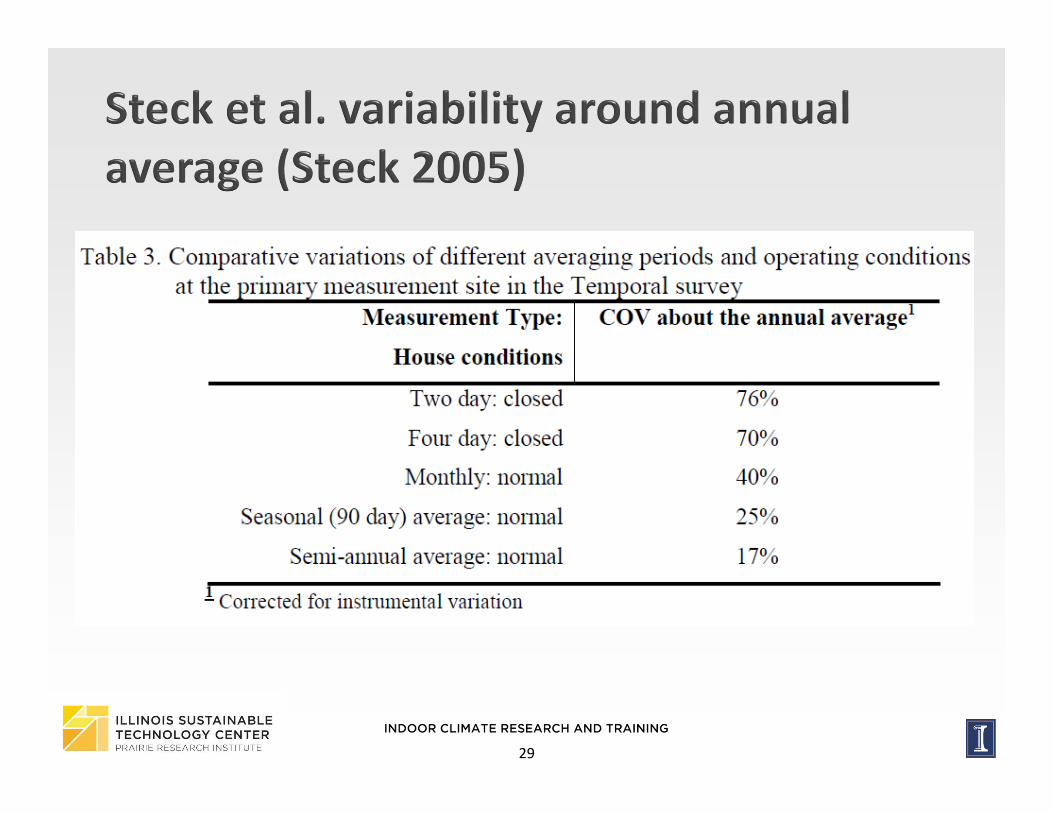
Remember, action level is intended to be an ANNUAL AVERAGE
Lots of work on variability by Steck et al.◦ Variability around an annual average for multiple periods◦ Annual variability (year‐to‐year)
28
29
30
23
45
67
Rad
on le
vel,
Site
3 li
ving
leve
l, pC
i/l
Time
Hourly 4-day1-week 2-week
31
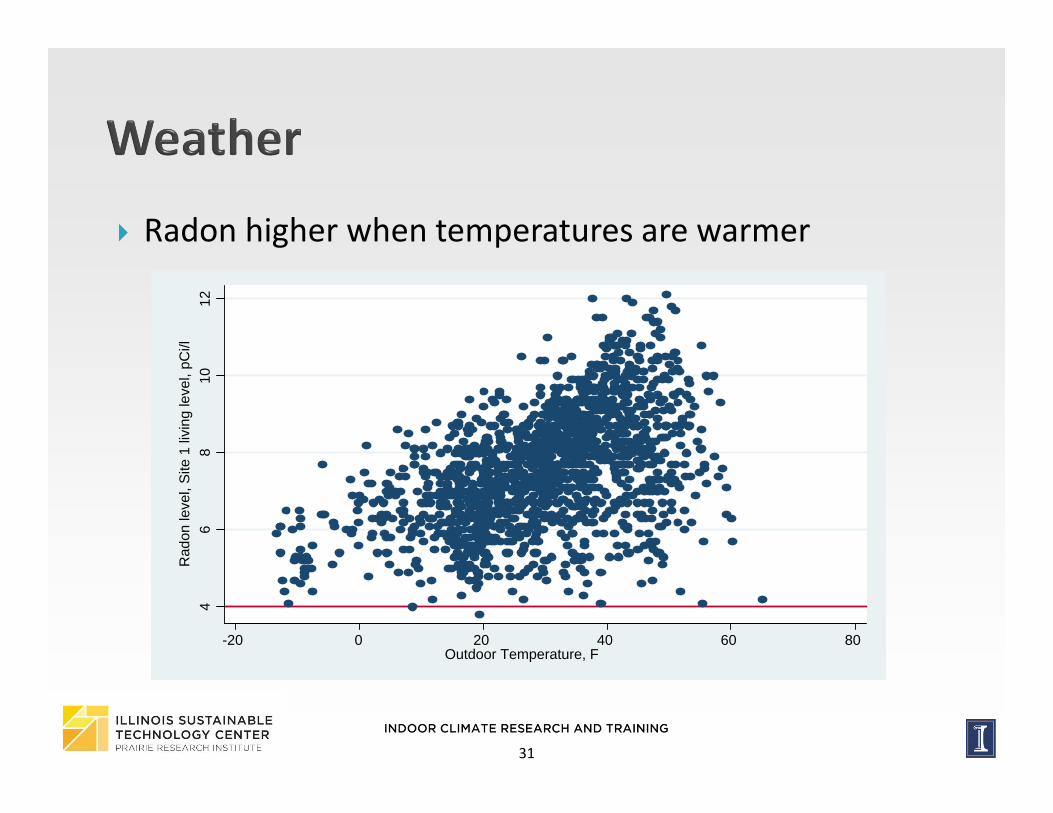
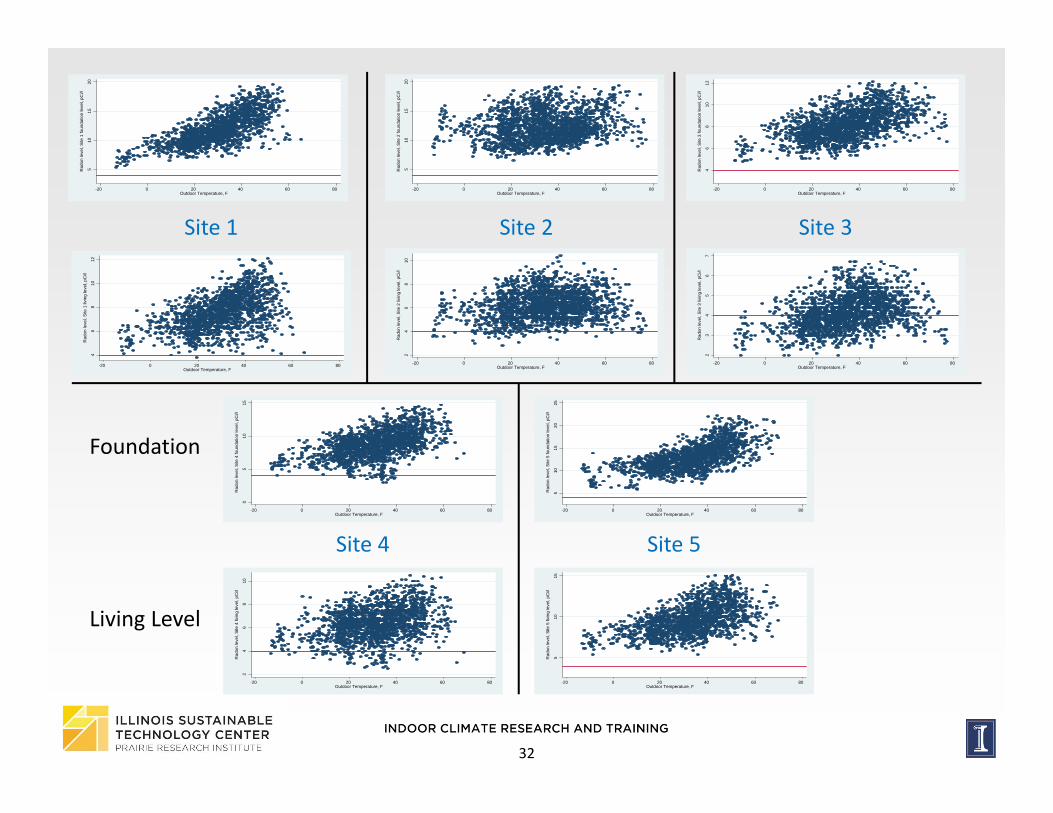
Radon higher when temperatures are warmer4
68
1012
Rad
on le
vel,
Site
1 li
ving
leve
l, pC
i/l
-20 0 20 40 60 80Outdoor Temperature, F
32
510
1520
Rad
on le
vel,
Site
1 fo
unda
tion
leve
l, pC
i/l
-20 0 20 40 60 80Outdoor Temperature, F
46
810
12
Rad
on le
vel,
Site
1 li
ving
leve
l, pC
i/l
-20 0 20 40 60 80Outdoor Temperature, F
510
1520
Rad
on le
vel,
Site
2 fo
unda
tion
leve
l, pC
i/l
-20 0 20 40 60 80Outdoor Temperature, F
24
68
10
Rad
on le
vel,
Site
2 li
ving
leve
l, pC
i/l
-20 0 20 40 60 80Outdoor Temperature, F
46
810
12
Rad
on le
vel,
Site
3 fo
unda
tion
leve
l, pC
i/l
-20 0 20 40 60 80Outdoor Temperature, F
23
45
67
Rad
on le
vel,
Site
3 li
ving
leve
l, pC
i/l
-20 0 20 40 60 80Outdoor Temperature, F
05
1015
Rad
on le
vel,
Site
4 fo
unda
tion
leve
l, pC
i/l
-20 0 20 40 60 80Outdoor Temperature, F
24
68
10
Rad
on le
vel,
Site
4 li
ving
leve
l, pC
i/l
-20 0 20 40 60 80Outdoor Temperature, F
510
1520
25
Rad
on le
vel,
Site
5 fo
unda
tion
leve
l, pC
i/l
-20 0 20 40 60 80Outdoor Temperature, F
510
15
Rad
on le
vel,
Site
5 li
ving
leve
l, pC
i/l
-20 0 20 40 60 80Outdoor Temperature, F
Site 1 Site 2 Site 3
Site 4 Site 5
Foundation
Living Level
33
Probably all pretty good at measuring what happened when they were there.
Instrumentation itself is not problematic.
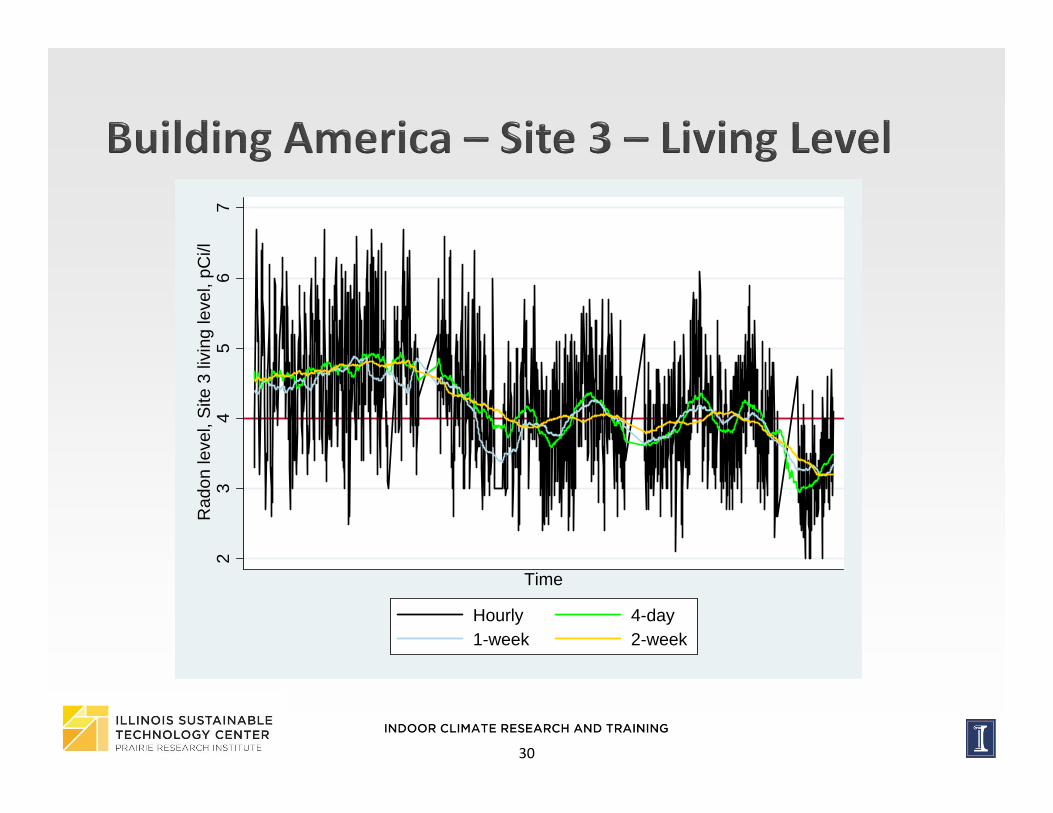
The problem is that radon is so variable – levels you see this 2 or 4 days may not be the levels you will see 2 or 4 weeks from now.

34
35
36
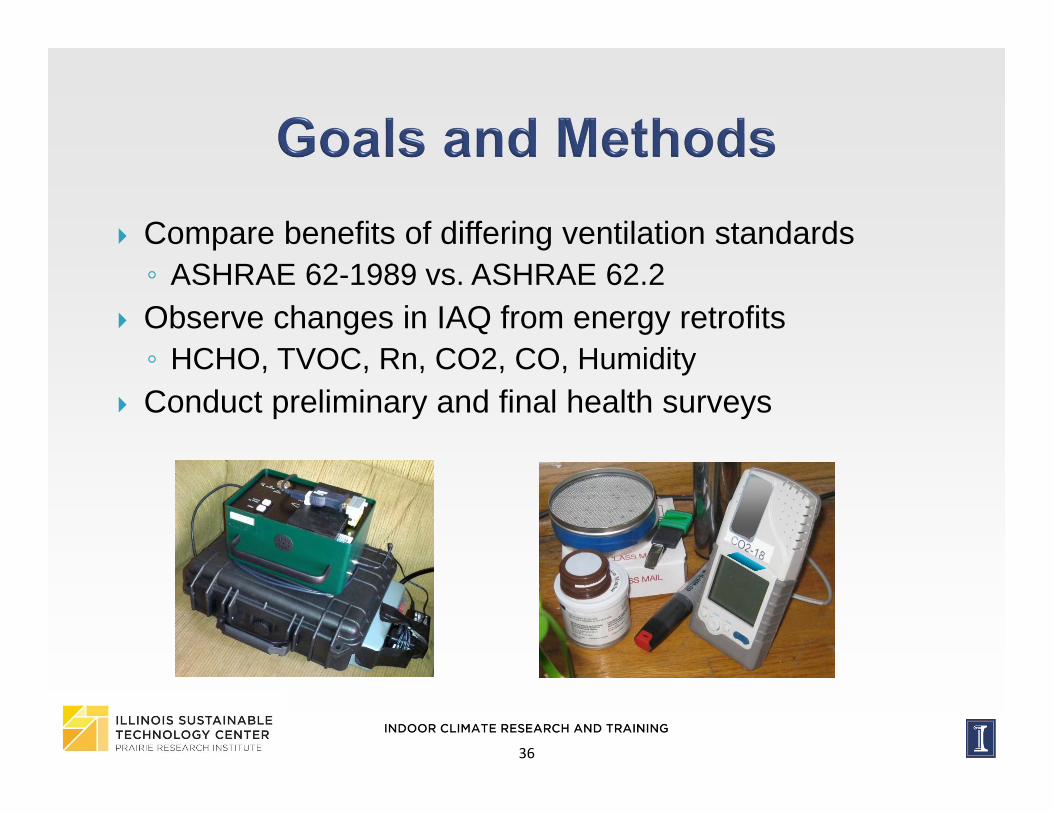
Compare benefits of differing ventilation standards◦ ASHRAE 62-1989 vs. ASHRAE 62.2
Observe changes in IAQ from energy retrofits◦ HCHO, TVOC, Rn, CO2, CO, Humidity
Conduct preliminary and final health surveys
36
37
Tested 52 homes Chicago area, 35 homes in Indiana Randomly selected Control homes weatherized to ASHRAE 62‐1989
(passive infiltration) Treatment homes weatherized to ASHRAE 62.2‐2010
(mechanical ventilation)
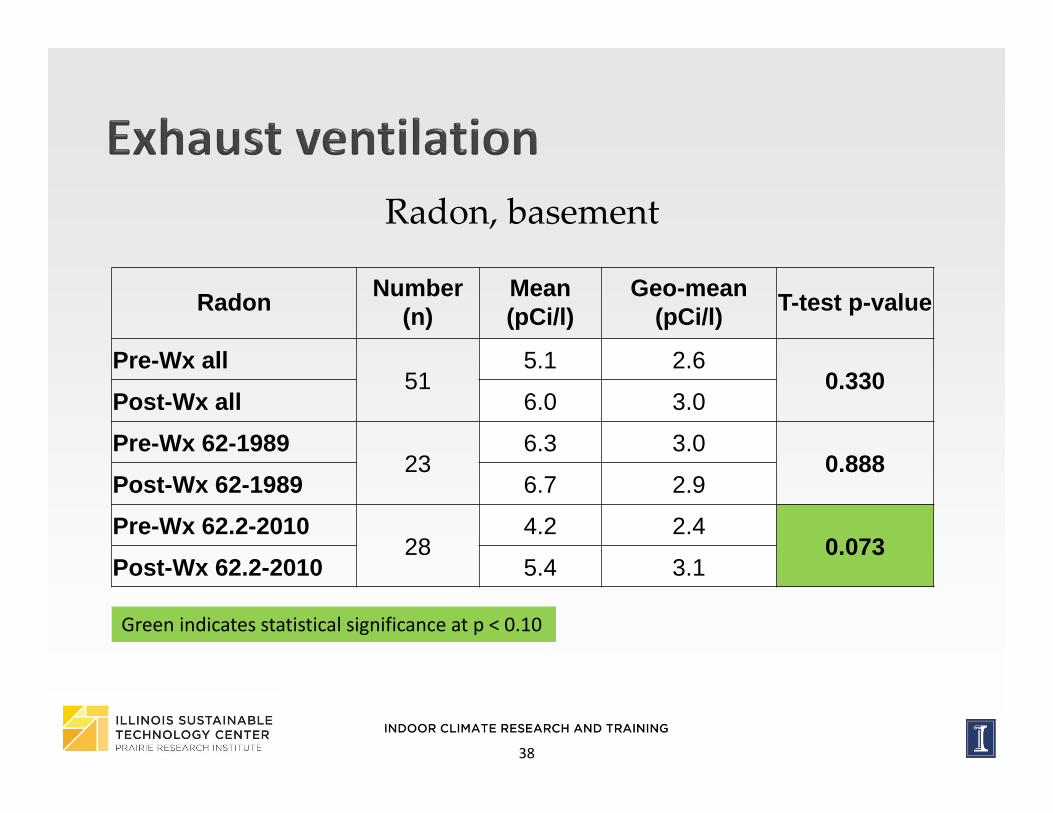
38
Radon, basement
Radon Number (n)
Mean (pCi/l)
Geo-mean (pCi/l) T-test p-value
Pre-Wx all51
5.1 2.60.330
Post-Wx all 6.0 3.0
Pre-Wx 62-198923
6.3 3.00.888
Post-Wx 62-1989 6.7 2.9
Pre-Wx 62.2-201028
4.2 2.40.073
Post-Wx 62.2-2010 5.4 3.1
Green indicates statistical significance at p < 0.10
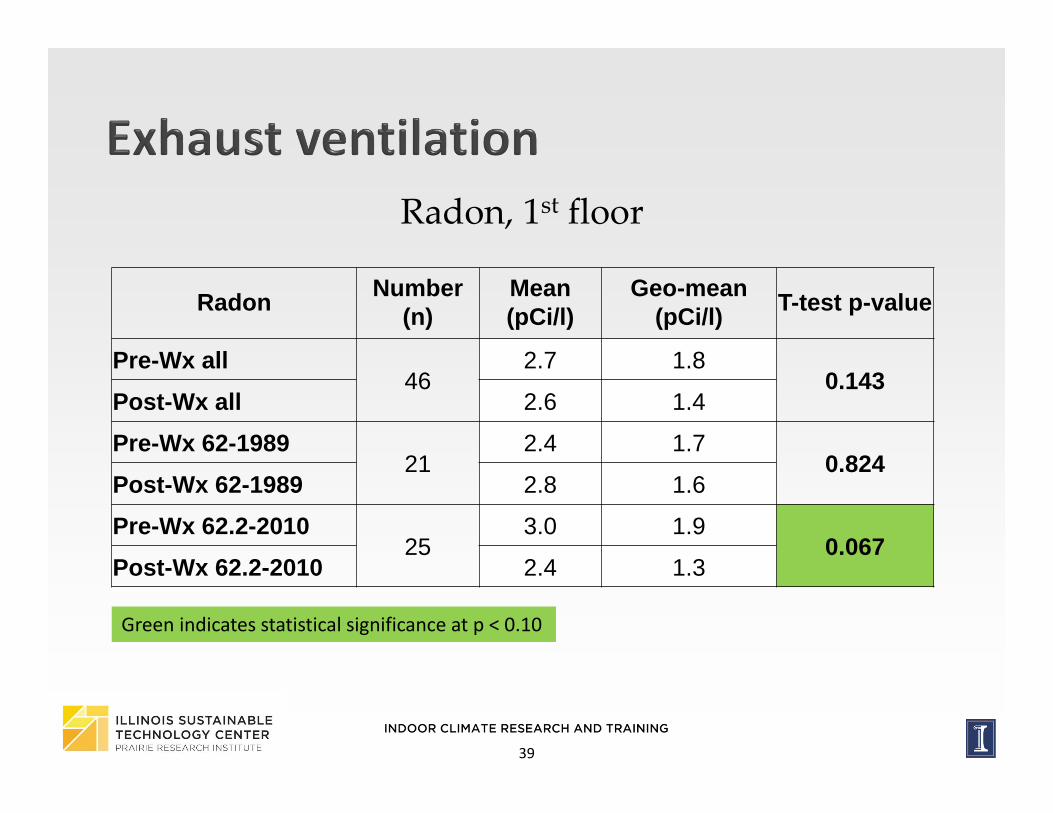
39
Radon, 1st floor
Green indicates statistical significance at p < 0.10
Radon Number (n)
Mean (pCi/l)
Geo-mean (pCi/l) T-test p-value
Pre-Wx all46
2.7 1.80.143
Post-Wx all 2.6 1.4
Pre-Wx 62-198921
2.4 1.70.824
Post-Wx 62-1989 2.8 1.6
Pre-Wx 62.2-201025
3.0 1.90.067
Post-Wx 62.2-2010 2.4 1.3
40
Conducted by researchers at ICRT, homes in Champaign, IL
Intended to evaluate potential for air sealing between foundation and first floor to reduce radon migration
Principle of “do no harm” as opposed to solving high radon problems
41
1. Investigate effectiveness of targeted floor air sealing at isolating the living space from the foundation space
2. Monitor effect of air‐sealing on radon levels in foundation and living spaces
3. If specific air‐sealing targets can be prescribed to address radon levels
4. Discover the role that ductwork plays in the transport of radon to the living space
42
•3 Groups: Fall 2013, Spring 2014, Summer 2014
•11 Crawlspace, 4 Basement + Crawlspace(s)
•Average home age: 1966; Newest: 2005; Oldest: 1890
•Average CFM50: 3239: Tightest: 1542; Leakiest: 5896
43
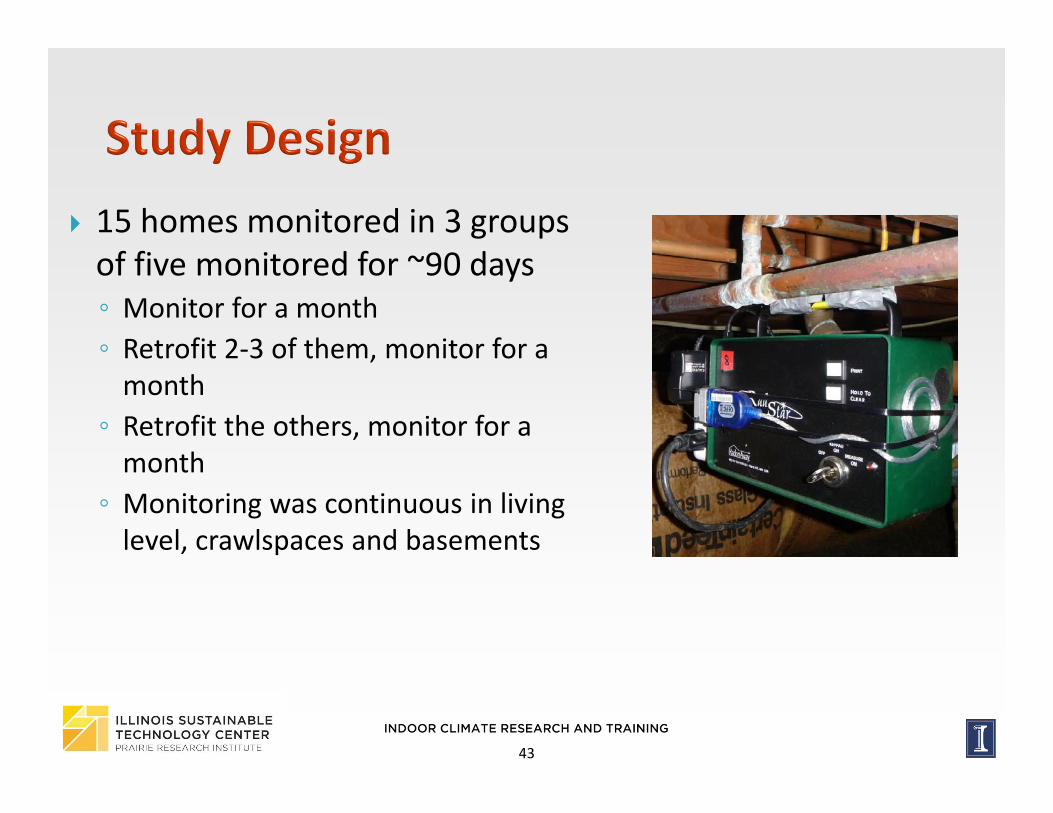
15 homes monitored in 3 groups of five monitored for ~90 days◦ Monitor for a month◦ Retrofit 2‐3 of them, monitor for a month◦ Retrofit the others, monitor for a month◦ Monitoring was continuous in living level, crawlspaces and basements
44
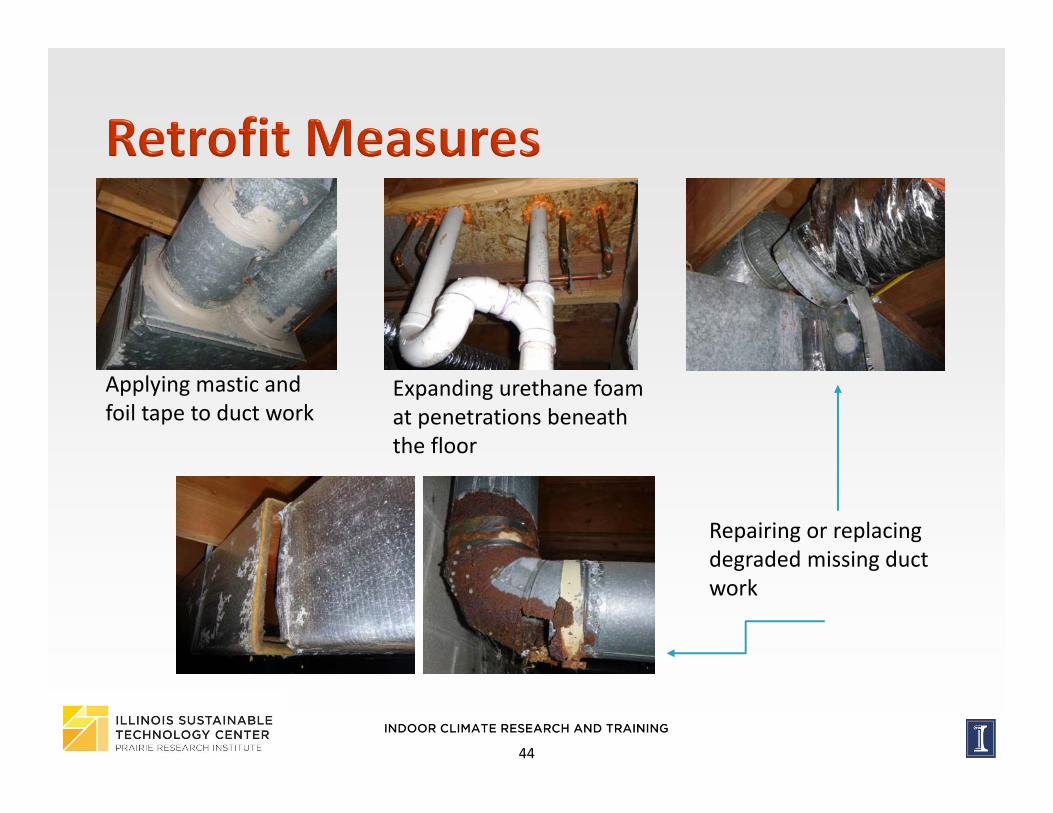
Applying mastic and foil tape to duct work
Expanding urethane foam at penetrations beneath the floor
Repairing or replacing degraded missing duct work
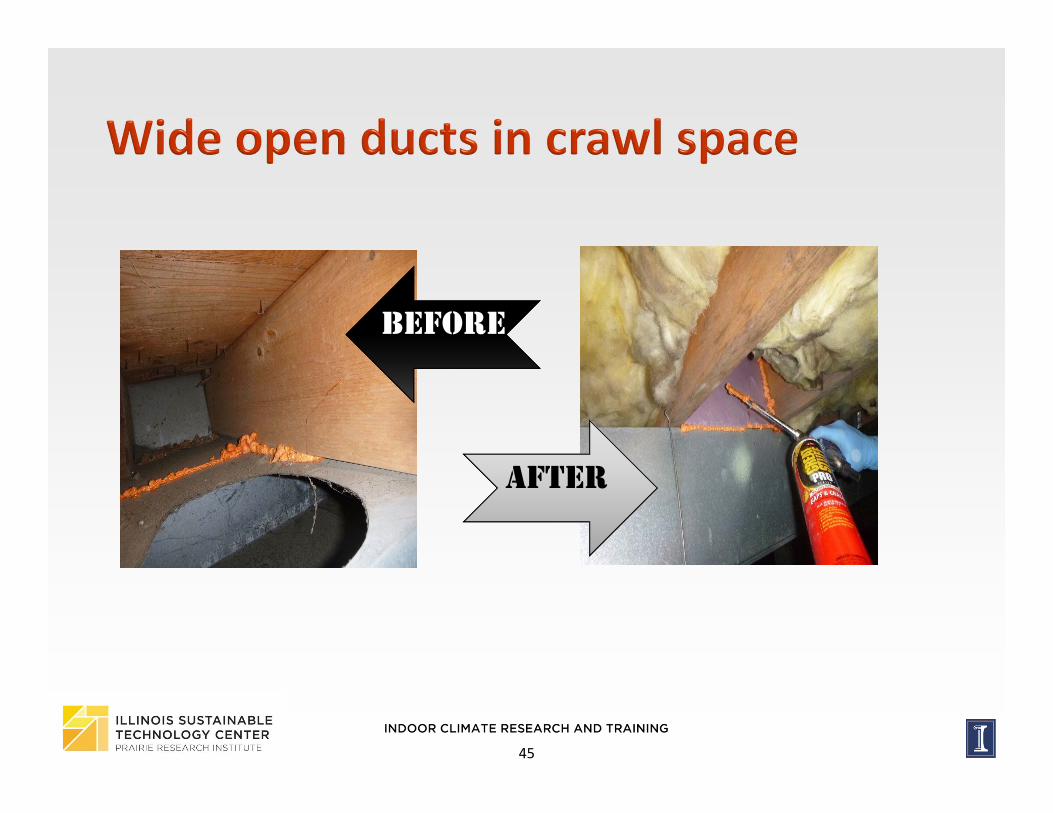
45
BEFORE
AFTER
46
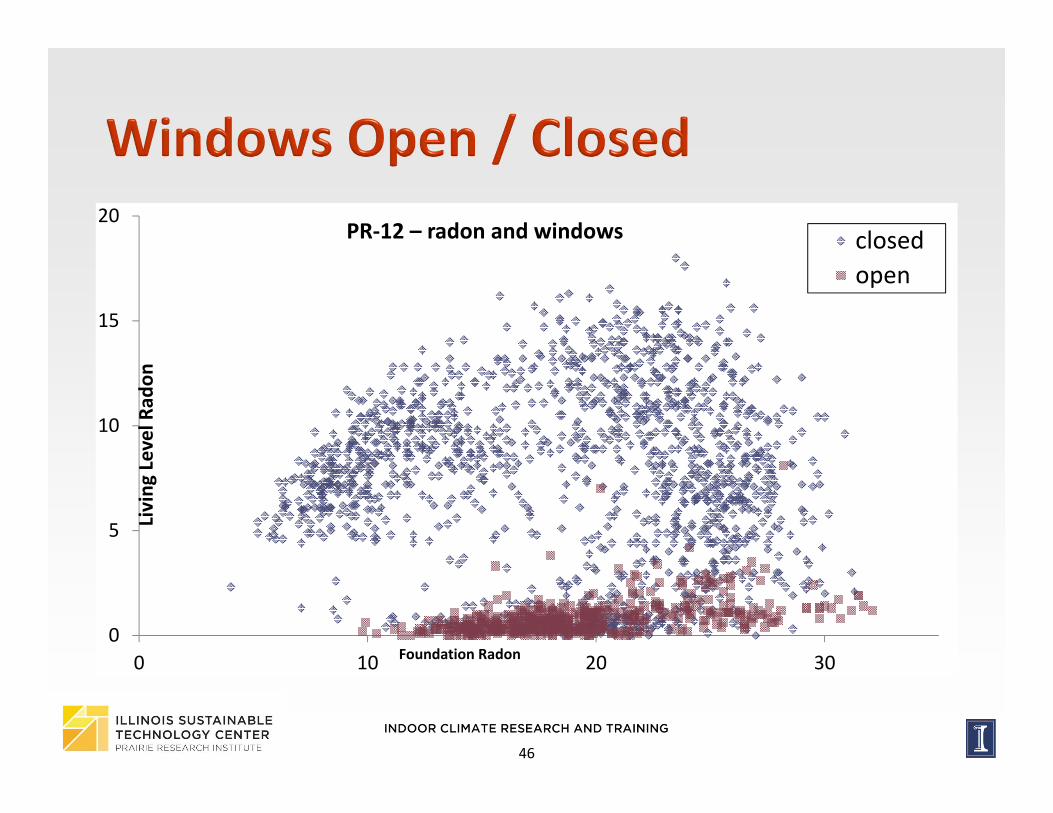
0
5
10
15
20
0 10 20 30
Living
Level Rad
on
Foundation Radon
PR‐12 – radon and windows closedopen
47
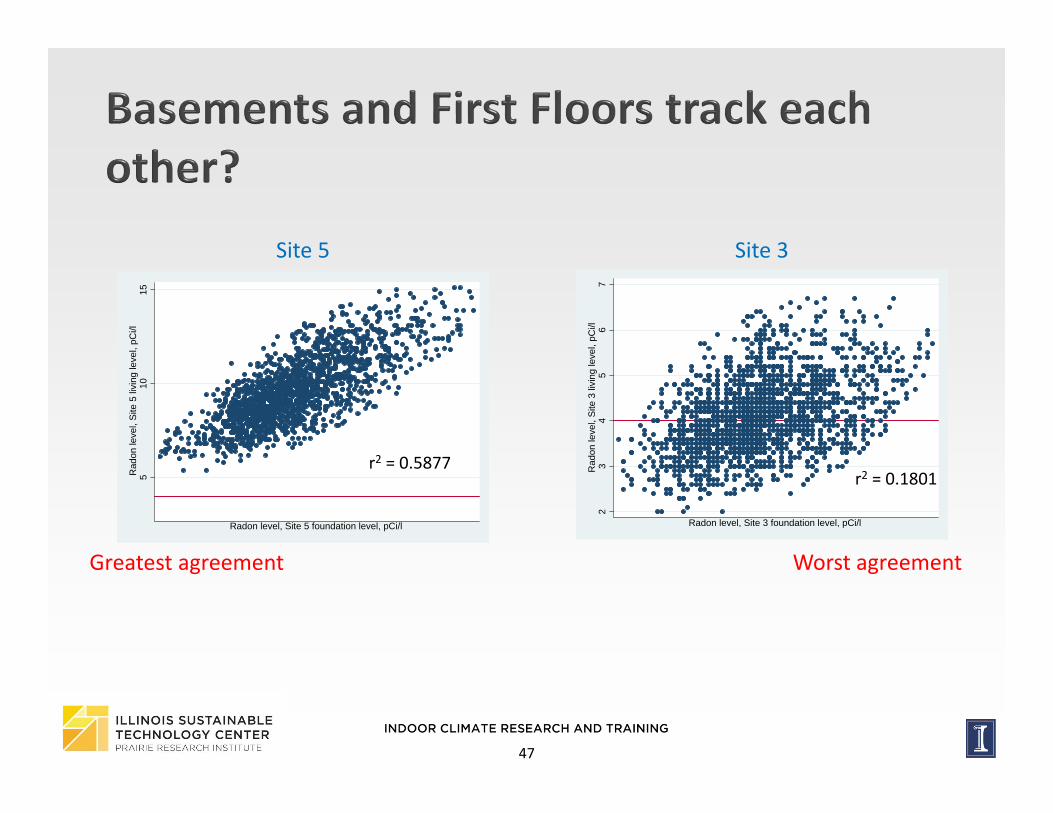
510
15R
adon
leve
l, S
ite 5
livi
ng le
vel,
pCi/l
Radon level, Site 5 foundation level, pCi/l
23
45
67
Rad
on le
vel,
Site
3 li
ving
leve
l, pC
i/l
Radon level, Site 3 foundation level, pCi/l
Greatest agreement Worst agreement
r2 = 0.5877r2 = 0.1801
Site 5 Site 3
48
Treatment lead to measureable change in zone pressure measurements with greater isolation of foundation and living space.
Improved isolation did not lead to statistically significant change in living level average radon
No changes could be conclusively attributed to the treatments.
49
Air handler fan ran continuously – living level and crawl radon were within 10%
Very large return duct leaks – after sealing radon noticeably dropped
50
Report released 2015
Weatherization and Indoor Air Quality: Measured Impacts in Single‐Family Homes Under the Weatherization Assistance Program
Scott Pigg, Energy Center of Wisconsin Dan Cautley, Energy Center of Wisconsin
Paul Francisco, University of Illinois Beth Hawkins, Oak Ridge National Laboratory
Terry Brennan, Camroden Associates
51
514 single‐family homes 35 states 88 weatherization agencies participated 2010/2011 heating season Over sampled in high – radon areas Tested radon using activated charcoal canisters ◦ 7 day test before and after Wx
52
Average single‐family home had heating‐season indoor radon levels of 1.9 ± 0.1 pCi/L
Tighter homes tend to have higher radon levels Data suggest Wx results in small, statistically significant increase in radon levels.
Average increase of 0.4 ± 0.2 pCi/L Most states Wx programs used ASHRAE 62‐1989 (BTL) Follow on study evaluated 62.2 compliant exhaust ventilation. Toggled on/off ventilation and results suggest that 62.2 compliant exhaust ventilation can reduce radon levels.
53
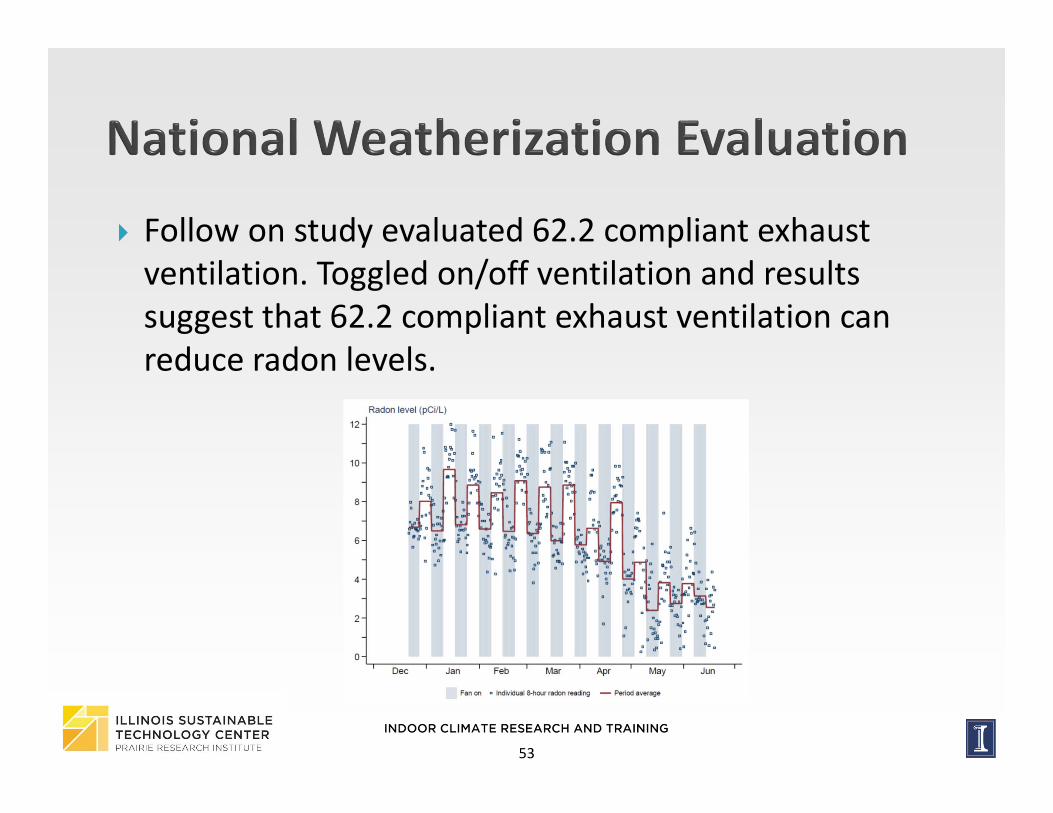
Follow on study evaluated 62.2 compliant exhaust ventilation. Toggled on/off ventilation and results suggest that 62.2 compliant exhaust ventilation can reduce radon levels.
54
University of Illinois at Urbana‐ChampaignNational Center for Healthy Housing
Tohn Environmental Strategies
2/22/2016 54
55
Questions: ◦ Can low‐cost, passive measures that are aligned with normal weatherization measures keep radon levels from increasing as a result of WAP activities?◦ Are there also moisture benefits?
2/22/2016 55
56
Crawl spaces◦ Plastic groundcovers carefully installed such that all seams are sealed and the plastic is sealed to the perimeter walls and any foundation supports◦ Air sealing of ducts located in the crawl space◦ Air sealing of the floor between the living space and the crawl space◦ Air sealing around any interior crawl space accesses
56
57
Basements◦ Plastic groundcovers over any exposed earth, carefully installed such that seams are the plastic is sealed to concrete◦ Installation of sealed sump pump covers◦ Caulking of cracks in below grade concrete◦ Air sealing of the floor between the basement and first floor, if the basement is not the lowest living level◦ Air sealing of return ducts located in the basement
57
58