Embed Size (px)
Citation preview
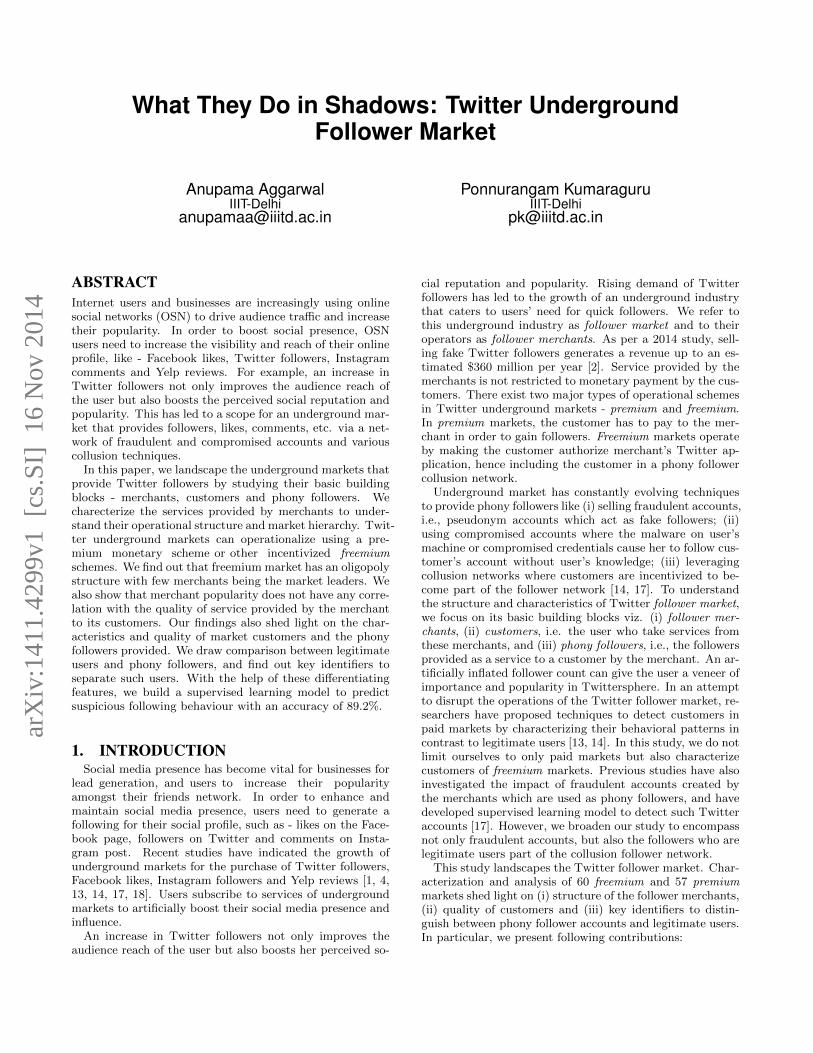
What They Do in Shadows: Twitter UndergroundFollower Market
Anupama AggarwalIIIT-Delhi
Ponnurangam KumaraguruIIIT-Delhi
ABSTRACTInternet users and businesses are increasingly using onlinesocial networks (OSN) to drive audience traffic and increasetheir popularity. In order to boost social presence, OSNusers need to increase the visibility and reach of their onlineprofile, like - Facebook likes, Twitter followers, Instagramcomments and Yelp reviews. For example, an increase inTwitter followers not only improves the audience reach ofthe user but also boosts the perceived social reputation andpopularity. This has led to a scope for an underground mar-ket that provides followers, likes, comments, etc. via a net-work of fraudulent and compromised accounts and variouscollusion techniques.
In this paper, we landscape the underground markets thatprovide Twitter followers by studying their basic buildingblocks - merchants, customers and phony followers. Wecharecterize the services provided by merchants to under-stand their operational structure and market hierarchy. Twit-ter underground markets can operationalize using a pre-mium monetary scheme or other incentivized freemiumschemes. We find out that freemium market has an oligopolystructure with few merchants being the market leaders. Wealso show that merchant popularity does not have any corre-lation with the quality of service provided by the merchantto its customers. Our findings also shed light on the char-acteristics and quality of market customers and the phonyfollowers provided. We draw comparison between legitimateusers and phony followers, and find out key identifiers toseparate such users. With the help of these differentiatingfeatures, we build a supervised learning model to predictsuspicious following behaviour with an accuracy of 89.2%.
1. INTRODUCTIONSocial media presence has become vital for businesses for
lead generation, and users to increase their popularityamongst their friends network. In order to enhance andmaintain social media presence, users need to generate afollowing for their social profile, such as - likes on the Face-book page, followers on Twitter and comments on Insta-gram post. Recent studies have indicated the growth ofunderground markets for the purchase of Twitter followers,Facebook likes, Instagram followers and Yelp reviews [1, 4,13, 14, 17, 18]. Users subscribe to services of undergroundmarkets to artificially boost their social media presence andinfluence.
An increase in Twitter followers not only improves theaudience reach of the user but also boosts her perceived so-
cial reputation and popularity. Rising demand of Twitterfollowers has led to the growth of an underground industrythat caters to users’ need for quick followers. We refer tothis underground industry as follower market and to theiroperators as follower merchants. As per a 2014 study, sell-ing fake Twitter followers generates a revenue up to an es-timated $360 million per year [2]. Service provided by themerchants is not restricted to monetary payment by the cus-tomers. There exist two major types of operational schemesin Twitter underground markets - premium and freemium.In premium markets, the customer has to pay to the mer-chant in order to gain followers. Freemium markets operateby making the customer authorize merchant’s Twitter ap-plication, hence including the customer in a phony followercollusion network.
Underground market has constantly evolving techniquesto provide phony followers like (i) selling fraudulent accounts,i.e., pseudonym accounts which act as fake followers; (ii)using compromised accounts where the malware on user’smachine or compromised credentials cause her to follow cus-tomer’s account without user’s knowledge; (iii) leveragingcollusion networks where customers are incentivized to be-come part of the follower network [14, 17]. To understandthe structure and characteristics of Twitter follower market,we focus on its basic building blocks viz. (i) follower mer-chants, (ii) customers, i.e. the user who take services fromthese merchants, and (iii) phony followers, i.e., the followersprovided as a service to a customer by the merchant. An ar-tificially inflated follower count can give the user a veneer ofimportance and popularity in Twittersphere. In an attemptto disrupt the operations of the Twitter follower market, re-searchers have proposed techniques to detect customers inpaid markets by characterizing their behavioral patterns incontrast to legitimate users [13, 14]. In this study, we do notlimit ourselves to only paid markets but also characterizecustomers of freemium markets. Previous studies have alsoinvestigated the impact of fraudulent accounts created bythe merchants which are used as phony followers, and havedeveloped supervised learning model to detect such Twitteraccounts [17]. However, we broaden our study to encompassnot only fraudulent accounts, but also the followers who arelegitimate users part of the collusion follower network.
This study landscapes the Twitter follower market. Char-acterization and analysis of 60 freemium and 57 premiummarkets shed light on (i) structure of the follower merchants,(ii) quality of customers and (iii) key identifiers to distin-guish between phony follower accounts and legitimate users.In particular, we present following contributions:
arX
iv:1
411.
4299
v1 [
cs.S
I] 1
6 N
ov 2
014
First, we conduct a longitudinal study to characterizeTwitter follower merchants. In order to identify the mostpopular merchants and market leaders, we introduce theidea of Quality of Service (QoS) for the Twitter followermarkets. QoS is an important parameter to judge the over-all performance of a service, in our case, the follower mer-chants [6]. As discussed in Section 3.2, we define a metricfor QoS, which takes into account the services promised bythe merchant, expectation by the customer and differencebetween the two. Using the QoS and popularity metric, weare able to highlight a hierarchy of follower merchants in theunderground market and show that this market exhibits anoligopoly structure.
Second, we assess the customers taking services from thefollower market. We characterize customers of various mer-chants on the basis of their social reputation and profileattributes. We observe that customers lying on the higherstrata of quality take services of freemium merchants.
Lastly, We present an anatomy of the purchased Twitterfollowers. We characterize profile attributes and behaviouralfeatures of purchased followers. We identify key indicatorsto distinguish between suspicious following behaviour fromthat of legitimate Twitter users. We use these identifiersand build a supervised learning mechanism which detectssuspicious following behaviour with an accuracy of 89.2%.
2. RELATED WORKIn this section, we present some closely related work fo-
cussed on underground markets on Web 2.0. In particular,we summarize previous literature on analysis and detectionof social media underground markets.
Social Media Underground Market.Researchers have shown that miscreants use several strate-
gies to monetize spam and other malicious activities [10].There exists a large underground market which sells spe-cialized services and products like fraudulent accounts [15,17], solving CAPTCHA [11], pay-per-install [7], and writingfake reviews or website content [12, 19]. Social media userstake such services to increase their online presence. For ex-ample, on Twitter, users attempt to gain followers in orderto boost their popularity [8]. Underground markets are athreat to the quality of service and are generating a revenueof about $360 million per year from sale of fake Twitter fol-lowers [2]. In this paper, we present a comprehensive studyof Twitter follower market to understand how it operatesand assess the Quality of Service [6] and percieved gain bythe use of phony follower merchants.
Fraudulent Account Detection.Recent studies have shown that merchants often create
fake accounts to deliver services like phone verified emailaccounts [16], Twitter followers [17] and Facebook Likes [5].Researchers show that such fraudulent accounts can be de-tected at the time of account creation by merchants by find-ing patterns in account naming convention and registrationprocess [17]. In this paper, we focus on phony followers ofthe customers. However, we do not limit our study to onlyfraudulently created accounts; we charecterize and detectfake as well as legitimate accounts that exhibit suspicious
following behaviour.
Merchant and Customer Detection.Social media users are increasingly taking underground
market services to increase their following. Researchers havemodelled suspicious Twitter following behaviour by identi-fying difference in follow pattern from the majority [9]. Pre-vious studies highlight the unfollow dynamics of the victimcustomer accounts whose credentials are compromised bymerchants [14]. In this paper, we study not only compro-mised users but also the legitimate users part of the collusionfollower network.
3. BACKGROUNDThe goal of our study is to characterize the underground
follower market. Before we elaborate our dataset and method-ology, in this section, we briefly describe the popular marketschemes. We also discuss the QoS metric to quantify thequality and uncover the underlying hierarchy of merchants.
3.1 Freemium and Premium MarketsThe underground follower market operates by either sell-
ing followers or incentivizing the customers to become partof the phony follower network in order to increase followercount. Here, we present in brief how freemium and premiummarket schemes operate.
Premium Market.Under the premium scheme, customers have to pay money
to the merchants in order to gain followers. Customer pro-vides a Twitter username to the merchants for which shewants to increase the follower count, and buys a specificpackage (e.g. package - 1000 followers for $3). Within a spanof few minutes to few hours, depending upon the merchant,follower count of the specific Twitter username (providedto the merchant) increases as per the package. Premiummarket allows a customer to buy bulk followers for not justhimself but any Twitter user. This has opened up new pos-sibilities of exploitation by spammers. In 2014, a group ofhoaxters known for their notoriety, flooded a prominent on-line daily’s Twitter account with fake followers to damagethe brand [3]. In this study, we analyse the structure andcharacteristics of 57 such merchant websites which sell bulkfollowers. The merchants under the premium scheme, eithersimply sell followers in exchange of money, or also requirethe customer to provide her Twitter account’s password sothat the customer can be made part of the collusion phonyfollower network. Note that in both the cases, merchantsrequire monetary payment from the customer.
Freemium Market.Freemium market scheme lets the customer gain follow-
ers without any monetary payment. However, in return,the customer needs to authorize merchant’s Twitter appli-cation that enables the merchant to include customer in thecollusion phony follower network. Most of the freemiummerchants display their recent customers on their websiteand keep refreshing the list after every few minutes. Oncethe customer authorize merchant’s app, she starts gainingfollowers within minutes. The merchant app includes vari-ous permissions like - see who you follow, follow new people,update your profile, and post tweets for you. These per-
missions enable the merchant to make the customer followother Twitter users (which may be other customers of themerchant) and also post promotional tweets on her behalf.Since the customer does not have to provide her passwordunlike the second scheme in premium markets as discussedabove, the customer is at a much lower risk of being com-promised.
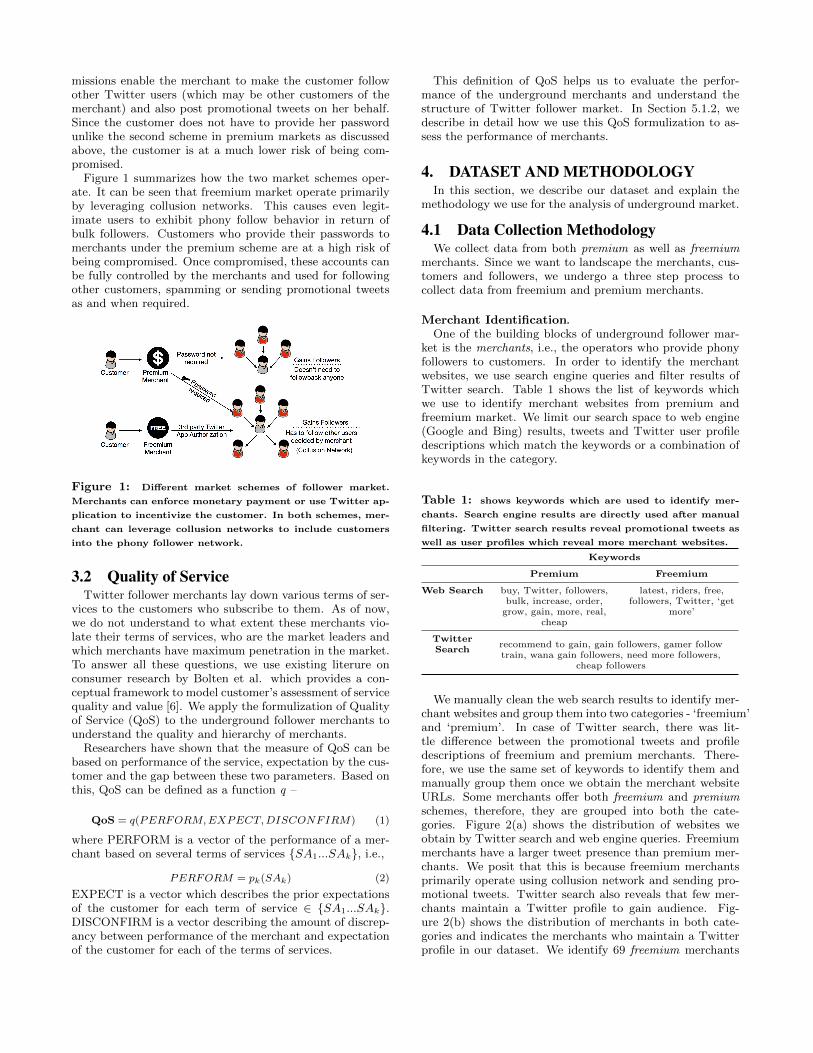
Figure 1 summarizes how the two market schemes oper-ate. It can be seen that freemium market operate primarilyby leveraging collusion networks. This causes even legit-imate users to exhibit phony follow behavior in return ofbulk followers. Customers who provide their passwords tomerchants under the premium scheme are at a high risk ofbeing compromised. Once compromised, these accounts canbe fully controlled by the merchants and used for followingother customers, spamming or sending promotional tweetsas and when required.
Figure 1: Different market schemes of follower market.
Merchants can enforce monetary payment or use Twitter ap-
plication to incentivize the customer. In both schemes, mer-
chant can leverage collusion networks to include customers
into the phony follower network.
3.2 Quality of ServiceTwitter follower merchants lay down various terms of ser-
vices to the customers who subscribe to them. As of now,we do not understand to what extent these merchants vio-late their terms of services, who are the market leaders andwhich merchants have maximum penetration in the market.To answer all these questions, we use existing literure onconsumer research by Bolten et al. which provides a con-ceptual framework to model customer’s assessment of servicequality and value [6]. We apply the formulization of Qualityof Service (QoS) to the underground follower merchants tounderstand the quality and hierarchy of merchants.
Researchers have shown that the measure of QoS can bebased on performance of the service, expectation by the cus-tomer and the gap between these two parameters. Based onthis, QoS can be defined as a function q –
QoS = q(PERFORM,EXPECT,DISCONFIRM) (1)
where PERFORM is a vector of the performance of a mer-chant based on several terms of services {SA1...SAk}, i.e.,
PERFORM = pk(SAk) (2)
EXPECT is a vector which describes the prior expectationsof the customer for each term of service ∈ {SA1...SAk}.DISCONFIRM is a vector describing the amount of discrep-ancy between performance of the merchant and expectationof the customer for each of the terms of services.
This definition of QoS helps us to evaluate the perfor-mance of the underground merchants and understand thestructure of Twitter follower market. In Section 5.1.2, wedescribe in detail how we use this QoS formulization to as-sess the performance of merchants.
4. DATASET AND METHODOLOGYIn this section, we describe our dataset and explain the
methodology we use for the analysis of underground market.
4.1 Data Collection MethodologyWe collect data from both premium as well as freemium
merchants. Since we want to landscape the merchants, cus-tomers and followers, we undergo a three step process tocollect data from freemium and premium merchants.
Merchant Identification.One of the building blocks of underground follower mar-
ket is the merchants, i.e., the operators who provide phonyfollowers to customers. In order to identify the merchantwebsites, we use search engine queries and filter results ofTwitter search. Table 1 shows the list of keywords whichwe use to identify merchant websites from premium andfreemium market. We limit our search space to web engine(Google and Bing) results, tweets and Twitter user profiledescriptions which match the keywords or a combination ofkeywords in the category.
Table 1: shows keywords which are used to identify mer-
chants. Search engine results are directly used after manual
filtering. Twitter search results reveal promotional tweets as
well as user profiles which reveal more merchant websites.
Keywords
Premium Freemium
Web Search buy, Twitter, followers,bulk, increase, order,
grow, gain, more, real,cheap
latest, riders, free,followers, Twitter, ‘get
more’
TwitterSearch
recommend to gain, gain followers, gamer followtrain, wana gain followers, need more followers,
cheap followers
We manually clean the web search results to identify mer-chant websites and group them into two categories - ‘freemium’and ‘premium’. In case of Twitter search, there was lit-tle difference between the promotional tweets and profiledescriptions of freemium and premium merchants. There-fore, we use the same set of keywords to identify them andmanually group them once we obtain the merchant websiteURLs. Some merchants offer both freemium and premiumschemes, therefore, they are grouped into both the cate-gories. Figure 2(a) shows the distribution of websites weobtain by Twitter search and web engine queries. Freemiummerchants have a larger tweet presence than premium mer-chants. We posit that this is because freemium merchantsprimarily operate using collusion network and sending pro-motional tweets. Twitter search also reveals that few mer-chants maintain a Twitter profile to gain audience. Fig-ure 2(b) shows the distribution of merchants in both cate-gories and indicates the merchants who maintain a Twitterprofile in our dataset. We identify 69 freemium merchants
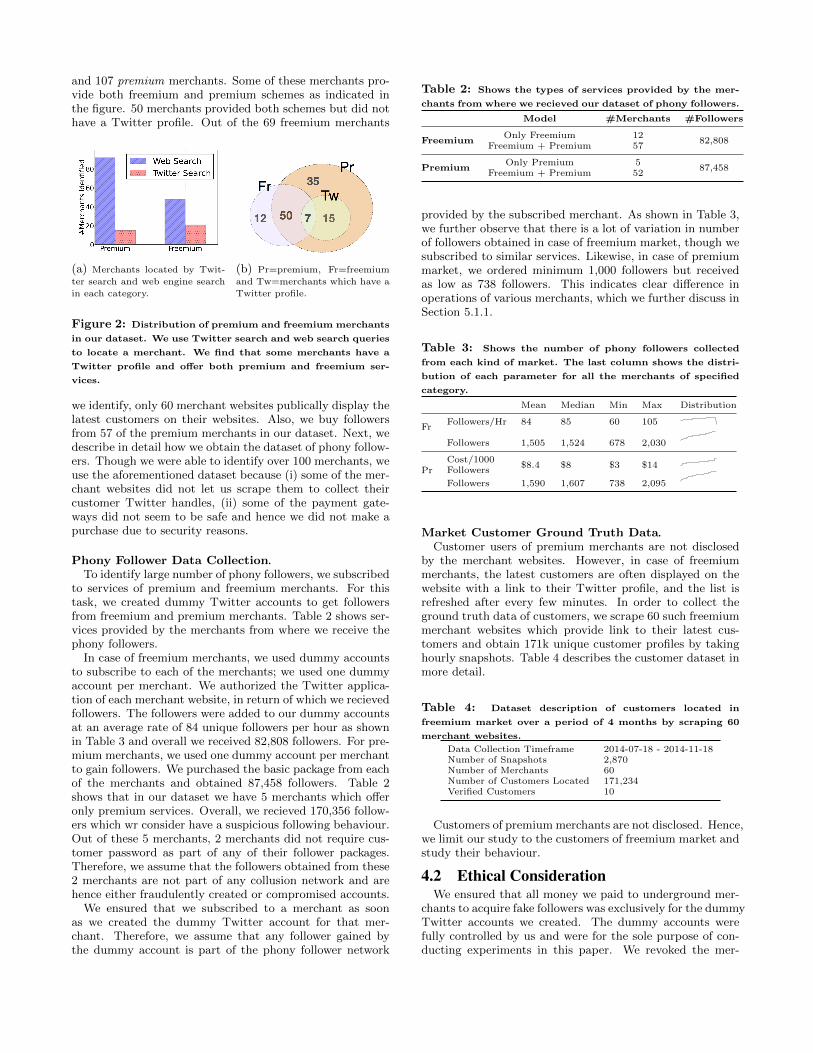
and 107 premium merchants. Some of these merchants pro-vide both freemium and premium schemes as indicated inthe figure. 50 merchants provided both schemes but did nothave a Twitter profile. Out of the 69 freemium merchants
(a) Merchants located by Twit-
ter search and web engine search
in each category.
(b) Pr=premium, Fr=freemium
and Tw=merchants which have a
Twitter profile.
Figure 2: Distribution of premium and freemium merchants
in our dataset. We use Twitter search and web search queries
to locate a merchant. We find that some merchants have a
Twitter profile and offer both premium and freemium ser-
vices.
we identify, only 60 merchant websites publically display thelatest customers on their websites. Also, we buy followersfrom 57 of the premium merchants in our dataset. Next, wedescribe in detail how we obtain the dataset of phony follow-ers. Though we were able to identify over 100 merchants, weuse the aforementioned dataset because (i) some of the mer-chant websites did not let us scrape them to collect theircustomer Twitter handles, (ii) some of the payment gate-ways did not seem to be safe and hence we did not make apurchase due to security reasons.
Phony Follower Data Collection.To identify large number of phony followers, we subscribed
to services of premium and freemium merchants. For thistask, we created dummy Twitter accounts to get followersfrom freemium and premium merchants. Table 2 shows ser-vices provided by the merchants from where we receive thephony followers.
In case of freemium merchants, we used dummy accountsto subscribe to each of the merchants; we used one dummyaccount per merchant. We authorized the Twitter applica-tion of each merchant website, in return of which we recievedfollowers. The followers were added to our dummy accountsat an average rate of 84 unique followers per hour as shownin Table 3 and overall we received 82,808 followers. For pre-mium merchants, we used one dummy account per merchantto gain followers. We purchased the basic package from eachof the merchants and obtained 87,458 followers. Table 2shows that in our dataset we have 5 merchants which offeronly premium services. Overall, we recieved 170,356 follow-ers which wr consider have a suspicious following behaviour.Out of these 5 merchants, 2 merchants did not require cus-tomer password as part of any of their follower packages.Therefore, we assume that the followers obtained from these2 merchants are not part of any collusion network and arehence either fraudulently created or compromised accounts.
We ensured that we subscribed to a merchant as soonas we created the dummy Twitter account for that mer-chant. Therefore, we assume that any follower gained bythe dummy account is part of the phony follower network
Table 2: Shows the types of services provided by the mer-
chants from where we recieved our dataset of phony followers.
Model #Merchants #Followers
FreemiumOnly Freemium 12
82,808Freemium + Premium 57
PremiumOnly Premium 5
87,458Freemium + Premium 52
provided by the subscribed merchant. As shown in Table 3,we further observe that there is a lot of variation in numberof followers obtained in case of freemium market, though wesubscribed to similar services. Likewise, in case of premiummarket, we ordered minimum 1,000 followers but receivedas low as 738 followers. This indicates clear difference inoperations of various merchants, which we further discuss inSection 5.1.1.
Table 3: Shows the number of phony followers collected
from each kind of market. The last column shows the distri-
bution of each parameter for all the merchants of specified
category.
Mean Median Min Max Distribution
FrFollowers/Hr 84 85 60 105
Followers 1,505 1,524 678 2,030
PrCost/1000Followers
$8.4 $8 $3 $14
Followers 1,590 1,607 738 2,095
Market Customer Ground Truth Data.Customer users of premium merchants are not disclosed
by the merchant websites. However, in case of freemiummerchants, the latest customers are often displayed on thewebsite with a link to their Twitter profile, and the list isrefreshed after every few minutes. In order to collect theground truth data of customers, we scrape 60 such freemiummerchant websites which provide link to their latest cus-tomers and obtain 171k unique customer profiles by takinghourly snapshots. Table 4 describes the customer dataset inmore detail.
Table 4: Dataset description of customers located in
freemium market over a period of 4 months by scraping 60
merchant websites.
Data Collection Timeframe 2014-07-18 - 2014-11-18Number of Snapshots 2,870Number of Merchants 60Number of Customers Located 171,234Verified Customers 10
Customers of premium merchants are not disclosed. Hence,we limit our study to the customers of freemium market andstudy their behaviour.
4.2 Ethical ConsiderationWe ensured that all money we paid to underground mer-
chants to acquire fake followers was exclusively for the dummyTwitter accounts we created. The dummy accounts werefully controlled by us and were for the sole purpose of con-ducting experiments in this paper. We revoked the mer-
chant’s application after the experiments were conducted toensure that we do not cater to the collusion follower network.
5. LANDSCAPING TWITTER FOLLOWERUNDERGROUND MARKET
In this section, we study in detail the characteristics ofthe merchants, customers and followers provided by the mer-chants in deatil, to understand the structure of undergroundfollower market.
5.1 Twitter Follower MerchantsMerchants are the market operators which provide phony
followers to their customers. We recall that merchants canoffer premium, freemium or both the schemes to their cus-tomers.
5.1.1 Merchants violate their promisesThe merchants of underground Twitter follower market
offer various guaranteed services to customer at the timeof subscription. Many merchants promise services like au-thentic followers, moneyback guarantees, quick followers andfollower retention which encourage the customers to eitherbuy bulk followers from premium merchants or subscribe tofreemium merchants. Table 5 shows the list of most commonpromises made by the merchants. Though these promisesand guarantees seem lucrative, and hence attract a lot ofcustomers, merchants often violate these services.
Lack of follower retention.Most of the preemium merchants provide follower reten-
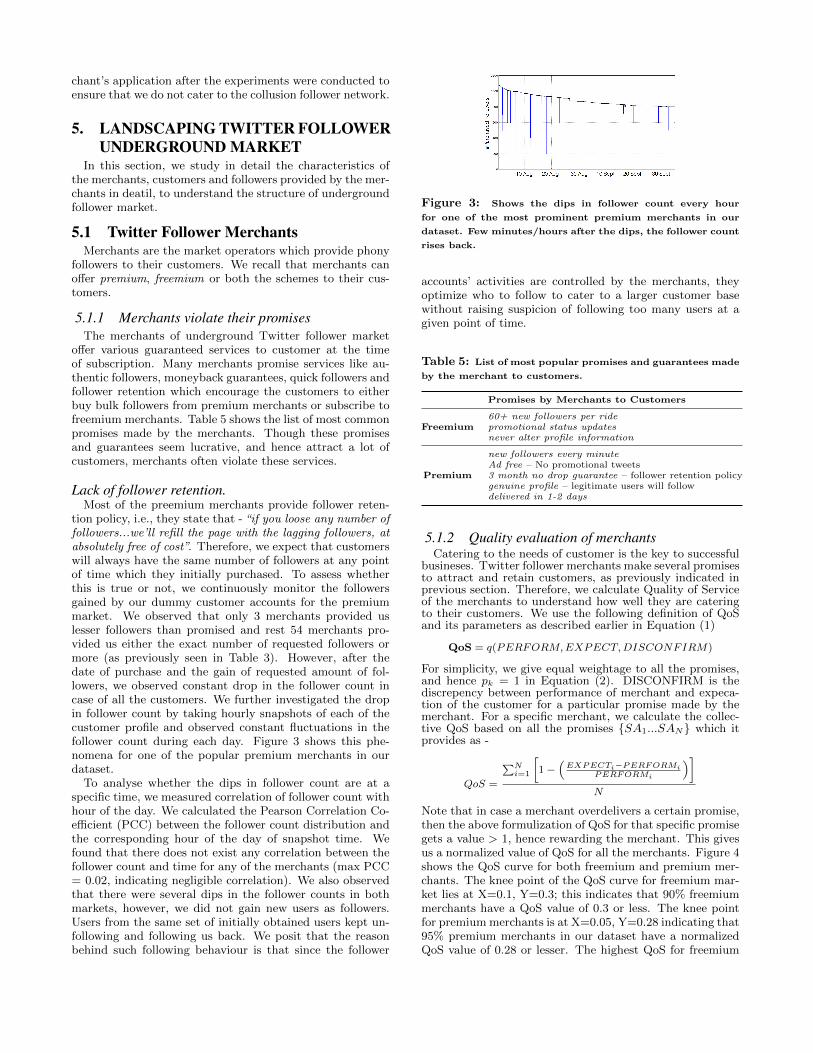
tion policy, i.e., they state that - “if you loose any number offollowers...we’ll refill the page with the lagging followers, atabsolutely free of cost”. Therefore, we expect that customerswill always have the same number of followers at any pointof time which they initially purchased. To assess whetherthis is true or not, we continuously monitor the followersgained by our dummy customer accounts for the premiummarket. We observed that only 3 merchants provided uslesser followers than promised and rest 54 merchants pro-vided us either the exact number of requested followers ormore (as previously seen in Table 3). However, after thedate of purchase and the gain of requested amount of fol-lowers, we observed constant drop in the follower count incase of all the customers. We further investigated the dropin follower count by taking hourly snapshots of each of thecustomer profile and observed constant fluctuations in thefollower count during each day. Figure 3 shows this phe-nomena for one of the popular premium merchants in ourdataset.
To analyse whether the dips in follower count are at aspecific time, we measured correlation of follower count withhour of the day. We calculated the Pearson Correlation Co-efficient (PCC) between the follower count distribution andthe corresponding hour of the day of snapshot time. Wefound that there does not exist any correlation between thefollower count and time for any of the merchants (max PCC= 0.02, indicating negligible correlation). We also observedthat there were several dips in the follower counts in bothmarkets, however, we did not gain new users as followers.Users from the same set of initially obtained users kept un-following and following us back. We posit that the reasonbehind such following behaviour is that since the follower
Figure 3: Shows the dips in follower count every hour
for one of the most prominent premium merchants in our
dataset. Few minutes/hours after the dips, the follower count
rises back.
accounts’ activities are controlled by the merchants, theyoptimize who to follow to cater to a larger customer basewithout raising suspicion of following too many users at agiven point of time.
Table 5: List of most popular promises and guarantees made
by the merchant to customers.
Promises by Merchants to Customers
Freemium60+ new followers per ridepromotional status updatesnever alter profile information
Premium
new followers every minuteAd free – No promotional tweets3 month no drop guarantee – follower retention policygenuine profile – legitimate users will followdelivered in 1-2 days
5.1.2 Quality evaluation of merchantsCatering to the needs of customer is the key to successful
busineses. Twitter follower merchants make several promisesto attract and retain customers, as previously indicated inprevious section. Therefore, we calculate Quality of Serviceof the merchants to understand how well they are cateringto their customers. We use the following definition of QoSand its parameters as described earlier in Equation (1)
QoS = q(PERFORM,EXPECT,DISCONFIRM)
For simplicity, we give equal weightage to all the promises,and hence pk = 1 in Equation (2). DISCONFIRM is thediscrepency between performance of merchant and expeca-tion of the customer for a particular promise made by themerchant. For a specific merchant, we calculate the collec-tive QoS based on all the promises {SA1...SAN} which itprovides as -
QoS =
∑Ni=1
[1−
(EXPECTi−PERFORMi
PERFORMi
)]N
Note that in case a merchant overdelivers a certain promise,then the above formulization of QoS for that specific promisegets a value > 1, hence rewarding the merchant. This givesus a normalized value of QoS for all the merchants. Figure 4shows the QoS curve for both freemium and premium mer-chants. The knee point of the QoS curve for freemium mar-ket lies at X=0.1, Y=0.3; this indicates that 90% freemiummerchants have a QoS value of 0.3 or less. The knee pointfor premium merchants is at X=0.05, Y=0.28 indicating that95% premium merchants in our dataset have a normalizedQoS value of 0.28 or lesser. The highest QoS for freemium
market is 0.82, whereas for premium we found it to be 0.78.This shows that overall, QoS for freemium market is higherthan that of freemium market. We further investigate andfind that the violation of no drop guarantee is prime reasonbehind the low QoS for premium market. We had earlierseen this phenomena of follower drop in Figure 3. Frequentdrops in follower can raise a red flag against the customer,and hence the merchants which deliver followers exhibitingsuch phenomena are penalized in our formulization of QoS.
Figure 4: Quality of Service of Freemium and Premium
Markets.
5.1.3 Few merchants are market leadersNow we evaluate which merchants attract the highest share
of user base. In order to do so, we compute the popularityof each merchant by using two metrics - Alexa ranking ofmerchant website, and number of promotional tweets. 1
Alexa Ranking.Alexa rank measures website’s popularity based on the
traffic to that website. For each merchant, we extract theglobal rank of its website and then compute the normalizedAlexa rank for merchant Mi as followed –
Alexa Normi = 1−AlexaRanki
maxi∈{1...N}
(AlexaRanki)
where N is the total number of merchants. This gives us anormalized measure of website traffic between 0 and 1.
Social Media Popularity.We also use social media popularity of the merchant web-
site by collecting the promotional tweets advertising themerchant if any. We search for each merchant’s URL and itsBitly shortened version using Twitter search API. We thendefine the OSN popularity for each of the N merchants as –
OSN Popularityi =NumTweeti
maxi∈{1...N}
(NumTweeti)
where NumTweeti is the number of promotional tweet formerchant Mi. Using these two metrics, we finally draw theoverall popularity of a merchant website by taking an aver-age of normalized Alexa ranking and OSN Popularity.
Merchant Popularityi =Alexa Normi + OSN Popularityi
2
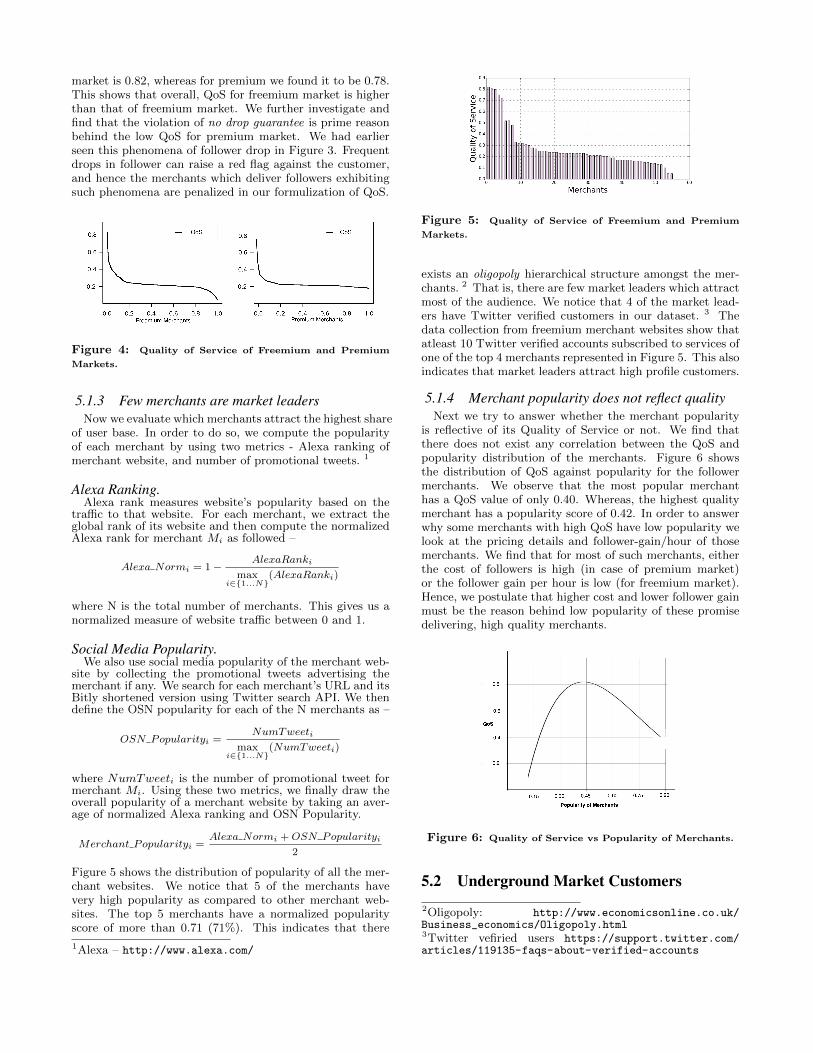
Figure 5 shows the distribution of popularity of all the mer-chant websites. We notice that 5 of the merchants havevery high popularity as compared to other merchant web-sites. The top 5 merchants have a normalized popularityscore of more than 0.71 (71%). This indicates that there
1Alexa – http://www.alexa.com/
Figure 5: Quality of Service of Freemium and Premium
Markets.
exists an oligopoly hierarchical structure amongst the mer-chants. 2 That is, there are few market leaders which attractmost of the audience. We notice that 4 of the market lead-ers have Twitter verified customers in our dataset. 3 Thedata collection from freemium merchant websites show thatatleast 10 Twitter verified accounts subscribed to services ofone of the top 4 merchants represented in Figure 5. This alsoindicates that market leaders attract high profile customers.
5.1.4 Merchant popularity does not reflect qualityNext we try to answer whether the merchant popularity
is reflective of its Quality of Service or not. We find thatthere does not exist any correlation between the QoS andpopularity distribution of the merchants. Figure 6 showsthe distribution of QoS against popularity for the followermerchants. We observe that the most popular merchanthas a QoS value of only 0.40. Whereas, the highest qualitymerchant has a popularity score of 0.42. In order to answerwhy some merchants with high QoS have low popularity welook at the pricing details and follower-gain/hour of thosemerchants. We find that for most of such merchants, eitherthe cost of followers is high (in case of premium market)or the follower gain per hour is low (for freemium market).Hence, we postulate that higher cost and lower follower gainmust be the reason behind low popularity of these promisedelivering, high quality merchants.
Figure 6: Quality of Service vs Popularity of Merchants.
5.2 Underground Market Customers2Oligopoly: http://www.economicsonline.co.uk/Business_economics/Oligopoly.html3Twitter vefiried users https://support.twitter.com/articles/119135-faqs-about-verified-accounts
Now we study the characteristics of customers who sub-scribe to follower merchants, to understand who these usersare and which services they subscribe to. Customers of pre-mium market are undisclosed, hence, we limit our study tomerchants which provide either freemium service, or bothfreemium and premium service.
5.2.1 Spammers, wannabes and celebritiesTo understand who are the customers of follower mar-
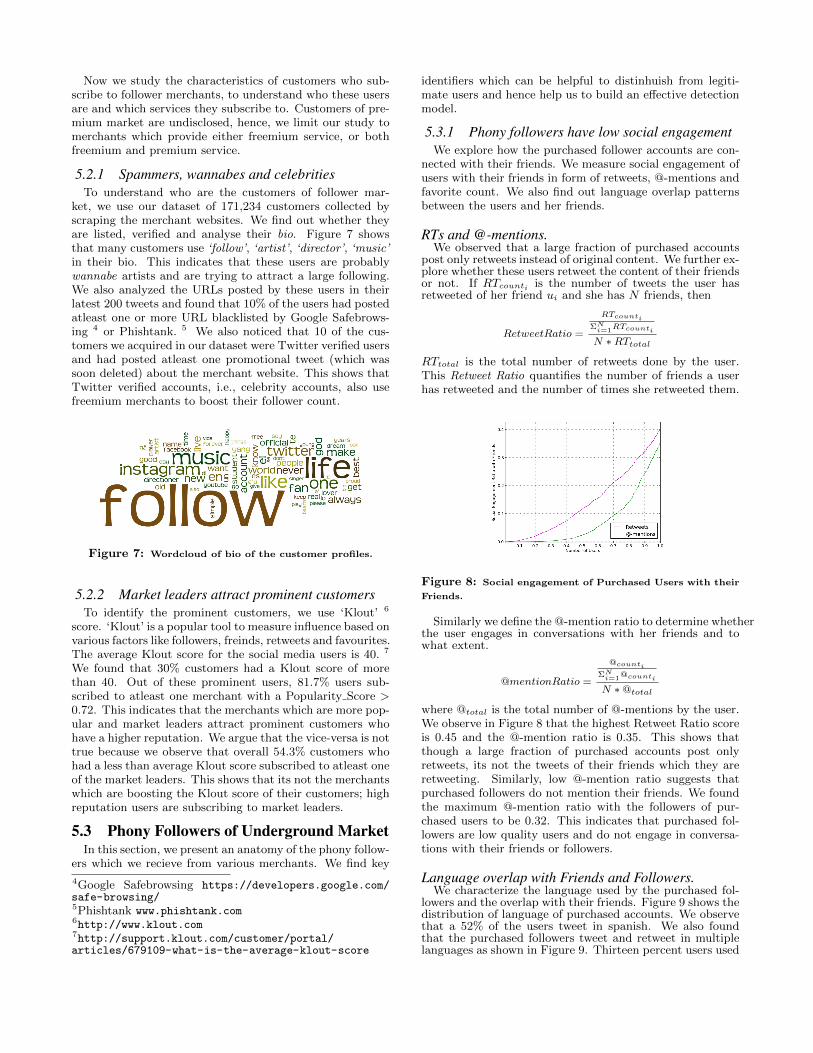
ket, we use our dataset of 171,234 customers collected byscraping the merchant websites. We find out whether theyare listed, verified and analyse their bio. Figure 7 showsthat many customers use ‘follow’, ‘artist’, ‘director’, ‘music’in their bio. This indicates that these users are probablywannabe artists and are trying to attract a large following.We also analyzed the URLs posted by these users in theirlatest 200 tweets and found that 10% of the users had postedatleast one or more URL blacklisted by Google Safebrows-ing 4 or Phishtank. 5 We also noticed that 10 of the cus-tomers we acquired in our dataset were Twitter verified usersand had posted atleast one promotional tweet (which wassoon deleted) about the merchant website. This shows thatTwitter verified accounts, i.e., celebrity accounts, also usefreemium merchants to boost their follower count.
Figure 7: Wordcloud of bio of the customer profiles.
5.2.2 Market leaders attract prominent customersTo identify the prominent customers, we use ‘Klout’ 6
score. ‘Klout’ is a popular tool to measure influence based onvarious factors like followers, freinds, retweets and favourites.The average Klout score for the social media users is 40. 7
We found that 30% customers had a Klout score of morethan 40. Out of these prominent users, 81.7% users sub-scribed to atleast one merchant with a Popularity Score >0.72. This indicates that the merchants which are more pop-ular and market leaders attract prominent customers whohave a higher reputation. We argue that the vice-versa is nottrue because we observe that overall 54.3% customers whohad a less than average Klout score subscribed to atleast oneof the market leaders. This shows that its not the merchantswhich are boosting the Klout score of their customers; highreputation users are subscribing to market leaders.
5.3 Phony Followers of Underground MarketIn this section, we present an anatomy of the phony follow-
ers which we recieve from various merchants. We find key
4Google Safebrowsing https://developers.google.com/safe-browsing/5Phishtank www.phishtank.com6http://www.klout.com7http://support.klout.com/customer/portal/articles/679109-what-is-the-average-klout-score
identifiers which can be helpful to distinhuish from legiti-mate users and hence help us to build an effective detectionmodel.
5.3.1 Phony followers have low social engagementWe explore how the purchased follower accounts are con-
nected with their friends. We measure social engagement ofusers with their friends in form of retweets, @-mentions andfavorite count. We also find out language overlap patternsbetween the users and her friends.
RTs and @-mentions.We observed that a large fraction of purchased accounts
post only retweets instead of original content. We further ex-plore whether these users retweet the content of their friendsor not. If RTcounti is the number of tweets the user hasretweeted of her friend ui and she has N friends, then
RetweetRatio =
RTcounti
ΣNi=1RTcounti
N ∗RTtotal
RTtotal is the total number of retweets done by the user.This Retweet Ratio quantifies the number of friends a userhas retweeted and the number of times she retweeted them.
Figure 8: Social engagement of Purchased Users with their
Friends.
Similarly we define the @-mention ratio to determine whetherthe user engages in conversations with her friends and towhat extent.
@mentionRatio =
@counti
ΣNi=1@counti
N ∗@total
where @total is the total number of @-mentions by the user.We observe in Figure 8 that the highest Retweet Ratio scoreis 0.45 and the @-mention ratio is 0.35. This shows thatthough a large fraction of purchased accounts post onlyretweets, its not the tweets of their friends which they areretweeting. Similarly, low @-mention ratio suggests thatpurchased followers do not mention their friends. We foundthe maximum @-mention ratio with the followers of pur-chased users to be 0.32. This indicates that purchased fol-lowers are low quality users and do not engage in conversa-tions with their friends or followers.
Language overlap with Friends and Followers.We characterize the language used by the purchased fol-
lowers and the overlap with their friends. Figure 9 shows thedistribution of language of purchased accounts. We observethat a 52% of the users tweet in spanish. We also foundthat the purchased followers tweet and retweet in multiplelanguages as shown in Figure 9. Thirteen percent users used
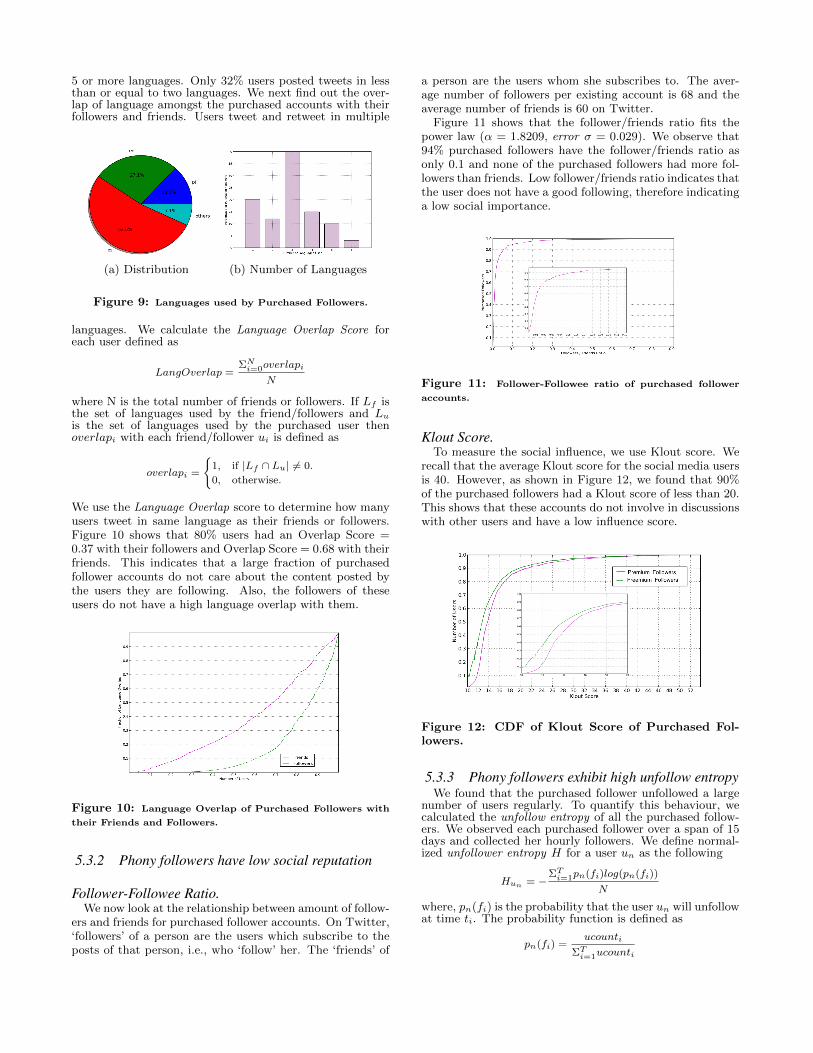
5 or more languages. Only 32% users posted tweets in lessthan or equal to two languages. We next find out the over-lap of language amongst the purchased accounts with theirfollowers and friends. Users tweet and retweet in multiple
(a) Distribution (b) Number of Languages
Figure 9: Languages used by Purchased Followers.
languages. We calculate the Language Overlap Score foreach user defined as
LangOverlap =ΣN
i=0overlapi
N
where N is the total number of friends or followers. If Lf isthe set of languages used by the friend/followers and Lu
is the set of languages used by the purchased user thenoverlapi with each friend/follower ui is defined as
overlapi =
{1, if |Lf ∩ Lu| 6= 0.
0, otherwise.
We use the Language Overlap score to determine how manyusers tweet in same language as their friends or followers.Figure 10 shows that 80% users had an Overlap Score =0.37 with their followers and Overlap Score = 0.68 with theirfriends. This indicates that a large fraction of purchasedfollower accounts do not care about the content posted bythe users they are following. Also, the followers of theseusers do not have a high language overlap with them.
Figure 10: Language Overlap of Purchased Followers with
their Friends and Followers.
5.3.2 Phony followers have low social reputation
Follower-Followee Ratio.We now look at the relationship between amount of follow-
ers and friends for purchased follower accounts. On Twitter,‘followers’ of a person are the users which subscribe to theposts of that person, i.e., who ‘follow’ her. The ‘friends’ of
a person are the users whom she subscribes to. The aver-age number of followers per existing account is 68 and theaverage number of friends is 60 on Twitter.
Figure 11 shows that the follower/friends ratio fits thepower law (α = 1.8209, error σ = 0.029). We observe that94% purchased followers have the follower/friends ratio asonly 0.1 and none of the purchased followers had more fol-lowers than friends. Low follower/friends ratio indicates thatthe user does not have a good following, therefore indicatinga low social importance.
Figure 11: Follower-Followee ratio of purchased follower
accounts.
Klout Score.To measure the social influence, we use Klout score. We
recall that the average Klout score for the social media usersis 40. However, as shown in Figure 12, we found that 90%of the purchased followers had a Klout score of less than 20.This shows that these accounts do not involve in discussionswith other users and have a low influence score.
Figure 12: CDF of Klout Score of Purchased Fol-lowers.
5.3.3 Phony followers exhibit high unfollow entropyWe found that the purchased follower unfollowed a large
number of users regularly. To quantify this behaviour, wecalculated the unfollow entropy of all the purchased follow-ers. We observed each purchased follower over a span of 15days and collected her hourly followers. We define normal-ized unfollower entropy H for a user un as the following
Hun = −ΣT
i=1pn(fi)log(pn(fi))
N
where, pn(fi) is the probability that the user un will unfollowat time ti. The probability function is defined as
pn(fi) =ucounti
ΣTi=1ucounti
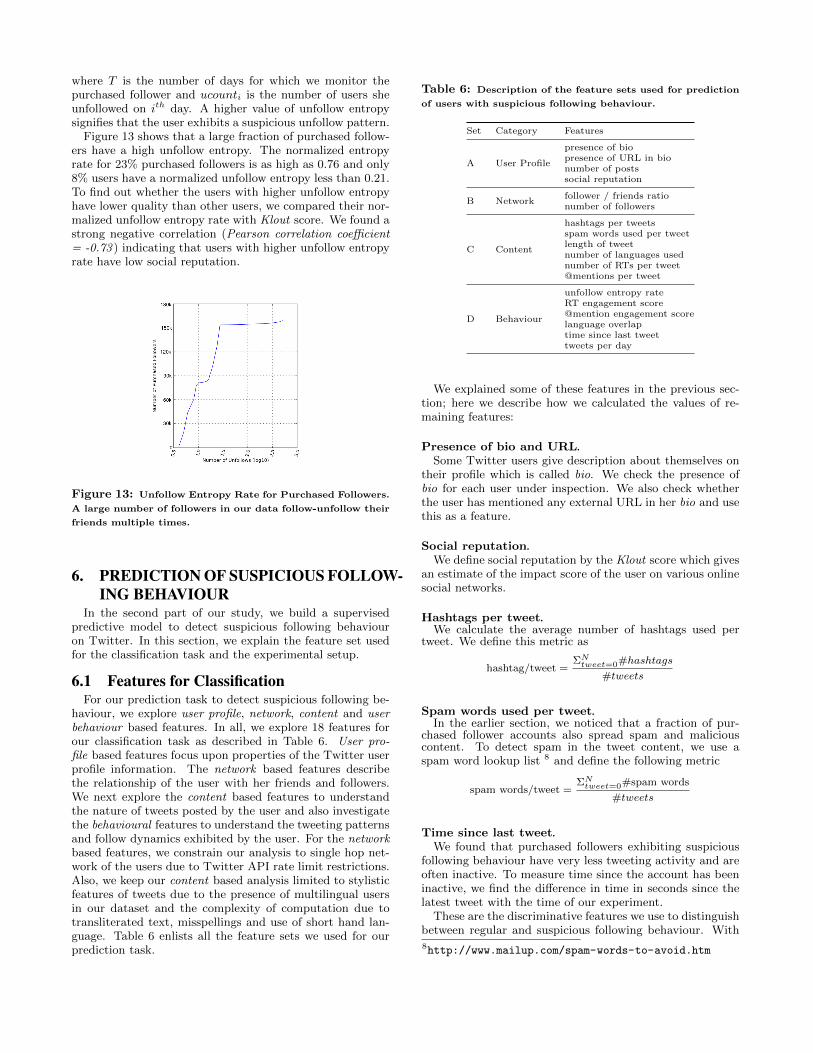
where T is the number of days for which we monitor thepurchased follower and ucounti is the number of users sheunfollowed on ith day. A higher value of unfollow entropysignifies that the user exhibits a suspicious unfollow pattern.
Figure 13 shows that a large fraction of purchased follow-ers have a high unfollow entropy. The normalized entropyrate for 23% purchased followers is as high as 0.76 and only8% users have a normalized unfollow entropy less than 0.21.To find out whether the users with higher unfollow entropyhave lower quality than other users, we compared their nor-malized unfollow entropy rate with Klout score. We found astrong negative correlation (Pearson correlation coefficient= -0.73 ) indicating that users with higher unfollow entropyrate have low social reputation.
Figure 13: Unfollow Entropy Rate for Purchased Followers.
A large number of followers in our data follow-unfollow their
friends multiple times.
6. PREDICTION OF SUSPICIOUS FOLLOW-ING BEHAVIOUR
In the second part of our study, we build a supervisedpredictive model to detect suspicious following behaviouron Twitter. In this section, we explain the feature set usedfor the classification task and the experimental setup.
6.1 Features for ClassificationFor our prediction task to detect suspicious following be-
haviour, we explore user profile, network, content and userbehaviour based features. In all, we explore 18 features forour classification task as described in Table 6. User pro-file based features focus upon properties of the Twitter userprofile information. The network based features describethe relationship of the user with her friends and followers.We next explore the content based features to understandthe nature of tweets posted by the user and also investigatethe behavioural features to understand the tweeting patternsand follow dynamics exhibited by the user. For the networkbased features, we constrain our analysis to single hop net-work of the users due to Twitter API rate limit restrictions.Also, we keep our content based analysis limited to stylisticfeatures of tweets due to the presence of multilingual usersin our dataset and the complexity of computation due totransliterated text, misspellings and use of short hand lan-guage. Table 6 enlists all the feature sets we used for ourprediction task.
Table 6: Description of the feature sets used for prediction
of users with suspicious following behaviour.
Set Category Features
A User Profile
presence of biopresence of URL in bionumber of postssocial reputation
B Networkfollower / friends rationumber of followers
C Content
hashtags per tweetsspam words used per tweetlength of tweetnumber of languages usednumber of RTs per tweet@mentions per tweet
D Behaviour
unfollow entropy rateRT engagement score@mention engagement scorelanguage overlaptime since last tweettweets per day
We explained some of these features in the previous sec-tion; here we describe how we calculated the values of re-maining features:
Presence of bio and URL.Some Twitter users give description about themselves on
their profile which is called bio. We check the presence ofbio for each user under inspection. We also check whetherthe user has mentioned any external URL in her bio and usethis as a feature.
Social reputation.We define social reputation by the Klout score which gives
an estimate of the impact score of the user on various onlinesocial networks.
Hashtags per tweet.We calculate the average number of hashtags used per
tweet. We define this metric as
hashtag/tweet =ΣN
tweet=0#hashtags
#tweets
Spam words used per tweet.In the earlier section, we noticed that a fraction of pur-
chased follower accounts also spread spam and maliciouscontent. To detect spam in the tweet content, we use aspam word lookup list 8 and define the following metric
spam words/tweet =ΣN
tweet=0#spam words
#tweets
Time since last tweet.We found that purchased followers exhibiting suspicious
following behaviour have very less tweeting activity and areoften inactive. To measure time since the account has beeninactive, we find the difference in time in seconds since thelatest tweet with the time of our experiment.
These are the discriminative features we use to distinguishbetween regular and suspicious following behaviour. With8http://www.mailup.com/spam-words-to-avoid.htm
the help of these features, we detect users with suspiciousfollow behaviour in the following section.
6.2 Experimental Setup and ClassificationFor our classification experiment, we consider the 170k
public purchased followers as our true positive dataset of sus-picious follow behaviour. For the negative class (legitimatefollow behaviour), we pick random 170k users from Twit-ter stream using the streaming API. However, a balanceddataset as ours may create a sample bias. Therefore, to en-sure valid results and eliminate the bias, we under-sampleour negative class. We draw 10 random but independentsubsets from the set of 170k legitimate users (-ve class) andtrain 10 classifier models based on these 10 subsets alongwith the 170k samples of the suspicious follow behaviourusers (+ve class). We then use 10 fold cross validation andreport the average results for our prediction task.
We treat the detection of suspicious follow behaviour as atwo class classification problem. In order to detect such be-haviour, we use several supervised learning algorithms likeNaive Bayes, Gradient Decent, Random Forest etc. How-ever, we achieved highest accuracy and overall best resultswith Support Vector Machine (SVM). We use a non-linearSVM with the Radial Basis Function (RBF) kernel for ourexperiment. Table 7 gives the details of our experimentalsetup - dataset description and the parameter values for theSVM classification algorithm.
Table 7: Description of the experimental setup for predic-
tion fo suspicious following behaviour.
Dataset 342,000 usersSuspicious (+ve class) 170,000 usersLegitimate (-ve class) 170,000 users (10 times)Classifier SVMC 1,000alpha 20.0Classification Runs 10Feature Sets {A}, {A, B}, {A, B, C}, {A, B, C, D}Train-Test Split 70%-30%Cross Validation 10-fold
In order to assess the effectiveness of features, we repeatthe classification experiment by incrementally adding eachfeature set. For evaluation, we used 70-30 split of the train-ing and the testing dataset. We use 10 fold cross validationto report our results.
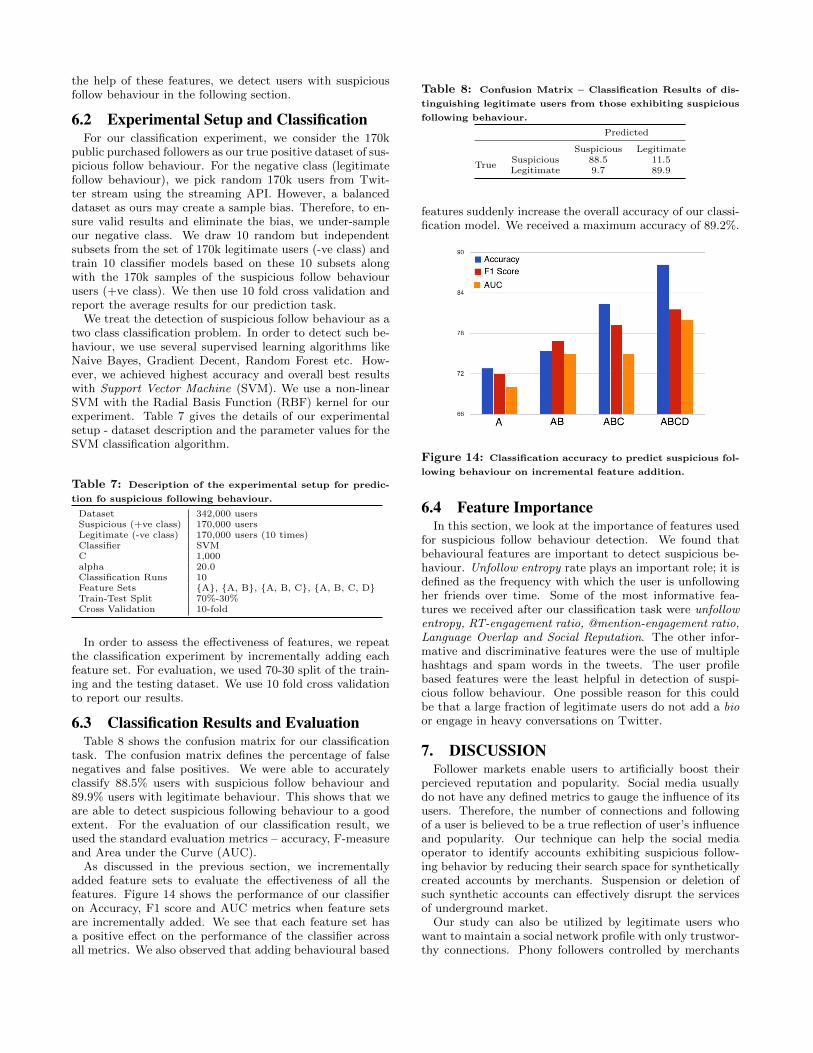
6.3 Classification Results and EvaluationTable 8 shows the confusion matrix for our classification
task. The confusion matrix defines the percentage of falsenegatives and false positives. We were able to accuratelyclassify 88.5% users with suspicious follow behaviour and89.9% users with legitimate behaviour. This shows that weare able to detect suspicious following behaviour to a goodextent. For the evaluation of our classification result, weused the standard evaluation metrics – accuracy, F-measureand Area under the Curve (AUC).
As discussed in the previous section, we incrementallyadded feature sets to evaluate the effectiveness of all thefeatures. Figure 14 shows the performance of our classifieron Accuracy, F1 score and AUC metrics when feature setsare incrementally added. We see that each feature set hasa positive effect on the performance of the classifier acrossall metrics. We also observed that adding behavioural based
Table 8: Confusion Matrix – Classification Results of dis-
tinguishing legitimate users from those exhibiting suspicious
following behaviour.
Predicted
Suspicious Legitimate
TrueSuspicious 88.5 11.5Legitimate 9.7 89.9
features suddenly increase the overall accuracy of our classi-fication model. We received a maximum accuracy of 89.2%.
Figure 14: Classification accuracy to predict suspicious fol-
lowing behaviour on incremental feature addition.
6.4 Feature ImportanceIn this section, we look at the importance of features used
for suspicious follow behaviour detection. We found thatbehavioural features are important to detect suspicious be-haviour. Unfollow entropy rate plays an important role; it isdefined as the frequency with which the user is unfollowingher friends over time. Some of the most informative fea-tures we received after our classification task were unfollowentropy, RT-engagement ratio, @mention-engagement ratio,Language Overlap and Social Reputation. The other infor-mative and discriminative features were the use of multiplehashtags and spam words in the tweets. The user profilebased features were the least helpful in detection of suspi-cious follow behaviour. One possible reason for this couldbe that a large fraction of legitimate users do not add a bioor engage in heavy conversations on Twitter.
7. DISCUSSIONFollower markets enable users to artificially boost their
percieved reputation and popularity. Social media usuallydo not have any defined metrics to gauge the influence of itsusers. Therefore, the number of connections and followingof a user is believed to be a true reflection of user’s influenceand popularity. Our technique can help the social mediaoperator to identify accounts exhibiting suspicious follow-ing behavior by reducing their search space for syntheticallycreated accounts by merchants. Suspension or deletion ofsuch synthetic accounts can effectively disrupt the servicesof underground market.
Our study can also be utilized by legitimate users whowant to maintain a social network profile with only trustwor-thy connections. Phony followers controlled by merchants
often follow few random users to maintain their follower-friends count and hence evade detection. However, legiti-mate users who want to avoid and block such users from fol-lowing them can use our technique to identify their own fol-lowers with suspicious behavior with a high accuracy. Suchmeasures can be used against scams like [3] where hoax-ters bought 75k fake followers for a legitimate user. In caseof such attacks, our mechanism can help the victim userby identifying fake followers and removing them from user’sconnections.
Our study also sheds light on the source of this problem,i.e., the follower merchants. Follower merchants are respon-sible for the generation of 10-20% spam accounts that ex-ist on Twitter [17]. Therefore, its important to understandthe dynamics of these merchants. We show that thoughthere exist multiple merchants, the follower market has anoligopolist structure; there exist only few market leaders at-tracting most of the customers. Mitigating the operationsof market leaders can potentially reduce the infiltration ofsynthetic and compromised accounts into the social network.
The merchants may try to adapt their operations oncewe are effectively able to detect accounts exhibiting suspi-cious following behaviour. However, one of our key observa-tions is that we can identify the market leaders. Currently,there exists a good amount of difference between the mar-ket share of leaders and other merchants. Hence, even if themerchants evolve their techniques, the market leaders wouldnot be difficlt to distinguish. Bringing down these marketleaders can help the social media operators to a large ex-tent. Secondly, we observe that accounts with suspiciousfollowing behaviour have a high unfollow entropy rate andkeep unfollowing and following back their friends. Since themerchants try to provide bulk followers in a short amountof time, they would have to manage who-to-follow of theirsynthetic and compromised accounts to effectively cater totheir customers. These phony followers provided by mer-chants would either get detected because of our technique,or the merchants would have to slow down their operationsby reducing the follow-unfollow activity of the accounts theycontrol. Slowing down merchant’s activities would indirectlybenefit the social media operator because the merchants willnot be able to cater to a larger customer base. However, thisargument holds if merchants can create only limited numberof synthetic profiles. In case merchants have a large numberof sythetic profiles with a good follower-friends ratio withlow unfollow entropy, then they will be able to evade detec-tion by out technique. However, creation of a large numberof sythetic accounts will have a higher cost to the merchantsand can also be detected by already existing techniques.
8. LIMITATIONS AND CONCLUSIONIn this study, we present a landscape of Twitter under-
ground follower market. We focus of the building blocksof follower market - merchants, customers, phony followers.We use a dataset of 60 freemium and 57 premium merchantsfor our study which are most responsive and active. We col-lect 170k phony followers from these merchants. Also, wetook hourly snapshots of the merchant websites which can befurther improved to collect a larger dataset. Though thereexist millions of compromised and synthetic accounts con-trolled by the follower merchants, our dataset covers a largeportion of underground market over a course of 4 months.Therefore, we posit that our results would be scalable over
a much larger network of underground merchants.To summarise, we present the following in this study (i)
We measure the quality of service and uncover the underly-ing hierarchy of merchants. We discover an oligopoly struc-ture of the merchants, (ii) We analyze the reputation andprofile attributes of the market customers to understand whothey are are which merchants they subscribe to, (iii) Westudy suspicious following behaviour of the phony followersand build a supervised learning model to distinguish themfrom legitimate users. This is the first study to landscapeall aspects of an underground market to understand the un-derlying structure and characteristics.
9. REFERENCES[1] The dirty business of buying instagram followers.
http://racked.com/archives/2014/09/11/buy-
instagram-followers-bloggers.php, 2014.
[2] Fake twitter followers generate millions of dollars.http://cir.ca/news/fake-twitter-followers, 2014.
[3] Hoaxsters bought us 75,000 fake followers in a newkind of twitter attack.http://www.dailydot.com/technology/socialvevo-
swenzy-fake-twitter-followers-spam-attack/,2014.
[4] Review site yelp battles extortion claims.http://www.washingtonpost.com/business/review-
site-yelp-battles-against-extortion-
claims/2014/10/13/502a6ff4-5298-11e4-b86d-
184ac281388d_story.html, 2014.
[5] A. Beutel, W. Xu, V. Guruswami, C. Palow, andC. Faloutsos. Copycatch: stopping group attacks byspotting lockstep behavior in social networks. InProceedings of the 22nd international conference onWorld Wide Web, pages 119–130. International WorldWide Web Conferences Steering Committee, 2013.
[6] R. N. Bolton and J. H. Drew. A multistage model ofcustomers’ assessments of service quality and value.Journal of consumer research, pages 375–384, 1991.
[7] J. Caballero, C. Grier, C. Kreibich, and V. Paxson.Measuring pay-per-install: The commoditization ofmalware distribution. In USENIX SecuritySymposium, 2011.
[8] M. Cha, H. Haddadi, F. Benevenuto, and P. K.Gummadi. Measuring user influence in twitter: Themillion follower fallacy. ICWSM, 2010.
[9] M. Jiang, P. Cui, A. Beutel, C. Faloutsos, andS. Yang. Detecting suspicious following behavior inmultimillion-node social networks. In WWW, 2014.
[10] K. Levchenko, A. Pitsillidis, N. Chachra, B. Enright,M. Felegyhazi, C. Grier, T. Halvorson, C. Kanich,C. Kreibich, H. Liu, et al. Click trajectories:End-to-end analysis of the spam value chain. InSecurity and Privacy (SP), 2011.
[11] M. Motoyama, K. Levchenko, C. Kanich, D. McCoy,G. M. Voelker, and S. Savage. Re:Captchas-understanding captcha-solving services in aneconomic context. In USENIX Security Symposium,2010.
[12] M. Motoyama, D. McCoy, K. Levchenko, S. Savage,and G. M. Voelker. Dirty jobs: The role of freelancelabor in web service abuse. In USENIX SecuritySymposium, 2011.
[13] G. Stringhini, M. Egele, C. Kruegel, and G. Vigna.Poultry markets: on the underground economy oftwitter followers. In Proceedings of the 2012 ACMworkshop on Workshop on online social networks,pages 1–6. ACM, 2012.
[14] G. Stringhini, G. Wang, M. Egele, C. Kruegel,G. Vigna, H. Zheng, and B. Y. Zhao. Follow the green:growth and dynamics in twitter follower markets. InProceedings of the 2013 conference on Internetmeasurement conference, pages 163–176. ACM, 2013.
[15] K. Thomas, C. Grier, D. Song, and V. Paxson.Suspended accounts in retrospect: an analysis oftwitter spam. In IMC, 2011.
[16] K. Thomas, D. Iatskiv, E. Bursztein, T. Pietraszek,C. Grier, and D. McCoy. Dialing back abuse on phoneverified accounts. 2014.
[17] K. Thomas, D. McCoy, C. Grier, A. Kolcz, andV. Paxson. Trafficking fraudulent accounts: The roleof the underground market in twitter spam and abuse.In USENIX Security, pages 195–210. Citeseer, 2013.
[18] B. Viswanath, M. A. Bashir, M. Crovella, S. Guha,M. India, K. P. Gummadi, B. Krishnamurthy, andA. Mislove. Towards detecting anomalous userbehavior in online social networks. In Proceedings ofthe 23rd USENIX Security Symposium (USENIXSecurity), 2014.
[19] G. Wang, C. Wilson, X. Zhao, Y. Zhu, M. Mohanlal,H. Zheng, and B. Y. Zhao. Serf and turf: crowdturfingfor fun and profit. In WWW, 2012.