Embed Size (px)
Citation preview
What Price the Loss of Progressivity in Taxation? Europe’s Failure and its Consequences (Draft. For circulation not citation) Jeremy Leaman (Loughborough University, UK) The principles of progressive taxation emerged with the evolution of theories of political economy, a considerable time before their implementation in political practice. Adam Smith’s proposed that ‘(i)t is not very unreasonable that the rich should contribute to the public expense, not only in proportion to their revenue, but something more than in that proportion’ (Smith 1904: 493). Smith’s proposition was mirrored significantly in the writings of 19th century socialist thinkers, whereas political economists like Mill recommended a single-rate proportionality in income taxation after conceding that ‘incomes below a certain amount should be altogether untaxed’ (Mill 1970: 182). The evolution of taxation policies, which imposed higher rates on higher levels of personal annual income, in fact had as much to do with the fiscal needs of the state – in its conduct of increasingly costly civic and military affairs – as it did with the emergence of perceptions of tax justice. The growing demands placed upon the state by the increasing complexity of systems of production and distribution and by increasing urbanisation persuaded both economic and political elites of the virtues of public goods, financed and operated on the basis of favourable economies of scale, and of progressive taxation as an efficient means of financing the public goods that would benefit the processes of capital accumulation and social stability. The shift to progressive systems of direct taxation was further justified in economic theory by notions of the diminishing marginal returns of incremental rises in income, where the propensity to consume falls with the rise in disposable income. Revenues from progressively rising rates of income tax were thus seen as a means of maintaining the dynamic equilibrium of demand for and supply of goods and services produced by private businesses. This utilitarian view of progressive taxation only begins to be reinforced by ethical arguments at policy level with the popularisation of redistributive systems of Keynesian or social democratic welfarism which emerged in the 1930s and in particular after the Second World War. The historical background of the class compromise of the ‘Golden Age’ (Hobsbawm 1994, Harman 1999) – the carnage of two world wars, the social and political damage inflicted on capitalism by the Great Depression, the political advance of socialism in both the advanced economies of Europe and in the decolonised countries of the developing world – helped to legitimise steep curves of progression in income tax and high marginal rates and a significant increase in social transfers and other measures of redistribution in education, healthcare and housing. The compromise was sustained by the demonstration of the demand effect of rising real incomes on the turnover of industry and commerce, i.e. of the favourable effects of the secular redistribution of national income (qua gross wages ratio) and of political redistribution from capital to labour, reflected in the net capital and wages ratios. As a consequence, all the states of the OEEC and later of the OECD operated fiscal systems marked by progressivity in personal income tax, relatively high rates of corporation tax and relatively high tax ratios as a proportion of GDP. While the steep curves of progression and high marginal rates of income tax created an impression of punitive tax burdens on high earners, contributing to the emergence of the ‘tax exile’ emigrating to low-tax jurisdictions, the effective rate of taxation was considerably mitigated by the accumulation of generous allowances and offset facilities (e.g. degressive or accelerated depreciation provisions) in the income tax statutes of most European states. The Federal Republic of Germany is arguably the best
1
example of higher-than-average top marginal rates – initially imposed by the occupation authorities in 1949 – accompanied by extensive allowances which narrowed the tax base and lowered the effective rate of income taxation to average levels; Germany’s complex network of taxation statutes1 also generated the most extensive body of academic taxation literature in the world, over 70 percent according to popular myth! Apart from early evidence of inter-state tax competition via the allowance system, the contradictions and inefficiencies of a tax culture which required armies of tax advisors to reduce tax liabilities, using millions of ‘man’-hours to out-manoeuvre the revenue authorities, were evident even before the paradigm shift to supply-side neo-liberalism. Thus neo-liberals were able to popularise the tax reforms of the 1980s and 1990s by deploying the rhetoric of rationalisation, transparency and simplicity as well as with the appeal of lower taxation for all (e.g. Conservative Party 1979, 1987). The erosion of progressivity in taxation and its corollary of distributional justice was made easier in Europe by the intellectual capitulation of the social democratic Left to the seductive charm of neo-liberal supply-sidism. The shift away from redistributive fiscal policy was most clearly demonstrated by the Anglo-German ‘Third Way’ initiative which became emblematic of the new ‘supply-side agenda for the left’; in their joint paper ‘The Way Forward for Europe’s Social Democrats’, Tony Blair and Gerhard Schröder made an explicit distinction between the old politics of redistribution and the new politics of ‘enablement’. In old-style social democracy, they declare, ‘the promotion of social justice was sometimes confused with the imposition of equality of outcome. The result was neglect of the importance of rewarding effort and responsibility, and the association of social democracy with conformity and mediocrity’ (Blair & Schröder 1999). The years of oppostion for both the Labour Party and the SPD (1979-97 and 1982-98 respectively) witnessed both the waves of deregulation, liberalisation and privatisation and the media-driven propaganda campaign against fiscal irresponsibility, public sector inefficiency and welfare ‘parasitism’. While ‘New Labour’ inherited and maintained the radical tax reforms of the Thatcher and Major administratons – which saw top marginal rates for income tax fall from 83 to 40 percent and the top rate of corporation tax fall from 52 to 33 percent – it was the Schröder administration which made the first incisive moves to reform German income tax law, to flatten the progressivity curve and to shift the burden of taxation further towards indirect (regressive) taxes; between 1999 and 2005, top rates of income tax were lowered by the Red-Green coalition from 53 to 42 percent, the entry rate from 25.9 to 15 percent. Corporation tax, which the Kohl administration had lowered significantly from 50 to 30 percent, was reduced to a standard 25 percent in 2001. Meanwhile, the EU had implemented a series of directives in the areas of indirect taxation in conjunction with the inauguration of the Single Market in 1992; thus in October of that year, a minimum standard rate for VAT of 15 percent was made mandatory for all member states, i.e. became part of the acquis communautaire which future applicant states in central and eastern Europe would be required to translate into national law as a pre-condition of EU-membership. The approximate harmonisation of indirect taxation was not matched at this or any future stage by corresponding directives in the area of the harmonisation of direct taxation. The only significant harmonisation of fiscal policy involved the commitment within ECOFIN to maintain the strict budgetary
1 The German tax system includes long-standing arrangements of generous tax relief for shipping investments which, up until the recent container ship crisis, offered high returns for large investors.
2
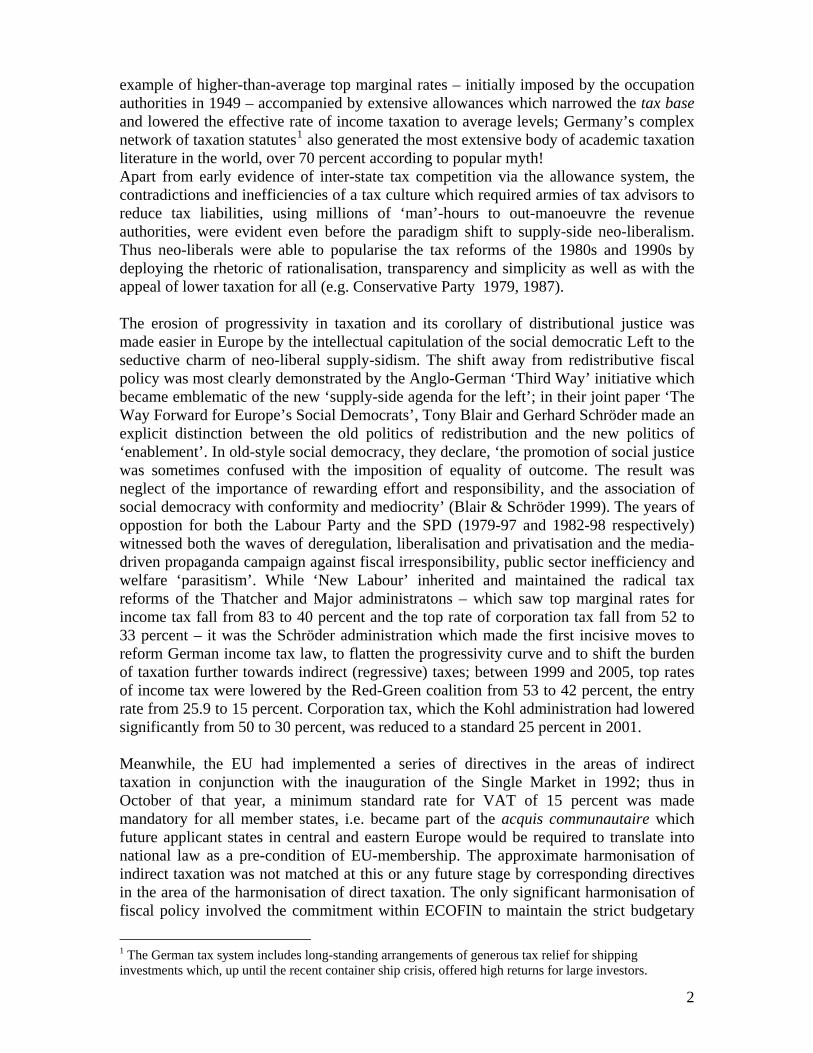
rules of the Maastricht Convergence Criteria in the 1997 Stability and Growth Pact. The accession criteria – the Copenhagen Criteria of 1997 – and the subsequent ‘Tax Package’ agreed in 2003 in advance of the May 2004 enlargement (European Commission 2004: 4ff) contain no provisions relating either to tax minima in direct taxation or to the principle of progressivity. The 2003 Tax Package contained nothing more than a Code of Conduct requiring member states ‘to refrain from introducing any new harmful tax measures (“standstill”) and amend any laws or practices that are deemed to be harmful in respect of the principles of the Code (“rollback”)’, with particular reference to the location of business (ibid.: 5). The thrust of the Commission’s efforts has been in the direction of removing tax obstacles to the optimal functioning of the Single Market, not on compensating for the subsequent contradictions of member states’ tax regimes (Schratzenstaller 2007: 372). There have been extensive discussions within the Commission relating to the establishment of a ‘Common Consolidated Corporate Tax Base’ (European Commission 2007: 3f) and, most recently, considerable political pressure from several member states to combat the abuse of tax havens, but very little else. As subsequent developments within the EU-27 have demonstrated, the failure of the EU to establish either standard minimum rates of taxation for corporations and non-incorporated businesses or a common principle of tax progressivity (as well as minimum standards of what constitutes taxable income) has opened the door to destructive tax competition between the 27 member states, if not by design then clearly by default; Genschel, Rixen and Uhl have dubbed the approach ‘a common taxation policy lacking both consciousness and democratic control’ (2008: 314). Frank Bönker (2003: 532) was correct in asserting that the tax competition between CEE transition states would be fiercer than within the EU as a whole, but there seems to be little doubt that corporate tax regimes throughout Europe have been softened as incentives for attracting or retaining FDI from transnational corporations and for protecting jobs. Table 1. Corporation Tax Rates in the EU15 1980-2009 in percent 1980 1990 2000 2009* Austria 55 30 34 25 Belgium 48 41 39 33.99 Denmark 40 40 32 25 Finland 43 25 29 26 France 50 37 33.3 33.3 Germany 56 50 45 15 Greece 43.4 46 40 25** Ireland 45 43 24 12.5 Italy 25 36 37 31.4 Luxembourg 40 34 30 25.5 Netherlands 48 35 35 25.5** Portugal 23 36.5 32 27.5** Spain 33 35 35 30** Sweden 40 40 28 26.3 UK 52 35 30 28** Source: World Tax Database; *standard proportional rates, except for countries with differential rates; ** denotes top rates
3
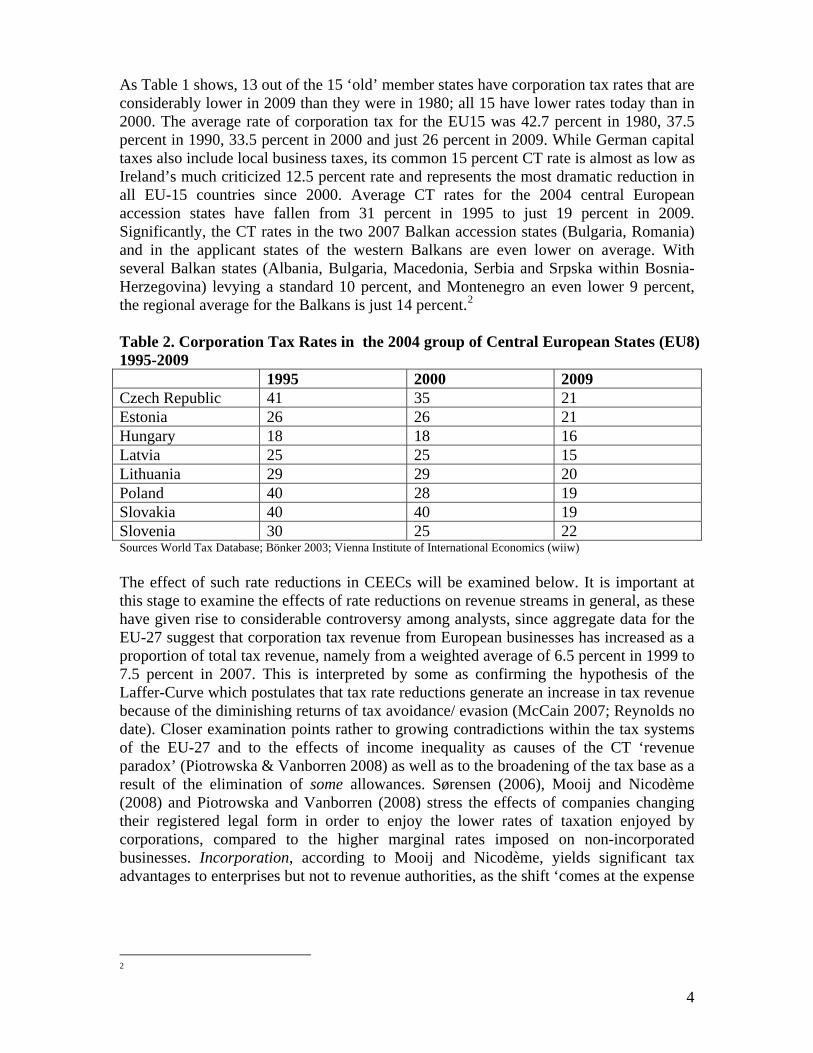
As Table 1 shows, 13 out of the 15 ‘old’ member states have corporation tax rates that are considerably lower in 2009 than they were in 1980; all 15 have lower rates today than in 2000. The average rate of corporation tax for the EU15 was 42.7 percent in 1980, 37.5 percent in 1990, 33.5 percent in 2000 and just 26 percent in 2009. While German capital taxes also include local business taxes, its common 15 percent CT rate is almost as low as Ireland’s much criticized 12.5 percent rate and represents the most dramatic reduction in all EU-15 countries since 2000. Average CT rates for the 2004 central European accession states have fallen from 31 percent in 1995 to just 19 percent in 2009. Significantly, the CT rates in the two 2007 Balkan accession states (Bulgaria, Romania) and in the applicant states of the western Balkans are even lower on average. With several Balkan states (Albania, Bulgaria, Macedonia, Serbia and Srpska within Bosnia-Herzegovina) levying a standard 10 percent, and Montenegro an even lower 9 percent, the regional average for the Balkans is just 14 percent.2 Table 2. Corporation Tax Rates in the 2004 group of Central European States (EU8) 1995-2009 1995 2000 2009 Czech Republic 41 35 21 Estonia 26 26 21 Hungary 18 18 16 Latvia 25 25 15 Lithuania 29 29 20 Poland 40 28 19 Slovakia 40 40 19 Slovenia 30 25 22 Sources World Tax Database; Bönker 2003; Vienna Institute of International Economics (wiiw) The effect of such rate reductions in CEECs will be examined below. It is important at this stage to examine the effects of rate reductions on revenue streams in general, as these have given rise to considerable controversy among analysts, since aggregate data for the EU-27 suggest that corporation tax revenue from European businesses has increased as a proportion of total tax revenue, namely from a weighted average of 6.5 percent in 1999 to 7.5 percent in 2007. This is interpreted by some as confirming the hypothesis of the Laffer-Curve which postulates that tax rate reductions generate an increase in tax revenue because of the diminishing returns of tax avoidance/ evasion (McCain 2007; Reynolds no date). Closer examination points rather to growing contradictions within the tax systems of the EU-27 and to the effects of income inequality as causes of the CT ‘revenue paradox’ (Piotrowska & Vanborren 2008) as well as to the broadening of the tax base as a result of the elimination of some allowances. Sørensen (2006), Mooij and Nicodème (2008) and Piotrowska and Vanborren (2008) stress the effects of companies changing their registered legal form in order to enjoy the lower rates of taxation enjoyed by corporations, compared to the higher marginal rates imposed on non-incorporated businesses. Incorporation, according to Mooij and Nicodème, yields significant tax advantages to enterprises but not to revenue authorities, as the shift ‘comes at the expense
2
4
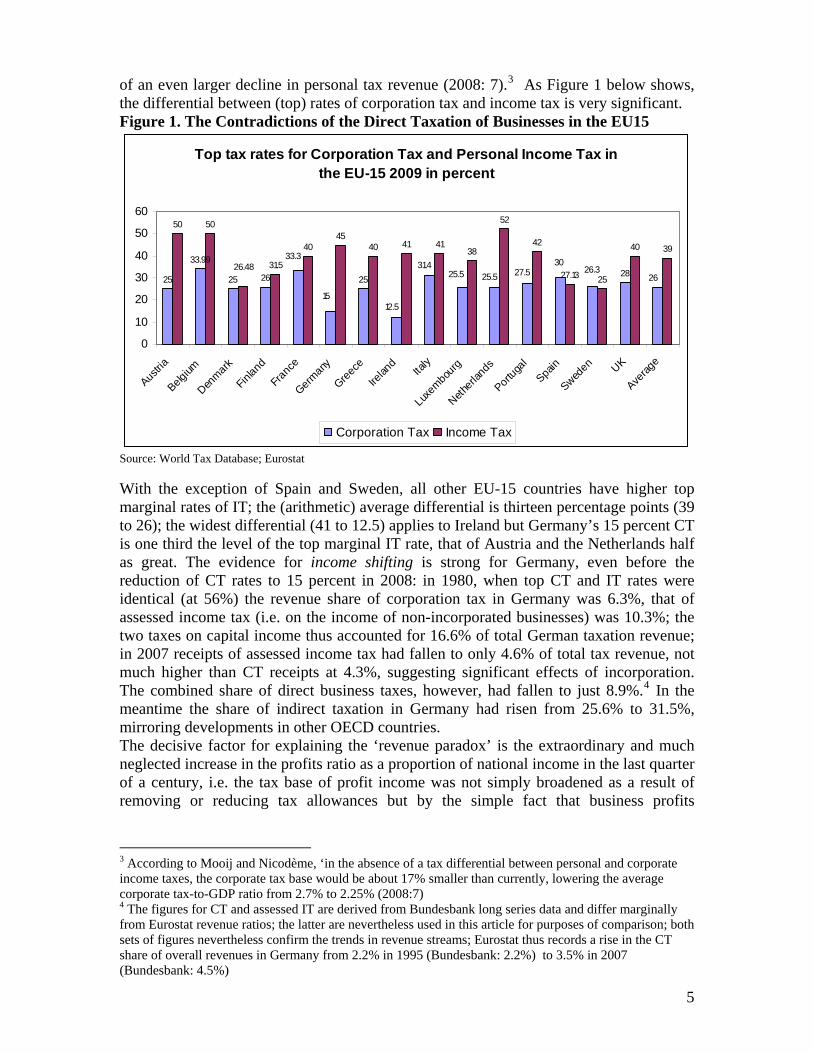
of an even larger decline in personal tax revenue (2008: 7).3 As Figure 1 below shows, the differential between (top) rates of corporation tax and income tax is very significant. Figure 1. The Contradictions of the Direct Taxation of Businesses in the EU15
Top tax rates for Corporation Tax and Personal Income Tax in the EU-15 2009 in percent
25
33.99
25 26 2528
50 50
31.5
4045
40 41 4138
52
42
27.13 25
40
25.5
12.5
31.4
15
33.3
27.525.5 2626.3
3039
26.48
0
10
20
30
40
50
60
Austria
Belgium
Denmark
Finland
Franc
e
Germany
Greece
Irelan
dIta
ly
Luxem
bourg
Netherl
ands
Portuga
lSpa
in
Sweden UK
Averag
e
Corporation Tax Income Tax
Source: World Tax Database; Eurostat With the exception of Spain and Sweden, all other EU-15 countries have higher top marginal rates of IT; the (arithmetic) average differential is thirteen percentage points (39 to 26); the widest differential (41 to 12.5) applies to Ireland but Germany’s 15 percent CT is one third the level of the top marginal IT rate, that of Austria and the Netherlands half as great. The evidence for income shifting is strong for Germany, even before the reduction of CT rates to 15 percent in 2008: in 1980, when top CT and IT rates were identical (at 56%) the revenue share of corporation tax in Germany was 6.3%, that of assessed income tax (i.e. on the income of non-incorporated businesses) was 10.3%; the two taxes on capital income thus accounted for 16.6% of total German taxation revenue; in 2007 receipts of assessed income tax had fallen to only 4.6% of total tax revenue, not much higher than CT receipts at 4.3%, suggesting significant effects of incorporation. The combined share of direct business taxes, however, had fallen to just 8.9%.4 In the meantime the share of indirect taxation in Germany had risen from 25.6% to 31.5%, mirroring developments in other OECD countries. The decisive factor for explaining the ‘revenue paradox’ is the extraordinary and much neglected increase in the profits ratio as a proportion of national income in the last quarter of a century, i.e. the tax base of profit income was not simply broadened as a result of removing or reducing tax allowances but by the simple fact that business profits
3 According to Mooij and Nicodème, ‘in the absence of a tax differential between personal and corporate income taxes, the corporate tax base would be about 17% smaller than currently, lowering the average corporate tax-to-GDP ratio from 2.7% to 2.25% (2008:7) 4 The figures for CT and assessed IT are derived from Bundesbank long series data and differ marginally from Eurostat revenue ratios; the latter are nevertheless used in this article for purposes of comparison; both sets of figures nevertheless confirm the trends in revenue streams; Eurostat thus records a rise in the CT share of overall revenues in Germany from 2.2% in 1995 (Bundesbank: 2.2%) to 3.5% in 2007 (Bundesbank: 4.5%)
5
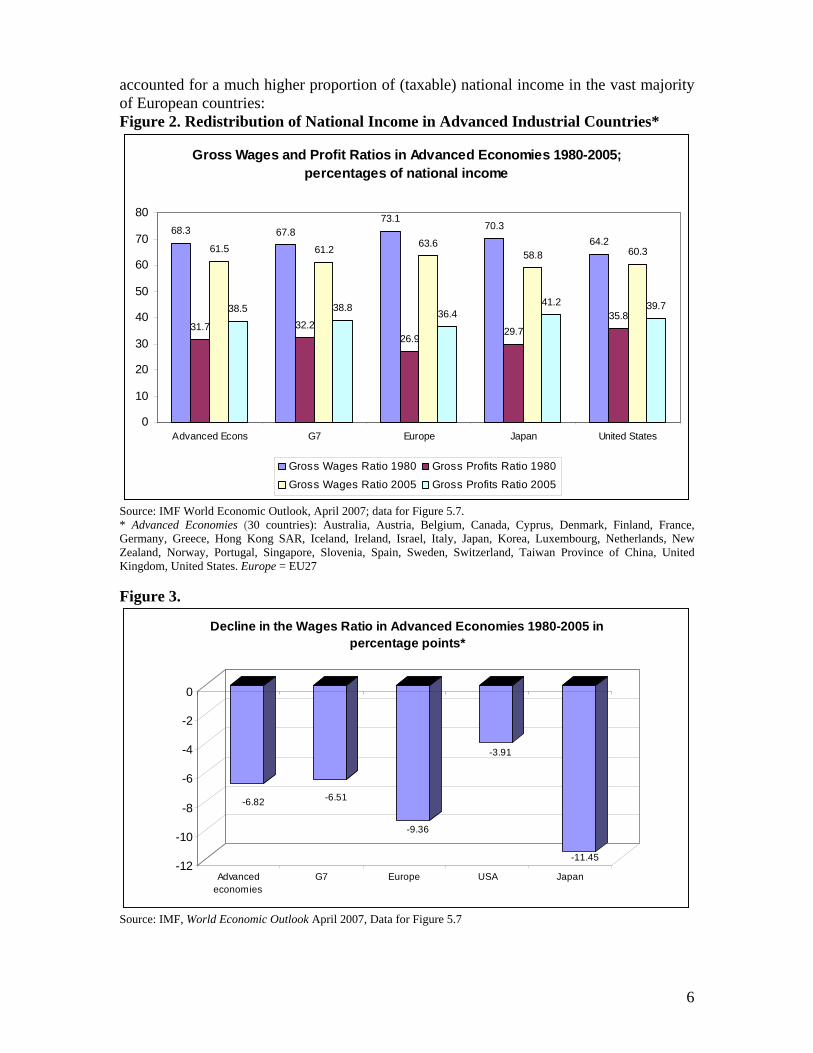
accounted for a much higher proportion of (taxable) national income in the vast majority of European countries: Figure 2. Redistribution of National Income in Advanced Industrial Countries*
Gross Wages and Profit Ratios in Advanced Economies 1980-2005; percentages of national income
68.3 67.873.1
70.364.2
31.7 32.226.9
29.735.8
61.5 61.2 63.658.8 60.3
38.5 38.8 36.441.2 39.7
0
10
20
30
40
50
60
70
80
Advanced Econs G7 Europe Japan United States
Gross Wages Ratio 1980 Gross Profits Ratio 1980
Gross Wages Ratio 2005 Gross Profits Ratio 2005
Source: IMF World Economic Outlook, April 2007; data for Figure 5.7. * Advanced Economies (30 countries): Australia, Austria, Belgium, Canada, Cyprus, Denmark, Finland, France, Germany, Greece, Hong Kong SAR, Iceland, Ireland, Israel, Italy, Japan, Korea, Luxembourg, Netherlands, New Zealand, Norway, Portugal, Singapore, Slovenia, Spain, Sweden, Switzerland, Taiwan Province of China, United Kingdom, United States. Europe = EU27 Figure 3.
-6.82 -6.51
-9.36
-3.91
-11.45-12
-10
-8
-6
-4
-2
0
Advancedeconomies
G7 Europe USA Japan
Decline in the Wages Ratio in Advanced Economies 1980-2005 in percentage points*
Source: IMF, World Economic Outlook April 2007, Data for Figure 5.7
6
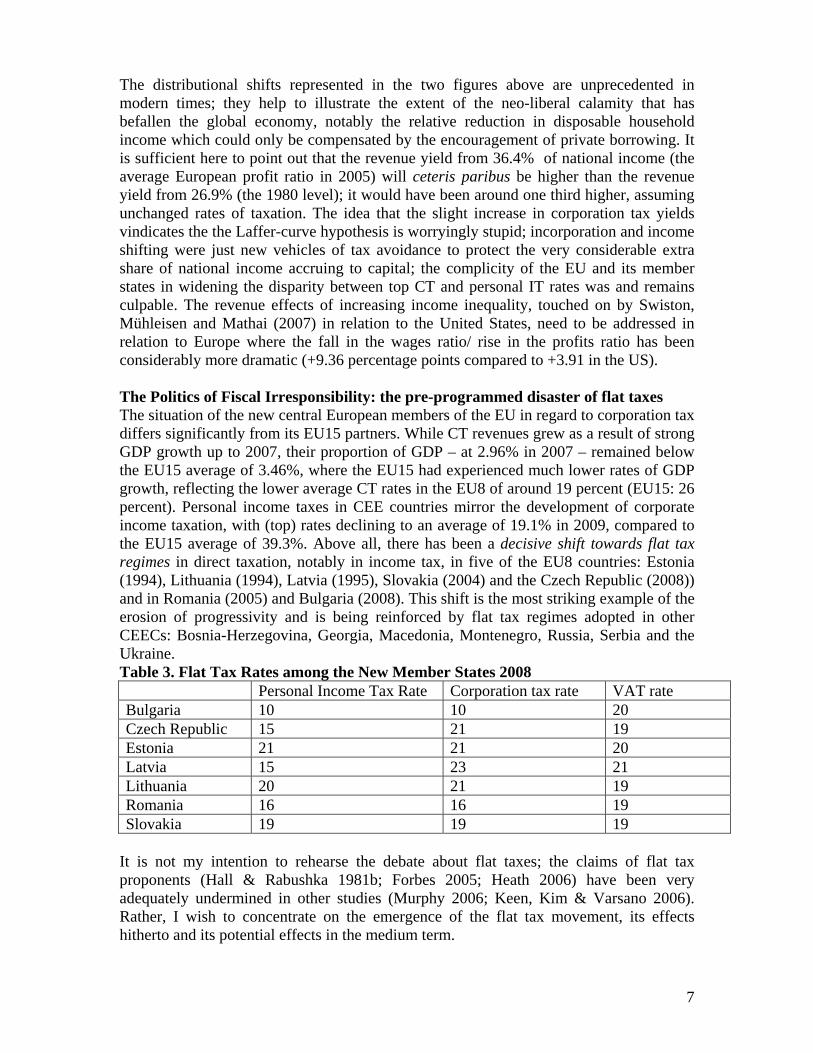
The distributional shifts represented in the two figures above are unprecedented in modern times; they help to illustrate the extent of the neo-liberal calamity that has befallen the global economy, notably the relative reduction in disposable household income which could only be compensated by the encouragement of private borrowing. It is sufficient here to point out that the revenue yield from 36.4% of national income (the average European profit ratio in 2005) will ceteris paribus be higher than the revenue yield from 26.9% (the 1980 level); it would have been around one third higher, assuming unchanged rates of taxation. The idea that the slight increase in corporation tax yields vindicates the the Laffer-curve hypothesis is worryingly stupid; incorporation and income shifting were just new vehicles of tax avoidance to protect the very considerable extra share of national income accruing to capital; the complicity of the EU and its member states in widening the disparity between top CT and personal IT rates was and remains culpable. The revenue effects of increasing income inequality, touched on by Swiston, Mühleisen and Mathai (2007) in relation to the United States, need to be addressed in relation to Europe where the fall in the wages ratio/ rise in the profits ratio has been considerably more dramatic (+9.36 percentage points compared to +3.91 in the US). The Politics of Fiscal Irresponsibility: the pre-programmed disaster of flat taxes The situation of the new central European members of the EU in regard to corporation tax differs significantly from its EU15 partners. While CT revenues grew as a result of strong GDP growth up to 2007, their proportion of GDP – at 2.96% in 2007 – remained below the EU15 average of 3.46%, where the EU15 had experienced much lower rates of GDP growth, reflecting the lower average CT rates in the EU8 of around 19 percent (EU15: 26 percent). Personal income taxes in CEE countries mirror the development of corporate income taxation, with (top) rates declining to an average of 19.1% in 2009, compared to the EU15 average of 39.3%. Above all, there has been a decisive shift towards flat tax regimes in direct taxation, notably in income tax, in five of the EU8 countries: Estonia (1994), Lithuania (1994), Latvia (1995), Slovakia (2004) and the Czech Republic (2008)) and in Romania (2005) and Bulgaria (2008). This shift is the most striking example of the erosion of progressivity and is being reinforced by flat tax regimes adopted in other CEECs: Bosnia-Herzegovina, Georgia, Macedonia, Montenegro, Russia, Serbia and the Ukraine. Table 3. Flat Tax Rates among the New Member States 2008 Personal Income Tax Rate Corporation tax rate VAT rate Bulgaria 10 10 20 Czech Republic 15 21 19 Estonia 21 21 20 Latvia 15 23 21 Lithuania 20 21 19 Romania 16 16 19 Slovakia 19 19 19
It is not my intention to rehearse the debate about flat taxes; the claims of flat tax proponents (Hall & Rabushka 1981b; Forbes 2005; Heath 2006) have been very adequately undermined in other studies (Murphy 2006; Keen, Kim & Varsano 2006). Rather, I wish to concentrate on the emergence of the flat tax movement, its effects hitherto and its potential effects in the medium term.
7
The resurrection of John Stuart Mill’s notion of a single proportional tax on income coincided with the second stagflationary crisis at the start of the 1980s and the capitulation of many mainstream economists to neo-liberal supply-sidism. Hall and Rabushka, economists at Stanford, floated the idea of a single rate tax in The Flat Tax (Hall & Rabushka 1981); the idea was seized on by US members of Congress, generating several legislative proposals in the first Reagan administration, and attracted the support of market radical pressure groups like the Cato Institute, the Heritage Foundation and the American Enterprise Institute, the well resourced exponents of what Susan George rightly describes as a new ‘cultural hegemony’. While the US flat tax debate remained theoretical, if very noisy, the real implementation fell to the newly independent states of eastern and central Europe. It is no coincidence that it was the three Baltic statelets of Estonia, Lithuania and Latvia5 that first chose to adopt both low rates of Corporation Tax and single rate systems of Income Tax; their geo-strategic history and vulnerability, their sectoral economic deficiencies and extreme trade dependence and their weak capital markets made them arguably more fearful of continued dependence on the Soviet Union, later the Russian Federation, and even more urgently keen to attract capital imports through foreign direct investment and (western) credit than the Visegrad Group and Slovenia. The vaunted bureaucratic simplicity of single rate systems also recommended itself to the states’ limited administrative authorities. The marked success of Ireland – as a peripheral EU15 state with a generous low-tax business environment – also encouraged the Baltic states to use capital imports as a key vehicle of growth. While the Visegrad states and Slovenia faced critical problems of infrastructural deficiences, low productivity and mass unemployment, they all introduced progressive systems of personal income tax with relatively high marginal rates, ranging from 32 percent in the Czech Republic to 50 percent in Slovenia, rate levels that persisted until as late as 2002. It was a decade after the Estonian tax reform before progressivity was decisively breached in the more advanced of the transition economies. Slovakia’s move to introduce a standard rate of 19 percent on income tax in 2004, as well as on corporation tax and VAT must be seen against the background of persistently high unemployment in the republic (18.1 percent in 2004; c.f. Czech Rep: 8.3%, Hungary: 6.2%), EU-accession and a renewed wave of tax rate reductions within the EU15 and elsewhere on the continent. Additionally, the dependence of Slovakia – along with all other CEECs – on capital imports from foreign lenders and investors was chronic, with a current account deficit of 3.5 percent of GDP. By 2004 the penetration of foreign banks in Slovakia – at 95% of total balances - matched that of its Visegrad partners (Czech Republic: 95%, Hungary: 82%, Poland: 72%) and betokened a clear potential vulnerability in any regional or indeed global banking crisis. While Estonia’s economic growth had generated significantly higher state revenues, the adoption of a single proportional rate of PIT did not produce a higher ratio of PIT revenues to either total taxation or to GDP. Slovakia’s shift to a flat tax regime was thus predicated on the expectation of growth and inward investment rather than on any Laffer Curve calculation. Slovakia’s experience with a single proportional rate of PIT and an identical rate of corporation tax mirrors that of the vast majority of new CEE member states, namely a markedly lower share of direct taxation to GDP than most of the old EU15 states:
5 Estonia (Pop: 1.34 million), Latvia (2.28 million) and Lithuania (3.39 million) with Cyprus, Malta and Luxembourg are the smallest states within the EU
8
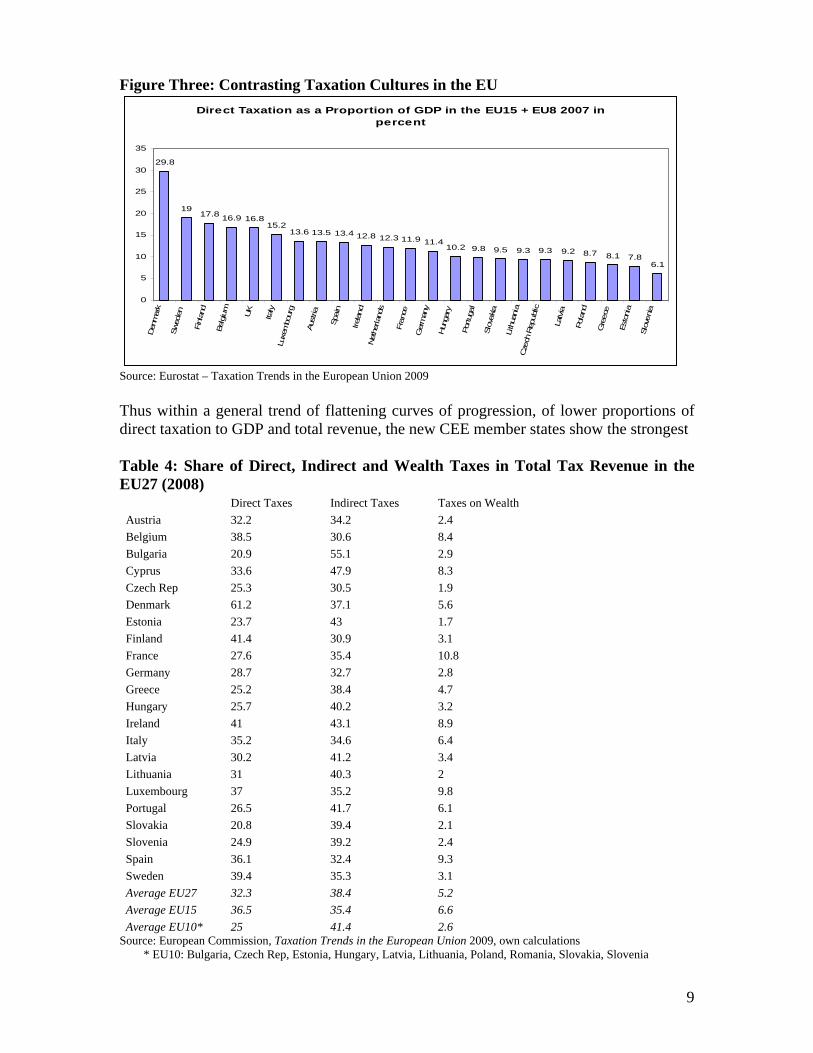
Figure Three: Contrasting Taxation Cultures in the EU Direct Taxation as a Proportion of GDP in the EU15 + EU8 2007 in
percent
29.8
1917.8 16.9 16.8
15.213.6 13.5 13.4 12.8 12.3 11.9 11.4
10.2 9.8 9.5 9.3 9.3 9.2 8.7 8.1 7.86.1
0
5
10
15
20
25
30
35Den
mar
k
Swed
en
Finl
and
Belg
ium
UK
Italy
Luxe
mbo
urg
Aust
ria
Spai
n
Ireland
Net
herla
nds
Fran
ce
Ger
man
y
Hun
gary
Portu
gal
Slov
akia
Lith
uani
aCze
ch R
epub
lic
Latv
ia
Pola
nd
Gre
ece
Esto
nia
Slov
enia
Source: Eurostat – Taxation Trends in the European Union 2009 Thus within a general trend of flattening curves of progression, of lower proportions of direct taxation to GDP and total revenue, the new CEE member states show the strongest Table 4: Share of Direct, Indirect and Wealth Taxes in Total Tax Revenue in the EU27 (2008)
Direct Taxes Indirect Taxes Taxes on Wealth Austria 32.2 34.2 2.4 Belgium 38.5 30.6 8.4 Bulgaria 20.9 55.1 2.9 Cyprus 33.6 47.9 8.3 Czech Rep 25.3 30.5 1.9 Denmark 61.2 37.1 5.6 Estonia 23.7 43 1.7 Finland 41.4 30.9 3.1 France 27.6 35.4 10.8 Germany 28.7 32.7 2.8 Greece 25.2 38.4 4.7 Hungary 25.7 40.2 3.2 Ireland 41 43.1 8.9 Italy 35.2 34.6 6.4 Latvia 30.2 41.2 3.4 Lithuania 31 40.3 2 Luxembourg 37 35.2 9.8 Portugal 26.5 41.7 6.1 Slovakia 20.8 39.4 2.1 Slovenia 24.9 39.2 2.4 Spain 36.1 32.4 9.3 Sweden 39.4 35.3 3.1 Average EU27 32.3 38.4 5.2 Average EU15 36.5 35.4 6.6 Average EU10* 25 41.4 2.6
Source: European Commission, Taxation Trends in the European Union 2009, own calculations * EU10: Bulgaria, Czech Rep, Estonia, Hungary, Latvia, Lithuania, Poland, Romania, Slovakia, Slovenia
9
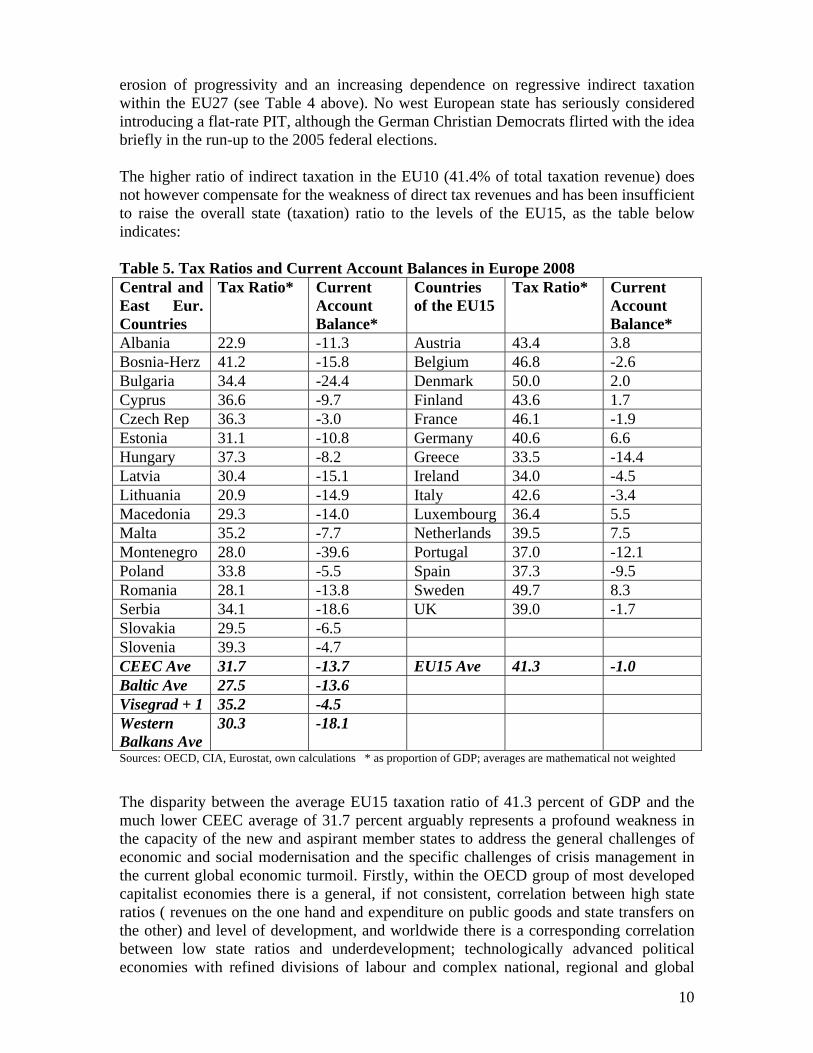
erosion of progressivity and an increasing dependence on regressive indirect taxation within the EU27 (see Table 4 above). No west European state has seriously considered introducing a flat-rate PIT, although the German Christian Democrats flirted with the idea briefly in the run-up to the 2005 federal elections. The higher ratio of indirect taxation in the EU10 (41.4% of total taxation revenue) does not however compensate for the weakness of direct tax revenues and has been insufficient to raise the overall state (taxation) ratio to the levels of the EU15, as the table below indicates: Table 5. Tax Ratios and Current Account Balances in Europe 2008 Central and East Eur. Countries
Tax Ratio* Current Account Balance*
Countries of the EU15
Tax Ratio* Current Account Balance*
Albania 22.9 -11.3 Austria 43.4 3.8 Bosnia-Herz 41.2 -15.8 Belgium 46.8 -2.6 Bulgaria 34.4 -24.4 Denmark 50.0 2.0 Cyprus 36.6 -9.7 Finland 43.6 1.7 Czech Rep 36.3 -3.0 France 46.1 -1.9 Estonia 31.1 -10.8 Germany 40.6 6.6 Hungary 37.3 -8.2 Greece 33.5 -14.4 Latvia 30.4 -15.1 Ireland 34.0 -4.5 Lithuania 20.9 -14.9 Italy 42.6 -3.4 Macedonia 29.3 -14.0 Luxembourg 36.4 5.5 Malta 35.2 -7.7 Netherlands 39.5 7.5 Montenegro 28.0 -39.6 Portugal 37.0 -12.1 Poland 33.8 -5.5 Spain 37.3 -9.5 Romania 28.1 -13.8 Sweden 49.7 8.3 Serbia 34.1 -18.6 UK 39.0 -1.7 Slovakia 29.5 -6.5 Slovenia 39.3 -4.7 CEEC Ave 31.7 -13.7 EU15 Ave 41.3 -1.0 Baltic Ave 27.5 -13.6 Visegrad + 1 35.2 -4.5 Western Balkans Ave
30.3 -18.1
Sources: OECD, CIA, Eurostat, own calculations * as proportion of GDP; averages are mathematical not weighted The disparity between the average EU15 taxation ratio of 41.3 percent of GDP and the much lower CEEC average of 31.7 percent arguably represents a profound weakness in the capacity of the new and aspirant member states to address the general challenges of economic and social modernisation and the specific challenges of crisis management in the current global economic turmoil. Firstly, within the OECD group of most developed capitalist economies there is a general, if not consistent, correlation between high state ratios ( revenues on the one hand and expenditure on public goods and state transfers on the other) and level of development, and worldwide there is a corresponding correlation between low state ratios and underdevelopment; technologically advanced political economies with refined divisions of labour and complex national, regional and global
10
interdependencies overwhelmingly need extensive networks of publicly funded physical and social infrastructures to ensure that the comparative advantage of businesses and households in investment, production and consumption is maintained. Secondly, in joining the European Union within its unitary economic space, the countries of eastern and central Europe have aligned themselves politically and commercially with the most advanced group of industrialised states in the world6 and have been obliged, as noted above, to accept the body of acquis designed (before 1990) to promote foremost the commercial and political interests of the western group. Thirdly, as transition states, i.e. quite unlike the western group, the dismantling of authoritarian socialist state systems and the piloting of enterprises, workers, scientists, households towards market economics required at the very least state apparatuses that had the resources and the administrative capacities to ensure the sectoral and spatial coherence of their political economies (= structural economic policies) and to design and realise appropriate infrastructures for their modernisation. A core hypothesis of this paper is that the institutional and policy preferences of the EU15 were critically deficient (in general, but particularly in relation to transition states) and, above all, that the demonisation of the state in neo-liberal thinking and in the post-Soviet dismantling of state-socialist institutions pre-programmed the difficulties currently being experienced by the overwhelming majority of CEE new member states. A more judicious approach to the role of the state would have justified both higher state ratios and greater progressivity in the administration of tax revenues. This in turn could have provided a strategic cushion against the perils of a chronic structural dependency on capital imports. The juxtaposition of tax ratios with current account balances Table 5 is one way of illustrating the structural dependency of the CEE transition states; while the current account balances of the EU15 contain one or two examples of long-term high external deficits (e.g. Portugal, Greece) and persistent if low deficits (Italy, UK), the average CA deficit for the EU15 has hovered around +/- zero since the early 90s7. All the CEE states in the table have shown consistent CA deficits since the collapse of either COMECON or the Yugoslav Federation and manifest a current average of -13.7% overall; there are distinct differences between the Visegrad + Slovenia group (-4.5%), the Baltic group (-13.6%) and the Western Balkans (-18.1%). Plugging current account deficits of 1.4% (UK) to 3.4% (Italy) via the capital account is not particularly problematic, given the size and credit rating of these core EU-states. The same cannot be said of those CEE countries that are currently living 13 percent beyond their means. Current account deficits were, of course, to have been expected in the process of radical modernisation and in preparation for EU-accession, but their persistence and, more recently, their widening renders CEE economies vulnerable to currency devaluation and expensive rescheduling of debt. If, as has been the case in the Baltic states and Hungary, foreign loans are predominantly denominated in hard and appreciating currencies (euros or Swiss francs in the main) a large foreign debt-overhang can easily develop stagflationary dimensions and, consequently, political turmoil. In this context the essentially problematic ownership structure of CEE banking systems becomes a 6 Twelve of the EU-15 are in the top 20 countries for per capita GDP in the World Development database of the World Bank 7 The current account disparities within the EU15 also represent a potentially explosive danger for the coherence and solidarity of the whole European project (Huffschmid 2007: 314f); the disparities between the EU15 states and the 10 CEE member states are potentially more politically divisive, not simply because of their scale but because, by their nature, they epitomise the unequal interdependence and the new hegemonic relationships within the enlarged EU.
11
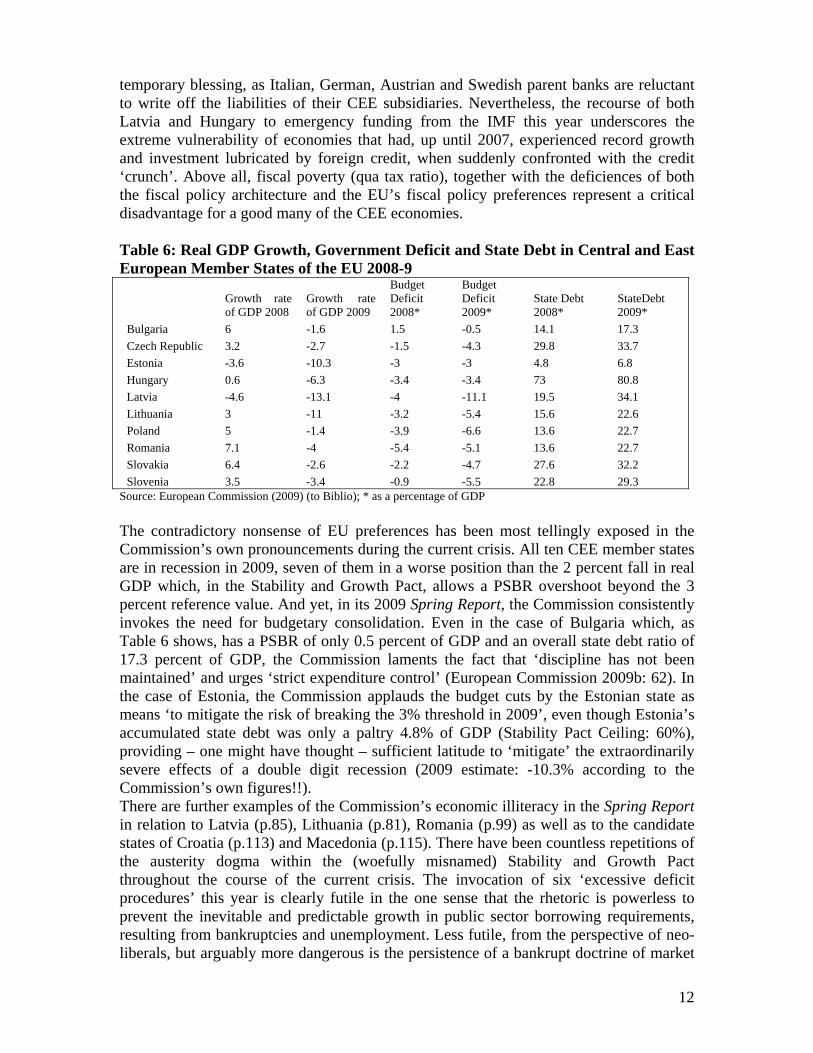
temporary blessing, as Italian, German, Austrian and Swedish parent banks are reluctant to write off the liabilities of their CEE subsidiaries. Nevertheless, the recourse of both Latvia and Hungary to emergency funding from the IMF this year underscores the extreme vulnerability of economies that had, up until 2007, experienced record growth and investment lubricated by foreign credit, when suddenly confronted with the credit ‘crunch’. Above all, fiscal poverty (qua tax ratio), together with the deficiences of both the fiscal policy architecture and the EU’s fiscal policy preferences represent a critical disadvantage for a good many of the CEE economies. Table 6: Real GDP Growth, Government Deficit and State Debt in Central and East European Member States of the EU 2008-9
Growth rate of GDP 2008
Growth rate of GDP 2009
Budget Deficit 2008*
Budget Deficit 2009*
State Debt 2008*
StateDebt 2009*
Bulgaria 6 -1.6 1.5 -0.5 14.1 17.3 Czech Republic 3.2 -2.7 -1.5 -4.3 29.8 33.7 Estonia -3.6 -10.3 -3 -3 4.8 6.8 Hungary 0.6 -6.3 -3.4 -3.4 73 80.8 Latvia -4.6 -13.1 -4 -11.1 19.5 34.1 Lithuania 3 -11 -3.2 -5.4 15.6 22.6 Poland 5 -1.4 -3.9 -6.6 13.6 22.7 Romania 7.1 -4 -5.4 -5.1 13.6 22.7 Slovakia 6.4 -2.6 -2.2 -4.7 27.6 32.2 Slovenia 3.5 -3.4 -0.9 -5.5 22.8 29.3
Source: European Commission (2009) (to Biblio); * as a percentage of GDP The contradictory nonsense of EU preferences has been most tellingly exposed in the Commission’s own pronouncements during the current crisis. All ten CEE member states are in recession in 2009, seven of them in a worse position than the 2 percent fall in real GDP which, in the Stability and Growth Pact, allows a PSBR overshoot beyond the 3 percent reference value. And yet, in its 2009 Spring Report, the Commission consistently invokes the need for budgetary consolidation. Even in the case of Bulgaria which, as Table 6 shows, has a PSBR of only 0.5 percent of GDP and an overall state debt ratio of 17.3 percent of GDP, the Commission laments the fact that ‘discipline has not been maintained’ and urges ‘strict expenditure control’ (European Commission 2009b: 62). In the case of Estonia, the Commission applauds the budget cuts by the Estonian state as means ‘to mitigate the risk of breaking the 3% threshold in 2009’, even though Estonia’s accumulated state debt was only a paltry 4.8% of GDP (Stability Pact Ceiling: 60%), providing – one might have thought – sufficient latitude to ‘mitigate’ the extraordinarily severe effects of a double digit recession (2009 estimate: -10.3% according to the Commission’s own figures!!). There are further examples of the Commission’s economic illiteracy in the Spring Report in relation to Latvia (p.85), Lithuania (p.81), Romania (p.99) as well as to the candidate states of Croatia (p.113) and Macedonia (p.115). There have been countless repetitions of the austerity dogma within the (woefully misnamed) Stability and Growth Pact throughout the course of the current crisis. The invocation of six ‘excessive deficit procedures’ this year is clearly futile in the one sense that the rhetoric is powerless to prevent the inevitable and predictable growth in public sector borrowing requirements, resulting from bankruptcies and unemployment. Less futile, from the perspective of neo-liberals, but arguably more dangerous is the persistence of a bankrupt doctrine of market
12
radicalism which questions the allocatory efficiency of state agencies at the end of a period where the allocatory efficiency of markets has been demonstrably refuted8. The stubborness of neo-liberal roll-back dogma was particularly evident in the adjustment programmes required of the CEECs, in conjunction with the World Bank (privatisation, deregulation and market opening) as elements of ‘conditionality’. In relation to the core purpose of this paper, it is also evident in the shambolic failure of the Commission and/or the member states to achieve anything approaching harmonised or coordinated programmes of counter-cyclical tax measures. The survey of Taxation Trends in the European Union (European Commission 2009a) illustrates on the one hand the worrying blindness of a political agency to the pro-cyclical policy which urges budgetary consolidation in an economic downturn; on the other, it cites examples of the disparate (and desperate) attempts of certain member states to fulfil the idiotic logic of a clueless Commission (Estonia, Latvia, Lithuania and, to a degree, Hungary) and the overwhelmingly uncoordinated efforts of the other member states to undertake counter-cyclical policies which include dozens of changes to the administration of taxation (ibid. 13ff; see digest in Appendix to the paper). Reductions in rates of personal income tax (France, Germany, Hungary, Lithuania, Poland) stand opposite planned increases in top rates (UK) or new surtax levies on top incomes (Greece, Ireland) while such surtaxes are abolished elsewhere (Hungary) and planned rate cuts are deferred (Estonia); lower corporation tax rates for all (Lithuania, Sweden) or some businesses (Cyprus, Portugal) contrast with unchanged rates but increased allowances (most countries) or CT surcharges on hydrocarbon-based enterprises (Italy). The (albeit temporary) reduction in the standard rate of VAT in the United Kingdom or of special VAT rates for food (Finland) or restaurants (France, Hungary), hotels (Cyprus), labour-intensive local services (Czech Republic) or housing (Italy, Romania) contrast with the stronger trend towards higher standard rates of VAT (Hungary, Ireland, Latvia, Lithuania,) and higher excise duties (Finland, Latvia, Lithuania, Romania, Slovenia, UK). Some measures stand out, like Spain’s 100% rebate on wealth tax and its ‘free (?) depreciation for companies maintaining employment’ (European Commission 2009a: 19) or Bulgaria’s five-year tax holiday for investment projects. Contradictions in the area of environmental policy are also evident in the latest spate of tax measures: while Germany and the Netherlands have introduced incentives for promoting fuel-efficient cars cars, Romania has reduced its car pollution tax and several tourist-dependent countries have reduced or abolished airport fees (Cyprus, Greece, Malta), encouraging the most polluting form of transportation which already – and scandalously – enjoys fuel tax exemption where less polluting forms are obliged to pay high levels of excise duty. Above all, the Commission’s survey should be a source of embarrassment and shame reflecting not just the absence of any attempt actively to harmonise or coordinate tax policy changes but, above all, the reemergence of intra-EU tax-driven location competition where member states should be seeking to achieve the opposite, that is an end to beggar-thy-neighbour macro-economic policies and the promotion of tax justice throughout Europe. An end to tax havens?
8 Above all, the collapse of the neo-liberal promise of a virtuous circle of higher profits, higher real investments, higher growth and higher employment at an early stage in the 1980s, and the deployment of higher profits and corporate reserves in speculation and merger activity, should give even its staunchest supporters in the European Commission pause for thought, as they survey the wreckage in 2009
13
There were grounds for hope in the autumn of 2008 that major changes would be made to the structure and thrust of global economic governance as a result of the sheer scale of economic calamity and the replacement of George Bush by Barack Obama. This hope was reinforced by the emergence within the WTO of a loosely aligned but determined group of BRIC-states that were subsequently included in the November, March and September summit meetings of the G20. This betokened not just an acknowledgement of the interdependence of the world’s political economy but above all the recognition of an urgent joint responsibility for global crisis management. As a result of the widespread use/ abuse of ‘offshore’ tax jurisdictions by most big finance corporations and the sudden reduction in the revenue flows of all major states, policy-makers also began focussing their attention on the long-ignored problems of tax-avoidance, tax-evasion and ‘tax havens’. They were generally supported by public opinion, as major cases of financial fraud – the scandals involving Madoff and Stamford – revealed the programmatic concealment of financial assets in offshore accounts for the purposes of both tax avoidance and commercial malpractice. Public pronouncements by Obama, Sarkozy, Merkel and other European state leaders suggested a serious intention collectively to crack down on the tax-evasion-centres – wrongly dubbed ‘tax havens’; they were supported in their pronouncements by the major report of the OECD (1998) into ‘harmful tax competition’ and by the long-standing, persistent and consistent work of the Tax Justice Network (2006 & 2008). What has emerged so far from a year of political and public discourse on offshore tax jurisdictions has been very disappointing, if predictable. Neither the March 2009 G20 summit and the September meeting of G20 Finance Ministers produced serious initiatives to combat the flagrant injustice of offshore havens from taxation; in terms of tax progressivity, after all, these havens from tax are the most potent means of undermining the principle of higher relative burdens on those with higher absolute incomes. What has emerged has been a series of accommodations with jurisdictions like Liechtenstein and Jersey which have been bilateral and unilateral rather than multilateral in nature 9 and, predictably, spectacularly unradical in their likely outcomes. To take just two examples, Jersey – in response to criticism by the OECD and the European Commission announced recently that it was removing tax exemption on corporate income, which was deemed unfair by the other parties, and replacing it with a zero rate of corporation tax (Financial Times, September 7 2009) 10 . This political masterstroke might indeed satisfy formalistic observers of statutory codes of tax administration, but it is unlikely to escape the more questioning intellects of primary schoolchildren. The same might apply to the recent bi-lateral deal between the British authorities and Liechtenstein which has resulted in an agreement by Liechtenstein to reveal the names of British account holders in exchange for a fairly benign amnesty which will yield some missing back tax for the British tax authorities but which is not so punitive as to frighten the individuals/ companies away from using the principality’s banking facilities. The UK- Liechtenstein deal constitutes shabby politics, designed not to solve the underlying nonsense of havens from taxation in an interdependent global political economy but to fill a revenue gap for the UK Treasury. And this from a country which provides constitutional protection to major offshore territories, like the Channel Islands, the Cayman Islands and the British Virgin Islands. Given the required unanimity in altering EU monetary and fiscal statutes, the likelihood of removing the corrosive influence of offshore financial centres remains very slim.
9 The OECD (1998: 8) rightly identifies unfair tax competition as a multilateral problem. 10 The OECD Report (1998: 27) cites zero tax rates unsurprisingly as ‘harmful tax competition’
14
Conclusion The EU has thus, by design and by default, manoeuvred itself into a severe structural impasse which will critically hinder attempts to address the more immediate structural crisis of global financial markets and the cyclical crises of trade and growth. There are major structural economic asymmetries of demand within the old EU15: increased disparities of income distribution, associated weaknesses of domestic demand and household debt, weak growth, structural unemployment and large external imbalances. The 2004 and 2007 enlargements have boosted overall demand within the EU27 but have exacerbated the external imbalances and hence the vulnerability of individual member states to imported crises of investment, trade and overcapacity. The structural political asymmetries are more intractable and can be traced back to the paradigm shift to neo-liberalism in the early 1980s, the constitutive reforms of the Single European Act and European Monetary Union and the fatal logic of supply-sidism and monetarism. The triumph of the deflationary imperative and the hegemonic role of the Bundesbank produced a policy architecture which in 2009 still subordinates democratically accountable institutions of fiscal policy to the naïve dogmatism of deflationary austerity dictated by an unanswerable supra-national central bank. This policy architecture – which favoured (German) export-led growth strategies but which compounded domestic demand weaknesses – was ill-suited to the social and economic challenges facing mature capitalist economies, but even less well suited to the medium- and long-term development of the ten new CEE member states. Whichever theory of economic development one deploys to examine the policy failure of the EU in the last thirty years, the case against neo-liberal market radicalism would appear to be overwhelming. Above all, the case for differentiated national strategies of economic modernisation and transformation which shield states from the imperatives of ‘arrived’ mature political economies and associated hegemonic interests is very strong. Ha Joon Chang uses two metaphors to illustrate the hypocrisy of neo-liberal development policy: the ‘Bad Samaritan’ state (Chang 2008) devises schemes of ‘development aid’ which are driven by the self-interest of comparative advantage, and which by ‘kicking away the ladder’ (Chang 2002) deny to emerging economies the mercantilist means which promoted its own development. These metaphors apply as much to arguments illustrating the need for substantial state ratios and transparent and just tax regimes, as they do to illustrate the needs of infant industries and economic infrastructures. The tragedy of Europe’s failure to achieve minimum standards in progressive direct taxation in the process of post-communist transformation is that it will not only hobble the development of the transition states but will rebound to weaken the fiscal integrity of all member states, old and new. Recommendations:
• Restoration of higher marginal rates and steeper curves of progression in personal income tax across the whole of the EU; abolition of flat-rate systems of PIT
• Convergence of top PIT rates and CT rates to avoid income shifting • EU-wide harmonisation of wealth taxation • EU-wide harmonisation of tax base for corporations and non-incorporated
enterprises • EU-wide introduction of aircraft fuel tax; extension of existing carbon taxes • Harmonisation of the ambition to raise national tax ratios
15
• Elimination of offshore low-tax jurisdictions • Multilateral agreements on fair tax governance and progressivity as principles
attaching to political conditionality • Repeal/ reform of the Stability and Growth Pact • Recasting of the policy architecture of European macro-economic management,
rendering the ECB both committed to a broader range of macro-economic objectives, including employment, and to global and regional coordination, and the restoration of democratic answerability to central banking.
Bibliography Arbeitsgruppe Alternative Wirtschaftspolitik (2008) Memorandum 2008, Cologne (Papy
Rossa) Arbeitsgruppe Alternative Wirtschaftspolitik (2009) Memorandum 2009, Cologne (Papy
Rossa) Bessard, Pierre (2009) ‘Tax burden and individual rights in the OECD: an international
comparison’, Institut constant de Rebecque’ Working Paper (June) Black, Dan & William H. Hoyt (1989) ‘Bidding for Firms’, American Economic Review
79, 1249-56 Boss, Alfred (2003) Steuerharmonisierung oder Steuerwettbewerb? Kieler Arbeitspapier
1178 Chang, Ha-Joon (2002) Kicking away the Ladder: Development Strategy in Historical
Perspective, London (Random House) Chang, Ha-Joon (2007) Bad Samaritans. Rich Nations, Poor Policies & the Threat to the
Developing World, London (Random House) Coalition for Tax Competition (2005) ‘Tax Justice Network Sides with Europe’s Tax
Collectors’, press briefing, Alexandria, April 7 Conservative Party (1979) Election Manifesto, London Conservative Party (1987) Election Manifesto, London Eißel, Dieter (1997) ‘Reichtum unter der Steuerschraube? Staatlicher Umgang mit hohen
Einkommen’, in: Huster, E.-U., Reichtum in Deutschland. Die Gewinner der sozialen Polarisierung, Frankfurt am Main (Campus) 127-57
European Commission (2004) Activities of the European Union (EU) in the Tax Field in 2003, Brussels, Doc (2004) 1402
European Commission (2007) Activities of the European Union (EU) in the Tax Field in 2006, Brussels, Taxation and Customs Union DG/ TAXUD/2/2007
European Commission (2009a) Taxation Trends in the European Union, Brussels European Commission (2009b) Economic Forecast. Spring 2009, Brussels Forbes, Steven (2005) Flat Tax Revolution, Washington D.C. (Regnery) Genschel, Philipp, Thomas Rixen & Susanne Uhl (2008) ‘Die Ursachen des europäischen
Steuerwettbewerbs’ George, Susan (2008) Hijacking America Gordon, Roger H. (1992) ‘Can Capital Income Taxes Survive in Open Economies?’, The
Journal of Finance Vol XLVII, No. 3, 1159-80 Gwartney, James & James Long (1998) ‘Is the flat tax a radical idea?’ Hall, Robert E. & Alvin Rabushka (1981a) ‘A Proposal to Simplify Our Tax System’,
The Wall Street Journal, 10. December 1981 Hall, Robert E. & Alvin Rabushka (1981b) The Flat Tax, Stanford (Hoover Press)
16
Hampton, Mary & John Christensen (2004) ‘A Provocative Dependence? The Global Financial System and Small Island Tax Havens’ in: R. Duffy (et al.) Global Governance, Conflict and Resistance, London (Palgrave MacMillan)
Hampton, Mary (1996) The Offshore Interface: Tax Havens in the Global Economy, Basingstoke (Macmillan)
Harman, Christ (1999) A People’s History of the World, London (Verso) Heath, Allister (2006) Flat Tax: Towards a British Model, Stockholm (Stockholm
Network) Hickel, Rudolf (2005) ‘Flat Tax: einfach ungerecht’, Blätter für deutsche und
internationale Politik, October, 1165-7 Hickel, Rudolf (2009) ‘Schwarz-gelber Steuerpopulismus’, Blätter für deutsche und
internationale Politik, August Huffschmid, Jörg (2007) ‘Die neoliberale Deformation Europas’, Blätter für deutsche
und internationale Politik, March Janeba, Eckhard & Guttorm Schjelerup (2002) ‘Why Europe Should Love Tax
Competition – And the U.S. Even More So’, NBER Working Paper No. 9334, November
Janeba, Eckhard (1998) ‘Tax Competition when Governments lack commitment: Excess Capacity as a Countervailing Threat’, Department of Economics, Indiana University. Mimeo
Kaufmann, Hans (2008) ‘Die “Flat-Tax”: die gerechtere Steuer’, Zürich (Liberales Institut, LI-Paper), April
Keen, Michael, Yitae Kim & Ricardo Varsano (2006) ‘The “Flat Tax(es)”: Principles and Evidence’, IMF Working Paper WP06/218
King, Ian & R. Preston McAfee & Linda Welling (1993) ‘Industrial Blackmail: Dynamic Tax Competition and Public Investment’, Canadian Journal of Economics, 26: 590-608
Leube, Kurt R. (2008) ‘Über die Unmoral der Steuerprogression’, Liberales Institut (LI-Paper), April
Matzner, Egon (2000) Monopolar World Order. On the socioeconomics of US dominance, Szombathely (Savaria Books)
McCain, John (2007) Interview with NRO-Online ‘The Full McCain’, available at: http://www.nationalreview.com/
Mill, John Stuart (1970) Principles of Political Economy Books IV & V, London (Penguin) [original edition 1848]
Mooij, Ruud A.. & Gaëtan Nicodème (2008) ‘Corporate Tax Policy and Incorporation in the EU’, CPB Netherlands Bureau for Economic Policy Analysis, The Hague
Murphy, Richard (2006) A Flat Tax for the UK. The implications of Simplification, at: http://www.taxjustice.net/cms/upload/pdf/AACA_flat_tax_report_-_JUN_2006.pdf Oates, Wallace E. (1972) Fiscal Federalism New York (Harcourt Brace) OECD (1998) Harmful Tax Competition. An Emerging Global Issue, Paris OECD (2005), E-Commerce: Transfer Pricing and Business Profits Taxation, OECD Tax
Policy Studies No 10, Paris (OECD) Piotrowska, Joanna & Werner Vanborren (2008) The corporate income tax revenue
paradox: evidence in the EU, European Commission/ Taxation and Customs Union: Working Paper Nr 12 - 2007
Reynolds, Alan (no date) ‘Marginal Tax Rates’, Library of Economics and Liberty, available at: http;//www.econonlib.org
Sen, Amartya (1999) Development as Freedom, Oxford (OUP)
17

18
Smith, Adam (1904) An Enquiry into the Nature and Causes of The Wealth of Nations, Volume II, London (Grant Richards) [original edition 1776]
Sørensen, P.B. (2006) Can capital income taxes survive? And should they?, CESifo Economic Studies, 53/2: 172-228
Stiglitz, Joseph (2002) Globalization and its Discontents, London (Penguin) Swiston, Andrew, Martin Mühleisen & Koshy Mathai (2007) US Revenue Surprises: Are
Happy Days her to Stay?, IMF Working Paper 07/143 Tax Justice Network (2006) Tax Justice Briefing: Tax Competition, London Tax Justice Network (2008) ‘International Tax Co-operation and Competition’, available
at: http://www.taxjustice.net/cms/front_content.php?client=1&lang=1+parent=91 Uhl, Susanne & Thomas Rixen (2007) Unternehmensbesteuerung europäisch gestalten –
mitgliedstaatliche Handlungsspielräume gewinnen, Friedrich Ebert Stiftung, Bonn Weiner, Joann M. & Hugh J. Ault (1998) ‘The OECD’s Report on Harmful Tax
Competition’, National Tax Journal Vol. 51, No. 3 (September) 601-8 Wilkinson, Richard & Kate Pickett (2009) The Spirit Level. Why More Equal Societies
Almost Always Do Better, London (Allen Lane) Wilson, John Douglas (1999) ‘Theories of Tax Competition’, National Tax Journal 52/2,
269-304 Wolf, Martin, Why Globalisation Works, ??? Zodrow, George R. & Peter Mieskowski (1986) ‘Pigou, Tiebout, Property Taxation and
the Underprovision of Local Public Goods’, Journal of Urban Economics 356-70 Zodrow, George R. (2003) ‘Tax Competition and Tax Coordination in the European
Union’, International Tax and Public Finance, 10: 651-71
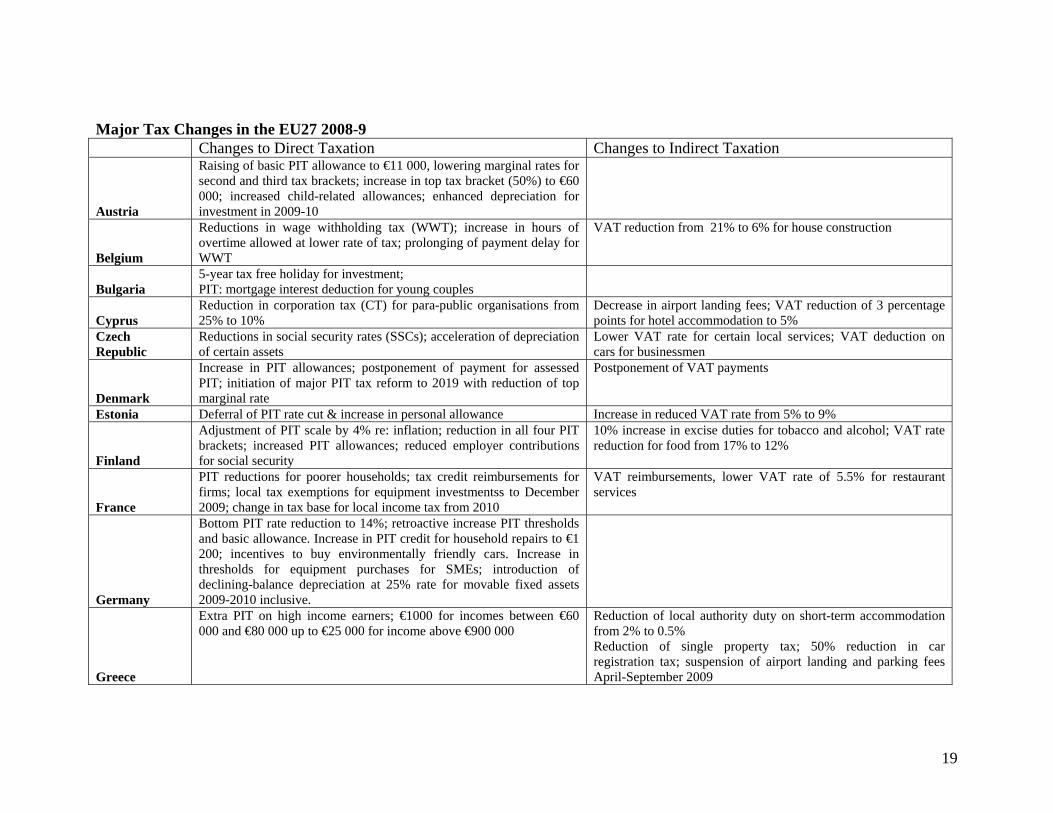
Major Tax Changes in the EU27 2008-9 Changes to Direct Taxation Changes to Indirect Taxation
Austria
Raising of basic PIT allowance to €11 000, lowering marginal rates for second and third tax brackets; increase in top tax bracket (50%) to €60 000; increased child-related allowances; enhanced depreciation for investment in 2009-10
Belgium
Reductions in wage withholding tax (WWT); increase in hours of overtime allowed at lower rate of tax; prolonging of payment delay for WWT
VAT reduction from 21% to 6% for house construction
Bulgaria 5-year tax free holiday for investment; PIT: mortgage interest deduction for young couples
Cyprus Reduction in corporation tax (CT) for para-public organisations from 25% to 10%
Decrease in airport landing fees; VAT reduction of 3 percentage points for hotel accommodation to 5%
Czech Republic
Reductions in social security rates (SSCs); acceleration of depreciation of certain assets
Lower VAT rate for certain local services; VAT deduction on cars for businessmen
Denmark
Increase in PIT allowances; postponement of payment for assessed PIT; initiation of major PIT tax reform to 2019 with reduction of top marginal rate
Postponement of VAT payments
Estonia Deferral of PIT rate cut & increase in personal allowance Increase in reduced VAT rate from 5% to 9%
Finland
Adjustment of PIT scale by 4% re: inflation; reduction in all four PIT brackets; increased PIT allowances; reduced employer contributions for social security
10% increase in excise duties for tobacco and alcohol; VAT rate reduction for food from 17% to 12%
France
PIT reductions for poorer households; tax credit reimbursements for firms; local tax exemptions for equipment investmentss to December 2009; change in tax base for local income tax from 2010
VAT reimbursements, lower VAT rate of 5.5% for restaurant services
Germany
Bottom PIT rate reduction to 14%; retroactive increase PIT thresholds and basic allowance. Increase in PIT credit for household repairs to €1 200; incentives to buy environmentally friendly cars. Increase in thresholds for equipment purchases for SMEs; introduction of declining-balance depreciation at 25% rate for movable fixed assets 2009-2010 inclusive.
Greece
Extra PIT on high income earners; €1000 for incomes between €60 000 and €80 000 up to €25 000 for income above €900 000
Reduction of local authority duty on short-term accommodation from 2% to 0.5% Reduction of single property tax; 50% reduction in car registration tax; suspension of airport landing and parking fees April-September 2009
19
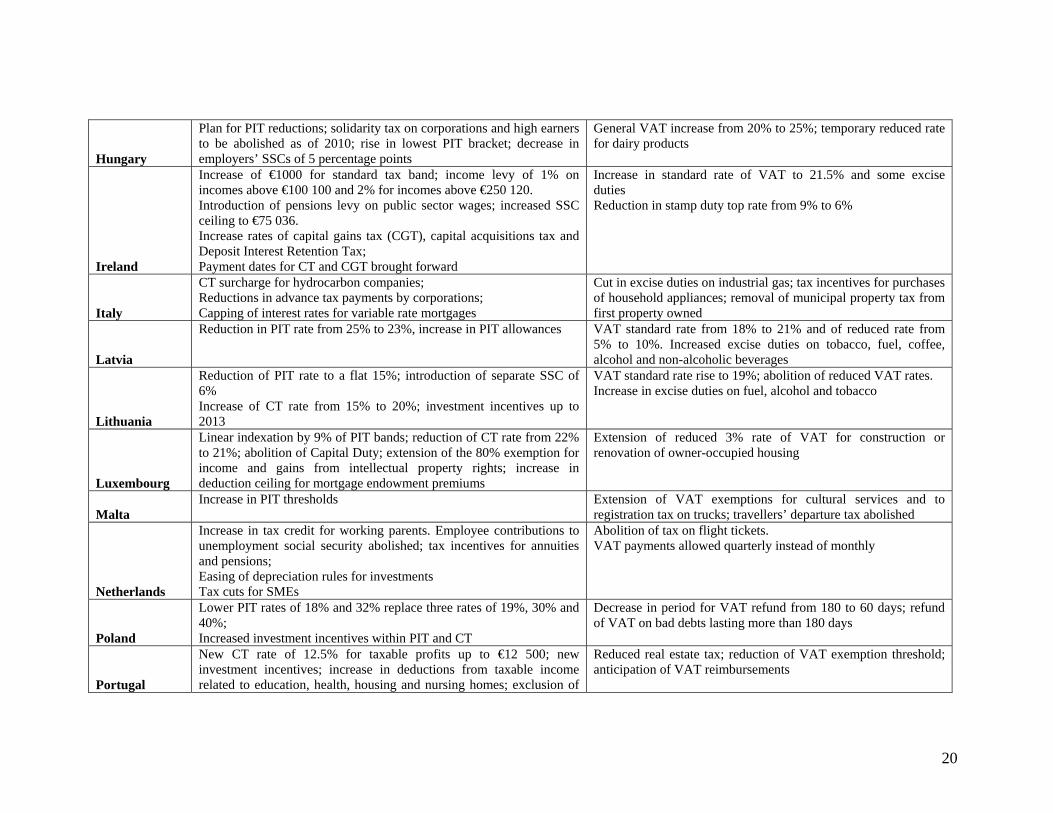
Hungary
Plan for PIT reductions; solidarity tax on corporations and high earners to be abolished as of 2010; rise in lowest PIT bracket; decrease in employers’ SSCs of 5 percentage points
General VAT increase from 20% to 25%; temporary reduced rate for dairy products
Ireland
Increase of €1000 for standard tax band; income levy of 1% on incomes above €100 100 and 2% for incomes above €250 120. Introduction of pensions levy on public sector wages; increased SSC ceiling to €75 036. Increase rates of capital gains tax (CGT), capital acquisitions tax and Deposit Interest Retention Tax; Payment dates for CT and CGT brought forward
Increase in standard rate of VAT to 21.5% and some excise duties Reduction in stamp duty top rate from 9% to 6%
Italy
CT surcharge for hydrocarbon companies; Reductions in advance tax payments by corporations; Capping of interest rates for variable rate mortgages
Cut in excise duties on industrial gas; tax incentives for purchases of household appliances; removal of municipal property tax from first property owned
Latvia
Reduction in PIT rate from 25% to 23%, increase in PIT allowances VAT standard rate from 18% to 21% and of reduced rate from 5% to 10%. Increased excise duties on tobacco, fuel, coffee, alcohol and non-alcoholic beverages
Lithuania
Reduction of PIT rate to a flat 15%; introduction of separate SSC of 6% Increase of CT rate from 15% to 20%; investment incentives up to 2013
VAT standard rate rise to 19%; abolition of reduced VAT rates. Increase in excise duties on fuel, alcohol and tobacco
Luxembourg
Linear indexation by 9% of PIT bands; reduction of CT rate from 22% to 21%; abolition of Capital Duty; extension of the 80% exemption for income and gains from intellectual property rights; increase in deduction ceiling for mortgage endowment premiums
Extension of reduced 3% rate of VAT for construction or renovation of owner-occupied housing
Malta Increase in PIT thresholds Extension of VAT exemptions for cultural services and to
registration tax on trucks; travellers’ departure tax abolished
Netherlands
Increase in tax credit for working parents. Employee contributions to unemployment social security abolished; tax incentives for annuities and pensions; Easing of depreciation rules for investments Tax cuts for SMEs
Abolition of tax on flight tickets. VAT payments allowed quarterly instead of monthly
Poland
Lower PIT rates of 18% and 32% replace three rates of 19%, 30% and 40%; Increased investment incentives within PIT and CT
Decrease in period for VAT refund from 180 to 60 days; refund of VAT on bad debts lasting more than 180 days
Portugal
New CT rate of 12.5% for taxable profits up to €12 500; new investment incentives; increase in deductions from taxable income related to education, health, housing and nursing homes; exclusion of
Reduced real estate tax; reduction of VAT exemption threshold; anticipation of VAT reimbursements
20
commuting expenses from taxable income; increase in personal allowance for disabled taxpayers
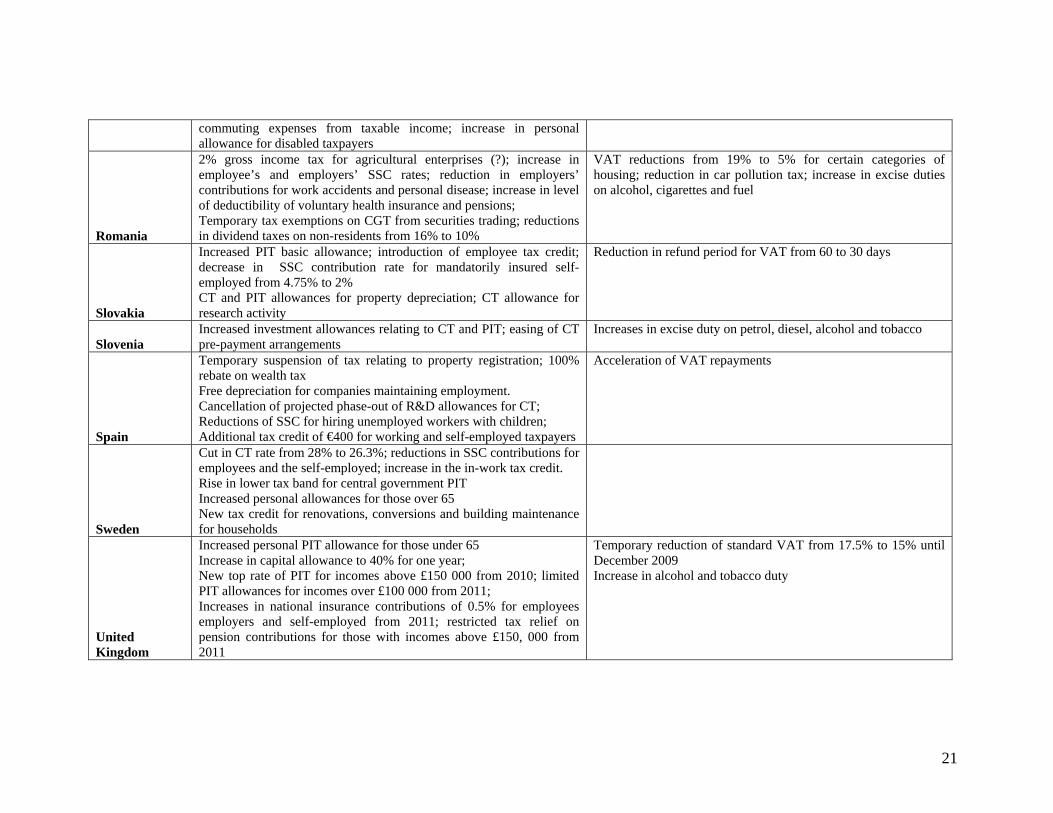
Romania
2% gross income tax for agricultural enterprises (?); increase in employee’s and employers’ SSC rates; reduction in employers’ contributions for work accidents and personal disease; increase in level of deductibility of voluntary health insurance and pensions; Temporary tax exemptions on CGT from securities trading; reductions in dividend taxes on non-residents from 16% to 10%
VAT reductions from 19% to 5% for certain categories of housing; reduction in car pollution tax; increase in excise duties on alcohol, cigarettes and fuel
Slovakia
Increased PIT basic allowance; introduction of employee tax credit; decrease in SSC contribution rate for mandatorily insured self-employed from 4.75% to 2% CT and PIT allowances for property depreciation; CT allowance for research activity
Reduction in refund period for VAT from 60 to 30 days
Slovenia Increased investment allowances relating to CT and PIT; easing of CT pre-payment arrangements
Increases in excise duty on petrol, diesel, alcohol and tobacco
Spain
Temporary suspension of tax relating to property registration; 100% rebate on wealth tax Free depreciation for companies maintaining employment. Cancellation of projected phase-out of R&D allowances for CT; Reductions of SSC for hiring unemployed workers with children; Additional tax credit of €400 for working and self-employed taxpayers
Acceleration of VAT repayments
Sweden
Cut in CT rate from 28% to 26.3%; reductions in SSC contributions for employees and the self-employed; increase in the in-work tax credit. Rise in lower tax band for central government PIT Increased personal allowances for those over 65 New tax credit for renovations, conversions and building maintenance for households
United Kingdom
Increased personal PIT allowance for those under 65 Increase in capital allowance to 40% for one year; New top rate of PIT for incomes above £150 000 from 2010; limited PIT allowances for incomes over £100 000 from 2011; Increases in national insurance contributions of 0.5% for employees employers and self-employed from 2011; restricted tax relief on pension contributions for those with incomes above £150, 000 from 2011
Temporary reduction of standard VAT from 17.5% to 15% until December 2009 Increase in alcohol and tobacco duty
21