Embed Size (px)
Citation preview
What is Your Software Worth?Gio Wiederhold Stanford University20 July 2005
AbstractThis article presents a method for valuing software, based on the income that use of that software is expected to generate in the future. It applies well known principles of intellectual property (IP) valuation, sales expectations, discounting to present value, and the like, always focusing on the specific issues that arise when the benefits of software are to be analyzed. An issue, not dealt with in the literature of valuing intangibles, is that software is continually being upgraded. Applying simple depreciation schedules is the common solution, but does not represent at all the actual devaluation of the inherent IP. An alternate approach, focusing on ongoing maintenance, is presented here. All steps of the process are presented and then integrated via a simple quantitative example. Having a quantitative model on a spreadsheet allows exploration of alternatives. As an example we evaluate a service business model alternative. Some conclusions are drawn that reflect on academic and business practice.
1. Introduction.There exists a voluminous literature on estimation of the cost of producing software, but that literature largely ignores the benefits of using that software [Boehm:81, 00]. Even engineering management approaches termed `Earned Value Management' only deal with expenses within a development schedule [Abba:97]. While we, as software creators, believe that what we produce is valuable, we are rarely called upon to quantify its benefits [GarmusH:01]. One reason may be that much investment in software engineering has been motivated by military and governmental applications, where benefits are hard to quantify. A notable exception is a recent paper on measuring the value of IT Assets [TillquistR:05]. When benefits of software in commerce must be quantified, it is typically left to lawyers, economists, software vendors, or promoters to assign value to our products [Stobbs:00] [SmithP:00] [Lipschutz:04] [Bonasio:02]. The results are often inconsistent [Lev:01].
1.1 Why should software creators care?In many other fields the creators have a substantial awareness of the value of their
products. Architects are aware of the market for houses they design, a potter will know the price for the dishes to be sold, as will a builder of bicycles. But software is easy to replicate at a negligible cost. That does not mean that those copies have no value. Potential sales volume is the other factor required in estimating future income and hence value. Predicting the quantity of sales is hard, and expert help is often required. An author of a book can obtains guidance from a publisher. Once the book is on the market, the interested author is able to track what the total income is.
1
The value of a book, and of software, is essentially independent of the cost and effort spent to create it. A few brilliant lines of prose or code can have a very high value, whereas a million lines of code that generate a report that nobody reads have little value. If creators are aware of the potential value of the product they will be better prepared to make decisions on the product design and the effort to be spent. The motivation leading to the generation of this article is to increase the awareness of members in the computing community how the result of their work may be valued. That should, in turn, affect how software engineering is practiced.
1.2 ProtectionThere is substantial literature on the protection of the intellectual property value inherent in software. A dozen years ago an NRC study focused on copyright- and patent-based protection [BranscombEa:91]. Frank Ingari of Lotus complained in that report, that without understanding what is to be protected the focus on methods for protecting IP addressed a second-order question. Yet, copyright protection issues are still discussed widely today. In practice, copyright and patents afford only limited protection, since the methods to protect software are threatened in modern systems with rapid and anonymous communication. But the value lost by copying remains hard to ascertain, making it hard to achieve a balance [Gates:04]. Having a good product easily and early available for a reasonable price is the best strategy.
1.3 OutlineIn the remainder of this article I will first present the principles of valuing intellectual property, with a narrow focus on the income generated by a software product over its lifetime. The valuation itself addresses software as it exists at some point in time, and ignores the costs of its creation. Once the value of the product is known or estimated, one can compare that value with the cost of its creation and decide if the project is profitable, or, if it seems not to be, what must be changed to make it so.
Software, since it grows over time, presents novel issues, not seen in other intangibles, as music and books. Maintenance to sustain software effectiveness occurs throughout the time that the software is in use, i.e., while the software actually generates benefits. Over time maintenance costs typically exceed the original software development cost, often by factors of 3 to 10. Maintenance causes growth of software, and Section 3 will show how three types of maintenance efforts together affect growth and value. In Section 4 the growth of software will be modeled, using some rules-of-thumb, i.e., rules derived from experience. In order to quantify values we need some metrics. All of software engineering suffers from inadequate metrics, and valuation is no exception.
In Section 5 we predict sales volumes for sold software. Fairly standard business methods are used, selected for their suitability for analyzing software sales. Finally, in Section 6 we combine results from the prior chapters to arrive at the actual assessment of the value of software. A sample computation integrates the various topics. To illustrate the use of a quantitative model for analyzing alternatives, we show a model where maintenance income is included, representing a service-oriented business model. The conclusion provides some advice, for individuals, managers, and even educators.
This article brings together information from domains that rarely interact directly: software engineering, economics, business practice, and legal sources. I quote a number
2
of rules of thumb, and set them off. The references include some citations for each of the contributing domains, but those cannot begin to cover more than top-level concepts. There are hence relatively many references to books, and just some citations of recent topical articles, although many articles have helped to provide the insights presented here.
2. Principles of IP ValuationAssigning value to intangible property is assuming greater and greater importance, as our society moves from dependence on hard, tangible goods to a world where knowledge and talent creates the intangible goods we desire and need. In the tangible world goods are produced by a combination of labor, capital, machines, and management, but the quality of the human components plays a minor role in valuing a company. Even today, the book value of a company shown in its annual report is merely the sum of the value of its facilities, inventory, equipment, and finances. This sum has little to do with how investors value companies in the software domain [Rechtman:01]. For example, we can look at SAP's Annual Report for 2003 and learn that its book value (assets - money owed) was about €6.3B. But using the market price of the shares (about €100) and the number of shares in circulation, about 315M, we find that SAPs shareholders valued the company at €31.5B. The investors in SAP base the market value on the income they expect to obtain over time from their shares [Becker:02]. The difference, €25.2B, is due to the intangible property owned by SAP and its shareholders. No routine annual report breaks down that intangible value to the same detail that the book value is documented.
The intangible property owned by SAP, or any company in the knowledge-based domain, includes the technical knowledge of its staff, the competence and insights of its sales force, the business knowledge of its management, the worth of its trademark, its reputation, and the value of its software inventory. Sometimes intangible assets are thrown into a basket named `goodwill', but such a leaky container ignores the variety and importance of the intangible components.
The reputation of a software company can be increased by advertising and the value of its software can grow by spending on research and development. These two components are the considered intellectual property (IP) of a business, since the workforce of a company cannot be considered to be property. Open-source software is also excluded. Valuation of IP is required when software product lines are purchased or transferred. When entire companies change hands, then the workforce can be assigned a value as well. Many approaches for IP valuation compete [Damodaran:2002]. Although software is the most tangible of the intangibles owned by businesses, its valuation is still poorly understood, leading to a gamut of problems [Lev:01].
2.1 The value of software IPInvestors in a software enterprise assert through their stock purchases that
IP rule: The value of the Intellectual Property is the income it generates over time
That simple rule is the basis for any IP valuation. Estimating that future income, and reducing it to a single current value is the task to be undertaken [SmithP:00].
This article focuses only on software, likely the largest component of IP owned by companies in the field of computing. Ownership of software is not limited to companies that produce software as a product. The majority of modern businesses own and benefit
3
from software. Banks could not exist without software; there is no other way to determine what is due to a customer or what the customer owes. Manufacturers cannot live without software: the designing process, obtaining and allocating resources, managing the workflow, and shipping the goods out all depend on software -- and those that exploit software better will be more profitable. I am certain you can create a similar scenario for your own industry.
2.2 Estimating incomeTo value the IP inherent in software, one must estimate how much income the
software will bring in during its future life, which in turn requires estimating its life. We distinguish now software producers and software users.
If the software produced is sold to others, then the expected income depends on the sales revenue, the product of the amount of software sales and its price. We assess the software from the viewpoint of the seller. When a new version of a software product has been prepared and is ready for sale, sales of the prior version will rapidly diminish. Since the cost of copying and packaging software are very low, there is no benefit in continuing to sell the old software, a characteristic particular to intangible property. Furthermore, the new version is substantially better than the prior version. Software is different: while last year's model car can be profitably sold for, say 80% of its new price, forgoing the advantages of a new model of software at the same cost makes no sense for the seller, nor for the purchaser. Sometimes an old version of software has to be supported to keep some existing customer who cannot or will not update, but that support creates a loss for the seller and being out-of-sync creates inefficiencies for the customer. Since a new version of the software product includes much of the code and all of the functionality of the prior version, IP from the prior version continues to live in that new version. Disasters have occurred when new versions did not replicate all prior functionalities [Splosky:04]. Fundamental parts of software can easily live 10-15 years and hence continue to contribute to the generation of revenue. We will deal with that aspect in Section 5.
In companies that use software, the valuation must be based in its contribution to the income of the company. In early days, one could compare a company's operation prior to using software and subsequent to installation, and assess the benefits of software based on the difference [Batelle:73]. The value would be based on an increase in productivity, that is how many goods were now produced and how much the costs were now. That difference, including the cost of the software, provided a measure of income attributable to software for that year. Future years would bring in similar or higher benefits, as the organizations adjusted to new tasks and workflow. The life and the ongoing cost of maintaining the software still has to be estimated, and we'll do that in Section 5 as well.
Today it is rare that a broad set of new software applications will be installed within an ongoing company. More commonly, upgraded versions of existing software will be obtained, or some poorly served aspect of the company will be automated. At times a major subsystem will be replaced. Major replacements will be less frequent after the Y2K bulge, when fear of serious operational problems motivated much scrapping of obsolete software. Comparing a business that has adopted a significant improvement, say on-line ordering, to a similar business that has not yet converted can provide input to
4
assess the benefits that are due to the additional software. However finding comparables is hard, and invariably adjustments will be needed before incomes can be compared.
In large integrated companies it becomes impossible to relate income directly to software applications. Many resources are employed to generate income. In addition to routine operational efforts there are `Intellectual property Generating Expenses' (IGEs), such as software development and maintenance, but also advertising for new products and corporate recognition, investments in quality control, and the like. An approach that remains is based on a belief that the management of a company is rational in the allocation of its resources [Samuelson:83].
Pareto Rule: Each investment dollar spent should generate the same benefit
This rule is based on an assumption of optimal spending and convex cost/benefit curves. It allows allocating income created by diverse IGE's to be allocated according to the proportion of costs incurred.
Under Pareto conditions spending $100 000 on personnel should deliver the same growth in net income (sales revenue - cost of sales) as spending $100 000 on software. We can then allocate a fraction of the company's net income to software that is proportionate to the fraction of all the IGEs. There will be variation in that fraction from year to year, but over the life of long-lived software such variations even out. If a company behaves very irrationally in its IGE spending, more so than its peers, it is bound to have lower net profits, and its IP and its stockholders will suffer as a result.
We noted earlier that income-based measures don't work in governmental and military settings. In those organizations measures of productivity and the extent of cost-avoidance have to be combined to produce a surrogate for income. Comparisons of manpower employed without and with software for affected tasks provides the most valid alternative. In the military however, there is also much high-cost equipment, which, in turn depends on software. In those settings, and in other non-profit institutions, as academia, the assumption of rational behavior which was used for relative allocation is even more questionable. Valuations of the effect of software will hence be quite inexact, and mainly of comparative use.
2.3 Revenue and gross profitIn business financial reporting the revenue realized is immediately reduced by the cost of the goods sold. Here is where software and much other intellectual property differ from tangible products. The effort to make the first unit of a product is a major cost in both cases, but tangible goods incur a manufacturing cost for each successive unit, while for software and many other intangibles the manufacturing cost is negligible. If software distribution is over the Internet, there are no direct incremental costs for each sale. Revenue and gross profit, the revenue after the cost-of-goods sold, become similar, and common financial indicators, as gross margin (gross profit/revenue) became close to one and essentially meaningless.
If we were to amortize initial research and development costs over each unit of product and include them in the cost-of-goods sold, then those margins could become more meaningful. However, without predicting future sales initial costs cannot be allocated to units of products. In IP assessments those prior costs are ignored. Once the
5
value of the software beyond today has been determined, then one can decide if those investments were worthwhile.
Since we only assess here the value of existing software, we ignore its initial research and development cost. We also ignore its negligible manufacturing cost. Now the income per unit is equal to the revenue, i.e., the price it fetches and the sales volume. However, there will be ongoing costs to keep the software viable for sales. The next section addresses the issues that occur because software is so slithery. Software keeps changing while one tries to understand and measure it. If software were stable, it would act like a tangible product with low manufacturing cost: "Hardware is petrified software" [Cheriton:99].
3. Sustaining Software Before we can proceed moving from the income generated by software to valuation of its IP, we must consider what happens to software over the time that it generates income. It is here where software differs crucially from other intangible goods. Books and music recordings remain invariant during their life, but little software beyond mathematical libraries is stable.
Methods used to depreciate tangibles as well as intangibles over fixed lifetimes are based on the assumption that the goods being valued lose value over time. Such depreciation schedules are based on wear, or the loss of value due to obsolescence, or changes in customer preferences. However, well-maintained software, in active use, does not wear out, and is likely to gain value [Spolsky:04].
All substantial business software must be sustained through ongoing maintenance to remain functional. What maintenance provides was stated many years ago by Barry Boehm [Boehm:81, p.533]:
".. The majority of software costs are incurred during the period after the developed software is accepted. These costs are primarily due to software maintenance, which here refers both to the activities to preserve the software's existing functionality and performance, and activities to increase its functionality and improve its performance throughout the life-cycle"
Ongoing maintenance generates IP beyond the initial IP, and its cost will have to be deducted in the valuation. In order to be able to quantify that deduction we summarize a prior business analysis [Wiederhold:03]. In Section 5.5 we consider an alternative without deducting the effects of maintenance, which then must consider the cost of maintenance.
Successful software products have many versions, long lifetimes, and corresponding high maintenance cost ratios over their lifetime. Software lifetimes before complete product (not version) replacement is needed are 10 to 15 years, and are likely to increase [SmithP:00] [Wiederhold:95]. Version frequency is determined by the rate of changes needed and the tolerance of users to dealing with upgrades. In our example we will assume a steady rate of 18 months, although when software is new versions may be issued more frequently, while the rate reduces later in its life.
Maintenance costs of such enterprise software amount to 60 to 90% of total costs [Pigoski:97]. Military software is at the low end of the maintenance cost range, but that may be because its users can't complain much, and most of the feedback they generate is
6
ignored. The effect is that military software is poorly maintained, and requires periodic wholesale replacement [Hendler:02].
3.1 Continuing improvementWe use well-established definitions for the three classes of long-term maintenance [Marciniak:94]. Other, more detailed lists of maintenance tasks have been provided [Jones:98], but those tasks can be grouped into the three categories below, which distinguish the tasks by motivation, timing and feedback mechanisms [IEEE:98]. Feedback issues, crucial to IP generation, are detailed in Section 3.2
1. Bug fixing or corrective maintenance is essential to keep customers. In practice, most bug fixing is performed early in the post-delivery cycle – if it is not successfully performed, the product will not be accepted in the market place and hence not have any significant life. There is substantial literature on the benefits of having high quality software to enable reuse, a form of long life, but those analyses document again cost avoidance rather than income [Lim:83].
2. Adaptive maintenance is needed to satisfy externally mandated constraints. Such changes allow the software to deal with new hardware, operating systems, network, and browser updates that are used in the customers’ environment. Governmental regulations may also require adaptations, new taxation rules affect financial programs, accounting standards are upgraded periodically, etc. All such changes must be complied with if the software is to remain useful. Within a business new mergers and acquisitions force changes in information systems [Pfleeger:01], and new medical technologies affect health care software [BondS:01].
3. Perfective maintenance includes performance upgrades, assuring scalability as demands grow, keeping interfaces smooth and consistent with industry developments, and being able to fully exploit features of interoperating software by other vendors, as databases, webservices, schedulers, and the like. Perfecting makes existing software work better. In that process the functionality is upgraded, but not to the extent that truly new products are created. Perfection may be less urgent, but keeps the customer happy and loyal [Basili:90]. Military software, rarely perfected, wastes much user effort, and hence rates low on a benefit/cost scale [Hendler:02].
Bug fixing, for software that is accepted in the market, eventually reduces to less than 10% of the maintenance effort [LientzS:80]. Adaptation consumes 15% to 40% of the maintenance costs. The effort needed varies with the number of interfaces that have to be maintained. Ongoing perfection is known to require 45% to 55% of maintenance costs over the long term. Marketing staff often touts the results of perfective maintenance as being novel and innovative, even when base functionality does not change.
The effectiveness of maintenance is greatly reduced by poor design and lack of adequate documentation [BeladyL:72]. Well designed systems will be improved more rapidly, and hence, paradoxically, consume more maintenance [Glass:03]. But those systems will also have a longer life. Figure 1 provides a simple depiction of the relative effort distribution
7
over time, in practice the ratios will differ depending on the setting and on external events.
Figure 1: Maintenance Effort over the Lifetime of software
There are two aspects that motivate a supplier to provide a high level of maintenance: one is to keep the customer -- it is easier to keep an old customer than to gain a new one -- and the other is income -- good maintenance has a high value to the customer and can generate substantial and stable income [Wiederhold:03]. Maintenance fees contribute in time as much revenue as new sale licenses. Gaining income is related to gaining IP.
3.2 Sources of IP in the Maintenance PhaseMaintenance is often viewed as work requiring little expertise. That view is only true to the extent that the information sources for maintenance are diverse.
Corrective maintenance is based on a feedback from the users and customers. A specialized team at the supplier will log error reports, filter stupidities, eliminate misunderstandings, combine faults that seem to be identical, devise workarounds if feasible, advise the users, and forward any remaining significant problems to the engineering staff. If the original developers are still involved, fixing bugs becomes an opportunity to learn, rather than a task to be dreaded. Corrections are often needed when special cases or novel combinations are identified. Code to deal with those cases is added, and so the software grows.
Adaptive maintenance is required to sustain supplied software so it keeps up with external changes of its settings. Input for required adaptations comes from standards bodies, from hardware vendors, from software vendors who make products that interface with the software, and from government sources. Major suppliers have representatives at many external organizations and vendors. Filtering and scheduling this work requires a high level of skill. It is rare that prior interfaces and capabilities are removed, the software grows.
Perfecting is also an ongoing process. Any attempt to write perfect software will induce excessive delays. Perfection in software is a process, not its result. Perfecting does not require novel insights, just an ability to listen and act. Postdelivery reviews are
8
acknowledged to be important, although frequently omitted [Glass:03]. There is no science that assures that interfaces with human users will be attractive; there is more variety of customers in the global market than any specification can encompass;, and there will always be new uses for software that with some changes can be catered to. All perfecting changes will be based on feedback from ongoing use, but should not disturb current users [Aron:83]. Code that considers the expectations of the users will be larger than code is organized for the convenience of the programmer. The process of perfecting software is a major component of growth.
4. Growth of SoftwareSince software IP is embedded in the code being used, and that body of code changes over time, we must now evaluate what happens to the code and its functionality.
4.1 MetricsTwo metrics are in use for estimating code size and effort: Lines-of-code (LoC) and Function Points. Both have problems, but they also complement each other.
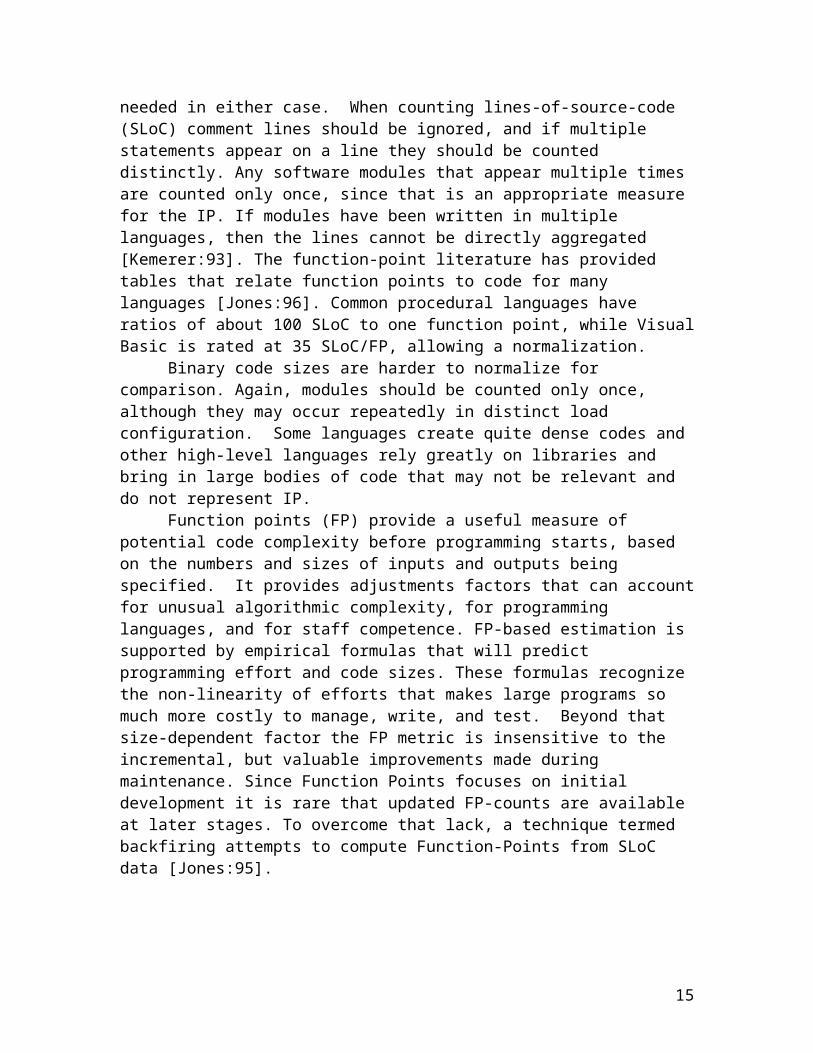
The size of programs tends to be easy to measure once the software is completed. One can look at lines-of-source-code or the volume of binary code. Some adjustments are needed in either case. When counting lines-of-source-code (SLoC) comment lines should be ignored, and if multiple statements appear on a line they should be counted distinctly. Any software modules that appear multiple times are counted only once, since that is an appropriate measure for the IP. If modules have been written in multiple languages, then the lines cannot be directly aggregated [Kemerer:93]. The function-point literature has provided tables that relate function points to code for many languages [Jones:96]. Common procedural languages have ratios of about 100 SLoC to one function point, while Visual Basic is rated at 35 SLoC/FP, allowing a normalization.
Binary code sizes are harder to normalize for comparison. Again, modules should be counted only once, although they may occur repeatedly in distinct load configuration. Some languages create quite dense codes and other high-level languages rely greatly on libraries and bring in large bodies of code that may not be relevant and do not represent IP.
Function points (FP) provide a useful measure of potential code complexity before programming starts, based on the numbers and sizes of inputs and outputs being specified. It provides adjustments factors that can account for unusual algorithmic complexity, for programming languages, and for staff competence. FP-based estimation is supported by empirical formulas that will predict programming effort and code sizes. These formulas recognize the non-linearity of efforts that makes large programs so much more costly to manage, write, and test. Beyond that size-dependent factor the FP metric is insensitive to the incremental, but valuable improvements made during maintenance. Since Function Points focuses on initial development it is rare that updated FP-counts are available at later stages. To overcome that lack, a technique termed backfiring attempts to compute Function-Points from SLoC data [Jones:95].
4.2 Relative Value of Old and New Code We measure code sizes to allocate its relative contribution to IP. The assumption, namely that the value of a unit of the remaining code is just as valuable as a unit of new code,
9
simplifies the IP analysis in the next section. Even though this metric is indirect, it serves the purpose here, namely to have a surrogate to track IP growth over time.
There are valid arguments that code size is not a surrogate for the IP contents. One argument is that later code, being more recent, represents more recent innovation, and hence should be valued higher. An argument in the opposite direction that the basic functionality is represented by the initial code. There may have been those few lines of brilliant initial code, slowly buried in a mass of subsequent system interfaces and later tweaks and fixes.
We find indeed that much code is inserted later to deal with error conditions that were not foreseen originally. Code that was added during maintenance has its value mainly in terms of providing smooth operation and a high degree of reliability. The original code provided the functionality that motivated the customer's acquisition in the first place. If that functionality would have been inadequate the customer would not move to any subsequent version. However, new code will include adaptations and perfections that motivate additional sales.
Given that the positives and negatives can balance each other out, it is reasonable to assign the same value to lines of old and of new code. We feel comfortable using code size as surrogate for the IP in a piece of software. As long as the methods to obtain metrics are used consistently and without bias, the numbers obtained will be adequate for the inherently difficult objective of valuing software.
4.3 Growth of codeThe maintenance activities that sustain software cause the software to grow in size, as presented in Section 3. Hennessy and Patterson have presented a rule [HennessyP:90]:
HP rule 5: Software, in terms of lines-of-code, grows by a factor 1.5 to 2 every year.
However, this rule implies exponential growth, expected for hardware, but such growth cannot actually be sustained in software development. Phil Bernstein of Microsoft has suggested that
PB rule: A new version of a software product should contain less than 30% new code.
A larger growth creates too many problems and will not allow the newly released version to be reliable [Bernstein:03]. The existence of a limit is clear from Fred Brook's essays: since programming and programming management effort grows exponentially with size, an exponential growth of software cannot be supported in practice by reasonable growth programming staff [Brooks:95]. Cost estimation tables further support such barriers [Jones:98]. A rule suggested to us which defined more modest growth could be validated in related analyses [Roux:97]:
DR rule: Software grows at each version equal to the size of the first working release.
A similar behavior was observed for operating system modules, as well as its effect on maintenance costs [BeladyL:72]. In embedded systems, where typically severe memory constraints remain, that rule cannot be applied.
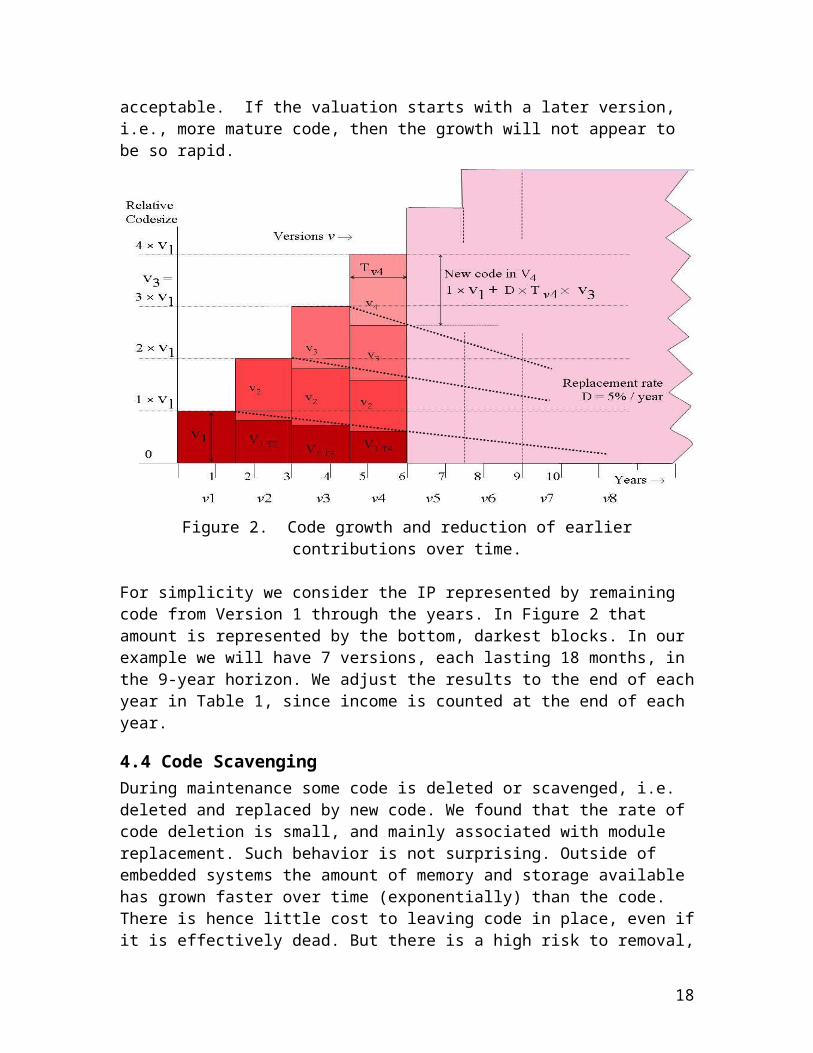
If we call the first working software Version 1 -- not always done in practice -- the DR rule means that the expected growth is 100% from Version 1 to Version 2, 50% from Version 2 to Version 3, 33% for Version 3 to Version 4, etc. as shown in Figure 2. The
10
amount of new code due to growth is 50% in Version 2, 33% in Version 3, 25% in Version 4. By that version software growth obeys Bernstein's limit. In the early phases of a product a higher rate of growth is certainly possible; all the original developers are likely to be still on board, there is good understanding of the code, and feedback from the field can be rapidly accommodated, so exceeding the PB rule limit initially seems acceptable. If the valuation starts with a later version, i.e., more mature code, then the growth will not appear to be so rapid.
Figure 2. Code growth and reduction of earlier contributions over time.
For simplicity we consider the IP represented by remaining code from Version 1 through the years. In Figure 2 that amount is represented by the bottom, darkest blocks. In our example we will have 7 versions, each lasting 18 months, in the 9-year horizon. We adjust the results to the end of each year in Table 1, since income is counted at the end of each year.
4.4 Code ScavengingDuring maintenance some code is deleted or scavenged, i.e. deleted and replaced by new code. We found that the rate of code deletion is small, and mainly associated with module replacement. Such behavior is not surprising. Outside of embedded systems the amount of memory and storage available has grown faster over time (exponentially) than the code. There is hence little cost to leaving code in place, even if it is effectively dead. But there is a high risk to removal, since some user's program may still depend on undocumented features that depend on that code. Removing code takes more time than writing new code. From code inspection we see about 5% code removal per year, going up to 10% for code that is aggressively maintained.
GW rule: Without incentives, 5% of the code per year is replaced during maintenance.
11
The limit of removal of code for a new version appears to be 20% to 25%, beyond that it is better to rewrite the code [Glass:03]. However rewriting the code entails severe risks of creating incompatibilities for existing customers.
Since the estimate for the total code size in successive versions is independent of the rate of deletion we consider that the deleted amount will also be replaced by new code. Since the code base grows, more code in absolute terms is replaced annually as time goes on.
For simplicity we also assume that code replacement fractions are equal for old code and for later code that has been added during maintenance. We can now combine the effect of code growth and code scavenging. If new version of the software appear every 18 months, then the amount of new code in Version 2 becomes about 53%, in Version 3 it's 71%, and in Version 4 it's 79%. The influence of the original code and its IP diminishes steadily. Growth also means that maintenance costs grow, but we consider all new IP to be represented by new code, and focus now only on IP retention represented by old code.
5. Devaluation of Software IPTo relate code sizes to IP value we use the earlier observation that the price of the software remains constant, although the code representing that software has grown steadily. We can then allocate that income over time.
5.1 Income from a Software product over timeAlthough the body of code grows and grows over time, the price of a unit of software sold tends to stay quite stable, typically increasing less than the rate of inflation. There are several reasons here. From the customer's point of view a new version does not add functionality, it only provides the scope, reliability, and ease of use that should have been available in the first place. A seller who raises prices for software that is now in the public view and functionally well understood provides an incentive for imitators. A low price for a comprehensive and reliable product discourages competition.
P: The price of software for the same functionality is constant, even if it is improved.
We consider two classes of software below, enterprise software, such as databases and application tools built on top of them, and shrink-wrapped software. For software developed in-house it is harder to discern clear strategies.
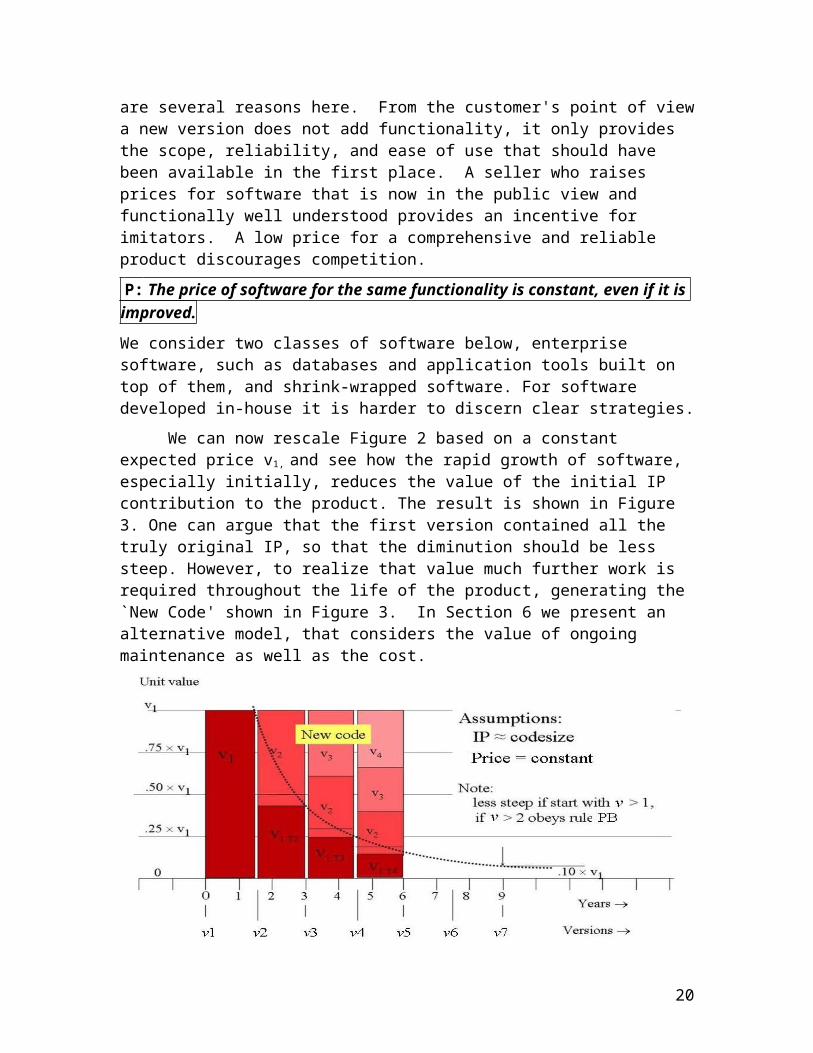
We can now rescale Figure 2 based on a constant expected price v1, and see how the rapid growth of software, especially initially, reduces the value of the initial IP contribution to the product. The result is shown in Figure 3. One can argue that the first version contained all the truly original IP, so that the diminution should be less steep. However, to realize that value much further work is required throughout the life of the product, generating the `New Code' shown in Figure 3. In Section 6 we present an alternative model, that considers the value of ongoing maintenance as well as the cost.
12
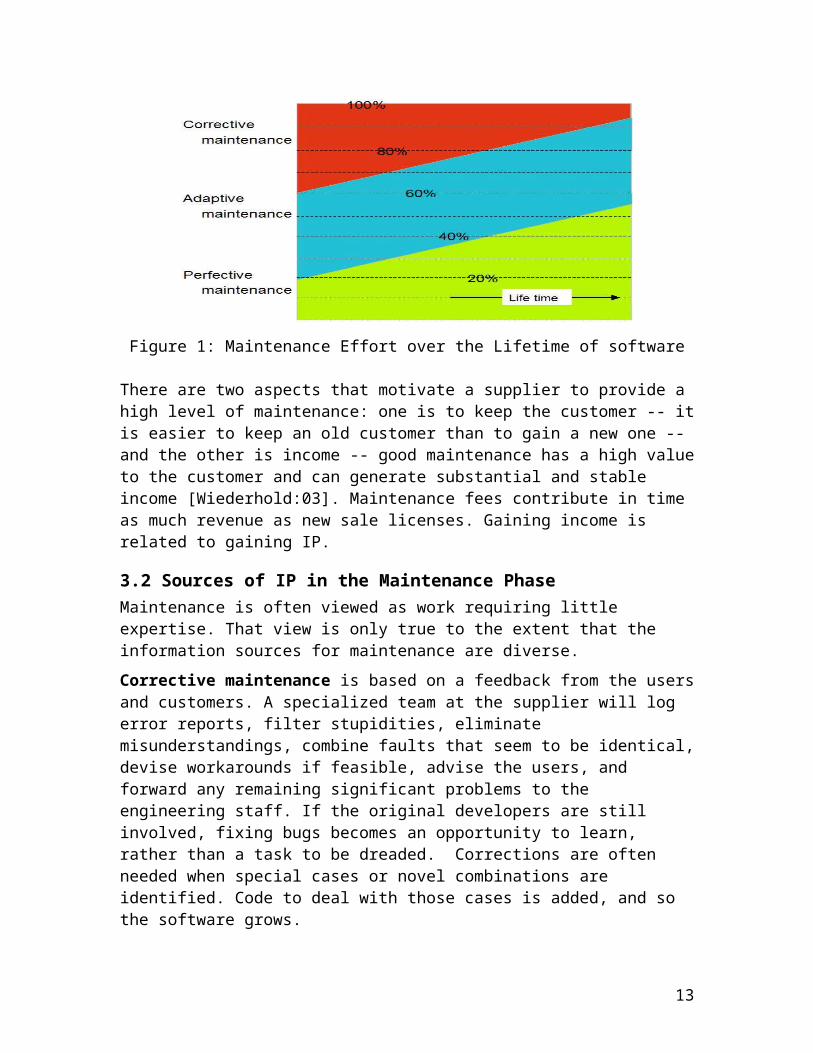
Figure 3. Diminution of the original IP due to maintenance..
Maintaining Enterprise Software. The common strategy for providers of enterprise software is to commit themselves to deliver any further versions of the software to existing customers, as long as the annual maintenance fee is paid. Such a scheme is attractive to the customer, who can predict expenses into the future, and the vendor, who collects a steady income at low sales costs from efforts that are already required to gain additional customers. Typical rates charged customers for ongoing support are 15% of the original purchase price. Of that amount a small fraction goes into sales support, the effort to get the customer to upgrade to the new version and avoid the obligation to fix problems in older versions. A larger fraction goes to routine call-center support. The remainder of the support fees, amounting to 6 to 10% of the purchase price in every subsequent year, is available to the engineering staff for the types of maintenance presented in Section 3. That income will pay for most improvements needed to attract new customers to an existing product line.
Maintaining Shrink-wrapped Software. For shrink-wrapped software the marketing strategy differs. A customer is sold a version of a product, say for $500, and the customer is now motivated to keep it as long as it is adequate. When a new version is available the producer will make an effort to get the customer to upgrade. The new version again is often priced at the same level, unless significant new functionality is provided. We ignore here the cost and benefits of new functionality, since our objective is to assess the IP inherent in the original product. For a similar product, with higher reliability, better adaptability and some perfection, the price again tends not be greater than the rate of inflation. To motivate acceptance, existing customers can often obtain the upgrade at perhaps half of the new price. But it is also easy for the customer to skip some of the upgrades. When skipping versions, over time, incompatibilities due to missing adaptations will become excessive, and a new version must be purchased. In this strategy the sales costs incurred by the vendor for new versions are high, so that net income is less. For upgrades at half price the net revenues may be 30% of the original purchase
13
price every three years. Since costs for call center support etc., are low for companies using such a marketing strategy the annual amount available to the engineering staff may again be about 6 to 10% of the original purchase price a year, although I have not been able to cross check such numbers.
In the end, the income and cost models are remarkably similar for enterprise and shrink-wrapped software. In-house software development will follow a different model, and the next section, dealing with sales volumes, is not applicable.
5.2 PenetrationIf the income per unit of software sold is constant, then income increases are due to growth of unit sales. If developed software is only used in-house, then internal growth of usage or the total enterprise provides an equivalent measure.
For software being sold, sales can increase until the market is substantially penetrated. The size of the candidate market is to be estimated based using the sales data about a predecessor product, the number of businesses that need the functionality of the new product, the number of a certain type of computer or operating system in use, and similar bounds. A 50% penetration is optimistic; beyond that level distortions occur in the market due to the ability to employ monopolistic practices, which I'd rather ignore. Economists also model diffusion rates for new products, but that approach implies that there is an infinite market, without saturation.
A truly useful and well marketed product can become rapidly known in the customer community. The ease of distribution of software means that a product can be rapidly delivered to all customers, so that substantial penetration is achievable in the near-term. If software installation requires a major effort, then the sales peak will be delayed. Further growth can occur of the number of candidate customers grows. To sell yet more, true product innovation is needed, but that issue is not part of our discussion here.
Section 5.1 already accounted for the benefits of replacement sales, so now the issue is new sales. There is some, but little definite literature on sales expectations [MahajanMW:00]. Some of that literature stresses the benefit of novelty, and if a piece of software derives its value from novelty, then use of a temporally limited model is appropriate [Moore:95]. Moore uses normal curves to describe the range of customers from early adopters to broad acceptance to laggards. That model is simple, requiring only a mean and a variance as input, but a problem with a normal distribution is that it begins far in the past, so that the actual point where sales and income commence is hard to determine.
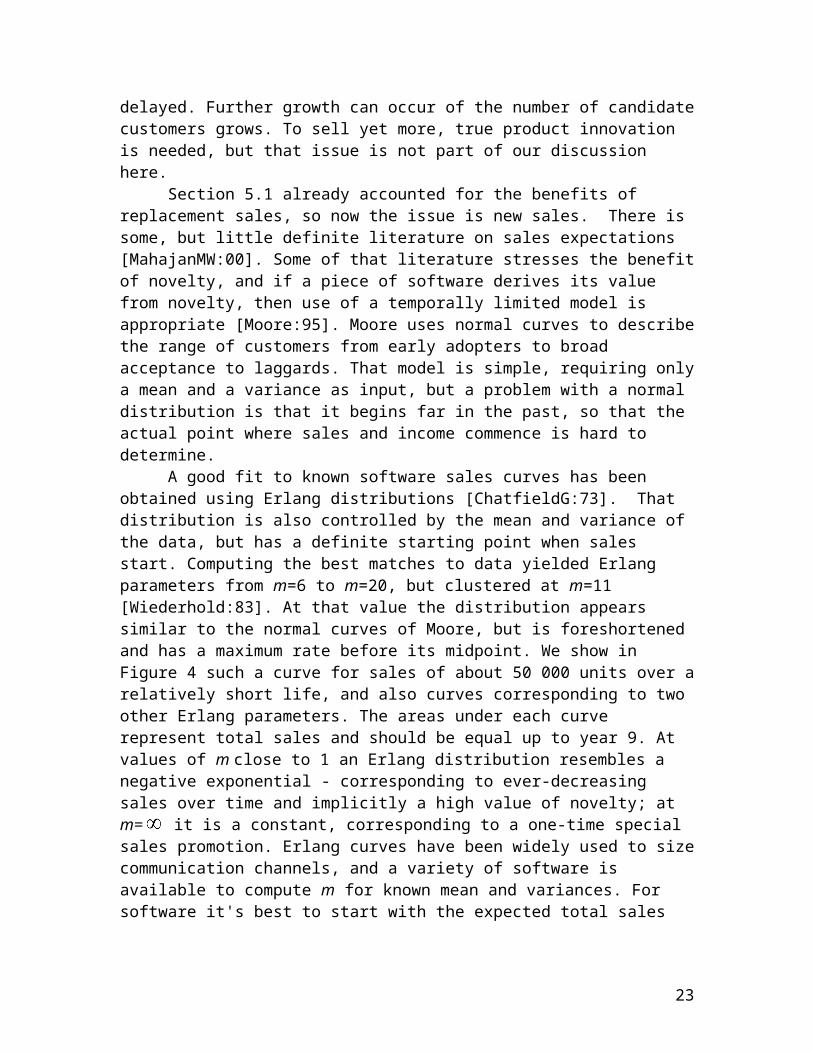
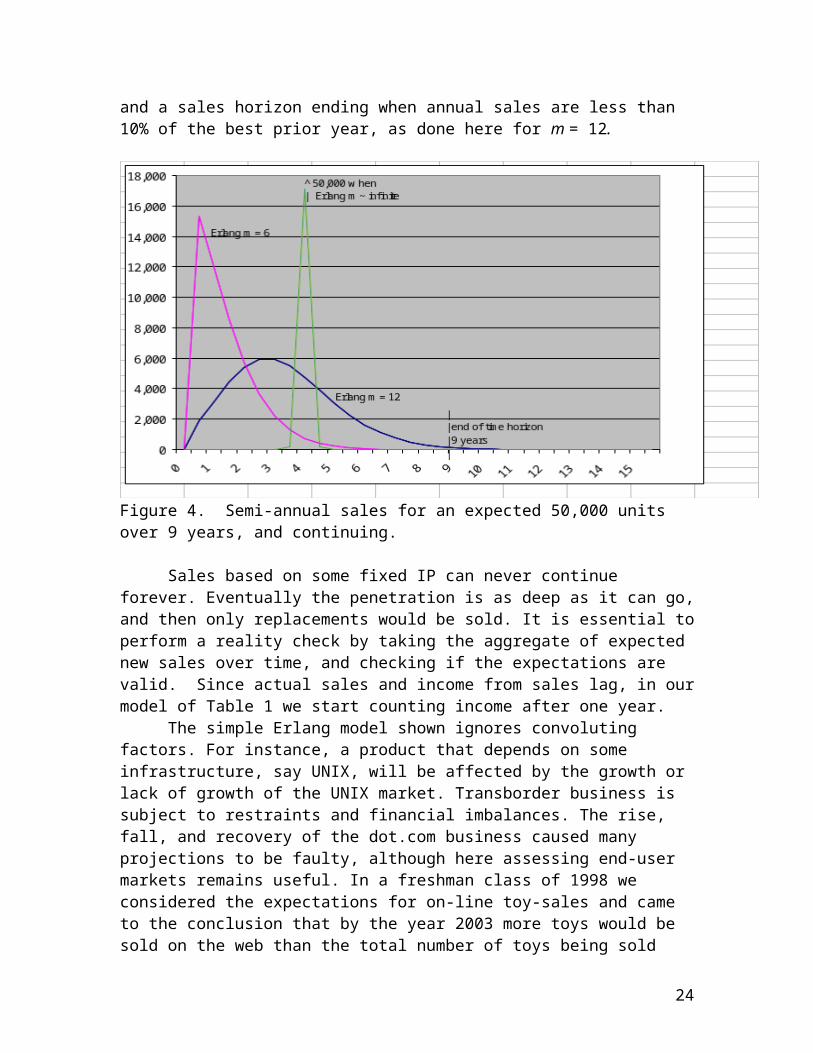
A good fit to known software sales curves has been obtained using Erlang distributions [ChatfieldG:73]. That distribution is also controlled by the mean and variance of the data, but has a definite starting point when sales start. Computing the best matches to data yielded Erlang parameters from m=6 to m=20, but clustered at m=11 [Wiederhold:83]. At that value the distribution appears similar to the normal curves of Moore, but is foreshortened and has a maximum rate before its midpoint. We show in Figure 4 such a curve for sales of about 50 000 units over a relatively short life, and also curves corresponding to two other Erlang parameters. The areas under each curve represent total sales and should be equal up to year 9. At values of m close to 1 an Erlang distribution resembles a negative exponential - corresponding to ever-decreasing sales
14
over time and implicitly a high value of novelty; at m= it is a constant, corresponding to a one-time special sales promotion. Erlang curves have been widely used to size communication channels, and a variety of software is available to compute m for known mean and variances. For software it's best to start with the expected total sales and a sales horizon ending when annual sales are less than 10% of the best prior year, as done here for m = 12.
Figure 4. Semi-annual sales for an expected 50,000 units over 9 years, and continuing.
Sales based on some fixed IP can never continue forever. Eventually the penetration is as deep as it can go, and then only replacements would be sold. It is essential to perform a reality check by taking the aggregate of expected new sales over time, and checking if the expectations are valid. Since actual sales and income from sales lag, in our model of Table 1 we start counting income after one year. The simple Erlang model shown ignores convoluting factors. For instance, a product that depends on some infrastructure, say UNIX, will be affected by the growth or lack of growth of the UNIX market. Transborder business is subject to restraints and financial imbalances. The rise, fall, and recovery of the dot.com business caused many projections to be faulty, although here assessing end-user markets remains useful. In a freshman class of 1998 we considered the expectations for on-line toy-sales and came to the conclusion that by the year 2003 more toys would be sold on the web than the total number of toys being sold [WiederholdC:98]. Such simple checking of limits and identifying inconsistencies can prevent many problems due to excessive expectations. For instance, infrastructure companies, as Cisco and other communication companies, that took in orders from enthusiastic dot.com operations could have realized that the total equipment being ordered was greater than the world could absorb.
15
5.3 Expenses attributable to softwareRevenue from sales is first reduced by the cost of goods sold, a negligible fraction for pure software companies, so that gross profit is nearly the same as revenue from sales. Businesses do have operational costs to be supported by the gross profit: software maintenance, marketing, advertising, sales staff, administration, interest for working capital, etc. And on a company's net profit income taxes will have to be paid. The shareholder's will also want their share of the pie, either dividends or reinvestments to grow the company. Since without these costs no revenue will be generated, these costs reduce the benefits of the initial software.
The required information is available in the financial statements of public companies, as annual reports or published 10-K statements. For a new company one can try to find similar businesses and use their ratios.
For our example software company we assign1. 5% to cost of capital - interest or dividends2. 45% to administrative costs, including sales and distribution3. 25% to software development, shown as research and development4. 25% to marketing and advertising.
Low capital requirements are typical for the software industry once a company is operational. Venture investors paid for the initial investment in people for planning, design, and development.Low distribution costs are also typical for software, especially if Internet capabilities can be exploited. To gain visibility however, substantial advertising may be needed.
In many businesses depreciation of tangibles and taxes greatly reduce net profit. FASB rules state that software expenses after a product is brought to working state, say at a beta release, should be capitalized, and the resulting capital growth must then be depreciated, but that rule is often ignored [Lev:04]. When a company achieves steady state, the effect of ongoing capitalization of software cost and its depreciation is minor.
In general, a company has to decide to what extent to reinvest the profit, giving the stockholders increased share value, or pay dividends, giving the shareholders immediate income. In our model, which approximates many software companies, all available funds are used for further software development and advertising, and no taxable profit is generated. The only taxable component would be payment of dividends, to be included in the 5% cost of capital. But our company invests in future growth. The investors, being stockholders, expect to benefit in the long term from increased share prices. That aspect is captured indirectly in the valuation, namely in the increased value of the product due to ongoing maintenance. If the software budget is also used to develop new products, that generates new intellectual property and hence new value to the stockholders, and is a surrogate for profit. That profit is used to maintain the software at a high level, which will increase the value of the software to the company, as described in Section 6.2, and to develop new software products.
5.4 Income Attributable to SoftwareSales provide the revenue needed for software businesses. To see what fraction of the revenue contributes to IP one must separate out the R&D expenses, advertising costs, any growth of book value, and any dividends and bonuses paid out to stockholders. Taking all of these at equal value makes the assumption that management is smart, and will
16
spend its money where it does the most good, the principle expressed in Section 2.2 as Pareto optimality. There can be much variance in these numbers, so to be credible data should be aggregated over several years and validated by comparison with similar businesses. Note that software expenses are included, they provide an investment in the future of the company, and will enhance its value.
We consider now 4 types of companies, using their income strategies described in Section 2.2.
1. Companies that develop and sell software 2. Companies that purchase and license software for internal use 3. Consulting companies that develop software internally for their own use.4. Manufacturing companies that develop software internally for their own use.
We ignore the prior research and development (R&D) investment and purchases of software since we focus on future income.
1. For a software developer we assume in our simple model that all available income is reinvested in the software business. No dividends are paid to stock holders and no significant capital expenses are incurred. The software investment includes here the ongoing research and development (R&D) expenses applied to fixing, adapting, and perfecting existing software. Such maintenance creates more code, as described in Section 4.4, and doesn’t represent the original code we are valuing. It does represent a positive investment in the future.
In this model we take advertising expenses just as a current expense, even though they also increase the IP value of the company. The effects of advertising tend to be short-lived, and have less importance than word-of-month recommendations about the software.
After all expenses, a typical software developer can reinvest about 25% of total revenues into software research, development, and maintenance. That fraction is then the total contribution to IP.
2. Companies that purchase software licenses for all their needs have decided that their corporate value is not due to the uniqueness of their software -- they have essentially outsourced that aspect of their business. Software will contribute to their operation, but not create any but routine value. These companies are of great interest to the sellers of software, because that's where their IP generates income. But their IP is not due to software. Costs for company-specific selection and integration of purchased software could be considered contributions for the allocation of net revenue.
3. Consulting companies do not generate tangible goods. Their revenue is generated primarily by their personnel and the tools used by their people. If they build all of their software in house then one can assign an equal benefit to software creating employees and other creative employees. Spitting the revenue according to that ratio provides the revenue to be allocated to software. If unique software is built to order by contractors its cost can added to the cost of the software staff. The future income for the consultancy must then be estimated based on past growth and comparable companies. The effective benefit of perpetual income can be estimated using the Gordon Growth Model; a 15-year life gives roughly the same value [BenningaS:97].
4. Manufacturers of tangible goods also rely greatly on software. But now there is a real cost-of-goods that has to be deducted first. For businesses that mainly produce
17
tangibles the income that can be attributed to IP within the products tends to be lower, a ratio of 15% is typical in settings where there is competition. A smaller percentage of the staff than in the prior cases will be contributing to long-term IP, but even not all the IP is related to software, but also includes design and marketing. To allocate the software portion of the total IP one can again determine the ratio of software expenses to all business investments that are not directly related to manufacturing of products. Pareto optimality assumes an equal benefit for software investments, but that can easily be false.
When future income is based on many factors, a fair allocation of future income to software using the Pareto rule is difficult. At times, software investments can have disproportionate benefits, for instance when an industry segment is moving from traditional workflow to modern strategies. An allocation based on costs assumes broad management competence; unfortunately, in companies where management is not software savvy, their spending on software is often not rational. Sometimes ambitious internal efforts are undertaken, and their development costs become excessive, so that a cost-based allocation will exaggerate the value of software. In those cases, using estimates of what the software should have cost can provide a more rational balance. Those can be computed using function points, and, since the software exists, that task is simplified [Jones:98]. The estimate of what the cost should have been can only be used as the nominator in the Pareto equation that allocates the total revenue, not as surrogate for its value in the future.
5.5 Future AllocationFor the valuation, the current SW development fraction investment is continued into the future. It is reasonable to apply the same fraction throughout, unless there is a realistic foundation for higher or lower profit margins in the future. Our sample illustration below allocates 25% of the net revenue to the software IP component, based on Case 1 of Section 5.4, a well-managed company which develops and sells software.
To arrive at today's value of that profit, the benefit of future sales has to be discounted into the future. We use here a typical software industry discount rate of 15% per year. In high risk situations such a rate should be higher. Corrections, using appropriate values of beta can be applied [Barra:98]. Finding the right beta values requires matching the software company to similar businesses and their experience. Here we just assume the sample company to be average risk and use a beta of 1.0.
6. Combining the InformationWe now have estimates of the net income per unit, the fraction of IP of the original code remaining in each version, and the number of units being sold for a number of years into the future. Those numbers can be combined to produce the income associated with the initial software into the future. The benefit of those future sales is then discounted to today. Finally we can sum up the contributions from each future year in the horizon.
6.1 Computing the Value of the Software A spreadsheet provides the best means to summarize the evaluation [Wiederhold:04]. The simple general formulas used by economists, especially if they assume perpetual benefits,
18
and fixed cost/revenue ratios, do not allow for the software engineering factors we consider here [Gordon:82]. Table 1 extracts annual values for our example, starting at a Version 1.0 and ending with a Version 7.0. Versions are released every 18 months. For the sake of presentation we limit software life to 9 years.
Factors Today y1 y2 y3 y4 y5 y6 y7 y8 y9
Version 1.0 2.0 3.0 4.0 5.0 6.0 7.0Relative size (rule DR) 1.00 1.67 2.33 3.00 3.67 4.33 5.00 5.67 6.33 7.00Growth R-1 0.00 0.67 1.33 2.00 2.67 3.33 4.00 4.67 5.33 6.00Replaced (rule GW) 0 0.05 0.10 0.15 0.20 0.25 0.30 0.35 0.40 0.45Initial code left 1- Rep 1.00 0.95 0.90 0.85 0.80 0.75 0.70 0.65 0.60 0.55Fraction old O/R 100% 57% 39% 28% 22% 17% 14% 11% 9% 8%Unit price ($) (rule P) 500 500 500 500 500 500 500 500 500 500Units sold (Fig.4) 0 1911 7569 11306 11395 8644 5291 2740 1241 503Revenue (K$) Us´Up 0 956 3,785 5,653 5,698 4,322 2,646 1,370 621 252SW share @ 25%´Rev 0 239 946 1,413 1,424 1,081 661 343 155 63From initial SW F´Ss 0 136 365 400 311 187 93 39 14 5
Discount @15% 1/1.15 y 1.00 0.87 0.76 0.66 0.57 0.50 0.43 0.38 0.33 0.28
Discounted share Ss/D 0 208 715 929 814 537 286 129 51 18IP contribution Fi/D 0 118 276 263 177 93 40 15 5 1
Total disc. share ΣDs 3,687 K$
Initial IP value ΣIP 989 K$
Table 1. Summary of software benefit factors over a 9-year horizon.
We have made the simplest possible assumptions to arrive at a clear result. The result shows that selling a total of ΣUs ≈ 50 000 units of a product at a price of Up = $500 over 9 years yields a bit less than a million dollars (ΣIP = $0.989M) in terms of discounted IP value today for the initial software. That's not all bad, the company increased in value and due to its ongoing investments and is also providing jobs and societal benefits.
Note that the revenue Rev was much greater, but that income was only realizable by spending on ongoing SW development, marketing, and all the other items within a business. The Ss = 25% share of revenue allocated to the SW contribution amounted to about $3.7M, but much of that will be spent on maintenance cost, as shown in Table 2.
All of the assumptions made can be challenged and improved in any specific situation. It is also possible to plug multiple assumptions into the computation to arrive at ranges and explore what-if questions. All the values used in the assumptions have pragmatic ranges, and their leverage can be explored. For instance, the results will look much better if the unit price Up is set to $2000. However such a change means that many individuals will be loath to buy the software, salesmen will have to work harder, and a purchaser will have to deal with committees. All that bother will decrease sales and delay the generation of income.
6.2 Effect of MaintenanceWe indicated in Section 3 that maintenance has a high benefit. Using our model for a quick investigation shows that value. The alternate approach in this section represents a service model, where the relationship of supplier to customer is maintained. The
19
customer will pay for ongoing maintenance services and always have an up-to-date product. This income is not part of the valuation of the initial software presented in Section 6.1, since it depends on efforts made in future years. In the conclusion we will comment on the operational aspects of such a service-oriented business model.
Income from maintenance changes the cashflow drastically. After year 6 the income of maintenance exceeds the income from sales. Extending Table 2 beyond year 9 we find that by year 15 there are no longer any software sales, but maintenance revenues remain substantial. Figure 5 plots the effect. But to generate those revenues maintenance is required, which can become costly.
Figure 5. Maintenance income versus sales income, and the total after cost
Income from Maintenance. A supplier of enterprise software obtains an ongoing benefit by collecting annual maintenance fees. The software earns maintenance income every year, even as sales are made to new customers. Most customers renew their contracts since the alternative, obtaining new software, is much more costly than paying a maintenance fee. A seller of shrink-wrapped software has to provide enough incentives to make customers purchase new versions. Table 2 shows the income for 15% annual maintenance fees, based on their initial purchase. Assumptions are that first year maintenance is free and that 90% of customers renew their maintenance contract annually. That income is available for the next year. Not all of the income from maintenance fees is available for maintaining software. For instance, there has to be a better help desk. For our example 2/3 of the fee is made available for software tasks, as estimated in Section 5.1.
Cost of Maintenance. We also have to consider software maintenance costs throughout our horizon. Maintenance costs are best estimated based on initial software cost. For our example we make the assumption here that the initial software cost was $500K, about half of the computed value obtained in Table 1, leaving the other half to other initial costs. Spending much more would be unwise given its discounted value, and spending much less for marketable and maintainable software is unlikely. Since we value the workers performing maintenance highly, our model assumes a relatively high 20% annual cost of maintenance, based on aggregated software costs. Maintenance costs do increase
20
over time, and this is accounted for by making the cost proportional to the total, growing, code size, as shown in Figure 6. As a cross check we compute the actual maintenance cost from year 2 to year 7. It is $2,075K, and find that maintenance now consumes about 80% of the total cost, a typical fraction for software having that lifetime [McKinsey:03].
The maintenance costs are borne by the income from ongoing software and maintenance licenses sales. But those costs overlap the costs needed to keep the software product viable for sales. Since the benefits of maintenance expense are delayed, but paid for with current funds, its contribution must be discounted -- we must compute a lag. Lag, sometimes referred to as the gestation period, is the delay between the time of the investment and the time that the investment brings in income. More precisely, one should choose the mean point of the development cost and the mean point of the derived income. The date that a software version is released falls between those two times. Given a development time of a year for maintenance code, testing for a half a year, and new versions every 18 months the average lag is assumed here to be at 1.5 years. That means that maintenance costs are increased by a steady 23% to account for the discount, further raising the accounting cost of maintenance. Still, by the third year the allocated income from maintenance fees is sufficient to pay for all maintenance.
New factors Today y1 y2 y3 y4 y5 y6 y7 y8 y9
Est. initial SW cost ($K) 500Cost of maintenance Cm 67 100 167 233 300 367 433 500 567 633 discounted for lag Cl 82 123 206 288 370 452 534 617 699 781SW retained ΣRev´0.9
yn.a. 860 4,559 9,756 14,478 17,352 18,262 17,806 16,646 15,233
Revenue left Rev - Cl -82 832 3,579 5,365 5,328 3,870 2,111 753 -79 -529Maint.revenue Sr-1´0.15 none none 129 684 1,463 2,172 2,603 2,739 2,671 2,497Maint.revenue avail 2/3 none none 86 456 976 1,448 1,735 1.836 1,781 1,665Discounted M.rev. Mr/D none none 98 450 837 1,080 1,125 1,030 837 710SW share left @ 25%´Rl
-21 208 981 1,797 2,307 2,415 2,263 2.015 1,761 1,532
Discounted to today Sl´D -21 181 742 1,182 1,320 1,201 979 758 576 436
9 years disc. total ΣDt 7,350 K$
Table 2. Net income including maintenance for the example of Table 1.
By considering maintenance costs and revenue as well as sales income the summary in Table 2 can only show income, not initial IP value. Even with the high cost of long-term ongoing maintenance, with the maintenance income the actual cash flow increases by 278% over the 9-year time-frame. However, since much the benefits are projected in the future, the income discounted to today increases less. The discounted income is now $7.35M rather than $3.69M, nearly twice as much as without the income due to maintenance.
More income will accrue beyond year 9, but all good things must end. Table 2 shows that already after year 7 the cost of maintenance exceeds the income from sales, so that without the maintenance income it would be wise to stop improving the product at that time. Stopping abruptly generates bad press for a company that sells other products
21
as well. Gradually reducing maintenance as less income is generated is a wiser option. Still, when customers find out that maintenance is reduced, sales will diminish rapidly and fewer maintenance licenses will be renewed.
To assess the effect of gradual reduction of maintenance after the last version (v7.0), we recomputed the estimate for more sales in year 12 and a retention after year 9 of only 60% annually. By year 12 maintenance income no longer covers even the reduced maintenance cost and the service is withdrawn. These reductions actually lead to some net gain in income. Losses would be further reduced by spending less on advertising, but that decision goes beyond our software valuation model. The result is shown in Figure 5. The income gained is nearly $3.5M, but when discounted to today its value is only $0.735M [Wiederhold:04].
Plotting the data allows rapid review of alternatives. For instance making initial sales often has a high sales engineering expense, say 40%, while selling and installing a new maintenance version has a lower expense, say 20%. In Figure 6 we show the adjusted curves, as well as the ever increasing maintenance cost.
Figure 6. Maintenance, sales income, cost after an expense adjustment
6.3 Preservation of SW Value. Obtaining the result of Section 6.2 required many more assumptions than the base valuation leading to Section 6.1. We now had to consider ongoing costs as well as income. We also made a rough guess at the initial cost, an issue normally reserved for return-on-investment (RoI) estimates. RoI calculations rarely include maintenance costs, but will include the cost of initial capital and other financial concerns, which we are able to neglect. Section 6.2 does quantify the value of retaining customers, a point made recently by [Larcker:04]. Operating in an effective service model also requires changes to business practices, with costs that are hard to quantify. For sellers of shrink-wrapped software additional investment will be needed to convince customers to buy the latest version. When software is developed for internal use it is hard even to track the customers and their use of the software [TillquistR:05]. In the model we used such detail is ignored, the focus was on aggregate projections.
22
The beneficial difference of including maintenance efforts is not captured in a traditional IP valuation. But the business assumptions we made about the enterprise business being modeled follow the rule in valuation that one should value a business as it actually operates, not use a model that builds one version of software and then exploits it until it has no value. The renewal by maintenance means that new programs being sold and those maintained at the customer site are identical.
7. ConclusionsValuation of software is not easy, but is feasible. The novel contribution of this work is the software growth model, but to assess its effects we had to place it in an overall business model. Many assumptions must be made to assess the software-related income and costs, but making assumptions is inherent in dealing with the future. The alternative, remaining ignorant, provides no guidance. Evaluating alternate assumptions with a spreadsheet provides yet more insights [Wiederhold:04]. For instance, determining the benefits of maintenance, as done in Section 6.2, is difficult if we can't even tell what the value of software is in the first place.
A specific conclusion is that maintaining software, although costly, is very worthwhile. Maintenance provides continuing refreshment of the inherent IP. With high quality maintenance a company transforms its business from a sales model into a service model. Service models are very attractive to mature companies, that otherwise face the difficulties of always having to come up with new products to keep sales volume high. But operating in a service model also means that management must appreciate the process and software staff must be motivated to sustain the value of the product by performing excellent maintenance [LandsbaumG:85]. Not only are the programmers involved in ongoing improvements of the software, but also the staff that provides the ongoing intellectual input for the three types of maintenance presented in Section 3.2.
However, eventually maintenance costs overtake income, as shown in Section 6.2. The limit on the life of software under maintenance is not obsolescence, but rather the cost of maintenance. The complexity of growing software incurs high costs [BeladyL:72]. Considering maintenance in software design and managing maintenance well should have significant benefits.
Education and technological attitudes favor novelty over maintenance. A typical and popular software engineering textbook devotes 3 out of 850 pages to maintainability and maintenance, although it states that the effort devoted to maintenance is greater than 60% of total cost [Pressman:01]. The estimate of 60% is actually low, based largely on studies done in the military, who perform very poor software maintenance [Hendler:02]. Today most students in computing disciplines graduate without ever having faced the issue that software must adapt. Students might have had a summer job in a company that assigned them to maintenance tasks, because the knowledgeable programmers wanted to move on, and do new stuff. It is of course an illusion that cheap labor reduces the cost of maintenance, it mainly reduces the benefits of maintenance. Managers often bemoan the high cost of maintenance in their organizations, since they are not clear about the benefits [Spolsky:04]. Experienced personnel is reassigned to new tasks that seem more exciting [Pfleeger:01]. If the company's management understood software economics and its leverages they would let those interns and recent graduates do innovative work, and
23
reward the experienced staff who sustain the value of their existing products and services highly. This process has been referred to as a "gentrification" of maintenance [Foote:98].
A similar analysis is likely to be appropriate for content databases, which have become a recent focus for protection. Those databases are also subject to continuing maintenance and improvements [GardnerR:98]. However, I have not had access to case data to validate content-based models. The analysis approach shown here cannot deal with the valuation of open-source software; current information on its use is scant [SamoladasSAO:04]. The economic benefits of open-source software have a cause-effect that is hard to measure, but also require maintenance to be realized [Spolky:02]. Companies that tried to create a business from servicing open-source software have had a very hard time, since reasonable maintenance costs seem extremely high when acquisition is nearly free.
Even if the predictions made here depend on assumptions that cannot be verified in advance, having the assumptions stated explicitly allows discussions of alternatives. Opinions and disagreements are brought down to a less emotional level, and include more organizational specifics. Having quantified valuation methods that assess the results becomes a necessary tool.
Acknowledgements.Discussions with a number of IRS and consulting economists helped in establishing the principles shown here. A course directed by Jeremy Dent at the London Business School helped in understanding valuation issues in general. Laurence Melloul provided references for information regarding Function Points. I received constructive feedback from Avron Barr, Dan Grosshans, Steve Hoffer, Shirley Tessler, Bhavani Thuraisingham, and John Wiederhold. Discussion with colleagues and students at the University of Arizona Eller School of Business provided further focus. Any errors in this paper are of course, my responsibility, but I will not assume the responsibility for results obtained by using the presented model.
References cited. [Abba:97] Wayne Abba: "Earned Value Management: Reconciling Government and
Commercial Practices," —Reconciling government and commercial practices; Program Manager, Vol.26, pp. 58–69.
[Barra.:98] BARRA: United States Equity Version 3 (E3); BARRA, Berkeley, CA, 1998.[Basili:90] Victor Basili: "Viewing Maintenance as Reuse-Oriented Software
Development"; IEEE Software, Vol.7 No.1, Jan. 1990, pp.19-25.[Batelle:73] Batelle Laboratories: Evaluation of the Implementation of a Medical
Information System in A general community Hospital"; report on a study commissioned by NCHSRD, DHS, 1973.
[Becker:02] Brian C. Becker: Cost-Sharing Buy-Ins; Chapter A in Feinschreiber: Transfer Pricing Handbook, 3rd Edition, Wiley, 2002 supplement.
[BeladyL:72] Laszlo Belady and M.M. Lehman: An Introduction to Growth Dynamics"; in W. Freiberger (ed.), Statistical Computer Performance Evaluation, Academic Press, 1972.
24
[BennigaS:97] Simon Z. Benning and Oded H. Sarig: Corporate Finance: A Valuation Approach; McGrawHill, 1997.
[Bernstein:03] Philip Bernstein: Remark at NLM/NSF planning meeting, Bethesda, MD, 3 Feb 2003.
[Boehm:81] Barry Boehm: Software Engineering Economics; Prentice-Hall, 1981. [Boehm:00] Barry Boehm et al.: Software Cost Estimation with Cocomo II; Prentice-
Hall, 2000. [Bonasia:02] J. Bonasia: Firms Wringing Value from IT Units; Investors Business Daily,
21 Aug. 2002.[BondS:01] Andy Bond and Jagan Sud: "Service Composition for Enterprise
Programming"; Proc. Working Conference on Complex and Dynamic Systems Architecture, University of Queensland, Dec. 2001, Brisbane, Australia.
[Branscomb et al.:91] Lewis Branscomb (chair) et al.: Intellectual Property Issues in Software; Computer Science and Telecommunications Board, National Research Council, National Academy Press, 1991.
[BrealyM:xx] Brealy and Meyers: principles of Corporate Finance, 6th Edition.
<[Britcher:99] Robert N. Britcher: The Limits of Software: People, Projects and Perspectives; Addison Wesley, 1999.>
[Brooks:95] Frederick Brooks: The Mythical Man-Month, Essays in Software Engineering; Addison-Wesley, 1975, reprinted 1995.
[ChatfieldG:73] C. Chatfield and G.J. Goodhardt: A Consumer Purchasing Model with Erlang Interpurchase times; Journal of the American Statistical Association, Dec 1973, Vol. 68, pages 828-835.
[Cheriton:99] David Cheriton: Observation in meeting on systems issues; Stanford University, 1999.
[Damodaran:2002] Aswath Damadoran: The Dark Side of Valuation: Valuing Old Tech, New Tech, and New Economy Companies; Prentice-Hall, 2002.
<[Debreu:59] Gerard Debreu: Theory of Value: an axiomatic analysis of economic equilibrium; Yale Univ. press, 1959.>
<[Doyle:85] Jon Doyle, “Reasoned assumptions and Pareto optimality,” Proc. Ninth International Joint Conference on Artificial Intelligence, 1985.>
[Foote:98] Brian Foote: Escape from the Spaghetti Jungle; Sprint Obejecy-Orionted Users' Group, February 1998, http://www.laputan.org/.
[GardnerR:98] William Gardner and Joseph Rosenbaum: Intellectual Property:Database Protection and Access to Information, Science, Vol. 281, Issue 5378, pages 786-787 , 7 August 1998.
[Gates:04] Bill Gates: "Losses due to copying must be balanced with disincentives and costs of protection methods"; quote during a discussion on "Building Confidence in a Connected Marketplace", 1 Oct 2004, Computer History Museum, Mountain View.
25
[GarmusH:01] David Garmus and David Herron: Function Point Analysis: Measurement Practices for Successful Software Projects; Addison-Wesley Information Technology Series, 2001.
[Glass:03] Robert L. Glass: Facts and Fallacies of Software Engineering; Addison Wesley, 2003.
<[ReillyS:98] Robert F. Reillly, and Robert P. Schweihs: Valuing Intangible Assets; Irwin Library of Investment and Finance; McGraw-Hill, 1998. Chaper 1, p.3:29: Identification; Chapter 19, p 363-380: Data Processing Intangible Assets, Special Consideration on Software Valuation, Cocomo 1981.>
[Hendler:02] James Hendler et al.: Report on Database Migration for Command and Control; United States Air Force Scientific Advisory Board, SAB-TR-01-03, Nov. 2002.
[HennessyP:90] John Hennessy and David Patterson: Computer Architecture; Morgan Kaufman, 1990 (3rd Edition 2002). has H&P rule 5 (factor 1.5-2.0 growth per year)
[IEEE:98] IEEE Standard for Software Maintenance; Document 1219-1998, <<>>
http://www.investopedia.com/terms/g/gordongrowthmodel.asp [Jones:95] Jones, Capers. "Backfiring: Converting Lines of Code to Function Points."
IEEE Computer, vol.28 no.11, November 1995, pp. 87-88.
[Jones:98] T. Capers Jones: Estimating Software Costs; McGraw-Hill, 1998.
[LandsbaumG:85] Jerome B. Landsbaum and Robert L. Glass: Measuring and Motivating Maintenance Programmers; Prentice-Hall, 1985.
[Larcker:04] David Larcker: in "Back to the Drawing Board: Is the Traditional Theory of the Firm Obsolete?"; Strategic Management, Wharton On-line report 1047, Sep. 2004 <http://knowledge.wharton.upenn.edu/article/1047.cfm>
[Lev:01] Baruch Lev: Intangibles, Management, Measurement and Reporting; Brookings Institution Press, 2001.
[LientzS:80] B.P. Lientz and E.B. Swanson: Software Maintenance Management; Addison-Wesley, 1980.
[Lim:98] Wayne C. Lim: The Economics of Software Reuse; Prentice-Hall, 1998.[Lipschutz:04] Robert P. Lipschutz: A Better Blueprint for Business; PC Magazine,
September 7, 2004.[MahajanMW:00] Vijay Mahajan, Eitan Muller, and Yoram Wind (editors): New-
Product Diffusion Models; International Series in Quantitative Marketing, Kluwer, 2000.
[Marciniak:94] John J. Marcianak Encyclopedia of Software Engineering, Wiley, 1994.[McKinsey:03] McKinsey: "Fighting Complexity in IT"; McKinsey Quarterly, April
2003.[Moore:95] Geoffrey A. Moore: Inside the Tornado: Marketing Strategies from Silicon
Valley's Cutting Edge; Harper Business, 1995.
26
[Pfleeger:01] Shari Lawrence Pfleeger: Software Engineering, Theory and Practice, 2nd ed; Prentice-Hall, 2001.
[Pigoski:97] Thomas M. Pigoski: Practical Software Maintenance - Best Practices for Managing Your Software Investment; IEEE Computer Society Press, 1997.
[Pressman:01] Roger Pressman: Software Engineering, A Practioner's Approach; 5th edition; Mc GrawHill, 2001.
[Rechtman:01] Ygal Rechtman: Accounting Treatment of Intangible assets; draft, http://www.rechtman.com/acc692.htm, July 2001.
[Roux:97] David Roux: Statement about software growth; 1997.[Samuelson:83] Paul A. Samuelson: Foundations of Economic Analysis; Harvard
University Press, 1947, 1983.
[SamoladasSAO:04] Ioannis Samoladas. Ioannis Stamelos, Lefteris Angelis, and Apostolos Oikonomu: "Open Software Development Should Strive for Even Greater Code Maintainability", Comm. ACM, Vol.47 No. 10, Oct. 2004, pp.83-87. <projects are not cited, and growth is not plotted. Contact them and see if my growth curve holds. >
[SmithP:00] Gordon Smith and Russell Parr: Valuation of Intellectual Property and Intangible Assets, 3rd edition; Wiley 2000.
[Spolsky:02] Joel Spolsky: The Economics of Open Source; 12 June 2002, www. joel onsoftware.com/articles/StrategyLetterV.html , reprinted in [Spolsky:04]
[Spolsky:04] Joel Spolsky: Joel on Software; Apress, 2004.[Stobbs:00] Gregory Stobbs: Software Patents; Aspen Law and Business publishers,
2000.[TillquistR:05] John Tillquist and waymond Rodgeres: Using Asset Specificity and Asset
Scope to Measure the Value of IT; Comm.ACM, Vol.48 No. 1, January 2005, pp. 75:80
[Wiederhold:83] Gio Wiederhold: Database Design; McGraw-Hill, 1983, also available in the ACM anthology, 2003.
[Wiederhold:95] Gio Wiederhold: ``Modeling and Software Maintenance"; in Michael P. Papazoglou (ed.): OOER'95: Object-Oriented and Entity Relationship Modelling; LNCS 1021, Springer Verlag, pages 1-20, Dec.1995.
[WiederholdC:98] Gio Wiederhold and CS99I class: Web growth (updated); 1998/2000, <http://www-db.stanford.edu/pub/gio/CS99I/2000/webgrowthslide.ppt>.
[Wiederhold:03] Gio Wiederhold: "The Product Flow Model"; Proc. 15th Conf. on Software Engineering and Knowledge Engineering (SEKE), Keynote 2, July 2003, Knowledge Systems Institute, Skokie, IL., pp. 183-186.
[Wiederhold:04] Gio Wiederhold: Simple spreadsheets for the tables and graphs shown here; links at <http: www-db.stanford.edu/pub/gio/inprogress.html#worth>, 2004.
---------------------------------------- o -------------------- o ------------------------------------------
27