Embed Size (px)
Citation preview

1
What is This Module About?
If you want to know the average monthly income of the citizens in your barangay,how will you go about studying it? Will you ask every person in your barangay? Ofcourse not! That will take very long.
In this module, you will learn how to compute the average monthly incomewithout asking every person in your barangay. You will learn that only a number ofpeople that best represents your barangay is enough to answer your inquiry. By usingthe monthly income of these people, you can draw a conclusion that applies for thewhole barangay.
This module is divided into three lessons:
Lesson 1– Sampling
Lesson 2– Sampling Techniques
Lesson 3– Conducting a Survey
What Will You Learn From This Module?
After studying this module, you must be able to:
♦ Distinguish between a sample and a population;
♦ Determine and differentiate parameters and statistics;
♦ Know the use of sampling;
♦ Describe and differentiate the types of sampling techniques; and
♦ Conduct a simple survey using sampling.

2
Let’s See What You Already Know
Before you go on through the module, let’s see how much you know about thelessons covered, by answering the following exercises:
A. Write T if the statement is true and F if the statement is false.
1. ____ A population is a part of the sample.
2. ____ A statistic is a characteristic of the sample.
3. ____ A sample size of 15 is representative of all kinds of population.
4. ____ The larger the sample, the closer the statistic to the parameter.
5. ____ Random sampling error occurs in all studies that use sampling.
B. Fill in the blanks.
1. ______________ bases the selection of a sample on chance ofoccurrence or probability.
2. ______________ divides the population into strata, and from these,members of the sample are randomly chosen.
3. ______________ selects samples among clusters.
4. ______________ is a non-probability sampling that selects thesample directly from the population, and it doesnot use a list of the population in the selectionprocess.
5. ______________ selects the sample based on specific traits neededby the study.
C. Read the case and answer the following questions:
Juan wanted to know the average score of grade five students in a scienceexamination.
1. What was the topic of Juan’s study?
_________________________________________________________
2. What was the population that he wanted to study?
_________________________________________________________
3. If Juan has enough time and money for the study, and if he has a listof all the students, what is the best sampling technique that he canuse? Why?
_________________________________________________________
4. What is the most convenient data gathering method that he can use?Why?
_________________________________________________________
3
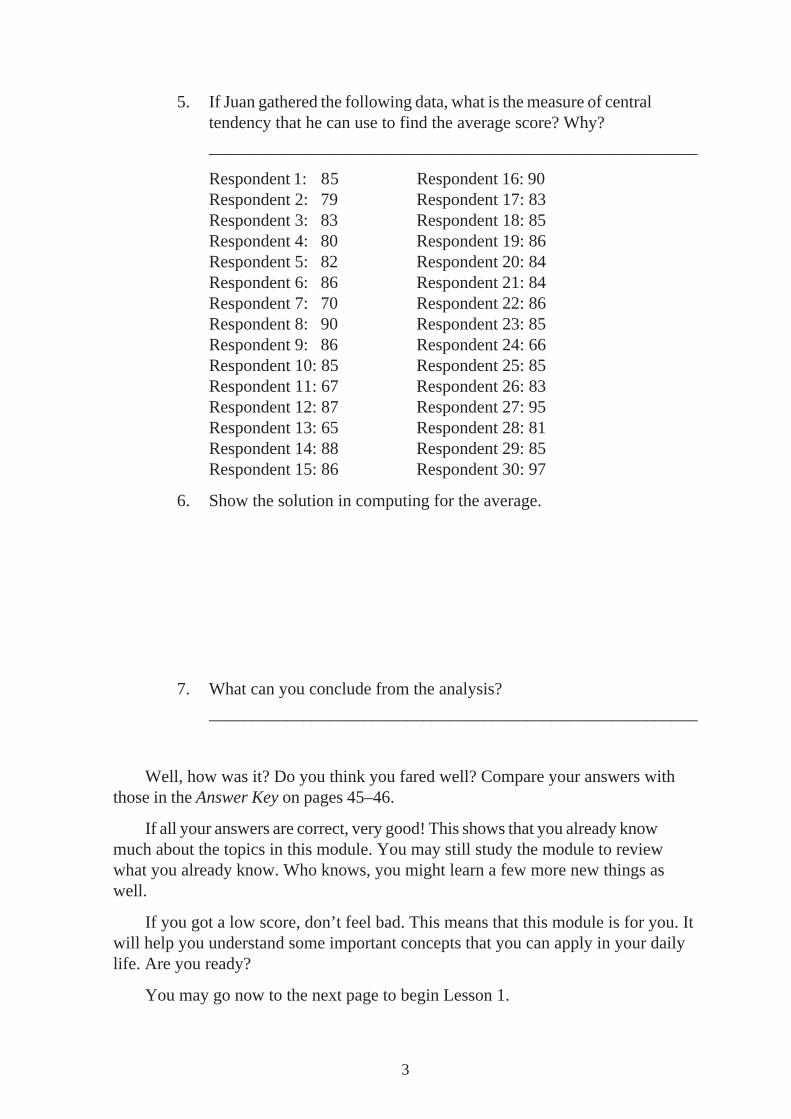
5. If Juan gathered the following data, what is the measure of centraltendency that he can use to find the average score? Why?
_________________________________________________________
Respondent 1: 85 Respondent 16: 90Respondent 2: 79 Respondent 17: 83Respondent 3: 83 Respondent 18: 85Respondent 4: 80 Respondent 19: 86Respondent 5: 82 Respondent 20: 84Respondent 6: 86 Respondent 21: 84Respondent 7: 70 Respondent 22: 86Respondent 8: 90 Respondent 23: 85Respondent 9: 86 Respondent 24: 66Respondent 10: 85 Respondent 25: 85Respondent 11: 67 Respondent 26: 83Respondent 12: 87 Respondent 27: 95Respondent 13: 65 Respondent 28: 81Respondent 14: 88 Respondent 29: 85Respondent 15: 86 Respondent 30: 97
6. Show the solution in computing for the average.
7. What can you conclude from the analysis?
_________________________________________________________
Well, how was it? Do you think you fared well? Compare your answers withthose in the Answer Key on pages 45–46.
If all your answers are correct, very good! This shows that you already knowmuch about the topics in this module. You may still study the module to reviewwhat you already know. Who knows, you might learn a few more new things aswell.
If you got a low score, don’t feel bad. This means that this module is for you. Itwill help you understand some important concepts that you can apply in your dailylife. Are you ready?
You may go now to the next page to begin Lesson 1.
4
LESSON 1
Sampling
Usually, during elections, surveys are able to predict who among the candidateswill win. Some people believe this, but there are others who don’t easily believe thisunless they know what is the sample used, how sampling is done, and what are thesampling errors.
In this lesson, you will learn about terms such as sample, sampling methods ortechniques and other terms, which are useful in conducting surveys. Learning theseterms may help you decide whether to believe or not to believe in surveys.
After studying this module, you should be able to:
1. Distinguish between a population and a sample;
2. Determine and differentiate statistics and parameters;
3. Know what sampling is and the errors that may arise from sampling;
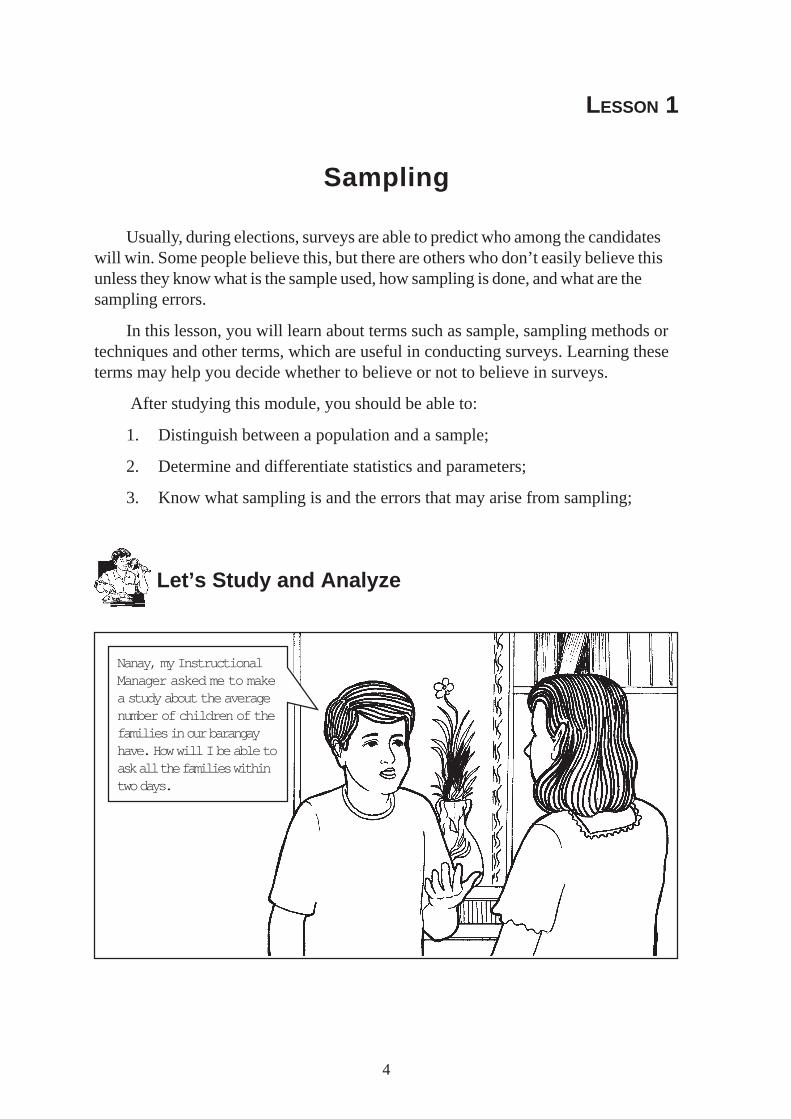
Let’s Study and Analyze
Nanay, my InstructionalManager asked me to makea study about the averagenumber of children of thefamilies in our barangayhave. How will I be able toask all the families withintwo days.

5
That’s easy, Pedro. You donot have to ask all thefamilies in the barangay.You just have to getenough number of families,which can be called“sample” represent thewhole barangay orpopulation.
How can that be? If Iwould not be able to askall of them, theconclusion might bedifferent from what itshould be.

6
Do you think Pedro’s mother is correct? What about his mother’s suggestion?
Let’s Read
Population vs. Sample
A population is a group of persons or things that will be studied. Theresearchers are the ones who determine how big or how small a population will be.For example, in studying monthly income, you may decide that your wholebarangay is your population. That means you will be studying the average monthlyincome of your barangay. On the other hand, you may choose to study the averagemonthly income of your province which sets your whole province as the population.Can you think of other populations for this study?
A sample is a part of your population. The researcher is also the one who willchoose the number of sample. For example, if the population is made up of all thecitizens of your barangay, 30 of them may be your sample. Or you may choosemore people to be your sample, like 40 or 50.
Parameter vs. Statistic
A. They are basically the same measurements for different set of cases:the mean value of a variable in a sample is a statistic; the mean value of thesame variable in the population is a parameter. Usually, the researcher willnot be in a position to know what the parameter is, but will be able tocalculate the statistic. Normally, a parameter is fixed but unknown, a statisticis known but may vary from one sample to another.
7
For example, there are 10,000 households in your barangay. Based on arecent population survey conducted by NCSO (National Census and StatisticOffice) the average household income in your barangay is P 5,000.00.Suppose, you do not know about the survey conducted by NCSO, and youwant to find what is the average household income of your barangay.
B. You interviewed 60 household leads and you found out that the averagehousehold income is P4,000.00. This is statistic. the parameter isP5,000.00 as this based on the population.
To be able to understand better the concepts of population, sample,parameter and statistic, lets read the example below.
C. Julia is conducting a study on how to help reduce air pollution in QuezonCity. One of the ways is to know the number of car owners using unleadedgasoline. From the Land Transportation Office, she was able to get the totalnumber of cars registered in Q.C. She found out that there are 5,000 carowners in Q.C. out of this total number, she wants to find out how many areusing unleaded gasoline. She decided to interview 100 drivers and based ontheir answers, there are 30 of them who are using unleaded gasoline.
D. In the given example, the population consists of the total car owners in Q.C.This is 2,512.2,512 is the population
Out of 2,512 car owners, Julia interviewed 100 car owners.100 is the sample
Out of 100 car owners, 30 are using unleaded gasoline.30 is the statistic
In this example, the parameter is unknown.
Let’s Try This
Find the population, sample, parameter and statistic.
1. Mang Ambo owns a poultry farm, and he wants to know the averagenumber of eggs each hen lays every month. To make the study easier, heobserved 50 hens in one month and found out that each hen lays anaverage of 20 eggs. But based on observing all the hens in the poultry,each hen lays 24 eggs.
Population ________________ Sample ________________
Parameter ________________ Statistic ________________
8
2. Jenny wants to find out the number of her schoolmates who likes Math. Sheasked 100 of her schoolmates and 70% of them said that they like Math. Ifall of her schoolmates were asked, she would find out that 80% of themlikes Math.
Population ________________ Sample ________________
Parameter ________________ Statistic ________________
Have you finished answering? Compare your answers to the answers below.
1. Population: all the hens in the poultry Parameter: average eggs laid permonth – 24
Sample: 50 hens Statistic: average eggs laid per month– 20
2. Population: all of Jenny’s schoolmates Parameter: percentage of studentswho like math – 80%
Sample: 100 of Jenny’s schoolmates Statistic: percentage of students wholike math – 70%
Let’s Learn
Sampling
In conducting a study, we can use a sample in place of a population. Whywould we use a sample instead of a population? Using a population for a study takesa long time, and wastes resources such as money. On the other hand, by using asample, you will be able to gather enough data to conclude for the wholepopulation, without wasting much time, money and effort.
Sampling is a means to approximate the value of the parameter by using asample from a population. By using enough size of sample, you will be able to drawconclusions which are representative of the whole population.
To be representative of the population, the size of the sample or the number ofmembers of the sample should be 30 or more. A sample with less than or near to 30members will only be representative of the population if the population follows anormal distribution. However, we will not discuss what a normal distribution is. Forour purposes, we will use at least 30 members for all kinds of population.
Even though sampling is more practical, the statistic that we get from it maynot be exactly the same as the parameter. For example, you found out from your100-person sample that their monthly income is P 4700, but then the parameter thatof the whole barangay may be P 5000. If you want the statistic to be closer to theparameter, you should increase the number of your sample. For example, if youincreased your sample to 200 persons, you might get a statistic of P 4900, which iscloser to P 5000.

9
Sampling Error
The difference between a statistic and a parameter is called sampling error.Sampling error is made up of two elements:
1. Random Sampling Error – This error is always committed in all studieswhich uses sampling, since the sample can never be the same as thepopulation. The statistic will always be different from the parameter. Thesmaller the sample, the greater the sampling error.
2. Bias – This error happens when the researcher commits a mistake duringthe sampling procedure, or during the time the researcher selects thepeople or things that make up the sample. For example, in choosing asample to research on the average monthly income, you will commit bias ifyou select mostly highly paid people. The average will be pulled up byhigh incomes of these people. To avoid this error, you should selectproportionate number of people per income range.
Let’s Try This
Read the following case and answer the questions:
Jose’s research is about whether or not the citizens in a district of Quezon Cityare satisfied with the performance of the local government. He needs to finish thestudy in one week. Jose used a sample of 600 people. Each barangay in the districthas almost the same number of people, yet he disproportionately selected morepeople in some barangays.
1. How many members are there in the sample? Is it representative of thepopulation? Why?
____________________________________________________________
____________________________________________________________
2. Why do you think did Jose use a sample instead of the whole population?
____________________________________________________________
____________________________________________________________
3. How can Jose make the statistic from the sample be closer to theparameter? Should the sample be increased or decreased?
____________________________________________________________
____________________________________________________________
4. What is/are the error(s) that you see in Jose’s study?
____________________________________________________________
____________________________________________________________
10
Have you finished answering? Compare your answers to the answers below.
1. There are 600 people in the sample. It is representative of the populationbecause it has more than 30 members.
2. Jose used a sample instead of a population because he has to finish thestudy in one week. If he will use the whole population, he may run short oftime.
3. The statistic will be closer to the parameter if Jose increases the sample.From 600, he may increase the sample to 700, 750 or even more.
4. First, he committed a random sampling error which is always present in allresearches and studies that use sampling. Second, he committed biasbecause he chose more people in some barangays.
Let’s Remember
♦ A population is a group of persons or things that will be studied.
♦ A sample is a part of the population
♦ A parameter is a characteristic of the population.
♦ A statistic is a characteristic of the sample.
♦ Sampling is the process of selecting a sample that is enough to representthe whole population. The statistic from the sample approximates theparameter. A sample of at least 30 members is representative of thepopulation.
♦ The larger the sample, the closer the statistic to the parameter.
♦ Random Sampling Error occurs in all studies that use sampling. It reflectsthe fact that the statistic will never be equal to the parameter since thesample is not identical to the population.
♦ Bias occurs when the researcher makes a faulty selection or when s/heselects a sample not representative of the whole population.
11
Let’s See What You Have Learned
A. Fill-in the blanks.
1. A ___________ is a characteristic of the population.
2. The smaller the sample, the greater the ___________.
3. ___________ is an error that takes place when the sample is notrepresentative of the population.
4. ___________ is an error that takes place in all studies and researchesthat use a sample.
5. A statistic is a characteristic of a ___________.
B. Determine the population, sample, parameter and statistic.
1. Helen wants to know the average height of grade six students in theirschool. There are 300 grade six students and she selected 100 for thestudy. She found out that the average height was 4 feet and 7 inches.Based on the whole population, the average height is 4 feet and 5inches.
Population ________________ Sample ________________
Parameter ________________ Statistic ________________
2. A group of students want to know whether voters in Marikina Citybase their votes on popularity of the candidate or on educational andprofessional background. They had 2000 respondents for the study,and they found out that 60 % of the respondents based their votes onpopularity. Based on the population, 70% base their votes onpopularity.
Population ________________ Sample ________________
Parameter ________________ Statistic ________________
C. Read the following case and answer the questions:
A barangay captain wanted to know if the fertilizers given by theDepartment of Agriculture increased the crop yield of farmers in their areaeven though the barangay does not have enough money for the study. Heinterviewed 150 farmers, but 140 of these farmers are farming in a morefertile land.
1. How many members does the sample have? Is it representative of thepopulation? Why?
_________________________________________________________
_________________________________________________________

12
2. Why did the barangay captain use a sample instead of the population?
_________________________________________________________
_________________________________________________________
3. How can the barangay captain make the result of the study closer to theparameter?
_________________________________________________________
_________________________________________________________
4. What are/is the sampling error(s) that you can see in the case?
_________________________________________________________
_________________________________________________________
Have you finished answering? Compare your answers to the Answer Key on page46.
13
LESSON 2
Sampling Techniques
In Lesson 1, you learned about the terms population, parameter, sample andstatistic. You also learned about sampling error such as random sampling error andbias.
In this lesson, you will be introduced to the different sampling techniques and thekinds of surveys on which they apply.
After reading this lesson, you are expected to:
♦ describe and differentiate among the types of sampling techniques; and
♦ conduct a simple survey sampling techniques.
Let’s Read
Scene 1: Carlo and his brother are talking to each other
Sure, Carlo.
Kuya, I am going toresearch whether ornot smokers areaware of the harmfuleffects of passivesmoking. Can youhelp me select asample.
14
I want to know whethersmokers are aware of thedanger of passivesmoking or not. Thelimitations are these: Ineed to finish the studyin one week and that Icannot have a list of thepopulation of smokers.
In that case, youhave to choosean appropriatesamplingtechnique.
You should select a samplefrom the population ofsmokers. There are anumber of ways by whichyou can select the sample.You may choose dependingon the purpose andlimitations of your study.
What is the purpose of yourstudy, and what are thelimitations?

15
Let’s Learn
There are two main types of sampling technique —non-probability andprobability sampling. We will discuss probability sampling and its subtypes, first.
Probability Sampling
Probability sampling is a type of sampling where the members of a sample arechosen through random selection. Random selection means that you choose thembased on probability or on how often they occur or appear in the population.
Below are the subtypes of probability sampling:
1. Simple random sampling is a type of sampling where each member of thepopulation has an equal chance of being included in the sample.
Advantages Disadvantages
♦ Works through limited time in ♦ Does not represent groups
a small sample. of people proportionately.
EXAMPLE: If your population consists of children between 5 to 10 yearsold in your barangay and you need 20 members in the sample,you may select the sample through draw lots. This means thatyou will write the names of the members of the population inpieces of paper, put these in a box, and pick 20 pieces. These20 will make up the sample. The method used in picking 20samples is simple random sampling because all of the childrenhave equal chances of being picked.
2. Systematic random sampling is a type of sampling where a number is usedto systematically choose members of the sample. It is the same as simplerandom sampling, except for the number used to select members of thesample.
Systematic random sampling is better to use in larger populations thansimple random sampling. For example, you have a 1000-memberpopulation, and you use draw lots in getting the sample, the pieces of papermight not be shuffled well, so some members have a greater chance ofbeing selected. On the other hand, systematic random sampling evens outthe chance of each member to be selected, by running through eachmember of the population.
EXAMPLE: You want to conduct a survey on average monthly income ofeach family in your barangay. Suppose there are 150 familiesin your barangay and you want to choose only 30 families foryour study. You can use systematic random sampling, byfollowing the given steps on the next page:

16
STEP 1 Divide the total number of families by the number of familiesyou want to include in the sample.
150 ÷ 30 = 5
5 is the number that you will use to systematically choose thesample.
STEP 2 Make a list of 150 families. List the family names inalphabetical order.
STEP 3 Starting from the first name on the list, count one to five. Thefifth name becomes the first member of your sample.
STEP 4 Continue counting from five to ten, then ten to fifteen, and soon. The families lying on the multiples of 5 are included in thesample. The tenth, fifteenth, twentieth up to the one-hundredfiftieth families are included in the sample. There should be 30families in all, since you decided to have 30 members in thesample.
Advantages Disadvantages
♦ Systematic random sampling gives ♦ Needs more time for selectingequal chances to all members of a big samplepopulation ♦ Does not represent groups of
people proportionately
3. Stratified random sampling is a type of sampling where the population isdivided into subgroups or strata. Each stratum has a common and uniquetrait. A sample is selected from each stratum through random sampling.
Unlike simple and systematic random sampling, stratified randomsampling ensures that proportionate numbers of members from differentgroups of people are chosen.
Advantages Disadvantages
♦ Represents groups of people ♦ Needs more time for grouping
proportionately and selecting sample
EXAMPLE: If a health organization wants to make a study on the effect ofair pollution to the people in Pasig and they need 1,000members in the sample, follow the steps in order to performstratified random sampling.
STEP 1 Stratify or divide the population into subgroups. You maychoose to group them according to age range: 0 – 18 years old,19 – 40 years old, and more than 40 years old.

17
STEP 2 Determine the percentage of each subgroup in the population.For example, 0 – 18 year olds compose 40% of the population,19 – 40 year olds, 35% and more than 40 year olds, 25%.
STEP 3 Determine the number of sample from each stratum bymultiplying the sample size by the percentage. The sampleshould be proportionate to the percentages of each stratum.
Strata computation sample size in every strata
0 – 18 40% x 1000 = 40019 – 40 35% x 1000 = 350more than 40 25% x 1000 = 250
STEP 4 Select the sample using simple random samplings throughdraw lots or the systematic random sampling methods asdiscussed earlier to draw sample for each situation.
5. Cluster sampling is a type of sampling where the population is divided intosubgroups. Unlike in stratified sampling the members of each subgroup orcluster in this sampling do not have common traits. But a cluster hasalmost the same characteristics as another cluster. So instead of randomlychoosing individuals, you choose among clusters.
Advantages Disadvantages
♦ Makes sampling for a large population ♦ Does not represent groups of
easier by choosing in groups people proportionately
EXAMPLE: If the local government of Manila wants to hold an opinionsurvey on the most popular government official, they mightdivide the city (population) into barangays (clusters). Noticethat people in each barangay do not have commoncharacteristics. Each barangay is almost the same as otherbarangays. After forming clusters, barangays are chosenrandomly and included in the sample.
Let’s Study and Analyze
We already know the different types of probability sampling. Now, let’s try tothink about the best probability sampling technique that applies to a specific study.
EXAMPLE 1: Suppose, you want to study if people in your barangay aresensitive to gender equality. What sampling technique is mostappropriate?
18
The first question that you have to ask yourself is if there are there are stratathat may significantly affect the outcome of the study. We can assume that men andwomen may have different views on gender equality. Because of this, each groupmight affect the outcome of the study significantly. To avoid being biased to onegroup, we should select a sampling technique that can represent these two groupsproportionately.
The only sampling technique that can do that is stratified random sampling.
EXAMPLE 2: Suppose you want to study the effect of television on children below5 years old in your city. What sampling technique will you see.
Since there are no groups that can significantly affect the outcome of the study,you can take stratified sampling out of your choices. The next question that youhave to answer is if you have the list of the population. If you do not have the list,you cannot choose simple random sampling and systematic random sampling. Theonly choice you have is cluster sampling, which will make sampling of a bigpopulation easier because you choose among groups.
Let’s Try This
A. Write T if the statement is true and F if the statement is false.
1. _____ Probability sampling bases the selection of sample on chance ofoccurrence.
2. _____ Stratified random sampling chooses sample among groups, and themembers of each have different characteristics.
3. _____ Systematic random sampling uses a number to systematicallychoose members of the sample.
4. _____ Cluster sampling is the most suited technique if some groups in thepopulation can affect the research results significantly.
5. _____ Draw lots is an example of simple random sampling.
B. Read the cases and answer the following questions:
1. Randy wants to know the favorite color of his classmates. There are about45 students in their class, and he wants to have a sample of only 30. Randywants to conclude the study within three hours.
a. Are there any groups which may affect the outcome significantly?
_____________________________________________________
b. Is the population big? Is there a list of the population?
_____________________________________________________

19
c. What is the best sampling technique that Randy can use and why?
_____________________________________________________
_____________________________________________________
2. Your barangay captain wants to know the average kilos of pork producedin your barangay everyday. There are two types of hog-raisers in yourbarangay: the large-piggery owners, and the backyard hog-raisers.
a. Are there any groups which may affect the outcome significantly?
_____________________________________________________
b. Is the population big? Is there a list of the population?
_____________________________________________________
c. What is the best sampling technique that your barangay captain canuse and why?
_____________________________________________________
Have you finished answering? Compare your answers to the answers below.
A. 1. T2. F3. T4. F5. T
B. 1. a. noneb. The population is not big. There are only 42 students in the class
and Randy has a list of the population.c. The best technique that Randy can use is simple random
sampling. Since there is no group that can significantly affect theoutcome, there is no need for stratified random sampling. Thesmall number of students in the population ensures that simplerandom sampling will be able to give equal chances for eachstudent to get into the sample.
2. a. Yes, the large-piggery owners and the backyard hog-raisers. Thelarge-piggery owners produce many kilos of pork per day, so alarge proportion of these hog-raisers will increase the averagesignificantly.
b. The population is big, but it is possible for the barangay captainto have a list of hog-raisers.
c. The best technique that your barangay captain can use is stratifiedrandom sampling, because there are strata that can significantlyaffect the outcome.

20
Let’s Learn
Non-probability Sampling
Non-probability sampling is a type of sampling that is usually used forconvenience or economic reasons and for the purpose of the study. The sampleselected in this type of sampling is not based on probability or on how often orseldom their traits occur. Below are the subtypes of non-probability sampling withtheir applications.
1. Accidental or incidental sampling is a type of sampling where themembers of the sample are chosen directly from the population based onconvenience and accessibility.
EXAMPLE 1: If you want to make a study on monthly income, you mightchoose your neighbors to be your sample because they livenearer to your home.
EXAMPLE 2: If you want to know the brand of soap most frequently usedby the people in your barangay, you might choose to get thedata from nearby sari-sari stores because it is moreconvenient.
Advantages Disadvantages
♦ Compared to other non-probability ♦ Does not represent groupssampling techniques, it works better of people proportionatelythrough limited time and resources
2. Quota sampling is a type of sampling where the population is divided intosubgroups or strata. Like in stratified sampling, each subgroup in thissampling has a unique trait. The only difference of quota from stratifiedsampling is the way the sample is chosen. In quota sampling, the selectionof the sample is based on convenience and accessibility.
EXAMPLE: If you want to make a study on the opinion of your barangay onfamily planning, and you need 100 members in the sample,follow the following steps:
STEP 1 Divide the population into subgroups. You may divide it intotwo subgroups – males and females.
STEP 2 Know the percentage of each group in the population. Forexample, you learned that 55% of your barangay consists ofmales, while 45% is made up of females.

21
STEP 3 Determine the percentage of each subgroup in the population.The number from each group should be proportionate to theirpercentages in the population.
strata computation sample size per strata
Females 100 × 45% = 45Males 100 × 55% = 55
STEP 4 Select the number of members that you need from each groupbased on convenience and accessibility.
Advantages Disadvantages
♦ Needs more time for grouping ♦ Represents groups of people
and selecting sample proportionately
3. Purposive sampling is a type of sampling where the members of thesample are chosen based on their traits and characteristics needed in yourstudy. You choose a sample based on your selection criterion.
You may use purposive sampling even if resources do not limit you.The limitation in using purposive sampling is that some members of thepopulation do not have the traits needed by the study.
EXAMPLE 1: If you want to study the effect of rock music on the youth,you choose a sample that listens to rock music. That is theselection criterion. If a person does not listen to rock music,then s/he cannot be a member of the sample.
Advantages Disadvantages
♦ Selects the right people for the ♦ Has a tendency to be biased
study if mistakenly chosen for a study
Let’s Study and Analyze
We have already finished the non-probability sampling techniques. Alwaysremember that before using non-probability sampling techniques, there should beeconomic limitations on the study like time and money constraints or on the traitsneeded by the study. Now let’s learn the instances when to use non-probabilitysampling techniques.
EXAMPLE 1: Ian wants to conduct a study on the eating habits of hisschoolmates. However, he does not have a list of his schoolmates.He also has a small budget for the study. What do you think is thebest non-probability sampling technique that Ian can use?
22
The first question that you should ask yourself is if the study requires specifictraits of a group of people for the study. Since Ian’s study does not require aspecific group of people, then, purposive sampling is out.
The next question is if there are groups of people that can significantly affectthe outcome of the study. Since there are no such groups, quota sampling is also out.
The only non-probability technique left is accidental or incidental sampling.
Let’s Try This
A. Fill-in the blanks.
1. ______________ is a non-probability sampling that selects membersof a sample based on their traits needed for the study.
2. ______________ is a non-probability sampling that divides thepopulation into subgroups, and selects a sample based on convenienceand accessibility.
3. ______________ is a non-probability sampling that selects a sampledirectly from the population, which makes a disproportionaterepresentation of groups in the population.
4. Quota sampling is the same as ______________ except for theselection process of samples from subgroups.
5. Unlike probability sampling, ______________ bases the selection of asample on accessibility and convenience.
B. Read the case and answer the following questions:
Tina wants to know the reasons that her neighbors use the internet.Only 20% in their neighborhood has computers and 40% has Internetaccess.
a. Does the study require specific traits of the sample?
_________________________________________________________
b. Are there groups of people, which can significantly affect the outcomeof the study?
_________________________________________________________
c. What is the best sampling technique that Tina can use for her study,and why?
_________________________________________________________
_________________________________________________________
23
Have you finished answering? Compare your answers to the answers below.
A. 1. Purposive2. Quota3. Accidental or incidental4. stratified random sampling5. non-probability sampling
B. a. Yes, the study require members that use the internet or have used theinternet.
b. There are no groups of people that can significantly affect the outcomeof the study.
c. The best technique that Tina can use is purposive sampling because thestudy requires that the sample has used or uses the internet.
Let’s Study and Analyze
Now, let’s put probability and non-probability sampling together in our choices ofsampling techniques.
EXAMPLE 1: An environmental organization wants to know if people of MetroManila are aware of the depletion of forests. However, theorganization does not have enough money and time for acomprehensive study.
QUESTION 1: Is the study limited by economic resources? Or does the studyrequire specific traits of a group in the population?
Yes, the study is limited by time and money constraints. Thismeans that the organization has to use non-probability sampling.But the study does not require specific traits of a group ofpopulation, so purposive sampling is out of the choices.
Since you already know the general type of sampling technique touse, follow the guide questions given for non-probabilitysampling.
QUESTION 2: Are there groups of people which can significantly affect theoutcome of the study?
There are no groups of people which can significantly affect theoutcome of the study, so quota sampling is out of the choices.
Then the only one left among the choices, and the best samplingtechnique for the study is accidental or incidental sampling.

24
EXAMPLE 2: Louie wants to know how often his neighbors eat vegetables. Thereare only about 50 people in his neighborhood. He wants to includeonly 30 people in the sample. He has enough budget and time forthe study.
QUESTION 1: Is the study limited by economic resources? Or does the studyrequire specific traits of a group in the population?
Louie’s study is not limited by economic resources, so he can useprobability sampling. The study neither requires specific traits ofa group of population, so purposive sampling is out of thechoices.
Since you already know that you will use probability sampling,follow the guide questions given for probability sampling.
QUESTION 2: Are there any strata that can significantly affect the outcome ofthe study?
There are no strata that can significantly affect the outcome of thestudy, so stratified random sampling is out of the choices.
QUESTION 3: How big is the population? Is it possible to make a list of thepopulation?
Yes, since there are only 50 members, it is possible to have a listof the population.
QUESTION 4: What is the best sampling technique that Louie can use for thestudy?
The best technique that Louie can use is simple random sampling.
Let’s Try This
Read the following case and answer the following question:
A governor wants to hold an evaluation of his administration of the province.He has 10 municipalities, each having 30 districts. Before the planning of the study,he raised enough money for the project. The study is not prioritized for the meantime, although he wants to begin the study now.
What is the best sampling technique for the study? Why?
Have you finished answering? Compare your answer to the answer below.
Since there are no economic limitations, probability sampling can be used. Thestudy does not require specific traits of a group of people so purposive sampling isout of the choices. There are no strata that can significantly affect the outcome sostratified random sampling is out of the choices. Since the population is very largeand it is impossible to have a list of the population, the best technique suited for thestudy is cluster sampling.
25
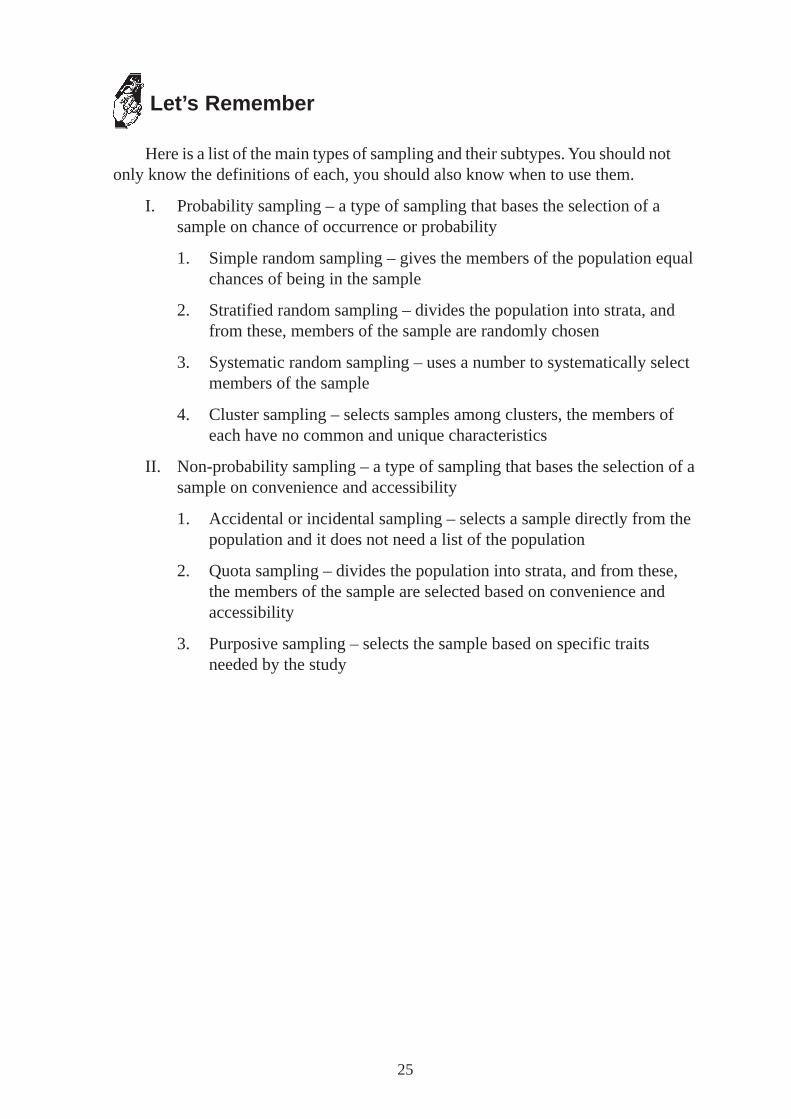
Let’s Remember
Here is a list of the main types of sampling and their subtypes. You should notonly know the definitions of each, you should also know when to use them.
I. Probability sampling – a type of sampling that bases the selection of asample on chance of occurrence or probability
1. Simple random sampling – gives the members of the population equalchances of being in the sample
2. Stratified random sampling – divides the population into strata, andfrom these, members of the sample are randomly chosen
3. Systematic random sampling – uses a number to systematically selectmembers of the sample
4. Cluster sampling – selects samples among clusters, the members ofeach have no common and unique characteristics
II. Non-probability sampling – a type of sampling that bases the selection of asample on convenience and accessibility
1. Accidental or incidental sampling – selects a sample directly from thepopulation and it does not need a list of the population
2. Quota sampling – divides the population into strata, and from these,the members of the sample are selected based on convenience andaccessibility
3. Purposive sampling – selects the sample based on specific traitsneeded by the study
26
Let’s See What You Have Learned
A. Write T if the statement is true and F if the statement is false.
1. ____ Probability sampling is used when there are economic limitations
2. ____ Purposive sampling is used when the study requires specifictraits of a group of people.
3. ____ Quota sampling is a type of probability sampling that dividesthe population into strata.
4. ____ Accidental or incidental sampling chooses a sample directlyfrom the population.
5. ____ Cluster sampling is a sampling that divides the population intodifferent clusters, and from each cluster, a sample is chosen.
B. Fill-in the blanks.
1. ______________ sampling bases the selection of a sample onconvenience and accessibility.
2. If there are economic limitations and if there are some groups in thepopulation that can significantly affect the outcome of the study, thebest sampling technique is ______________.
3. Systematic random sampling uses a ______________ tosystematically choose a sample.
4. A ______________ is a group of people with common characteristics.
5. A ______________ is a group with different characteristics, but it hasthe chance of being selected to be in the sample as a group.
C. Read the case and answer the following questions:
1. Anthony wants to know the opinion of his neighbors on the possibilityof human cloning. He has prepared enough money and time for thestudy, but he worries that some of his neighbors might not be aware ofhuman cloning.
a. Is the study restricted by economic limitations? Does the studyrequire specific traits of a group of people?
_____________________________________________________
_____________________________________________________
b. What is the best sampling technique that Anthony can use? Why?
_____________________________________________________
_____________________________________________________

27
D. Read the cases and determine the best sampling technique for each. Explainyour answers.
1. You want to know the average kilos of rice produced by each farmer inyour barangay. However, there are farmers who own more than 2hectares of land, and there are farmers who own less than 1 hectare.You have to finish the study in one week, and you only have a smallbudget for it.
_________________________________________________________
_________________________________________________________
_________________________________________________________
2. Julie will conduct a study about the favorite sports of grade fivestudents in San Isidro Elementary School. She prepared enoughmoney for it, and she has more than one month to complete the study.She has access on the list of the 400 students in the population.
_________________________________________________________
_________________________________________________________
_________________________________________________________

28
LESSON 3
Conducting a Survey
In this lesson, you will learn how to make a simple survey of your own. You willbe able to apply the things you have learned from the past lessons.
You can perform a survey on anything that interests you. For example, you canconduct a survey on Filipino traditions practiced by your barangay, on the numberof children below 5 years old in your district, or even on the favorite food of yourneighbors.
In this lesson, you should already know how to get the measures of centraltendency and variability. You are also required to know the type of samplingtechnique to be applied in particular studies.
Let’s Learn
Survey vs. Census
Before we start the lesson, we should understand first what a survey is. Asurvey is a research or study that uses a sample. On the other hand, a census is aresearch or study that uses a population.
What do you think are the steps in conducting a survey? Below are thesummarized steps in conducting a survey:
1. Conceptualization and planning
2. Data gathering
3. Analysis
4. Conclusion
Conceptualization and Planning
In conceptualization and planning, the first thing that you have to think about isthe specific topic you want to research on. Here are a few examples of the topics:
Most popular senator in your barangayCommon problems that teenagers faceAverage number of hours spent by students in studying at homeHow often children use po and opo nowadaysWhether or not people agree on the way women dress up today
29
What are the other topics you think of?
After choosing a topic, determine the population and sample. For example, youwant to study about the most common problems that teenagers face. Yourpopulation for this is composed of teenagers. From the population, the sample isdetermined by using the sample techniques that we learned earlier. What do youthink is the sampling applicable to this study if you are limited by time or money?What is the representative sample size?
You’re right! It is best to use incidental or accidental sampling. You should get30 or more members from the population, to make sure that the sample isrepresentative of the population.
Let’s Try This
Determine the population members, sampling technique and sample size for theother sample topics, assuming that you are economically limited.
1. Most popular senator in your barangay
Population:Sampling technique:Sample size:
2. Average number of hours spent by students in studying at home.
Population:Sampling technique:Sample size:
3. How often children 3 to 10 years old use po and opo nowadays.
Population:Sampling technique:Sample size:
4. Whether or not people in your barangay agree on the way women dress uptoday.
Population:Sampling technique:Sample size:
Have you finished answering? Compare your answers to the answers below.
1. Population: people in your barangaySampling technique: incidental and accidental samplingSample size: 30 or more
30
2. Population: studentsSampling technique: quota sampling (strata are assigned based on yearlevel, college students spend relatively more time in studying)Sample size: 30 or more
3. Population: children 3 to 10 years oldSampling technique: incidental or accidental sampling
Sample size: 30 or more
4. Population: people in your barangaySampling technique: quota sampling (strata are assigned based on gender)Sample size: 30 or more
Let’s Learn
Data Gathering
In conducting a survey, you should have at least one question to ask to themembers of your sample or to your respondents, or one query that you will observein your sample if the sample is not composed of people. Using these questions orqueries, you will be able to gather answers that will make up your data.
After you have listed your questions, you can either have an interview or aquestionnaire. An interview means that you will ask your sample directly, and youwill take note of their answers. Using a questionnaire means that you will give themthe set of questions written in a paper, and they will write their answers on thatpaper, and then you will collect these questionnaires from them.
You are the one who will decide whether to have interviews or to distributequestionnaires. If you are willing to interview a sample of 30 people, you may do soas long as you will finish the study on time. But what if you have a sample of 100people, is it practical to hold interviews? A questionnaire is more practical to use ifyou have a large sample and many questions, and if you have limited time for thestudy.
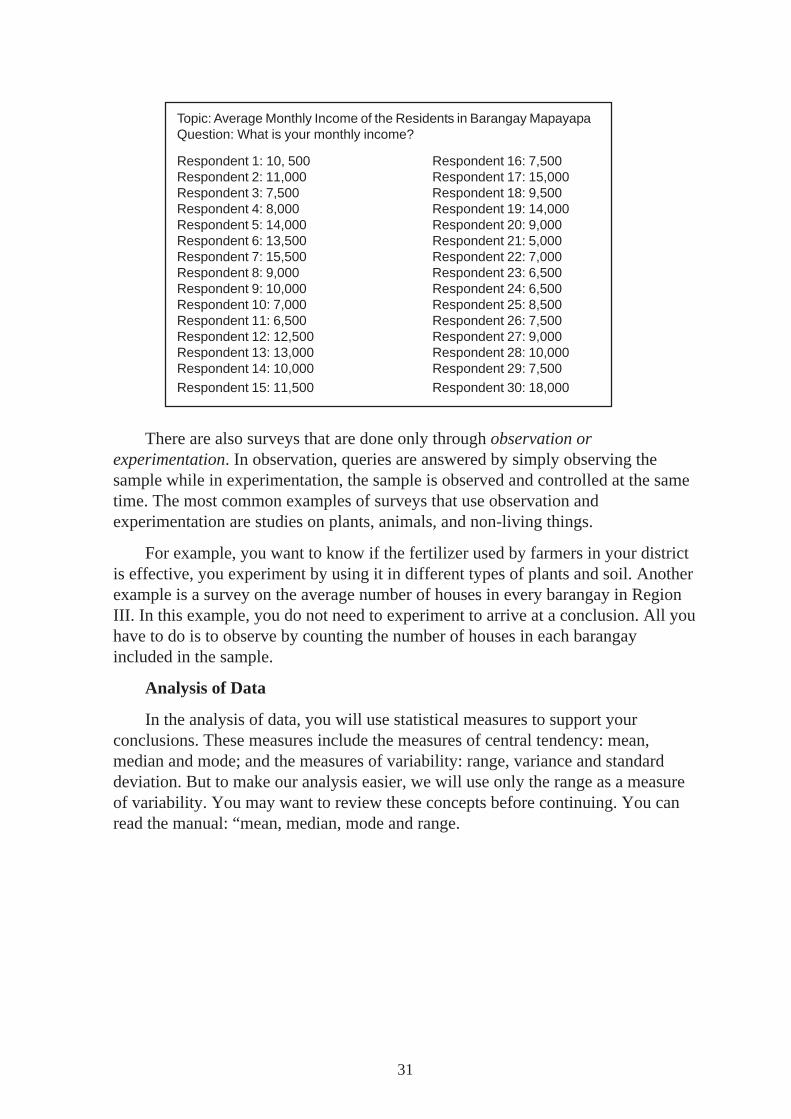
Look at the data on the next page. This is the data that Roni gathered frominterviews. He took note of the answers of the respondents on a sheet of paper.
31
Topic: Average Monthly Income of the Residents in Barangay MapayapaQuestion: What is your monthly income?
Respondent 1: 10, 500 Respondent 16: 7,500Respondent 2: 11,000 Respondent 17: 15,000Respondent 3: 7,500 Respondent 18: 9,500Respondent 4: 8,000 Respondent 19: 14,000Respondent 5: 14,000 Respondent 20: 9,000Respondent 6: 13,500 Respondent 21: 5,000Respondent 7: 15,500 Respondent 22: 7,000Respondent 8: 9,000 Respondent 23: 6,500Respondent 9: 10,000 Respondent 24: 6,500Respondent 10: 7,000 Respondent 25: 8,500Respondent 11: 6,500 Respondent 26: 7,500Respondent 12: 12,500 Respondent 27: 9,000Respondent 13: 13,000 Respondent 28: 10,000Respondent 14: 10,000 Respondent 29: 7,500Respondent 15: 11,500 Respondent 30: 18,000
There are also surveys that are done only through observation orexperimentation. In observation, queries are answered by simply observing thesample while in experimentation, the sample is observed and controlled at the sametime. The most common examples of surveys that use observation andexperimentation are studies on plants, animals, and non-living things.
For example, you want to know if the fertilizer used by farmers in your districtis effective, you experiment by using it in different types of plants and soil. Anotherexample is a survey on the average number of houses in every barangay in RegionIII. In this example, you do not need to experiment to arrive at a conclusion. All youhave to do is to observe by counting the number of houses in each barangayincluded in the sample.
Analysis of Data
In the analysis of data, you will use statistical measures to support yourconclusions. These measures include the measures of central tendency: mean,median and mode; and the measures of variability: range, variance and standarddeviation. But to make our analysis easier, we will use only the range as a measureof variability. You may want to review these concepts before continuing. You canread the manual: “mean, median, mode and range.

32
Let’s Study and Analyze
Let’s try to analyze the data gathered by Roni, given in the earlier section.
Roni wants to know the average monthly income of the residents in BarangayMapayapa. What do you think should Roni use as a measure of central tendency?To answer this, let’s find out the variability or the range of the data.
range = highest monthly income – lowest monthly income= 18,000 – 5,000= 3,000
A range of 3,000 means that the data have large differences. Because of this,we should use a measure of central tendency in which the extreme data such as18,000 or 5,000 will not pull up or pull down the average.
The only measure of central tendency that makes this possible is the median.
Do you still remember how to compute for the median? What is the median?You’re right! The median is 9,000.
Once you find the answer, you can conclude that the average monthly incomeof the residents in Barangay Mapayapa is 9,000 pesos.
Let’s Learn
You already know that we use the median when the data has a high range.When will we use the mean and the mode?
The mean is used when the data has a small variability or range.
The mode is used when some numerical data (data represented by numbers)composes the majority of the data. For example, if 25 of Roni’s respondents saidthat their monthly income is 10,000, and the other 5 respondents has higher andlower monthly incomes, you may use the mode. Since the majority of therespondents have a monthly income of 10,000, you can safely say that 10,000 is theaverage monthly income.
The mode is also used for categorical data or data which are not represented bynumbers. For example, you want to know if your neighbors agree with the curfewset by barangay officials. The only answers or data that you can gather in this studyare yes and no. How can you measure the central tendency of yes and no data? Youwill find the central tendency using the mode. If you have a sample of 55 people, 20of which answered yes, and 35 answered no, the mode is no.
33
Let’s Study and Analyze
Let’s analyze some survey data by using the mean and the mode.
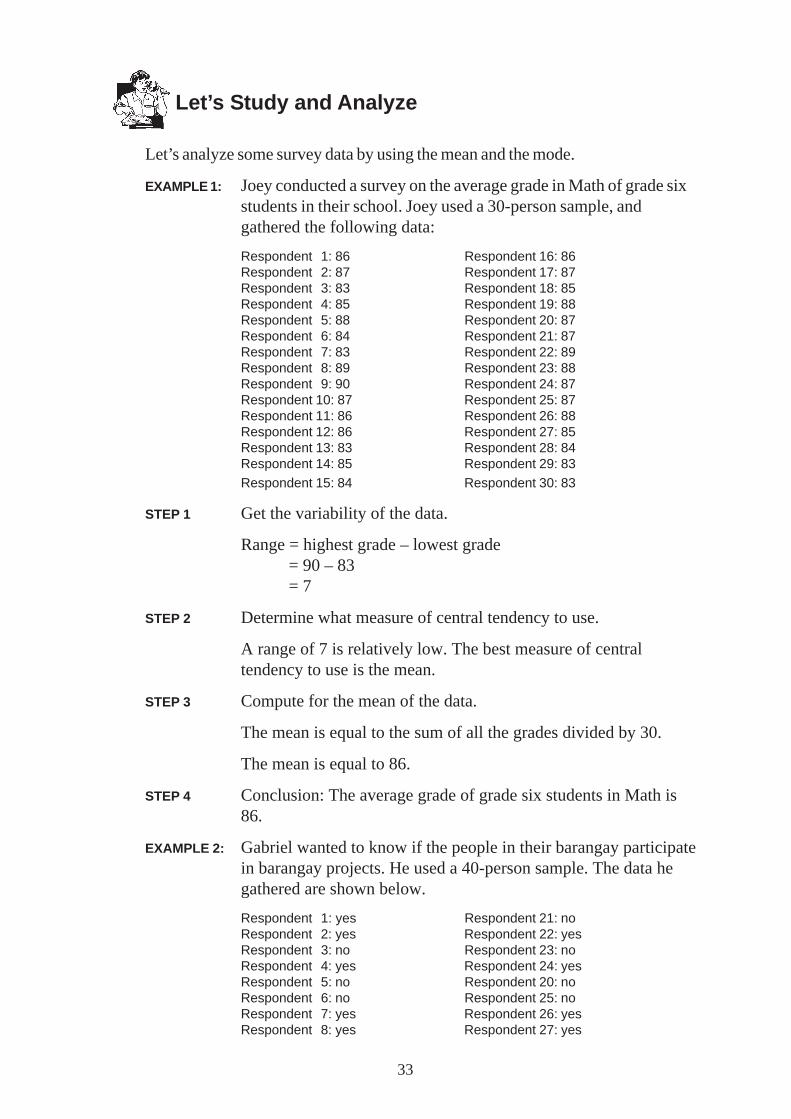
EXAMPLE 1: Joey conducted a survey on the average grade in Math of grade sixstudents in their school. Joey used a 30-person sample, andgathered the following data:
Respondent 1: 86 Respondent 16: 86Respondent 2: 87 Respondent 17: 87Respondent 3: 83 Respondent 18: 85Respondent 4: 85 Respondent 19: 88Respondent 5: 88 Respondent 20: 87Respondent 6: 84 Respondent 21: 87Respondent 7: 83 Respondent 22: 89Respondent 8: 89 Respondent 23: 88Respondent 9: 90 Respondent 24: 87Respondent 10: 87 Respondent 25: 87Respondent 11: 86 Respondent 26: 88Respondent 12: 86 Respondent 27: 85Respondent 13: 83 Respondent 28: 84Respondent 14: 85 Respondent 29: 83Respondent 15: 84 Respondent 30: 83
STEP 1 Get the variability of the data.
Range = highest grade – lowest grade= 90 – 83= 7
STEP 2 Determine what measure of central tendency to use.
A range of 7 is relatively low. The best measure of centraltendency to use is the mean.
STEP 3 Compute for the mean of the data.
The mean is equal to the sum of all the grades divided by 30.
The mean is equal to 86.
STEP 4 Conclusion: The average grade of grade six students in Math is86.
EXAMPLE 2: Gabriel wanted to know if the people in their barangay participatein barangay projects. He used a 40-person sample. The data hegathered are shown below.
Respondent 1: yes Respondent 21: noRespondent 2: yes Respondent 22: yesRespondent 3: no Respondent 23: noRespondent 4: yes Respondent 24: yesRespondent 5: no Respondent 20: noRespondent 6: no Respondent 25: noRespondent 7: yes Respondent 26: yesRespondent 8: yes Respondent 27: yes

34
Respondent 9: no Respondent 28: noRespondent 10: no Respondent 29: yesRespondent 11: no Respondent 30: noRespondent 12: yes Respondent 31: noRespondent 13: no Respondent 32: yesRespondent 14: yes Respondent 33: yesRespondent 15: yes Respondent 34: yesRespondent 16: no Respondent 35: noRespondent 17: no Respondent 36: noRespondent 18: yes Respondent 37: yesRespondent 19: no Respondent 39: noRespondent 20: no Respondent 40: no
The data given above are categorical. The best measure of central tendency forthis data is the mode.
To get the mode of the data, find the number of times that yes and no wereanswered.
Yes = 18
No = 22
The mode is No. You can conclude that residents of the barangay do notparticipate in barangay projects.
Let’s Try This
Analyze the following data by using the measures of variability and centraltendency, and then draw a conclusion from the analysis. Follow the steps given inthe examples above.
1. Karla wanted to know the favorite subject of elementary students in theirneighborhood. She used a 40-person sample. Below are the data that shegathered.
Respondent 1: Math Respondent 21: MathRespondent 2: Science Respondent 22: MathRespondent 3: Social Studies Respondent 23: ScienceRespondent 4: Science Respondent 24: Social StudiesRespondent 5: Math Respondent 20: ScienceRespondent 6: Math Respondent 25: MathRespondent 7: Science Respondent 26: MathRespondent 8: Social Studies Respondent 27: FilipinoRespondent 9: English Respondent 28: Social StudiesRespondent 10: Social Studies Respondent 29: EnglishRespondent 11: Math Respondent 30: FilipinoRespondent 12: Filipino Respondent 31: ScienceRespondent 13: Math Respondent 32: MathRespondent 14: Science Respondent 33: MathRespondent 15: English Respondent 34: Science
35
Respondent 16: Math Respondent 35: Social StudiesRespondent 17: Math Respondent 36: MathRespondent 18: Science Respondent 37: MathRespondent 19: Filipino Respondent 39: ScienceRespondent 20: Social Studies Respondent 40: Science
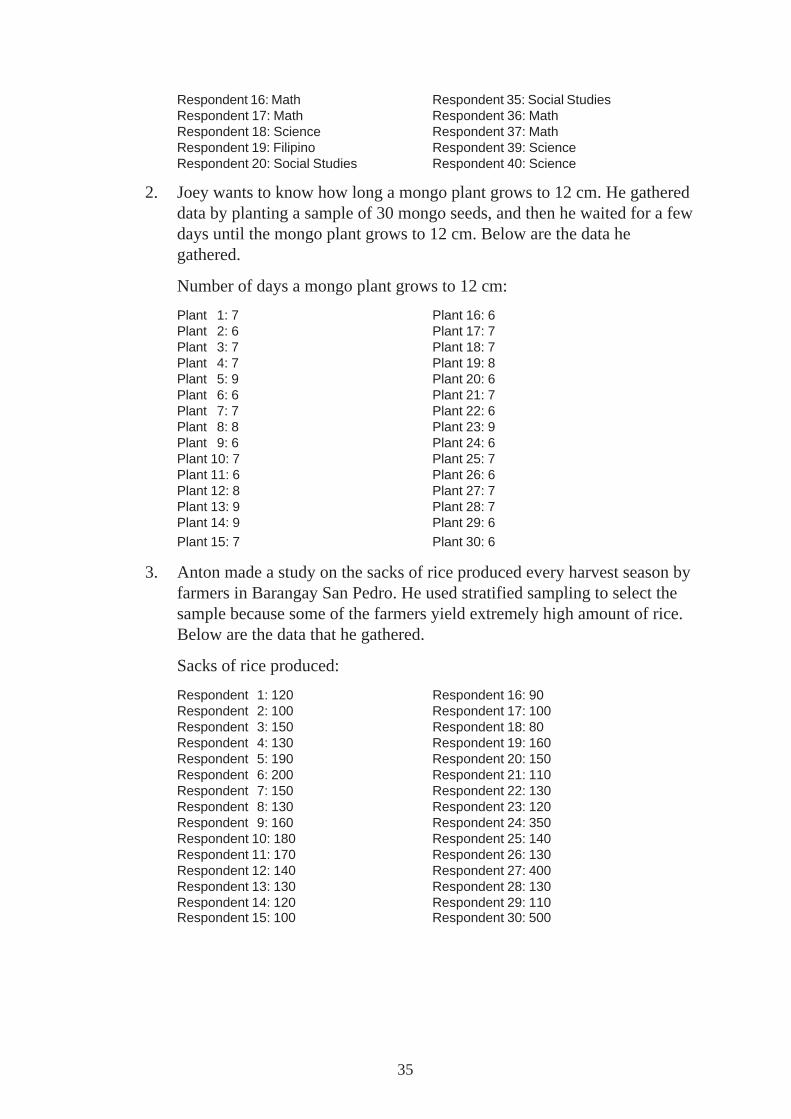
2. Joey wants to know how long a mongo plant grows to 12 cm. He gathereddata by planting a sample of 30 mongo seeds, and then he waited for a fewdays until the mongo plant grows to 12 cm. Below are the data hegathered.
Number of days a mongo plant grows to 12 cm:
Plant 1: 7 Plant 16: 6Plant 2: 6 Plant 17: 7Plant 3: 7 Plant 18: 7Plant 4: 7 Plant 19: 8Plant 5: 9 Plant 20: 6Plant 6: 6 Plant 21: 7Plant 7: 7 Plant 22: 6Plant 8: 8 Plant 23: 9Plant 9: 6 Plant 24: 6Plant 10: 7 Plant 25: 7Plant 11: 6 Plant 26: 6Plant 12: 8 Plant 27: 7Plant 13: 9 Plant 28: 7Plant 14: 9 Plant 29: 6Plant 15: 7 Plant 30: 6
3. Anton made a study on the sacks of rice produced every harvest season byfarmers in Barangay San Pedro. He used stratified sampling to select thesample because some of the farmers yield extremely high amount of rice.Below are the data that he gathered.
Sacks of rice produced:
Respondent 1: 120 Respondent 16: 90Respondent 2: 100 Respondent 17: 100Respondent 3: 150 Respondent 18: 80Respondent 4: 130 Respondent 19: 160Respondent 5: 190 Respondent 20: 150Respondent 6: 200 Respondent 21: 110Respondent 7: 150 Respondent 22: 130Respondent 8: 130 Respondent 23: 120Respondent 9: 160 Respondent 24: 350Respondent 10: 180 Respondent 25: 140Respondent 11: 170 Respondent 26: 130Respondent 12: 140 Respondent 27: 400Respondent 13: 130 Respondent 28: 130Respondent 14: 120 Respondent 29: 110Respondent 15: 100 Respondent 30: 500

36
Have you finished answering? Compare your answers to the answers below.
1. Since the data are categorical, the measure of central tendency that shouldbe used is the mode.
Number of times each subject was answered:
Math = 15Science = 11Social Studies = 7Filipino = 4English = 3
The mode is math. We can conclude that the favorite subject of elementarystudents in the school is math.
2. STEP 1 Get the variability.
Range = 9 – 6= 3
STEP 2 Determine the measure of central tendency that should be used.
3 is a low range. The best measure that we can use is the mean.
STEP 3 Get the mean.
To get the mean, we add all the days and divide the sum by thenumber of sample.
The mean is 7.
STEP 4 Conclude: It takes 7 days for a mongo seed to grow.
3. STEP 1 Get the variability.
Range = 500 – 80= 420
STEP 2 Determine the measure of central tendency that should be used.
A range of 420 is very big. To avoid the effect of variability,we should use the median to get the measure of centraltendency.
STEP 3 Get the median.
To get the median, we list the data from lowest to highest, andget the average of the 15th and 16th data. The median is 130.
STEP 4 Conclude: Farmers of Barangay San Pedro produce 130 sacksof rice.

37
Let’s Review
A. The steps in conducting a survey are given below. Which are done first?Write 1 to 8 on the blanks.
a. ____ Write the questions or queries that you want to be answered byyour sample.
b. ____ Determine the population that you will study.
c. ____ Decide on the topic that you want to research on.
d. ____ Select the sample.
e. ____ Select a method of data gathering.
f. ____ Analyze the data using the measures of variability and centraltendency.
g. ____ Gather data.
h. ____ Conclude.
B. Read the case and answer the following questions:
Glennda wants to know the average grade of her classmates in Science.
1. What was Glennda’s topic?
_________________________________________________________
2. What is the population that she will study?
_________________________________________________________
3. What is the best sampling technique that she can use to get a sampleof 30? Why?
_________________________________________________________
4. What is the question that she wants to be answered by her classmates?
_________________________________________________________
5. What is the most convenient data gathering method that she can use?Why?
_________________________________________________________
6. If Glennda got the following data, what is the measure of centraltendency that she can use to find the average grade of her classmates?Why?
_________________________________________________________

38
Respondent 1: 85 Respondent 16: 90Respondent 2: 79 Respondent 17: 83Respondent 3: 83 Respondent 18: 85Respondent 4: 84 Respondent 19: 86Respondent 5: 82 Respondent 20: 87Respondent 6: 86 Respondent 21: 84Respondent 7: 70 Respondent 22: 86Respondent 8: 90 Respondent 23: 85Respondent 9: 86 Respondent 24: 66Respondent 10: 85 Respondent 25: 85Respondent 11: 88 Respondent 26: 83Respondent 12: 87 Respondent 27: 82Respondent 13: 65 Respondent 28: 81Respondent 14: 88 Respondent 29: 85Respondent 15: 86 Respondent 30: 86
7. Show the solution in computing for the average.
8. What can you conclude from the analysis?
_________________________________________________________
C. Make a study using the following topics. Write a report in paragraph formabout your research on each topic. Divide the report into 4 sections: I.Conceptualization and Planning; II. Data Gathering; III. Analysis; and IV.Conclusion.
1. Make a study on whether or not residents in your barangay agree ondivorce.
2. Make a study on the average number of children each family in yourbarangay has.
Have you finished answering? Compare your answers to the Answer Key on pages47–49.

39
Let’s Remember
♦ Survey – a study that uses a sample♦ Census – a study that uses a population♦ Steps in conducting a survey:
I. Conceptualization and Planning
A. Select a topic to research on.B. Determine the population that you will study.C. Select the best sampling technique that you will use to select the
sample.D. Determine the sample size, and select the sample.
II. Data Gathering
A. Write down your questions and queries.B. Determine the method of data gathering that you will use.
1. Interview2. Questionnaire3. Observation4. Experimentation
C. Gather data.
III. Analysis
A. Get the variability (Range)B. Determine the measure of central tendency that you will use.C. Get the central tendency.
IV. Conclude.
Let’s See What You Have Learned
A. Write T if the statement is true or F if the statement is false.
1. ____ A survey is a study that uses a population.
2. ____ Experimentation is a method of data gathering that controls andobserves the sample.
3. ____ The mode is used only on categorical data.
4. ____ If the data has a high variability, it is best to use the median.
5. ____ In using the mean, the lowest and the highest data affects thecentral tendency greatly.
40
B. Read the case and answer the following questions:
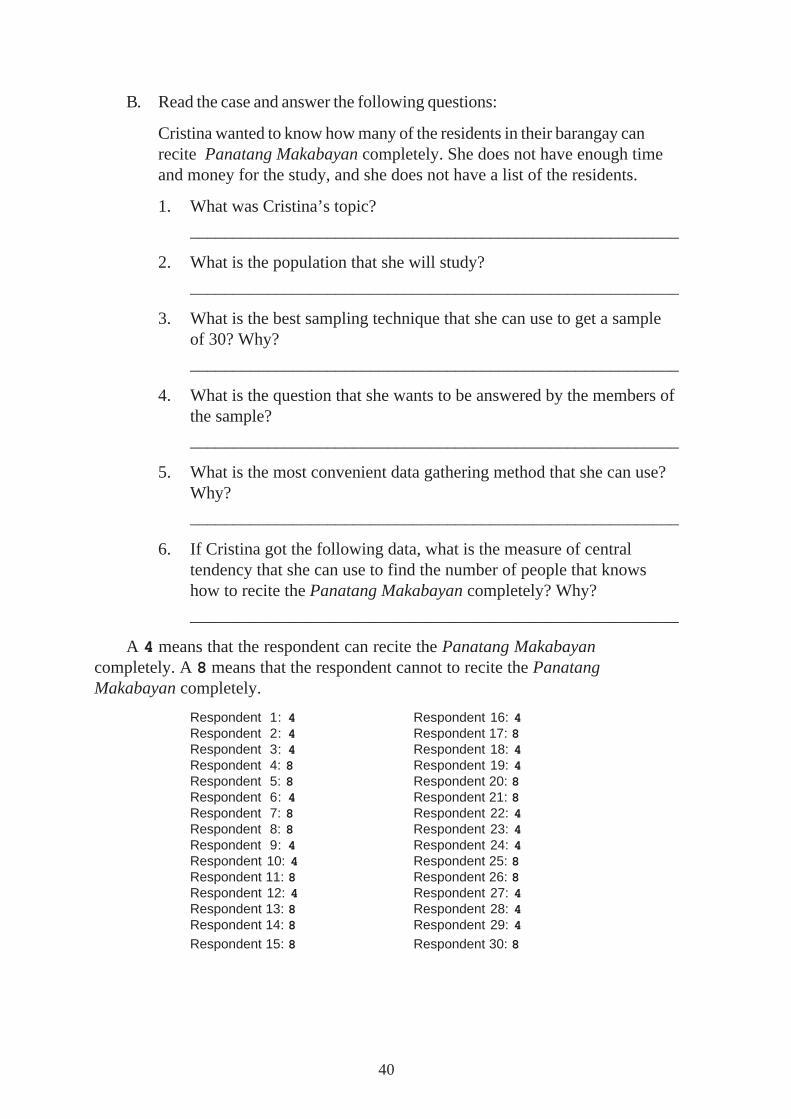
Cristina wanted to know how many of the residents in their barangay canrecite Panatang Makabayan completely. She does not have enough timeand money for the study, and she does not have a list of the residents.
1. What was Cristina’s topic?
_________________________________________________________
2. What is the population that she will study?
_________________________________________________________
3. What is the best sampling technique that she can use to get a sampleof 30? Why?
_________________________________________________________
4. What is the question that she wants to be answered by the members ofthe sample?
_________________________________________________________
5. What is the most convenient data gathering method that she can use?Why?
_________________________________________________________
6. If Cristina got the following data, what is the measure of centraltendency that she can use to find the number of people that knowshow to recite the Panatang Makabayan completely? Why?
_________________________________________________________
A 4 means that the respondent can recite the Panatang Makabayancompletely. A 8 means that the respondent cannot to recite the PanatangMakabayan completely.
Respondent 1: 4 Respondent 16: 4Respondent 2: 4 Respondent 17: 8Respondent 3: 4 Respondent 18: 4Respondent 4: 8 Respondent 19: 4Respondent 5: 8 Respondent 20: 8Respondent 6: 4 Respondent 21: 8Respondent 7: 8 Respondent 22: 4Respondent 8: 8 Respondent 23: 4Respondent 9: 4 Respondent 24: 4Respondent 10: 4 Respondent 25: 8Respondent 11: 8 Respondent 26: 8Respondent 12: 4 Respondent 27: 4Respondent 13: 8 Respondent 28: 4Respondent 14: 8 Respondent 29: 4Respondent 15: 8 Respondent 30: 8

41
7. Show the solution in computing for the average.
8. What can you conclude from the analysis?
_________________________________________________________
C. Make a study using the following topics. Write a report in paragraph formabout your research on each topic. Divide the report into 4 sections: I.Conceptualization and Planning; II. Data Gathering; III. Analysis; and IV.Conclusion.
1. Find the average budget allocated to food by the residents in yourbarangay.
2. Find the average price of rice per kilo in your barangay.
Have you finished answering? Compare your answers to the Answer Key onpage 49.
42
Let’s Remember
We have already finished the module. Now let’s review what you learned.
♦ A population is a group of persons or things that will be studied, while asample is only a part of the population.
♦ A parameter is a characteristic of a population while a statistic is acharacteristic of the sample.
♦ Sampling is the process of selecting a sample to represent the wholepopulation.
♦ The two kinds of errors are random sampling error and bias.
♦ Probability sampling bases the selection of a sample on chance ofoccurrence or probability.
Subtypes:
1. Simple random sampling2. Stratified random sampling3. Systematic random sampling4. Cluster sampling
♦ Non-probability sampling bases the selection of a sample on convenienceand accessibility.
Subtypes:
1. Accidental or incidental sampling2. Quota sampling3. Purposive sampling
♦ A survey is a study that uses a sample while a census is a study that uses apopulation.
♦ Steps in conducting a survey.
1. Conceptualization and planning
– selection of topic, population and sample
2. Data gathering
3. Analysis
– computations using statistical measures
4. Conclusion
43
What Have You Learned?
A. Fill in the blanks.
1. _______________ occurs when the researcher makes a faultyselection of the sample.
2. A _______________ is a characteristic of the population.
3. A _______________ is a group of persons or things that will bestudied.
4. A _______________ is the process of selecting a sample.
5. A _______________ is a part of the population
B. Choose among the answers listed in the box. Write the letter of the correctanswer.
1. ________________ gives the members of a population equal chancesof being selected and it works well in a smallpopulation
2. ________________ uses a number to systematically select membersof the sample.
3. ________________ bases the selection of the sample on convenienceand accessibility.
4. ________________ divides the population into strata, and selects asample from these based on convenience andaccessibility.
5. ________________ selects the sample based on specific traits neededby the study.
a. simple random sampling f. stratified random samplingb. probability sampling g. systematic random samplingc. cluster sampling h. non-probability samplingd. accidental sampling i. quota samplinge. purposive sampling
C. Read the case and answer the following questions.
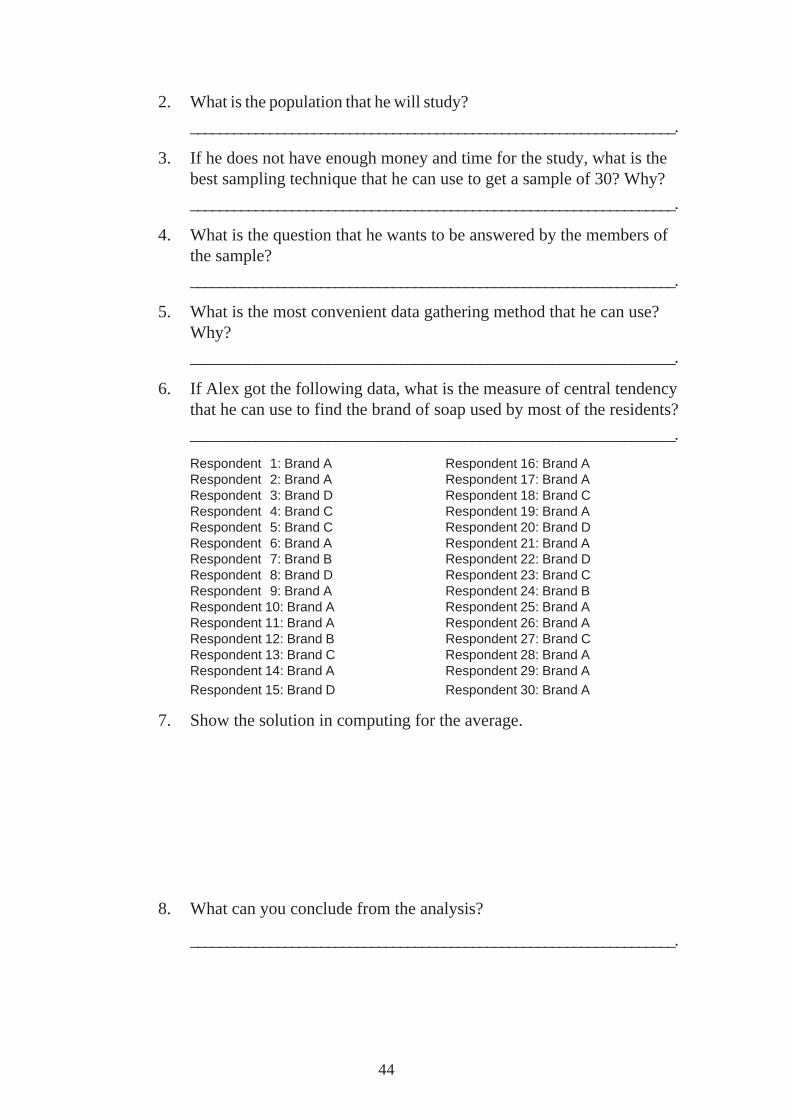
Alex wanted to know the brand of soap used by most of the residents oftheir barangay.
1. What is Alex’s topic?
___________________________________________________________________.
44
2. What is the population that he will study?
___________________________________________________________________.
3. If he does not have enough money and time for the study, what is thebest sampling technique that he can use to get a sample of 30? Why?
___________________________________________________________________.
4. What is the question that he wants to be answered by the members ofthe sample?
___________________________________________________________________.
5. What is the most convenient data gathering method that he can use?Why?
___________________________________________________________________.
6. If Alex got the following data, what is the measure of central tendencythat he can use to find the brand of soap used by most of the residents?
___________________________________________________________________.
Respondent 1: Brand A Respondent 16: Brand ARespondent 2: Brand A Respondent 17: Brand ARespondent 3: Brand D Respondent 18: Brand CRespondent 4: Brand C Respondent 19: Brand ARespondent 5: Brand C Respondent 20: Brand DRespondent 6: Brand A Respondent 21: Brand ARespondent 7: Brand B Respondent 22: Brand DRespondent 8: Brand D Respondent 23: Brand CRespondent 9: Brand A Respondent 24: Brand BRespondent 10: Brand A Respondent 25: Brand ARespondent 11: Brand A Respondent 26: Brand ARespondent 12: Brand B Respondent 27: Brand CRespondent 13: Brand C Respondent 28: Brand ARespondent 14: Brand A Respondent 29: Brand ARespondent 15: Brand D Respondent 30: Brand A
7. Show the solution in computing for the average.
8. What can you conclude from the analysis?
___________________________________________________________________.

45
Answer Key
A. Let’s See What You Already Know (pages 2–3)
A. 1. F2. T3. F4. T5. T
B. 1. Probability sampling2. Stratified random sampling3. Cluster sampling4. Accidental or incidental sampling5. Purposive sampling
C. 1. Juan’s topic is about the about the average score of grade fivestudents in a science examination.
2. The population that he wanted to study was the grade fivestudents.
3. Since he is not limited by time or money, Juan can choose amongprobability sampling techniques. The best sampling techniquethat he can use is systematic random sampling since he has a listof all the students; there are no groups in the population that cansignificantly affect the outcome; and it works best in a bigpopulation.
4. The best data gathering method that he can use is an interviewsince he only has one question to ask, and since the sample issmall.
5. The measure of central tendency that he should use is the mediansince the data has high variability. The range of the data is 95 –65 = 30.
6. List all the data from the lowest to the highest.
65 8566 8567 8570 8579 8680 8681 8682 8683 8683 8783 8884 9084 9085 9585 97
Select the middle data. The median is 85

46
7. The average score of grade five students in the scienceexamination is 85.
B. Lesson 1
Let’s See What You Have Learned (paged 11–12)
A. 1. parameter2. sampling error3. bias4. random sampling error5. sample
B. 1. Population: grade six students
Parameter: average height – 4 feet and 5 inches Sample:100 grade six students Statistic: average height – 4 feet and 7 inches
2. Population: voters in Marikina city
Parameter: percentage of voters who based voting on popularity– 70%
Sample: 2000 of the voters in Marikina city
Statistic: percentage of voters who based voting on popularity –60%
C. 1. The sample has 150 members. It is representative of thepopulation because it has more than 30 members.
2. The barangay captain used a sample because the barangay doesnot have enough money to make a study on the whole population.
3. The barangay captain can make the result closer to the parameterif he will increase the sample size.
4. The barangay captain committed random sampling error, which ispresent in all studies that use sampling. He also committed biasbecause he chose more farmers who farm in a more fertile land.
C. Lesson 2
Let’s See What You Have Learned (pages 26–17)
A. 1. F2. T3. F4. T5. T
47
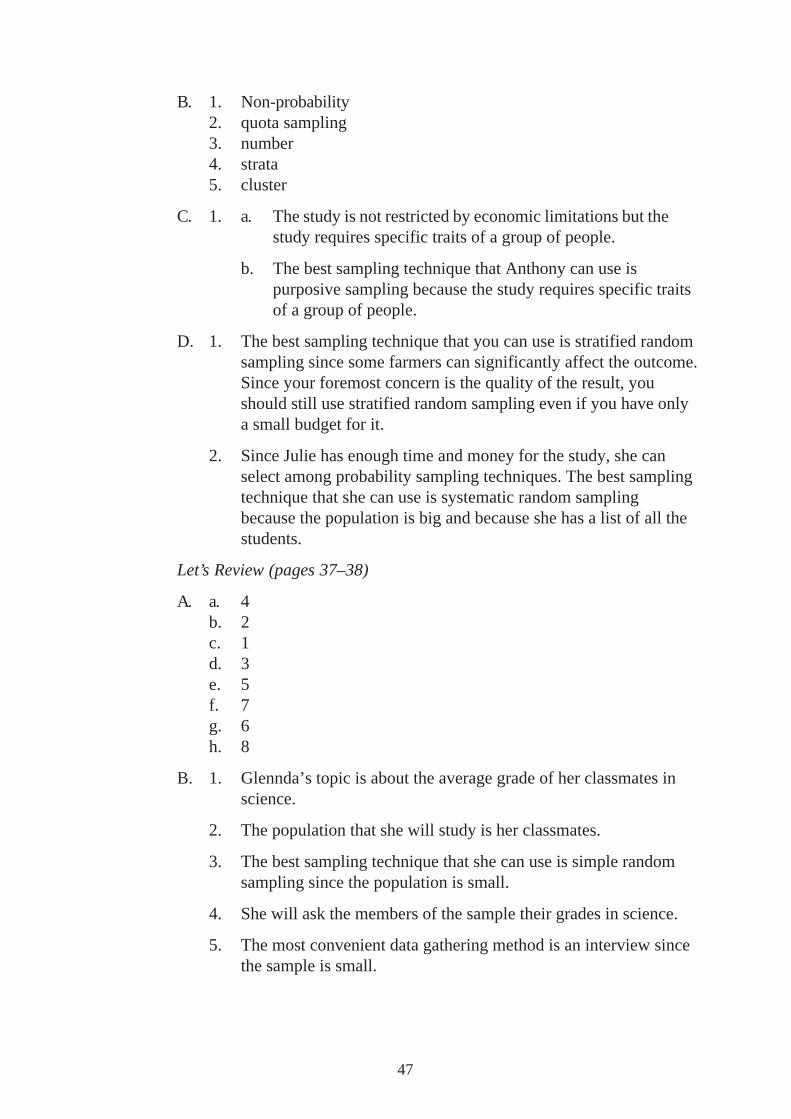
B. 1. Non-probability2. quota sampling3. number4. strata5. cluster
C. 1. a. The study is not restricted by economic limitations but thestudy requires specific traits of a group of people.
b. The best sampling technique that Anthony can use ispurposive sampling because the study requires specific traitsof a group of people.
D. 1. The best sampling technique that you can use is stratified randomsampling since some farmers can significantly affect the outcome.Since your foremost concern is the quality of the result, youshould still use stratified random sampling even if you have onlya small budget for it.
2. Since Julie has enough time and money for the study, she canselect among probability sampling techniques. The best samplingtechnique that she can use is systematic random samplingbecause the population is big and because she has a list of all thestudents.
Let’s Review (pages 37–38)
A. a. 4b. 2c. 1d. 3e. 5f. 7g. 6h. 8
B. 1. Glennda’s topic is about the average grade of her classmates inscience.
2. The population that she will study is her classmates.
3. The best sampling technique that she can use is simple randomsampling since the population is small.
4. She will ask the members of the sample their grades in science.
5. The most convenient data gathering method is an interview sincethe sample is small.
48
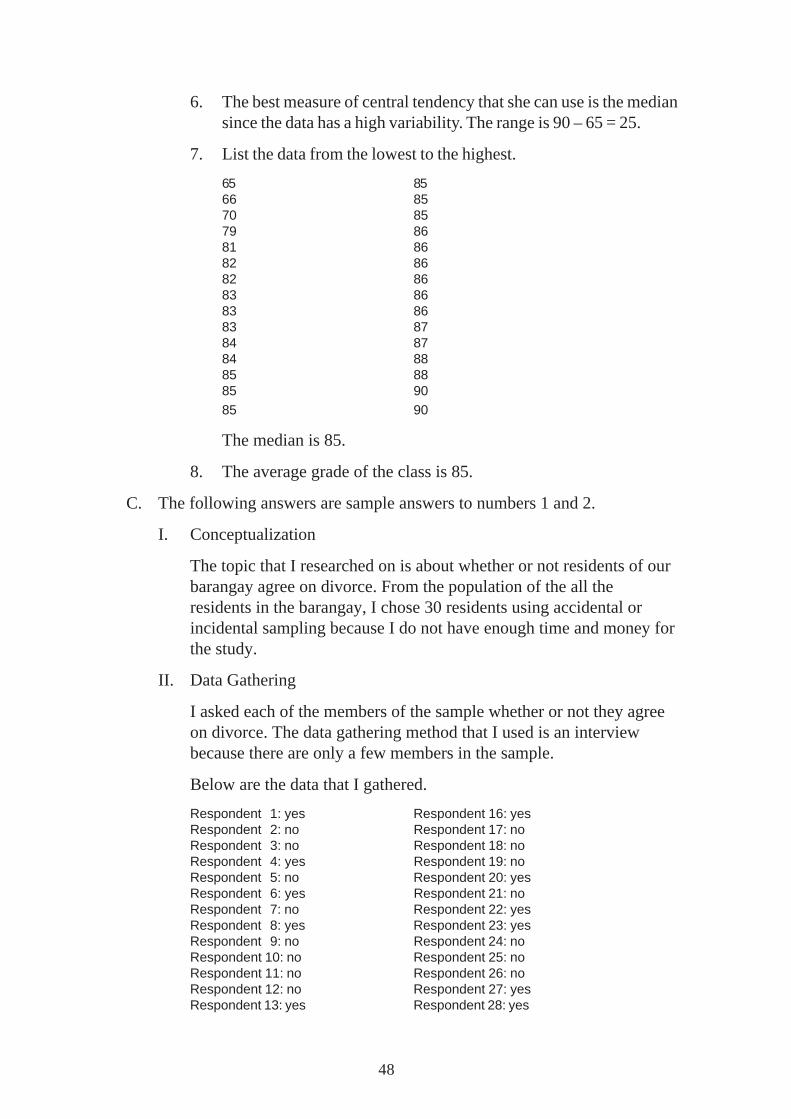
6. The best measure of central tendency that she can use is the mediansince the data has a high variability. The range is 90 – 65 = 25.
7. List the data from the lowest to the highest.
65 8566 8570 8579 8681 8682 8682 8683 8683 8683 8784 8784 8885 8885 9085 90
The median is 85.
8. The average grade of the class is 85.
C. The following answers are sample answers to numbers 1 and 2.
I. Conceptualization
The topic that I researched on is about whether or not residents of ourbarangay agree on divorce. From the population of the all theresidents in the barangay, I chose 30 residents using accidental orincidental sampling because I do not have enough time and money forthe study.
II. Data Gathering
I asked each of the members of the sample whether or not they agreeon divorce. The data gathering method that I used is an interviewbecause there are only a few members in the sample.
Below are the data that I gathered.
Respondent 1: yes Respondent 16: yesRespondent 2: no Respondent 17: noRespondent 3: no Respondent 18: noRespondent 4: yes Respondent 19: noRespondent 5: no Respondent 20: yesRespondent 6: yes Respondent 21: noRespondent 7: no Respondent 22: yesRespondent 8: yes Respondent 23: yesRespondent 9: no Respondent 24: noRespondent 10: no Respondent 25: noRespondent 11: no Respondent 26: noRespondent 12: no Respondent 27: yesRespondent 13: yes Respondent 28: yes

49
Respondent 14: no Respondent 29: noRespondent 15: yes Respondent 30: no
III. Analysis
Since the data is categorical, I used the mode to measure the centraltendency of the data. There are 12 people who agreed on divorce and18 who did not.
IV. Conclusion
Most of the residents in the barangay does not agree on divorce.
Let’s See What You Have Learned (pages 39–41)
A. 1. F2. T3. F4. T5. T
B. 1. Cristina’s topic is about the number of the residents in theirbarangay who can recite Panatang Makabayan completely.
2. The population that she will study is the residents in theirbarangay.
3. The best sampling technique that she can use is accidental orincidental sampling since she is limited by time and money, andbecause she does not have a list of the residents.
4. The most convenient data gathering that she can use is aninterview because the sample only has a few members.
5. Since the data is categorical, the best measure of central tendencythat she can use is the mode.
6. Write how many residents can recite Panatang Makabayancompletely and how many can not.
4 = 16
8 = 14
The mode is 4.
7. Most of the residents in their barangay can recite PanatangMakabayan completely.
C. There are no answers provided. See the sample answer for the Let’sReview answer key, part C.
50
D. What Have You Learned (pages 43–44)
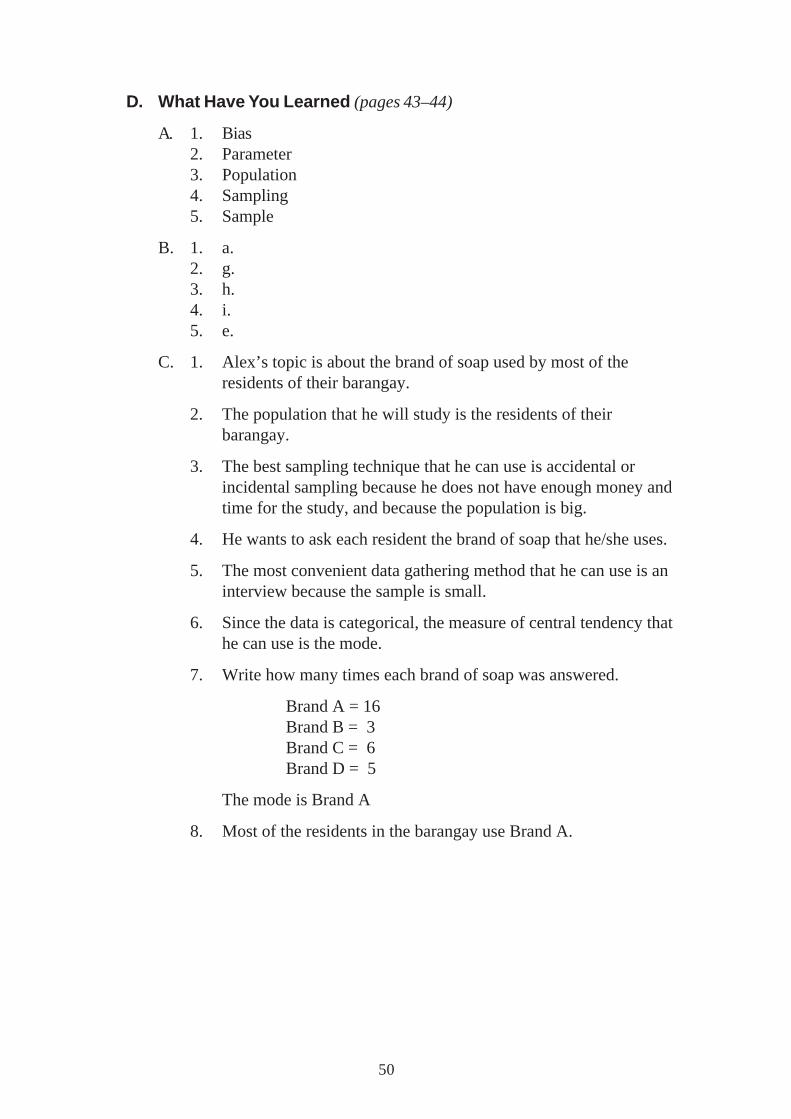
A. 1. Bias2. Parameter3. Population4. Sampling5. Sample
B. 1. a.2. g.3. h.4. i.5. e.
C. 1. Alex’s topic is about the brand of soap used by most of theresidents of their barangay.
2. The population that he will study is the residents of theirbarangay.
3. The best sampling technique that he can use is accidental orincidental sampling because he does not have enough money andtime for the study, and because the population is big.
4. He wants to ask each resident the brand of soap that he/she uses.
5. The most convenient data gathering method that he can use is aninterview because the sample is small.
6. Since the data is categorical, the measure of central tendency thathe can use is the mode.
7. Write how many times each brand of soap was answered.
Brand A = 16Brand B = 3Brand C = 6Brand D = 5
The mode is Brand A
8. Most of the residents in the barangay use Brand A.