Embed Size (px)
Citation preview
What is Statistics?
Chapter 1
2
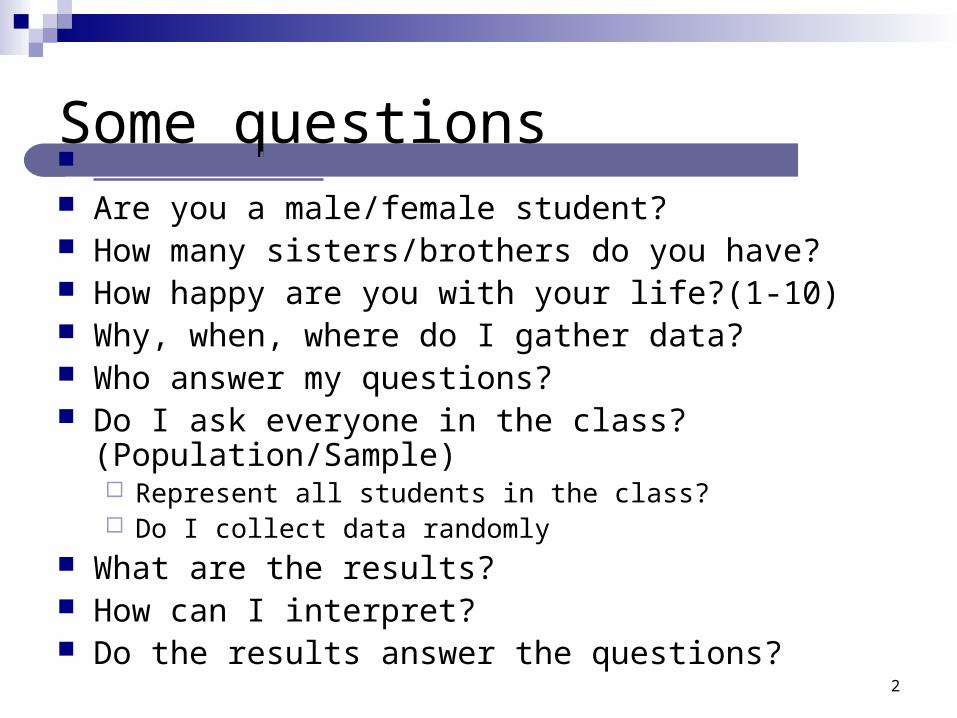
Some questions Collect data Are you a male/female student? How many sisters/brothers do you have? How happy are you with your life?(1-10) Why, when, where do I gather data? Who answer my questions? Do I ask everyone in the class? (Population/Sample)
Represent all students in the class? Do I collect data randomly
What are the results? How can I interpret? Do the results answer the questions?
3
Assignment
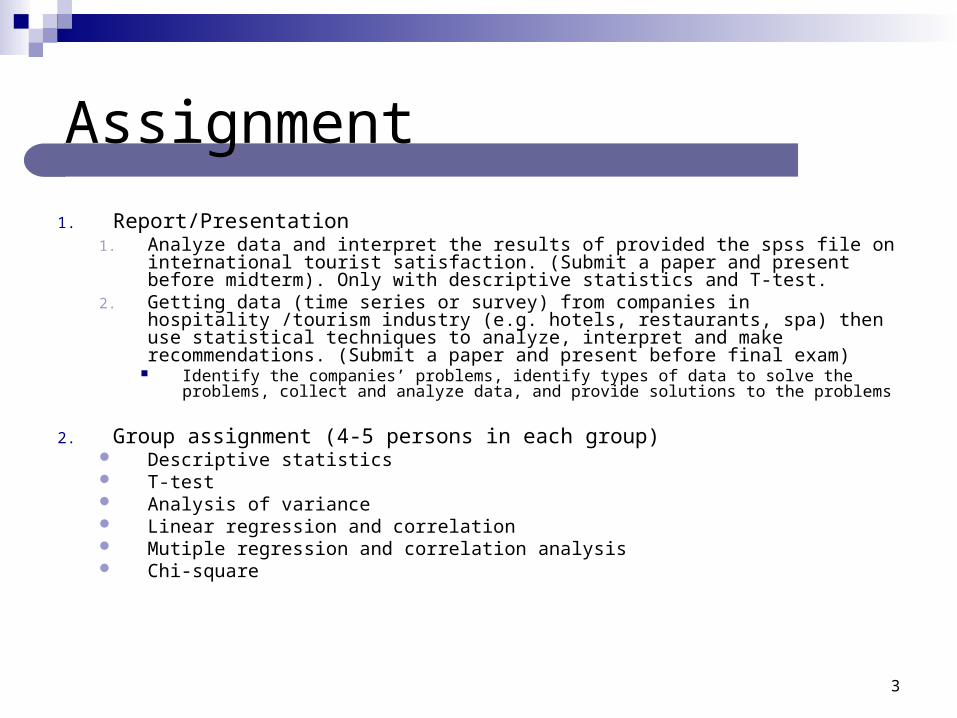
1. Report/Presentation1. Analyze data and interpret the results of provided the spss file on international
tourist satisfaction. (Submit a paper and present before midterm). Only with descriptive statistics and T-test.
2. Getting data (time series or survey) from companies in hospitality /tourism industry (e.g. hotels, restaurants, spa) then use statistical techniques to analyze, interpret and make recommendations. (Submit a paper and present before final exam)
Identify the companies’ problems, identify types of data to solve the problems, collect and analyze data, and provide solutions to the problems
2. Group assignment (4-5 persons in each group) Descriptive statistics T-test Analysis of variance Linear regression and correlation Mutiple regression and correlation analysis Chi-square

4
Generally to make “decision” Statistical techniques are used to
make decisions that affect our daily lives (without knowing it)Choose the universityTo Buy a car or a houseChoose common stock from the stock markets
Why Study Statistics?

5
Why Study Statistics?
Numerical information is everywhere No matter what your career, you will
make professional decisions that involve data
6
Data Analysis Process
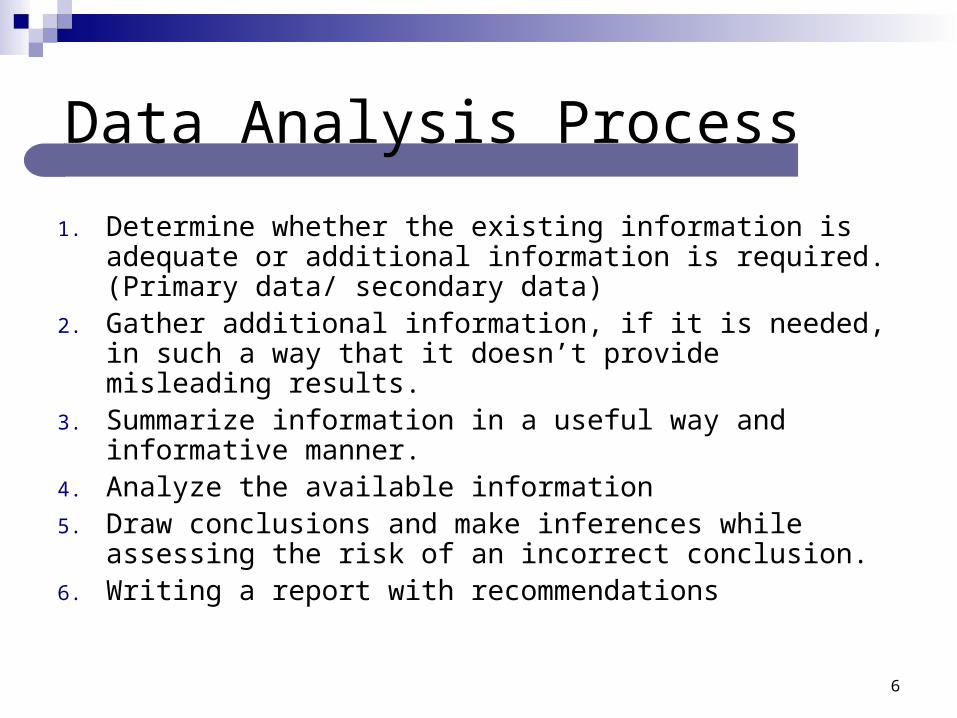
1. Determine whether the existing information is adequate or additional information is required. (Primary data/ secondary data)
2. Gather additional information, if it is needed, in such a way that it doesn’t provide misleading results.
3. Summarize information in a useful way and informative manner.
4. Analyze the available information5. Draw conclusions and make inferences while assessing
the risk of an incorrect conclusion.6. Writing a report with recommendations
7
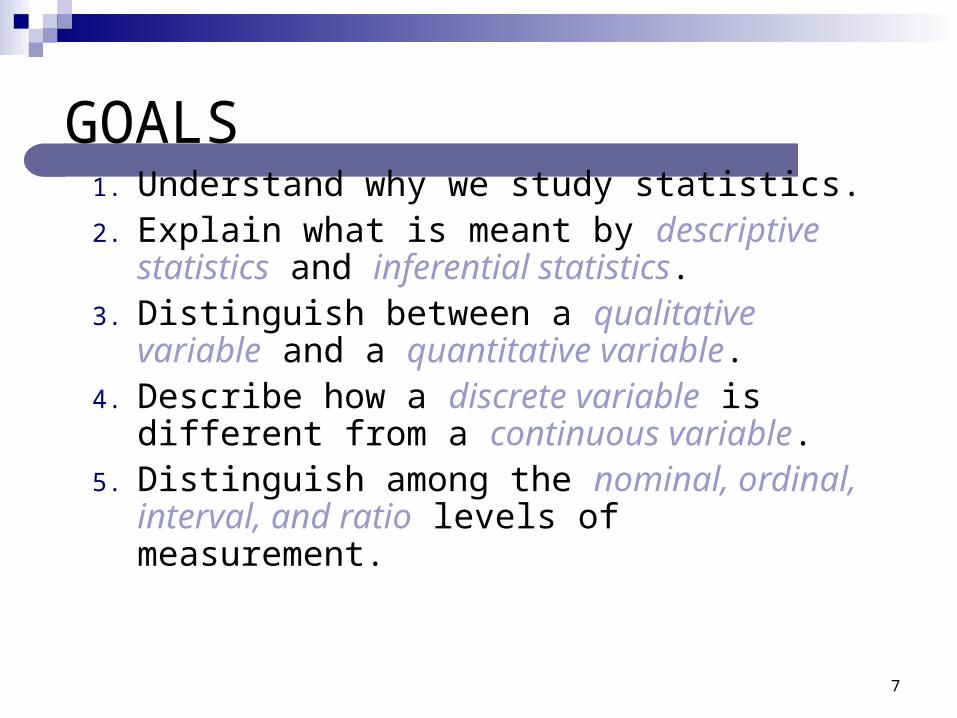
GOALS1. Understand why we study statistics.2. Explain what is meant by descriptive
statistics and inferential statistics.3. Distinguish between a qualitative variable
and a quantitative variable.4. Describe how a discrete variable is
different from a continuous variable.5. Distinguish among the nominal, ordinal,
interval, and ratio levels of measurement.

8
What is Meant by Statistics?
Statistics is the science of collecting, organizing, presenting, analyzing, and interpreting numerical data to assist in making more effective decisions.
9
Examples Stock analysts have to evaluate many aspects of a particular
stock before recommending to “buy” or “sell” for investors. Hotel/Airline managers have to decide the proper promotions
or packages to attract customers for the low season. Thai government has to decide whether to provide how
much funding for Ministry of Tourism and Sports to better support tourism industry.
Managers must make decisions about the quality of their product and services. (How to measure the quality of their products?)Lab test?customer satisfaction index?

10
Types of Statistics – Descriptive Statistics
Descriptive Statistics - Methods of organizing, summarizing, and presenting data in an informative way.
11
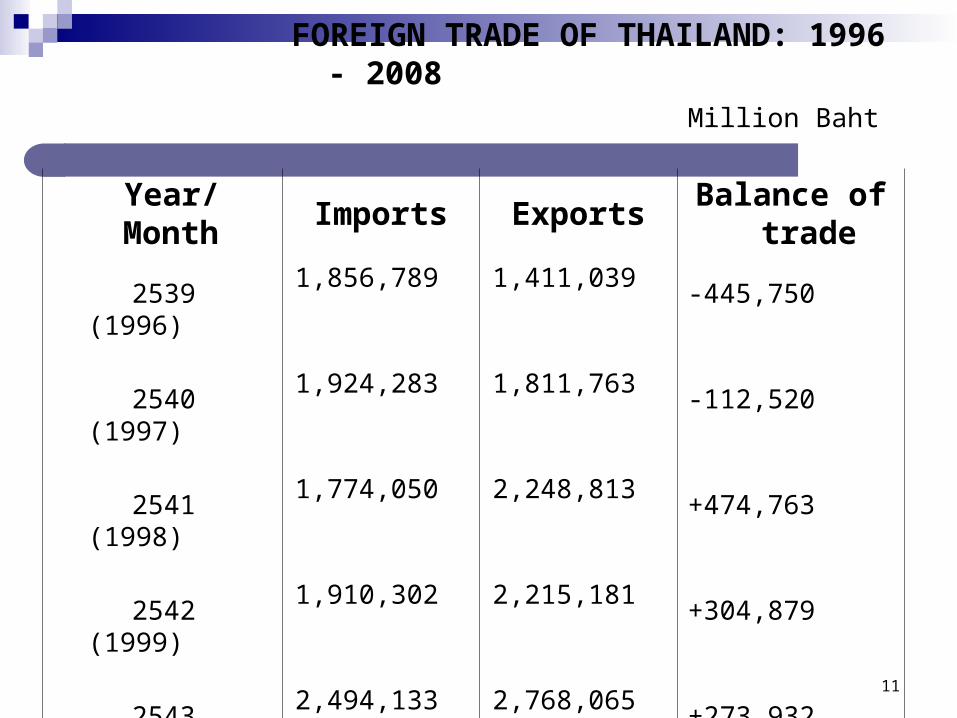
FOREIGN TRADE OF THAILAND:
1996 - 2008Million Baht
Year/ Month
Imports ExportsBalance of
trade
2539 (1996) 1,856,789
1,411,039
-445,750
2540 (1997) 1,924,283
1,811,763
-112,520
2541 (1998) 1,774,050
2,248,813
+474,763
2542 (1999) 1,910,302
2,215,181
+304,879
2543 (2000) 2,494,133
2,768,065
+273,932
2544 (2001) 2,755,308
2,884,703
+129,395
2545 (2002) 2,774,840
2,923,941
+149,101
2546 (2003) 3,137,924
3,326,015
+188,091
2547 (2004) 3,839,753
3,922,431
+82,678
2548 (2005) 4,756,000
4,436,676
-319,324
2549 (2006) 4,870,954
4,938,508
+67,554
2550 (2007) 4,871,996
5,254,999
+383,003

12
Inferential Statistics: The methods used to estimate a property of a population on the basis of a sample.Finding something about a population from a
sample taken from that population.
Types of Statistics – Inferential Statistics

13
Population versus Sample
A population is the entire set of individuals or objects of interest or the measurements obtained from all individuals or objects of interest. A sample is a portion, or part, of the population of interest

14
Population VS Sample
People in the ABAC poll (Population or Sample?)
TIM students vs MUIC students (TIM students representing MUIC?)
Possibility of collecting data from population vs. sample
15
Why use samples?
Cost Possibility to find all population Time
Further questions for using samplesHow many are enough?How to select sample from the population?
16
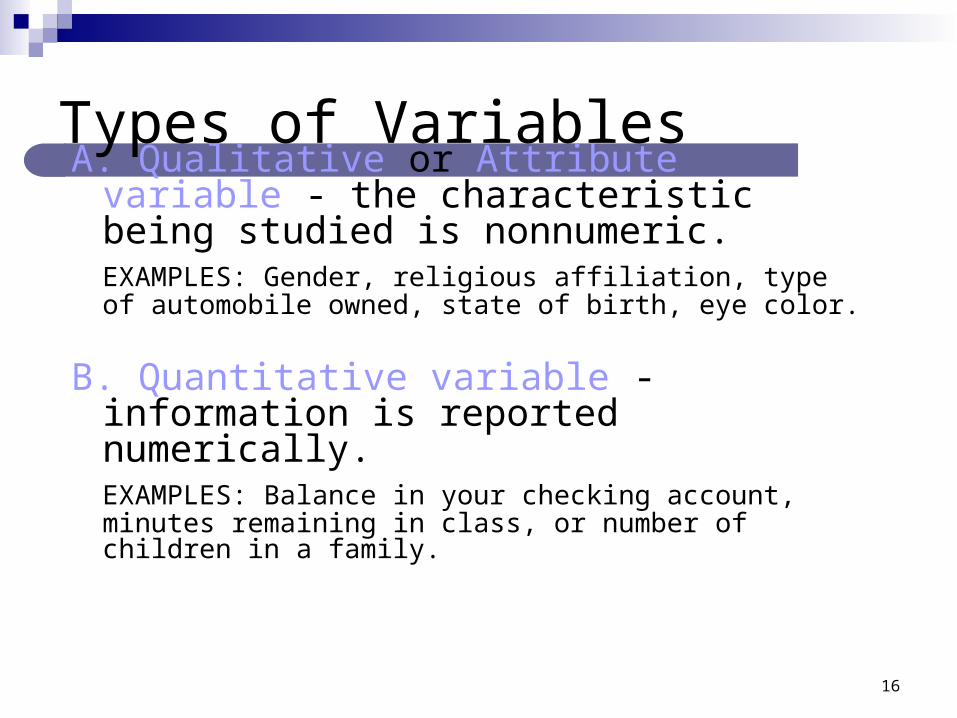
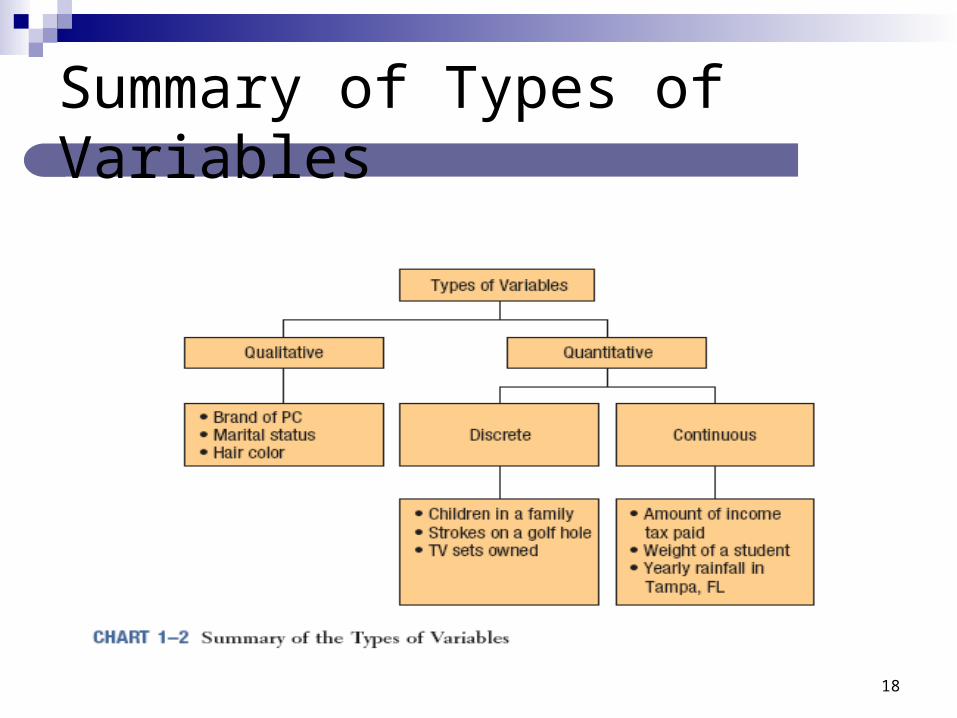
Types of Variables A. Qualitative or Attribute variable - the
characteristic being studied is nonnumeric. EXAMPLES: Gender, religious affiliation, type of automobile owned, state of birth, eye color.
B. Quantitative variable - information is reported numerically. EXAMPLES: Balance in your checking account, minutes remaining in class, or number of children in a family.
17
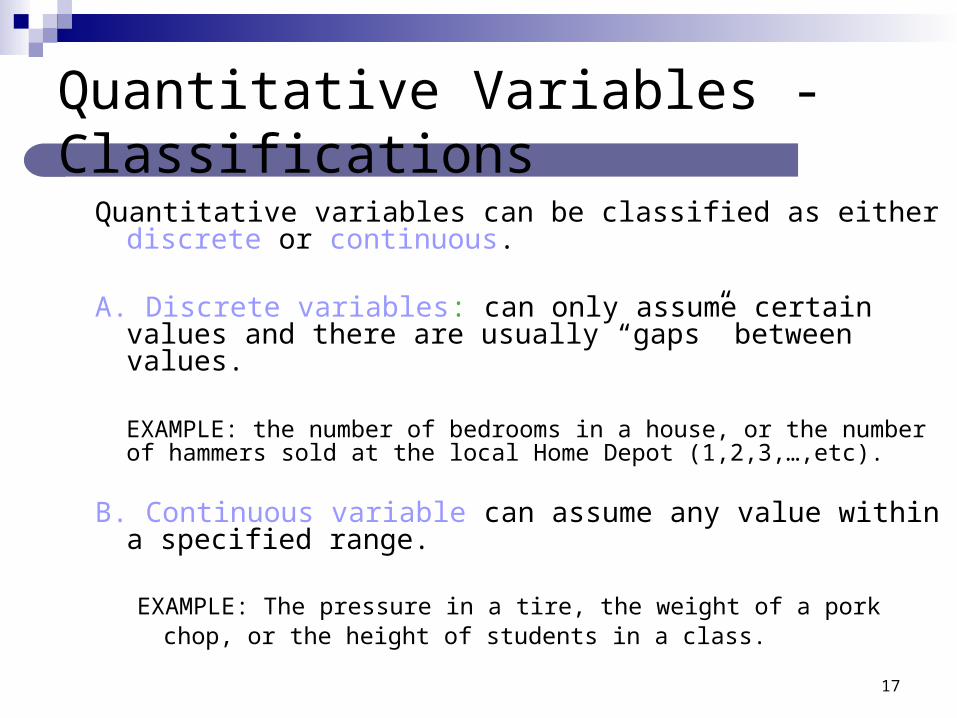
Quantitative Variables - Classifications
Quantitative variables can be classified as either discrete or continuous.
A. Discrete variables: can only assume certain values and there are usually “gaps” between values.
EXAMPLE: the number of bedrooms in a house, or the number of hammers sold at the local Home Depot (1,2,3,…,etc).
B. Continuous variable can assume any value within a specified range.
EXAMPLE: The pressure in a tire, the weight of a pork chop, or the height of students in a class.
18
Summary of Types of Variables
19
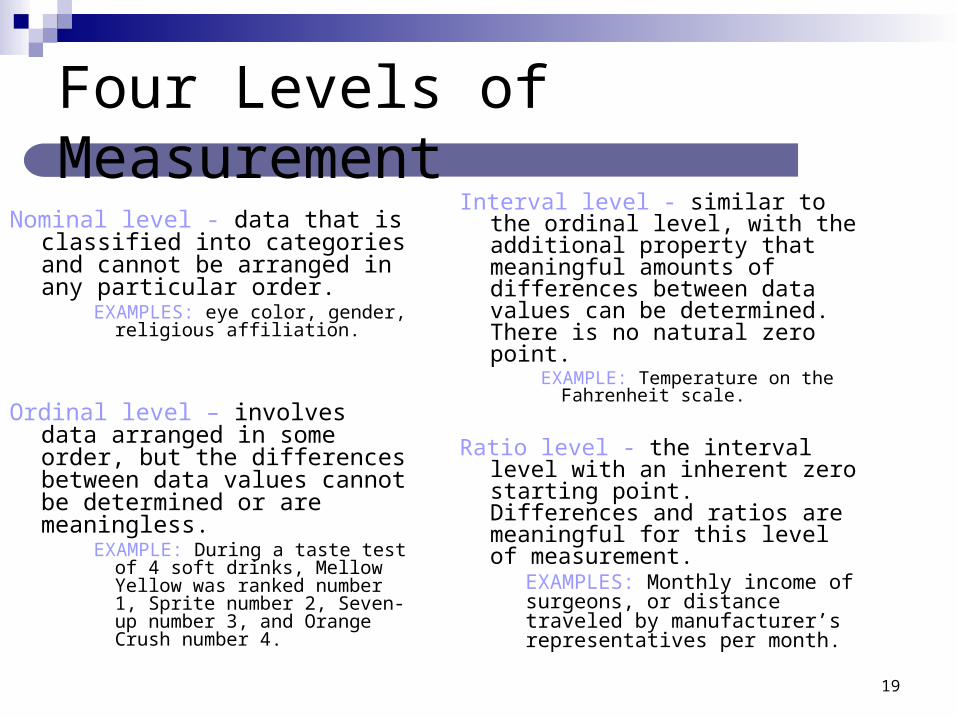
Four Levels of Measurement
Nominal level - data that is classified into categories and cannot be arranged in any particular order.
EXAMPLES: eye color, gender, religious affiliation.
Ordinal level – involves data arranged in some order, but the differences between data values cannot be determined or are meaningless.
EXAMPLE: During a taste test of 4 soft drinks, Mellow Yellow was ranked number 1, Sprite number 2, Seven-up number 3, and Orange Crush number 4.
Interval level - similar to the ordinal level, with the additional property that meaningful amounts of differences between data values can be determined. There is no natural zero point.
EXAMPLE: Temperature on the Fahrenheit scale.
Ratio level - the interval level with an inherent zero starting point. Differences and ratios are meaningful for this level of measurement.
EXAMPLES: Monthly income of surgeons, or distance traveled by manufacturer’s representatives per month.

20
Summary of the Characteristics for Levels of Measurement
21
Review
Statistics for decision makingNot statistics for just calculationCalculation without understanding is useless.
Sample vs. Population Quantitative vs. Qualitative variables Nominal, ordinal, interval, and ratio as levels of
measurement..Age can be ordinal and ratio?What is the most useful level of measurement?

22
Self-test
True / False Questions
- A population is a collection of all individuals, objects, or measurements of interest.
- A sample is a portion or part of the population of interest.
- To infer something about a population, we usually take a sample from the population.

23
- Ordinal level of measurement is considered the "lowest" level of measurement.
- A store asks shoppers for their zip code to identify market areas. Zip codes are an
example of ratio data.
- Ordinal level of measurement implies some sort of ranking.

24
- Data that can only be classified into categories is nominal data.
- The words descriptive statistics and inferential statistics can be used interchangeably.
- A marketing research agency was hired to test a new DVD player. Consumers rated
it outstanding, very good, fair or poor. The level of measurement for this experiment is ordinal.

25
- Categorizing voters as Democrats, Republicans and Independents is an example of interval level measurement.
- The order that runners finish in a race would be an example of continuous data.
- The Union of Electrical Workers with 9,128 members polled 362 members regarding a new wage package to be submitted to management. The population is the 362 members.

26
- Based on a sample of 3,000 people, the civilian unemployment rate in the United States was 5.5%. “5.5%” is a statistic.
- The principal difference between the interval and ratio scale is that
the ratio scale has a meaningful zero point.
- The number of children in a family is a discrete variable.

27
Introduction to SPSS
Statistical Package for the Social Sciences Other software; Eview, Stata, Statistica,
Lisrel, EQS, AMOS, MPLUS, MINITAB

28
Data view of SPSS

29
Indicating Data View

30
To see Variable View
31
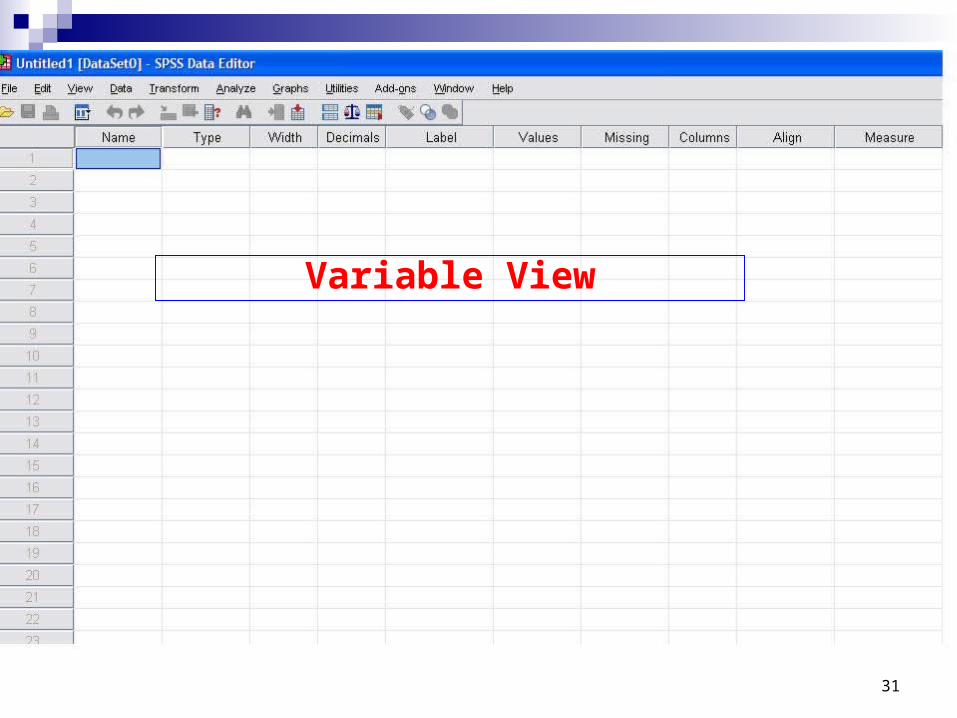
Variable View

32
Introduction to SPSS software
SPSS is a software package used for conducting statistical analyses, manipulating data, and generating tables and graphs that summarize data.
Statistical analyses range from basic descriptive statistics, such as averages and frequencies, to advanced inferential statistics, such as regression models, analysis of variance, and factor analysis.
SPSS also contains several tools for manipulating data, including functions for recoding data and computing new variables, as well as for merging and aggregating datasets.

33
The Data Editor (.sav)
The Data Editor window displays the contents of the working dataset. It is arranged in a spreadsheet format that contains variables in columns and cases in rows.
1) The Data View is the sheet that is visible when you first open the Data Editor; this sheet contains the data.
2) The Variable View is the sheet that contains information about the variables in the dataset.

34
From the menu in the Data Editor window, choose the following menu options: File → Open → Data...
The Open File dialog box should automatically open to the SPSS directory of example files. Choose Employee data.sav from the list and click Open. Your Data Editor should now look like this:

35
End of Chapter 1