Embed Size (px)
Citation preview

What is Statistics?

2
Some questions Collect data Are you a male/female student? How many sisters/brothers do you have?_____ How often do you exercise?
Never(1); rarely(2); often (3); always (4) How happy are you with your life?
(Very low (1) Very high (10))

3
Some questions Why, when, where do I gather data? Who answer my questions? Do I ask everyone in the class? (Population/Sample)
Represent all students in the class? Do I collect data randomly
What are the results? How can I interpret? Do the results answer the questions?

4
Assignment
1. Report/Presentation1. Analyze data and interpret the results of provided the spss file on international tourist
satisfaction. (Submit a paper and present before midterm). Only with descriptive statistics, T-test, and ANOVA .
2. Analyze data with statistical techniques (e.g. multiple regression, chi-square) from the same datasets and interview a company in hospitality /tourism industry (e.g. hotels, restaurants, spa) and make recommendations. (Submit a paper and present before final exam)
Identify the companies’ problems, identify types of data to solve the problems, collect and analyze data, and provide solutions to the problems
2. Group assignment (4-5 persons in each group) Descriptive statistics T-test Analysis of variance Multiple regression and correlation analysis Chi-square Other special topics

Results of Research on International Tourists in Thailand
In this study, the author used 439 samples of international tourists from 37 countries.
Data collection was conducted at the Suvarnabhumi Airport.
For the demographic aspects of the respondents, 58.4% are male and 41.6% are female tourists. 69.7% graduated at the bachelor’s degree or higher. More than 70% of tourists aged between 21-40 years old.
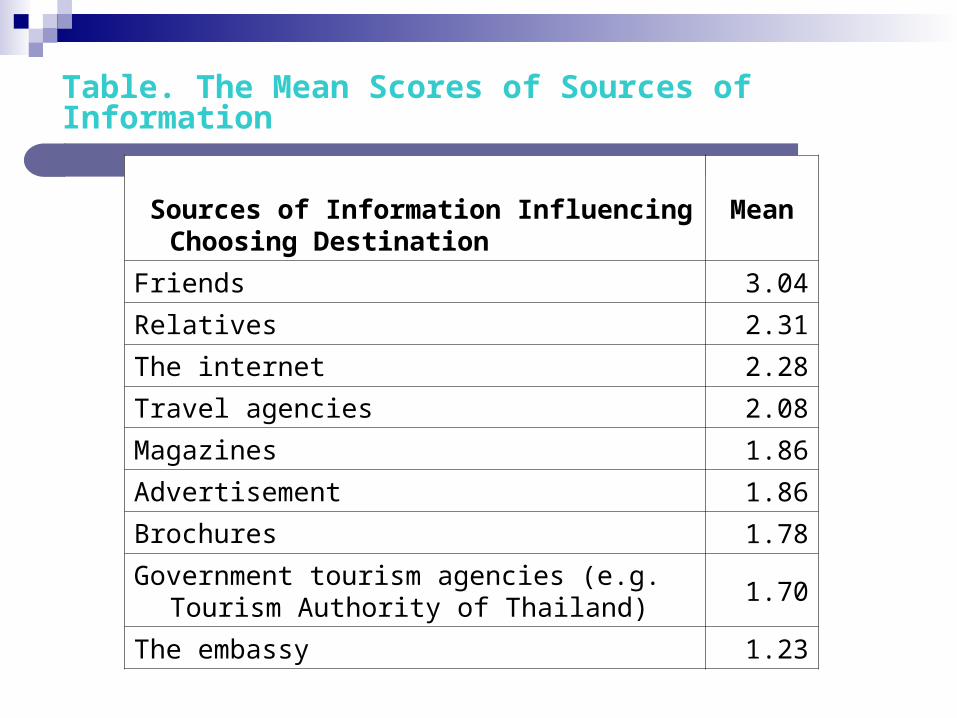
Table. The Mean Scores of Sources of Information
Sources of Information Influencing Choosing Destination
Mean
Friends 3.04
Relatives 2.31
The internet 2.28
Travel agencies 2.08
Magazines 1.86
Advertisement 1.86
Brochures 1.78
Government tourism agencies (e.g. Tourism Authority of Thailand)
1.70
The embassy 1.23
Decision Criteria of International Tourists
There are four factors affecting the decision making of the visitors. The first factor was called safety factor, including the
concern about pollution, cheating, and safety standards. The second factor was the attraction site factor, including
beach and historical sites. Third factor was price factor while the concerns are about
low cost and attractive price for shopping. The last factor was VFR factor, including visiting friends
and relatives.

Destination Choice
When asked “Before deciding to come to Thailand, what other countries did you consider?”
the respondents showed that neighboring countries of Thailand, such as Singapore and Malaysia, were considered.

50.3% of the respondents considered to visit other countries within Southeast Asia.
With 20.7% of the respondents, Singapore is the first choice of consideration when international tourists considered visiting Thailand.
Malaysia comes second with 12.3%, followed by Vietnam and Indonesia as other choices for travel.

Empirical Research on Factors Affecting Satisfaction of International Tourists
Most influential factors affecting satisfaction of international tourists are
•quality of service, •beautiful scenery, •value for money and •cleanliness, respectively.

11
Generally to make “decision” Statistical techniques are used to
make decisions that affect our daily lives (without knowing it)Choose the universityTo Buy a car or a houseChoose common stock from the stock markets
Why Study Statistics?

12
Why Study Statistics?
Numerical information is everywhere No matter what your career, you will
make professional decisions that involve data

13
Data Analysis Process
1. Determine whether the existing information is adequate or additional information is required. (Primary data/ secondary data)
2. Gather additional information, if it is needed, in such a way that it doesn’t provide misleading results.
3. Summarize information in a useful way and informative manner.
4. Analyze the available information5. Draw conclusions and make inferences while assessing
the risk of an incorrect conclusion.6. Writing a report with recommendations

14
GOALS1. Understand why we study statistics.2. Explain what is meant by descriptive
statistics and inferential statistics.3. Distinguish between a qualitative variable
and a quantitative variable.4. Describe how a discrete variable is
different from a continuous variable.5. Distinguish among the nominal, ordinal,
interval, and ratio levels of measurement.

15
What is Meant by Statistics?
Statistics is the science of collecting, organizing, presenting, analyzing, and interpreting numerical data to assist in making more effective decisions.

16
Examples
Hotel/Airline managers have to decide the proper promotions or packages to attract customers for the low season.
Thai government has to decide whether to provide how much funding for Ministry of Tourism and Sports to better support tourism industry.
Managers must make decisions about the quality of their product and services. (How to measure the quality of their products?)customer satisfaction index?

17
Types of Statistics – Descriptive Statistics
Descriptive Statistics - Methods of organizing, summarizing, and presenting data in an informative way.

18
FOREIGN TRADE OF THAILAND:
1996 - 2008Million Baht
Year/ Month
Imports ExportsBalance of
trade
2539 (1996) 1,856,789
1,411,039
-445,750
2540 (1997) 1,924,283
1,811,763
-112,520
2541 (1998) 1,774,050
2,248,813
+474,763
2542 (1999) 1,910,302
2,215,181
+304,879
2543 (2000) 2,494,133
2,768,065
+273,932
2544 (2001) 2,755,308
2,884,703
+129,395
2545 (2002) 2,774,840
2,923,941
+149,101
2546 (2003) 3,137,924
3,326,015
+188,091
2547 (2004) 3,839,753
3,922,431
+82,678
2548 (2005) 4,756,000
4,436,676
-319,324
2549 (2006) 4,870,954
4,938,508
+67,554
2550 (2007) 4,871,996
5,254,999
+383,003

19
Inferential Statistics: The methods used to estimate a property of a population on the basis of a sample.Finding something about a population from a
sample taken from that population.
Types of Statistics – Inferential Statistics

20
Population versus Sample
A population is the entire set of individuals or objects of interest or the measurements obtained from all individuals or objects of interest. A sample is a portion, or part, of the population of interest

21
Population VS Sample
People in the ABAC poll (Population or Sample?)
TIM students vs MUIC students (TIM students representing MUIC?)
Possibility of collecting data from population vs. sample

22
Why use samples?
Cost Possibility to find all population Time
Further questions for using samplesHow many are enough?How to select sample from the population?

23
Types of Variables
A. Qualitative or Attribute variable - the characteristic being studied is nonnumeric. EXAMPLES: Gender, religious affiliation, type of automobile owned, state of birth, eye color.
B. Quantitative variable - information is reported numerically. EXAMPLES: Balance in your checking account, minutes remaining in class, or number of children in a family.

24
Quantitative Variables – Classifications
Quantitative variables can be classified as either discrete or continuous.
A. Discrete variables: can only assume certain values and there are usually “gaps” between values.
EXAMPLE: the number of bedrooms in a house, or the number of hammers sold at the local Home Depot (1,2,3,…,etc).
B. Continuous variable can assume any value within a specified range.
EXAMPLE: The pressure in a tire, the weight of a pork chop, or the height of students in a class.

25
Summary of Types of Variables

26
Four Levels of Measurement
Nominal level - data that is classified into categories and cannot be arranged in any particular order.
EXAMPLES: eye color, gender, religious affiliation.
Ordinal level – involves data arranged in some order, but the differences between data values cannot be determined or are meaningless.
EXAMPLE: During a taste test of 4 soft drinks, Coke was ranked number 1, Sprite number 2, Seven-up number 3, and Mirinda number 4.
27
Four Levels of Measurement
Interval level - similar to the ordinal level, with the additional property that meaningful amounts of differences between data values can be determined. There is no natural zero point.
EXAMPLE: Temperature on the Fahrenheit scale.
Ratio level - the interval level with an inherent zero starting point. Differences and ratios are meaningful for this level of measurement.
EXAMPLES: Monthly income of surgeons, or distance traveled by manufacturer’s representatives per month.

28
Summary of the Characteristics for Levels of Measurement

Measuring “Happiness” with Four Levels of Measurement
Nominal (the lowest level) Where numbers only represent names.
For example, if we asked people whether they are happy they will answer yes or no(two categories: happy/unhappy)
Ordinal This type gives you more information than nominal data. If we
use an ordinal scale to measure something, we can tell not only those things have occurred, but also the order in which they occurred.
However, these data tell us nothing about the differences between values.
For example, if we ordered three people according to how happy they were- happiest, moderate and unhappiest. These labels do tell us something about the level of happiness. In using ordered categories we now know that the happiest person was happier than those in the other two categories.
29

Interval Data are scores that are measured on a scale along the whole of
which intervals are equal. For example, rather than asking people if they are happy we could
measure boredom along a 7-point scale (1 being very unhappy and 7 being very happy).
For data to be interval, it should be true that the increase in happiness represented by a change from 3 to 4 along the scale should be the same as the change in happiness represented by a change from 6 to 7.
Ratio (the highest level) Data have similar property with interval, but in addition we
should be able to say that someone who has a score of 50 was twice as happy as someone who scored only 25.
30
Measuring “Happiness” with Four Levels of Measurement

31
Introduction to SPSS
Statistical Package for the Social Sciences Other software; Eview, Stata, Statistica,
Lisrel, EQS, AMOS, MPLUS, MINITAB

32
Data view of SPSS

33
Indicating Data View

34
To see Variable View

35
Variable View

36
Introduction to SPSS software
SPSS is a software package used for conducting statistical analyses, manipulating data, and generating tables and graphs that summarize data.
Statistical analyses range from basic descriptive statistics, such as averages and frequencies, to advanced inferential statistics, such as regression models, analysis of variance, and factor analysis.
37
Introduction to SPSS software
SPSS also contains several tools for manipulating data, including functions for recoding data and computing new variables, as well as for merging and aggregating datasets.
38
The Data Editor (.sav)
The Data Editor window displays the contents of the working dataset. It is arranged in a spreadsheet format that contains variables in columns and cases in rows.
1) The Data View is the sheet that is visible when you first open the Data Editor; this sheet contains the data.
2) The Variable View is the sheet that contains information about the variables in the dataset.

39
From the menu in the Data Editor window, choose the following menu options: File → Open → Data...
The Open File dialog box should automatically open to the SPSS directory of example files. Choose Employee data.sav from the list and click Open. Your Data Editor should now look like this:

40
The End