Embed Size (px)
Citation preview
What is MC’s value ?
Mitsubishi Corporation Annual Report 2008
forward-looking statementsThis annual report contains forward-looking statements about Mitsubishi Corporation’s future plans, strategies, beliefs and performance that are not historical facts. They are based on current expectations, estimates, forecasts and projections about the industries in which Mitsubishi Corporation operates and beliefs and assumptions made by management. As the expectations, estimates, forecasts and projections are subject to a number of risks, uncertainties and assumptions, they may cause actual results to differ materially from those projected. Mitsubishi Corporation, therefore, wishes to caution readers not to place undue reliance on forward-looking statements. Furthermore, the company undertakes no obligation to update any forward-looking statements as a result of new information, future events or other developments. Risks, uncertainties and assumptions mentioned above include, but are not limited to, commodity prices; exchange rates and economic conditions; the outcome of pending and future litigation; and the continued availability of financing, financial instruments and financial resources.
Contents
1 feature section:
Evaluating Mitsubishi Corporation’s Corporate value
2 Corporate profile
3 organizational structure
4 network
15 financial Highlights
17 to our stakeholders
30 review of operations
30 Business Groups at a Glance
34 Business innovation Group
38 industrial finance, logistics & Development Group
42 Energy Business Group
46 Metals Group
50 Machinery Group
54 Chemicals Group
58 living Essentials Group
62 Global strategies
64 Corporate Governance and internal Control
77 Corporate section
86 financial section
161 Corporate Data

1Mitsubishi Corporation Annual Report 2008
A n E v A l u A t i o n o f M C ’ s C o r p o r A t E v A l u E
1Mitsubishi Corporation Annual Report 2008
Evaluating Mitsubishi Corporation’s
Corporate value
Mitsubishi Corporation has chalked up a string of record-breaking performances over the
past several years. But where does its corporate value and competitiveness originate
from? And can the company sustain such growth going forward? to explore these ques-
tions, this feature section analyzes and evaluates Mitsubishi Corporation as follows:
1. Evaluate Mitsubishi Corporation’s working interests in natural resources and
its natural resources-related businesses
2. Analyze Mitsubishi Corporation’s financial condition
3. Evaluate Mitsubishi Corporation’s non-resource-related businesses and
business model reforms
4. Analyze Mitsubishi Corporation’s investment performance and risk management
5. Conclusion
suppose you are an investment analyst. How would you analyze Mitsubishi Corporation for investment purposes?
This analysis, “Evaluating Mitsubishi Corporation’s Corporate Value,” constitutes the feature section of Mitsubishi
Corporation’s 2008 annual report. It was designed in the style of a hypothetical corporate analysis report to help
foster an objective understanding of Mitsubishi Corporation’s corporate value among readers. Please understand
that this is a corporate communication from Mitsubishi Corporation to readers of this annual report.
A n E v A l u A t i o n o f M C ’ s C o r p o r A t E v A l u E
2 Mitsubishi Corporation Annual Report 2008
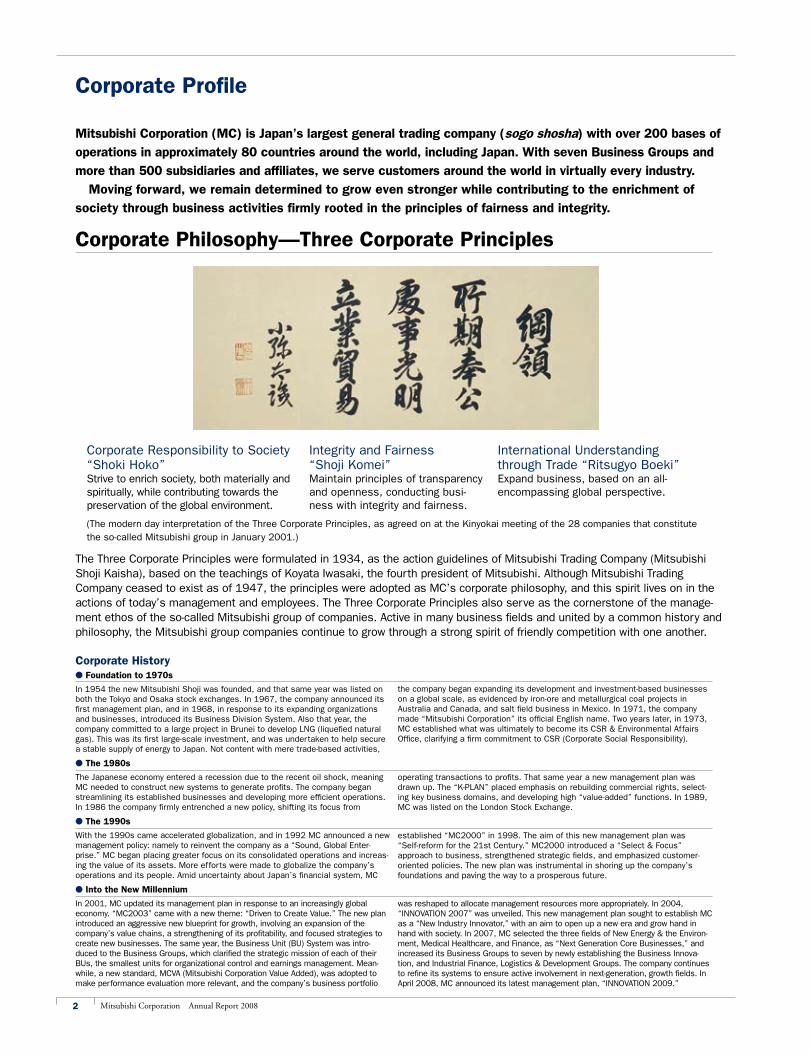
The Three Corporate Principles were formulated in 1934, as the action guidelines of Mitsubishi Trading Company (Mitsubishi Shoji Kaisha), based on the teachings of Koyata Iwasaki, the fourth president of Mitsubishi. Although Mitsubishi Trading Company ceased to exist as of 1947, the principles were adopted as MC’s corporate philosophy, and this spirit lives on in the actions of today’s management and employees. The Three Corporate Principles also serve as the cornerstone of the manage-ment ethos of the so-called Mitsubishi group of companies. Active in many business fields and united by a common history and philosophy, the Mitsubishi group companies continue to grow through a strong spirit of friendly competition with one another.
Corporate profile
Mitsubishi Corporation (MC) is Japan’s largest general trading company (sogo shosha) with over 200 bases of operations in approximately 80 countries around the world, including Japan. With seven Business Groups and more than 500 sub sidiaries and affiliates, we serve customers around the world in virtually every industry. Moving forward, we remain determined to grow even stronger while contributing to the enrichment of society through business activities firmly rooted in the principles of fairness and integrity.
Corporate Responsibility to Society “Shoki Hoko”Strive to enrich society, both materially and spiritually, while contributing towards the preservation of the global environment.
(The modern day interpretation of the Three Corporate Principles, as agreed on at the Kinyokai meeting of the 28 companies that constitute the so-called Mitsubishi group in January 2001.)
Integrity and Fairness “Shoji Komei”Maintain principles of transparency and openness, conducting busi-ness with integrity and fairness.
International Under standing through Trade “Ritsugyo Boeki”Expand business, based on an all- encompassing global perspective.
l into the new Millennium
In 2001, MC updated its management plan in response to an increasingly global economy. “MC2003” came with a new theme: “Driven to Create Value.” The new plan introduced an aggressive new blueprint for growth, involving an expansion of the company’s value chains, a strengthening of its profitability, and focused strategies to create new businesses. The same year, the Business Unit (BU) System was intro-duced to the Business Groups, which clarified the strategic mission of each of their BUs, the smallest units for organizational control and earnings management. Mean-while, a new standard, MCVA (Mitsubishi Corporation Value Added), was adopted to make performance evaluation more relevant, and the company’s business portfolio
Corporate Historyl foundation to 1970s
In 1954 the new Mitsubishi Shoji was founded, and that same year was listed on both the Tokyo and Osaka stock exchanges. In 1967, the company announced its first management plan, and in 1968, in response to its expanding organizations and businesses, introduced its Business Division System. Also that year, the company committed to a large project in Brunei to develop LNG (liquefied natural gas). This was its first large-scale investment, and was undertaken to help secure a stable supply of energy to Japan. Not content with mere trade-based activities,
the company began expanding its development and investment-based businesses on a global scale, as evidenced by iron-ore and metallurgical coal projects in Australia and Canada, and salt field business in Mexico. In 1971, the company made “Mitsubishi Corporation” its official English name. Two years later, in 1973, MC established what was ultimately to become its CSR & Environmental Affairs Office, clarifying a firm commitment to CSR (Corporate Social Responsibility).
l the 1980s
The Japanese economy entered a recession due to the recent oil shock, meaning MC needed to construct new systems to generate profits. The company began streamlining its established businesses and developing more efficient operations. In 1986 the company firmly entrenched a new policy, shifting its focus from
operating transactions to profits. That same year a new management plan was drawn up. The “K-PLAN” placed emphasis on rebuilding commercial rights, select-ing key business domains, and developing high “value-added” functions. In 1989, MC was listed on the London Stock Exchange.
l the 1990s
With the 1990s came accelerated globalization, and in 1992 MC announced a new management policy: namely to reinvent the company as a “Sound, Global Enter-prise.” MC began placing greater focus on its consolidated operations and increas-ing the value of its assets. More efforts were made to globalize the company’s operations and its people. Amid uncertainty about Japan’s financial system, MC
established “MC2000” in 1998. The aim of this new management plan was “Self-reform for the 21st Century.” MC2000 introduced a “Select & Focus” approach to business, strengthened strategic fields, and emphasized customer-oriented policies. The new plan was instrumental in shoring up the company’s foundations and paving the way to a prosperous future.
was reshaped to allocate management resources more appropriately. In 2004, “INNOVATION 2007” was unveiled. This new management plan sought to establish MC as a “New Industry Innovator,” with an aim to open up a new era and grow hand in hand with society. In 2007, MC selected the three fields of New Energy & the Environ-ment, Medical Healthcare, and Finance, as “Next Generation Core Businesses,” and increased its Business Groups to seven by newly establishing the Business Innova-tion, and Industrial Finance, Logistics & Development Groups. The company continues to refine its systems to ensure active involvement in next-generation, growth fields. In April 2008, MC announced its latest management plan, “INNOVATION 2009.”
Corporate philosophy—three Corporate principles
3Mitsubishi Corporation Annual Report 2008
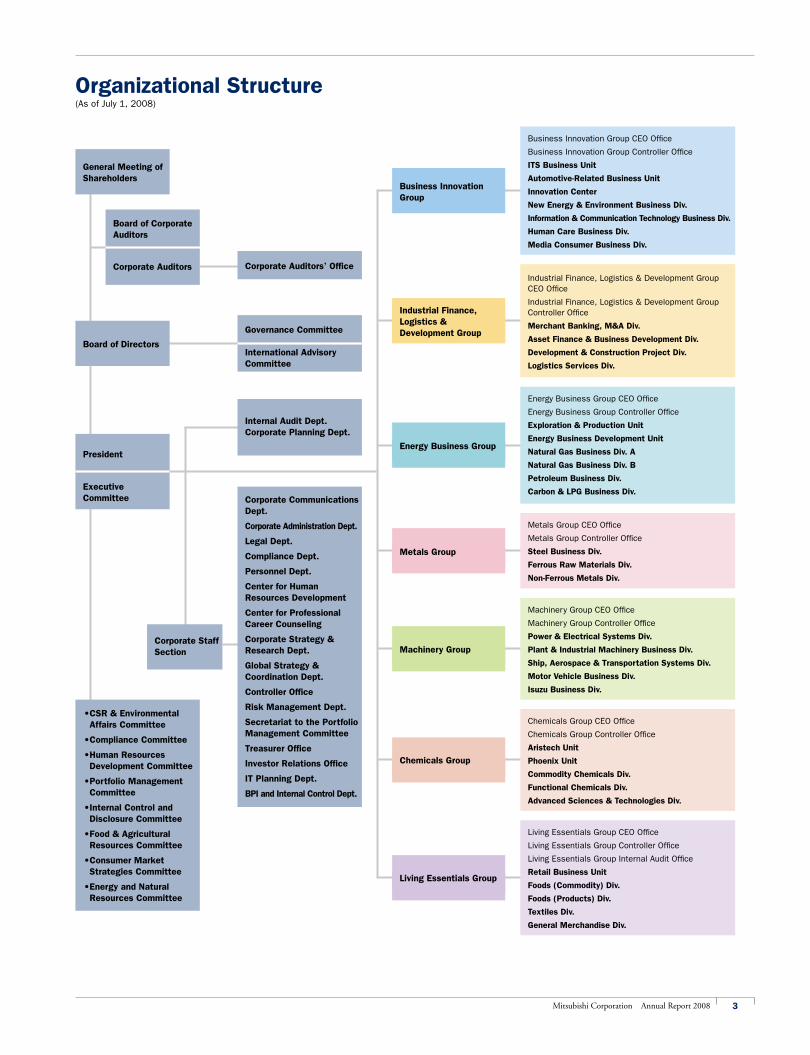
organizational structure(As of July 1, 2008)
industrial finance, logistics & Development Group
Energy Business Group
Metals Group
Machinery Group
Chemicals Group
living Essentials Group
General Meeting of shareholders
Corporate Auditors
Board of Corporate Auditors
Corporate Auditors’ office
Board of Directors
president
Executive Committee
Governance Committee
international Advisory Committee
Industrial Finance, Logistics & Development Group CEO Office
Industrial Finance, Logistics & Development Group Controller Office
Merchant Banking, M&A Div.
Asset finance & Business Development Div.
Development & Construction project Div.
logistics services Div.
Living Essentials Group CEO Office
Living Essentials Group Controller Office
Living Essentials Group Internal Audit Office
retail Business unit
foods (Commodity) Div.
foods (products) Div.
textiles Div.
General Merchandise Div.
Energy Business Group CEO Office
Energy Business Group Controller Office
Exploration & production unit
Energy Business Development unit
natural Gas Business Div. A
natural Gas Business Div. B
petroleum Business Div.
Carbon & lpG Business Div.
Metals Group CEO Office
Metals Group Controller Office
steel Business Div.
ferrous raw Materials Div.
non-ferrous Metals Div.
Machinery Group CEO Office
Machinery Group Controller Office
power & Electrical systems Div.
plant & industrial Machinery Business Div.
ship, Aerospace & transportation systems Div.
Motor vehicle Business Div.
isuzu Business Div.
Chemicals Group CEO Office
Chemicals Group Controller Office
Aristech unit
phoenix unit
Commodity Chemicals Div.
functional Chemicals Div.
Advanced sciences & technologies Div.
Corporate staff section
Corporate Communications Dept.
Corporate Administration Dept.
legal Dept.
Compliance Dept.
personnel Dept.
Center for Human resources Development
Center for professional Career Counseling
Corporate strategy & research Dept.
Global strategy & Coordination Dept.
Controller office
risk Management Dept.
secretariat to the portfolio Management Committee
treasurer office
investor relations office
it planning Dept.
Bpi and internal Control Dept.
internal Audit Dept.Corporate planning Dept.
Business innovation Group
Business Innovation Group CEO Office
Business Innovation Group Controller Office
its Business unit
Automotive-related Business unit
innovation Center
new Energy & Environment Business Div.
information & Communication technology Business Div.
Human Care Business Div.
Media Consumer Business Div.
•CSR & Environmental Affairs Committee
•Compliance Committee
•Human Resources Development Committee
•Portfolio Management Committee
•Internal Control and Disclosure Committee
•Food & Agricultural resources Committee
•Consumer Market strategies Committee
•Energy and Natural resources Committee
4 Mitsubishi Corporation Annual Report 2008
Domestic network
Tokyo
Sapporo
Sendai
Nagoya
Niigata
Toyama
Shizuoka
Osaka
Takamatsu
Hiroshima
Fukuoka
Oita
Nagasaki
Naha
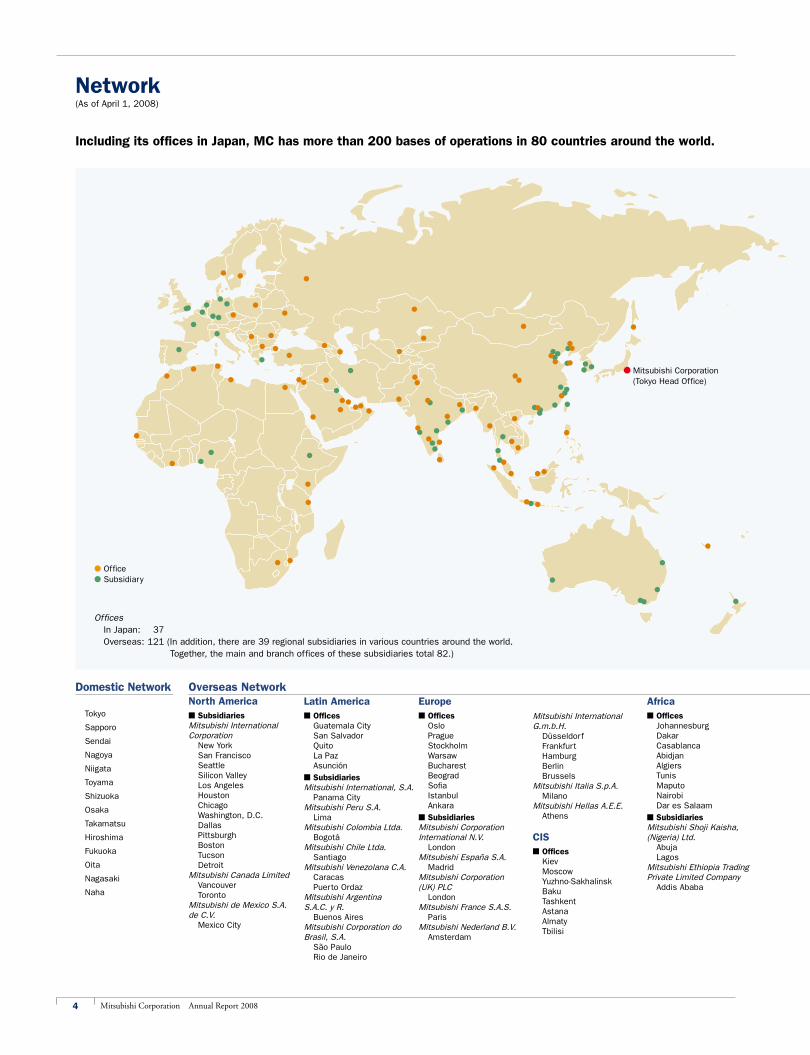
network(As of April 1, 2008)
including its offices in Japan, MC has more than 200 bases of operations in 80 countries around the world.
Mitsubishi Corporation(Tokyo Head Office)
overseas networknorth American subsidiariesMitsubishi International Corporation
New YorkSan FranciscoSeattleSilicon ValleyLos AngelesHoustonChicagoWashington, D.C.DallasPittsburghBostonTucsonDetroit
Mitsubishi Canada LimitedVancouverToronto
Mitsubishi de Mexico S.A. de C.V.
Mexico City
latin American offices
Guatemala CitySan SalvadorQuitoLa PazAsunción
n subsidiariesMitsubishi International, S.A.
Panama CityMitsubishi Peru S.A.
LimaMitsubishi Colombia Ltda.
BogotáMitsubishi Chile Ltda.
SantiagoMitsubishi Venezolana C.A.
CaracasPuerto Ordaz
Mitsubishi Argentina S.A.C. y R.
Buenos AiresMitsubishi Corporation do Brasil, S.A.
São PauloRio de Janeiro
Europen offices
OsloPragueStockholmWarsawBucharestBeogradSofiaIstanbulAnkara
n subsidiariesMitsubishi Corporation International N.V.
LondonMitsubishi España S.A.
MadridMitsubishi Corporation (UK) PLC
LondonMitsubishi France S.A.S.
ParisMitsubishi Nederland B.V.
Amsterdam
Mitsubishi International G.m.b.H.
DüsseldorfFrankfurtHamburgBerlinBrussels
Mitsubishi Italia S.p.A.Milano
Mitsubishi Hellas A.E.E.Athens
Cisn offices
KievMoscowYuzhno-SakhalinskBakuTashkentAstanaAlmatyTbilisi
African offices
JohannesburgDakarCasablancaAbidjanAlgiersTunisMaputoNairobiDar es Salaam
n subsidiariesMitsubishi Shoji Kaisha, (Nigeria) Ltd.
AbujaLagos
Mitsubishi Ethiopia Trading Private Limited Company
Addis Ababa
l Officel Subsidiary
Offices In Japan: 37 Overseas: 121 (In addition, there are 39 regional subsidiaries in various countries around the world. Together, the main and branch offices of these subsidiaries total 82.)
5Mitsubishi Corporation Annual Report 2008
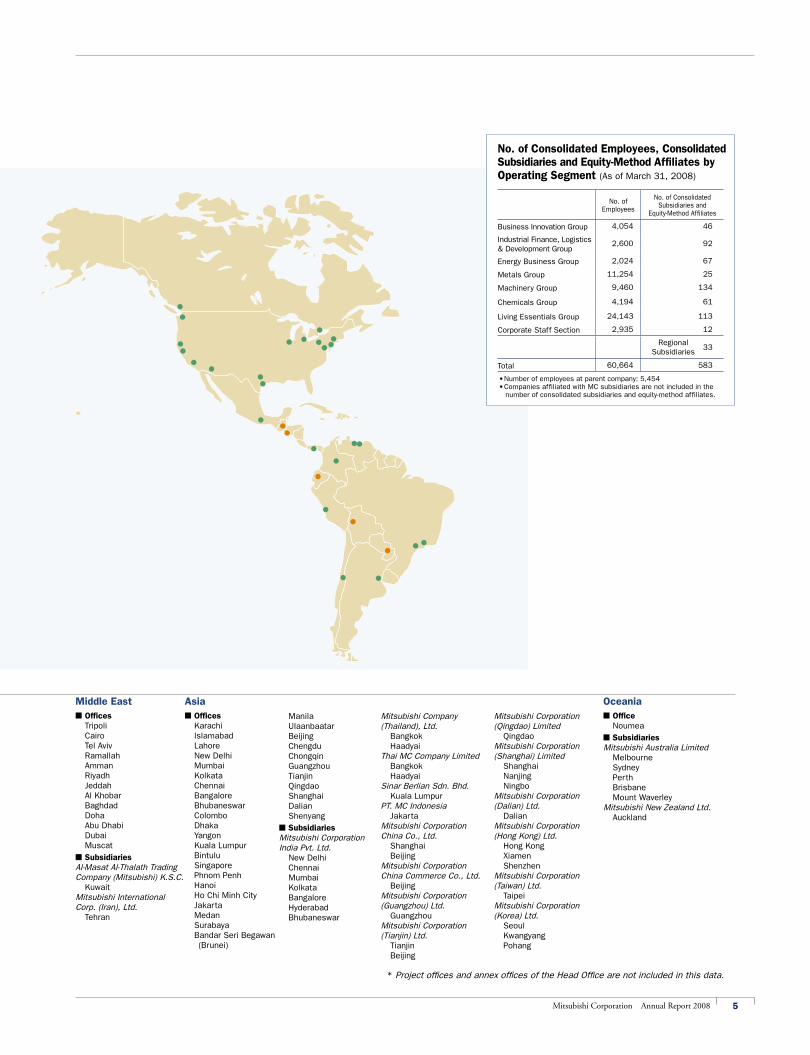
No. of Consolidated Employees, Consolidated Subsidiaries and Equity-Method Affiliates by Operating Segment (As of March 31, 2008)
•Numberofemployeesatparentcompany:5,454•CompaniesaffiliatedwithMCsubsidiariesarenotincludedinthenumberofconsolidatedsubsidiariesandequity-methodaffiliates.
No.ofEmployees
No.ofConsolidatedSubsidiariesand
Equity-MethodAffiliates
BusinessInnovationGroup 4,054 46
IndustrialFinance,Logistics&DevelopmentGroup
2,600 92
EnergyBusinessGroup 2,024 67
MetalsGroup 11,254 25
MachineryGroup 9,460 134
ChemicalsGroup 4,194 61
LivingEssentialsGroup 24,143 113
CorporateStaffSection 2,935 12
33
Total 60,664 583
Regional Subsidiaries
*ProjectofficesandannexofficesoftheHeadOfficearenotincludedinthisdata.
Middle Eastn OfficesTripoliCairoTelAvivRamallahAmmanRiyadhJeddahAlKhobarBaghdadDohaAbuDhabiDubaiMuscat
n SubsidiariesAl-MasatAl-ThalathTradingCompany(Mitsubishi)K.S.C.Kuwait
MitsubishiInternational Corp.(Iran),Ltd.Tehran
Asian OfficesKarachiIslamabadLahoreNewDelhiMumbaiKolkataChennaiBangaloreBhubaneswarColomboDhakaYangonKualaLumpurBintuluSingaporePhnomPenhHanoiHoChiMinhCityJakartaMedanSurabayaBandarSeriBegawan (Brunei)
ManilaUlaanbaatarBeijingChengduChongqinGuangzhouTianjinQingdaoShanghaiDalianShenyang
n SubsidiariesMitsubishiCorporation IndiaPvt.Ltd.NewDelhiChennaiMumbaiKolkataBangaloreHyderabadBhubaneswar
MitsubishiCompany(Thailand),Ltd.BangkokHaadyai
ThaiMCCompanyLimitedBangkokHaadyai
SinarBerlianSdn.Bhd.KualaLumpur
PT.MCIndonesiaJakarta
MitsubishiCorporation ChinaCo.,Ltd.ShanghaiBeijing
MitsubishiCorporation ChinaCommerceCo.,Ltd.Beijing
MitsubishiCorporation(Guangzhou)Ltd.Guangzhou
MitsubishiCorporation(Tianjin)Ltd.TianjinBeijing
MitsubishiCorporation(Qingdao)LimitedQingdao
MitsubishiCorporation(Shanghai)LimitedShanghaiNanjingNingbo
MitsubishiCorporation(Dalian)Ltd.Dalian
MitsubishiCorporation (HongKong)Ltd.HongKongXiamenShenzhen
MitsubishiCorporation(Taiwan)Ltd.Taipei
MitsubishiCorporation(Korea)Ltd.SeoulKwangyangPohang
Oceanian OfficeNoumea
n SubsidiariesMitsubishiAustraliaLimitedMelbourneSydneyPerthBrisbaneMountWaverley
MitsubishiNewZealandLtd.Auckland

6 Mitsubishi Corporation Annual Report 2008
A n E v A l u A t i o n o f M C ’ s C o r p o r A t E v A l u E
6 Mitsubishi Corporation Annual Report 2008
■ Coking coal ■ Iron ore ■ Nickel, Chrome ■ Copper ■ Aluminum ■ Uranium Existing project Exploration and development project
Bauxite ore exploration (Republic of Guinea)
Iron ore exploration (Republic of Guinea)
MOZAL (Mozambique)
HernicFerrochrome (South Africa)
Asahan (Indonesia)
Gresik (Indonesia)
Bauxite ore exploration (Cambodia)
Crosslands Resources (Australia) Warkworth Joint Venture/
Ulan Joint Venture/Coal & Allied (Australia)
BMA (Australia) Boyne
(Australia)
Clermont (Australia)
PACIFIC METALS CO., LTD. (Japan)
Antamina Copper and Zinc Mine
(Peru)
EscondidaCopper Mine
(Chile)
CMH (Chile)
Los PelambresCopper Mine
(Chile)
Nova Era Silicon (Brazil)
Albras/Alunorte (Brazil)
Uranium exploration (Canada)
Iron ore exploration (Canada)
IOC (Canada)
HIsmelt (Australia)
investments in Metals resources
1.the energy and metals resources markets are today characterized by tight supplies and steeply rising prices. this section evaluates the working interests owned by Mitsubishi Corporation in natural resource projects and the company’s natural resource-related businesses.
Mitsubishi Corporation’s natural resources Working interestsInsatiable demand from emerging economies, most notably China and India, has led to soaring prices for energy and metals resources. Mitsubishi Corporation began its natural resources-related businesses with the goal of ensuring a stable supply of resources for Japan because the country has few natural resources of its own. The company is today investing heavily around the world in coal, iron ore, copper, aluminum and other metals resources as well as in energy resources such as crude oil, natural gas and liquefied natural gas (LNG) in anticipation of future demand and supply. The company clearly has a natural resource side to it. The working interests Mitsubishi Corporation owns in metals resources and energy are analyzed below.
—Working interests in Metals resources—Mitsubishi Corporation owns working interests in coal, iron ore, raw material for stainless steel, copper, aluminum and uranium, among other metals resources, in countries around the world. The company has a particularly strong hand in coal. It started investing in coal resources back in 1968 when it established Mitsubishi Development Pty Ltd (MDP), a wholly owned Australian subsidiary. Over the ensuing 40 years, Mitsubishi Corporation has continued to invest through ups and downs in the market as it keeps its eye on the goal of ensuring a reliable supply of resources. In 2001, the company made a major move to increase rights to coking coal, which is used to make steel, as it saw this resource as one that would be in high demand in the future. Through MDP, Mitsubishi Corporation invested nearly ¥100.0 billion in BMA, a coal joint venture (which is equally owned by MDP and BHP Billiton Ltd.) to increase its portfolio of working interests. To put this into perspective, the investment exceeded the company’s net income at the time. Given the size of the investment, it clearly entailed a sizable risk. But it has paid off. BMA is now the world’s largest supplier of coking coal, boasting annual exports of approximately 50 million tonnes—or about 23% of the world’s seaborne coking coal trade. Mitsubishi Corporation has seen its earnings from coking coal rise substantially as the price of this resource has soared. The company is reinvesting these earnings in other coking coal and metals resources projects to ensure stable supplies into the future.
Evaluate Mitsubishi Corporation’s working interests in natural resources and its natural resources-related businesses
Equity share of Metals resources production
Fiscal 2008
Coal*1 27.6 million tons/year
Iron ore 6.3 million tons/year
Copper*2 148 thousand tons/year
Aluminum 240 thousand tons/year
*1 Coal is the total of coking coal (hard coking coal and slightly coking coal) and thermal coal.
*2 Copper is the company’s equity share of production in three South American copper mining companies.
7Mitsubishi Corporation Annual Report 2008 7Mitsubishi Corporation Annual Report 2008
A n E v A l u A t i o n o f M C ’ s C o r p o r A t E v A l u E
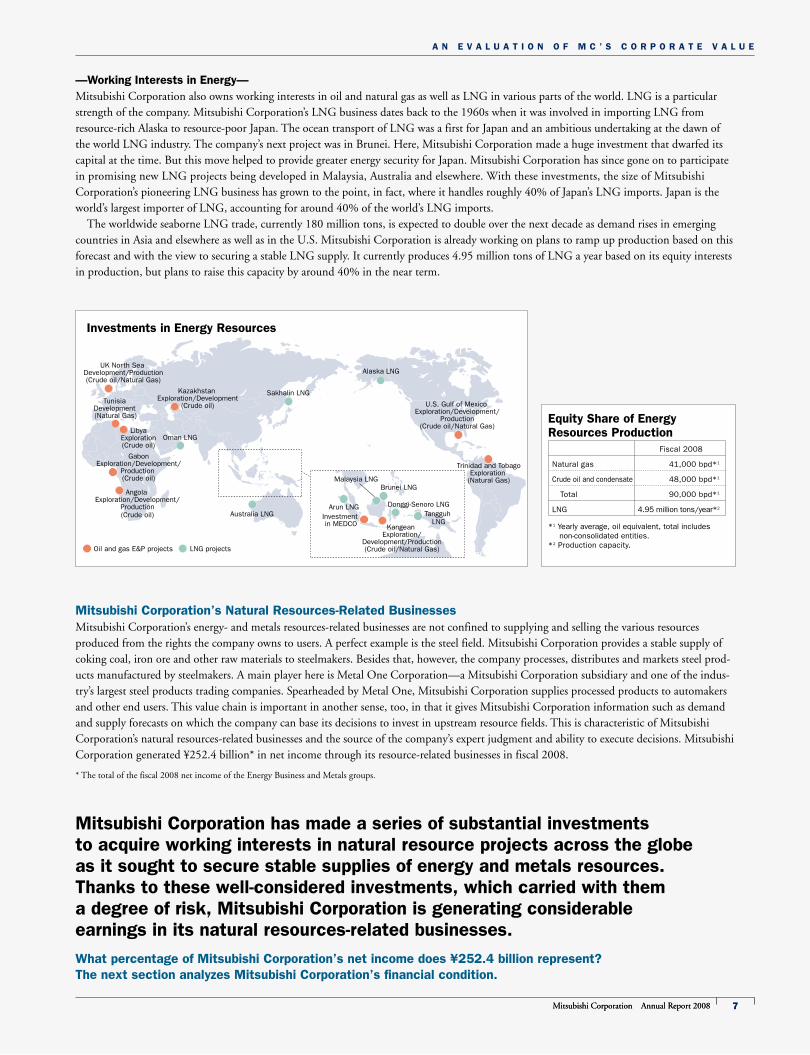
investments in Energy resources
Oil and gas E&P projects LNG projects
Sakhalin LNG
Australia LNG
U.S. Gulf of Mexico Exploration/Development/
Production(Crude oil/Natural Gas)
Angola Exploration/Development/
Production(Crude oil)
LibyaExploration(Crude oil)
UK North Sea Development/Production(Crude oil/Natural Gas)
Kazakhstan Exploration/Development
(Crude oil)Tunisia
Development (Natural Gas)
GabonExploration/Development/
Production (Crude oil)
Trinidad and TobagoExploration
(Natural Gas)
Alaska LNG
Oman LNG
Brunei LNG
Tangguh LNG
Donggi-Senoro LNG
Malaysia LNG
Arun LNGInvestment in MEDCO Kangean
Exploration/Development/Production(Crude oil/Natural Gas)
Mitsubishi Corporation has made a series of substantial investments to acquire working interests in natural resource projects across the globe as it sought to secure stable supplies of energy and metals resources. thanks to these well-considered investments, which carried with them a degree of risk, Mitsubishi Corporation is generating considerable earnings in its natural resources-related businesses.
What percentage of Mitsubishi Corporation’s net income does ¥252.4 billion represent? the next section analyzes Mitsubishi Corporation’s financial condition.
Equity share of Energy resources production
Fiscal 2008
Natural gas 41,000 bpd*1
Crude oil and condensate 48,000 bpd*1
Total 90,000 bpd*1
LNG 4.95 million tons/year*2
*1 Yearly average, oil equivalent, total includes non-consolidated entities.
*2 Production capacity.
—Working interests in Energy—Mitsubishi Corporation also owns working interests in oil and natural gas as well as LNG in various parts of the world. LNG is a particular strength of the company. Mitsubishi Corporation’s LNG business dates back to the 1960s when it was involved in importing LNG from resource-rich Alaska to resource-poor Japan. The ocean transport of LNG was a first for Japan and an ambitious undertaking at the dawn of the world LNG industry. The company’s next project was in Brunei. Here, Mitsubishi Corporation made a huge investment that dwarfed its capital at the time. But this move helped to provide greater energy security for Japan. Mitsubishi Corporation has since gone on to participate in promising new LNG projects being developed in Malaysia, Australia and elsewhere. With these investments, the size of Mitsubishi Corporation’s pioneering LNG business has grown to the point, in fact, where it handles roughly 40% of Japan’s LNG imports. Japan is the world’s largest importer of LNG, accounting for around 40% of the world’s LNG imports. The worldwide seaborne LNG trade, currently 180 million tons, is expected to double over the next decade as demand rises in emerging countries in Asia and elsewhere as well as in the U.S. Mitsubishi Corporation is already working on plans to ramp up production based on this forecast and with the view to securing a stable LNG supply. It currently produces 4.95 million tons of LNG a year based on its equity interests in production, but plans to raise this capacity by around 40% in the near term.
Mitsubishi Corporation’s natural resources-related BusinessesMitsubishi Corporation’s energy- and metals resources-related businesses are not confined to supplying and selling the various resources produced from the rights the company owns to users. A perfect example is the steel field. Mitsubishi Corporation provides a stable supply of coking coal, iron ore and other raw materials to steelmakers. Besides that, however, the company processes, distributes and markets steel prod-ucts manufactured by steelmakers. A main player here is Metal One Corporation—a Mitsubishi Corporation subsidiary and one of the indus-try’s largest steel products trading companies. Spearheaded by Metal One, Mitsubishi Corporation supplies processed products to automakers and other end users. This value chain is important in another sense, too, in that it gives Mitsubishi Corporation information such as demand and supply forecasts on which the company can base its decisions to invest in upstream resource fields. This is characteristic of Mitsubishi Corporation’s natural resources-related businesses and the source of the company’s expert judgment and ability to execute decisions. Mitsubishi Corporation generated ¥252.4 billion* in net income through its resource-related businesses in fiscal 2008.
* The total of the fiscal 2008 net income of the Energy Business and Metals groups.
8 Mitsubishi Corporation Annual Report 2008
A n E v A l u A t i o n o f M C ’ s C o r p o r A t E v A l u E
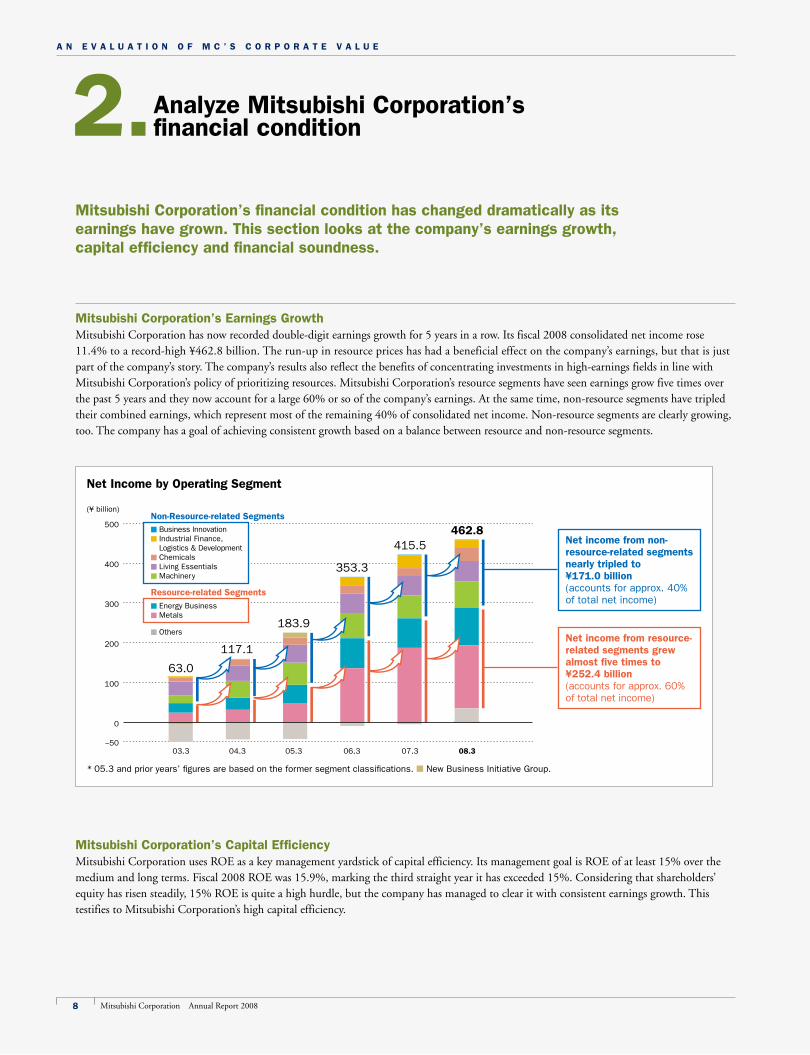
net income by operating segment
(¥ billion)
–50
0
100
200
300
400
500
63.0
03.3 08.306.305.304.3
117.1
183.9
353.3
07.3
415.5462.8
net income from non-resource-related segments nearly tripled to ¥171.0 billion(accounts for approx. 40% of total net income)
net income from resource-related segments grew almost five times to ¥252.4 billion (accounts for approx. 60% of total net income)
* 05.3 and prior years’ figures are based on the former segment classifications. n New Business Initiative Group.
non-resource-related segmentsn Business Innovationn Industrial Finance,
Logistics & Developmentn Chemicalsn Living Essentialsn Machinery
resource-related segments
n Energy Businessn Metals
n Others
Mitsubishi Corporation’s Earnings GrowthMitsubishi Corporation has now recorded double-digit earnings growth for 5 years in a row. Its fiscal 2008 consolidated net income rose 11.4% to a record-high ¥462.8 billion. The run-up in resource prices has had a beneficial effect on the company’s earnings, but that is just part of the company’s story. The company’s results also reflect the benefits of concentrating investments in high-earnings fields in line with Mitsubishi Corporation’s policy of prioritizing resources. Mitsubishi Corporation’s resource segments have seen earnings grow five times over the past 5 years and they now account for a large 60% or so of the company’s earnings. At the same time, non-resource segments have tripled their combined earnings, which represent most of the remaining 40% of consolidated net income. Non-resource segments are clearly growing, too. The company has a goal of achieving consistent growth based on a balance between resource and non-resource segments.
Mitsubishi Corporation’s Capital EfficiencyMitsubishi Corporation uses ROE as a key management yardstick of capital efficiency. Its management goal is ROE of at least 15% over the medium and long terms. Fiscal 2008 ROE was 15.9%, marking the third straight year it has exceeded 15%. Considering that shareholders’ equity has risen steadily, 15% ROE is quite a high hurdle, but the company has managed to clear it with consistent earnings growth. This testifies to Mitsubishi Corporation’s high capital efficiency.
2.Mitsubishi Corporation’s financial condition has changed dramatically as its earnings have grown. this section looks at the company’s earnings growth, capital efficiency and financial soundness.
Analyze Mitsubishi Corporation’s financial condition
9Mitsubishi Corporation Annual Report 2008
A n E v A l u A t i o n o f M C ’ s C o r p o r A t E v A l u E
0
1,000
2,000
3,000
4,000
0
1.0
2.0
3.0
4.0
2,748
08.3
3,832
05.304.303.3
3,422
06.3 07.3
2,729
2,792
3,179
3,5153.7
2.9
2.3
1.3
1.01.2
3,531
942
3,522
1,231 1,514
2,391
2,958 2,873
3,4233,107 3,0612.9
2.21.8 1.3 1.2 1.3
0
100
300
200
400
500
600
0
500
1,500
1,000
2,000
2,500
3,000
63
08.3
463
05.304.303.3
942
1,231
1,514
2,391
2,958 2,873
06.3 07.3
117
184
353
416
6.4
10.8
13.4
18.1
15.5 15.9
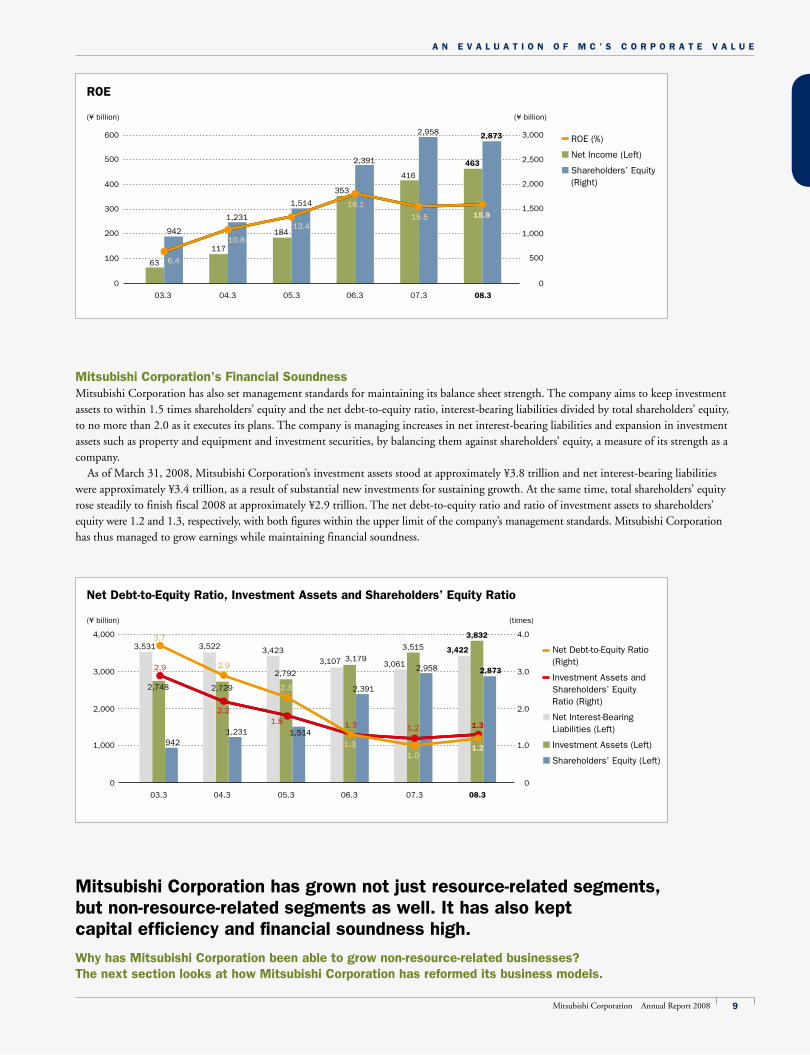
Mitsubishi Corporation’s financial soundnessMitsubishi Corporation has also set management standards for maintaining its balance sheet strength. The company aims to keep investment assets to within 1.5 times shareholders’ equity and the net debt-to-equity ratio, interest-bearing liabilities divided by total shareholders’ equity, to no more than 2.0 as it executes its plans. The company is managing increases in net interest-bearing liabilities and expansion in investment assets such as property and equipment and investment securities, by balancing them against shareholders’ equity, a measure of its strength as a company. As of March 31, 2008, Mitsubishi Corporation’s investment assets stood at approximately ¥3.8 trillion and net interest-bearing liabilities were approximately ¥3.4 trillion, as a result of substantial new investments for sustaining growth. At the same time, total shareholders’ equity rose steadily to finish fiscal 2008 at approximately ¥2.9 trillion. The net debt-to-equity ratio and ratio of investment assets to shareholders’ equity were 1.2 and 1.3, respectively, with both figures within the upper limit of the company’s management standards. Mitsubishi Corporation has thus managed to grow earnings while maintaining financial soundness.
Mitsubishi Corporation has grown not just resource-related segments, but non-resource-related segments as well. it has also kept capital efficiency and financial soundness high.
Why has Mitsubishi Corporation been able to grow non-resource-related businesses? the next section looks at how Mitsubishi Corporation has reformed its business models.
net Debt-to-Equity ratio, investment Assets and shareholders’ Equity ratio
(¥ billion) (times)
Net Debt-to-Equity Ratio (Right)
Investment Assets and Shareholders’ Equity Ratio (Right)
n Net Interest-Bearing Liabilities (Left)
n Investment Assets (Left)
n Shareholders’ Equity (Left)
roE
(¥ billion) (¥ billion)
ROE (%)
n Net Income (Left)
n Shareholders’ Equity (Right)
10 Mitsubishi Corporation Annual Report 2008
A n E v A l u A t i o n o f M C ’ s C o r p o r A t E v A l u E
trading
trading
finance
finance
investment
value Chain Manager
intermediary commissions
financial services provider
Extended credit (Shosha finance)
strategic investor (Dividends, equity in earnings)
upstream (raw materials)
raw materials producers and materials
manufacturers product manufacturers
sales agents(Wholesalers)
retailers
Downstream(products)
We look at the entire value chain and help to increase the competitiveness and corporate value of suppliers and business investees. We receive consideration for our services and also aim to increase dividends and equity in earnings from business investees.
Acted as intermediary for transactions, mainly earning commissions for intermediary and financial services. Also made investments to increase commissions.
invested to increase transactions
intermediary
Global Business Enterprise
past
present
Manufacturers sales agents (Wholesalers)
investment investment
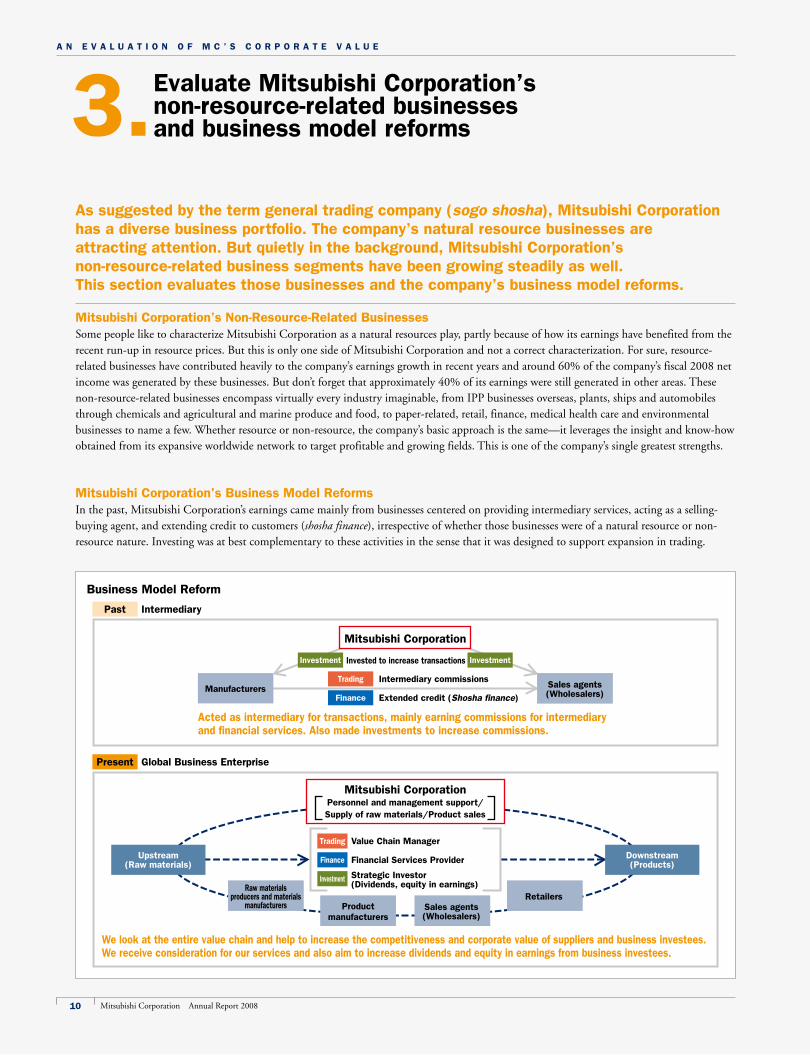
3.As suggested by the term general trading company (sogo shosha), Mitsubishi Corporation has a diverse business portfolio. the company’s natural resource businesses are attracting attention. But quietly in the background, Mitsubishi Corporation’s non-resource-related business segments have been growing steadily as well. this section evaluates those businesses and the company’s business model reforms.
Evaluate Mitsubishi Corporation’s non-resource-related businesses and business model reforms
Mitsubishi Corporation’s non-resource-related BusinessesSome people like to characterize Mitsubishi Corporation as a natural resources play, partly because of how its earnings have benefited from the recent run-up in resource prices. But this is only one side of Mitsubishi Corporation and not a correct characterization. For sure, resource-related businesses have contributed heavily to the company’s earnings growth in recent years and around 60% of the company’s fiscal 2008 net income was generated by these businesses. But don’t forget that approximately 40% of its earnings were still generated in other areas. These non-resource-related businesses encompass virtually every industry imaginable, from IPP businesses overseas, plants, ships and automobiles through chemicals and agricultural and marine produce and food, to paper-related, retail, finance, medical health care and environmental businesses to name a few. Whether resource or non-resource, the company’s basic approach is the same—it leverages the insight and know-how obtained from its expansive worldwide network to target profitable and growing fields. This is one of the company’s single greatest strengths.
Mitsubishi Corporation’s Business Model reformsIn the past, Mitsubishi Corporation’s earnings came mainly from businesses centered on providing intermediary services, acting as a selling-buying agent, and extending credit to customers (shosha finance), irrespective of whether those businesses were of a natural resource or non-resource nature. Investing was at best complementary to these activities in the sense that it was designed to support expansion in trading.
Business Model reform
Mitsubishi Corporationpersonnel and management support/ supply of raw materials/product sales
Mitsubishi Corporation
11Mitsubishi Corporation Annual Report 2008
A n E v A l u A t i o n o f M C ’ s C o r p o r A t E v A l u E
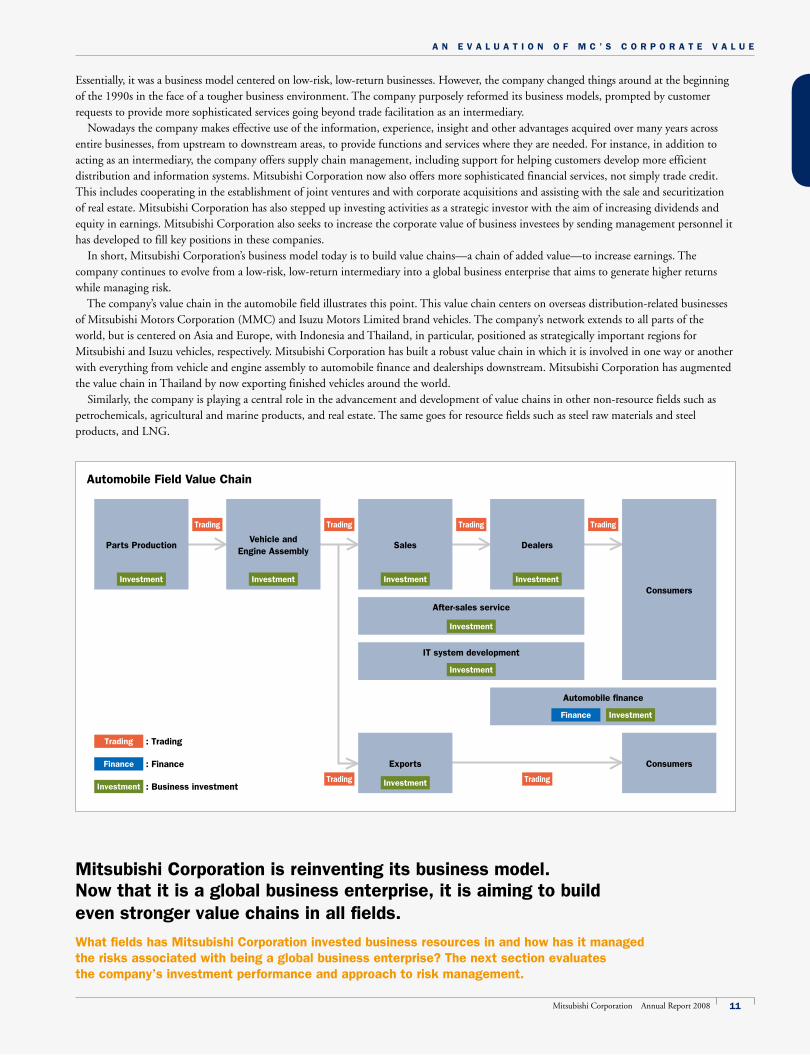
Automobile field value Chain
Mitsubishi Corporation is reinventing its business model. now that it is a global business enterprise, it is aiming to build even stronger value chains in all fields.
What fields has Mitsubishi Corporation invested business resources in and how has it managed the risks associated with being a global business enterprise? the next section evaluates the company’s investment performance and approach to risk management.
parts productionvehicle and
Engine Assemblysales
it system development
Dealers
After-sales service
Consumers
Automobile finance
ConsumersExports
investment
trading trading
trading trading
trading trading
investment investment
investment
investment
investment
investment
finance investment
trading
finance
investment
: trading
: finance
: Business investment
Essentially, it was a business model centered on low-risk, low-return businesses. However, the company changed things around at the beginning of the 1990s in the face of a tougher business environment. The company purposely reformed its business models, prompted by customer requests to provide more sophisticated services going beyond trade facilitation as an intermediary. Nowadays the company makes effective use of the information, experience, insight and other advantages acquired over many years across entire businesses, from upstream to downstream areas, to provide functions and services where they are needed. For instance, in addition to acting as an intermediary, the company offers supply chain management, including support for helping customers develop more efficient distribution and information systems. Mitsubishi Corporation now also offers more sophisticated financial services, not simply trade credit. This includes cooperating in the establishment of joint ventures and with corporate acquisitions and assisting with the sale and securitization of real estate. Mitsubishi Corporation has also stepped up investing activities as a strategic investor with the aim of increasing dividends and equity in earnings. Mitsubishi Corporation also seeks to increase the corporate value of business investees by sending management personnel it has developed to fill key positions in these companies. In short, Mitsubishi Corporation’s business model today is to build value chains—a chain of added value—to increase earnings. The company continues to evolve from a low-risk, low-return intermediary into a global business enterprise that aims to generate higher returns while managing risk. The company’s value chain in the automobile field illustrates this point. This value chain centers on overseas distribution-related businesses of Mitsubishi Motors Corporation (MMC) and Isuzu Motors Limited brand vehicles. The company’s network extends to all parts of the world, but is centered on Asia and Europe, with Indonesia and Thailand, in particular, positioned as strategically important regions for Mitsubishi and Isuzu vehicles, respectively. Mitsubishi Corporation has built a robust value chain in which it is involved in one way or another with everything from vehicle and engine assembly to automobile finance and dealerships downstream. Mitsubishi Corporation has augmented the value chain in Thailand by now exporting finished vehicles around the world. Similarly, the company is playing a central role in the advancement and development of value chains in other non-resource fields such as petrochemicals, agricultural and marine products, and real estate. The same goes for resource fields such as steel raw materials and steel products, and LNG.
12 Mitsubishi Corporation Annual Report 2008
A n E v A l u A t i o n o f M C ’ s C o r p o r A t E v A l u E
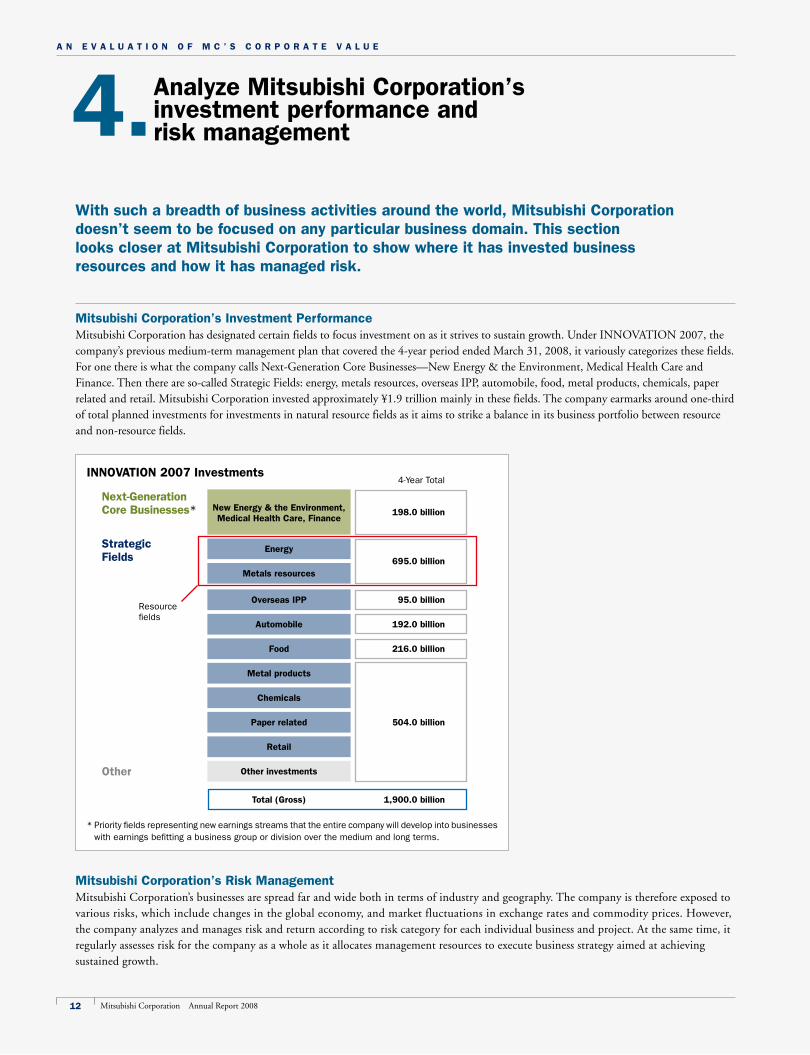
innovAtion 2007 investments
next-Generation Core Businesses* new Energy & the Environment,
Medical Health Care, finance
strategic fields
Energy
Metals resources
overseas ipp
Automobile
food
Metal products
Chemicals
paper related
retail
other investments
total (Gross) 1,900.0 billion
504.0 billion
216.0 billion
192.0 billion
95.0 billion
695.0 billion
198.0 billion
4-Year Total
other
* Priority fields representing new earnings streams that the entire company will develop into businesses with earnings befitting a business group or division over the medium and long terms.
Resource fields
4.With such a breadth of business activities around the world, Mitsubishi Corporation doesn’t seem to be focused on any particular business domain. this section looks closer at Mitsubishi Corporation to show where it has invested business resources and how it has managed risk.
Analyze Mitsubishi Corporation’s investment performance and risk management
Mitsubishi Corporation’s investment performanceMitsubishi Corporation has designated certain fields to focus investment on as it strives to sustain growth. Under INNOVATION 2007, the company’s previous medium-term management plan that covered the 4-year period ended March 31, 2008, it variously categorizes these fields. For one there is what the company calls Next-Generation Core Businesses—New Energy & the Environment, Medical Health Care and Finance. Then there are so-called Strategic Fields: energy, metals resources, overseas IPP, automobile, food, metal products, chemicals, paper related and retail. Mitsubishi Corporation invested approximately ¥1.9 trillion mainly in these fields. The company earmarks around one-third of total planned investments for investments in natural resource fields as it aims to strike a balance in its business portfolio between resource and non-resource fields.
Mitsubishi Corporation’s risk ManagementMitsubishi Corporation’s businesses are spread far and wide both in terms of industry and geography. The company is therefore exposed to various risks, which include changes in the global economy, and market fluctuations in exchange rates and commodity prices. However, the company analyzes and manages risk and return according to risk category for each individual business and project. At the same time, it regularly assesses risk for the company as a whole as it allocates management resources to execute business strategy aimed at achieving sustained growth.
13Mitsubishi Corporation Annual Report 2008
A n E v A l u A t i o n o f M C ’ s C o r p o r A t E v A l u E
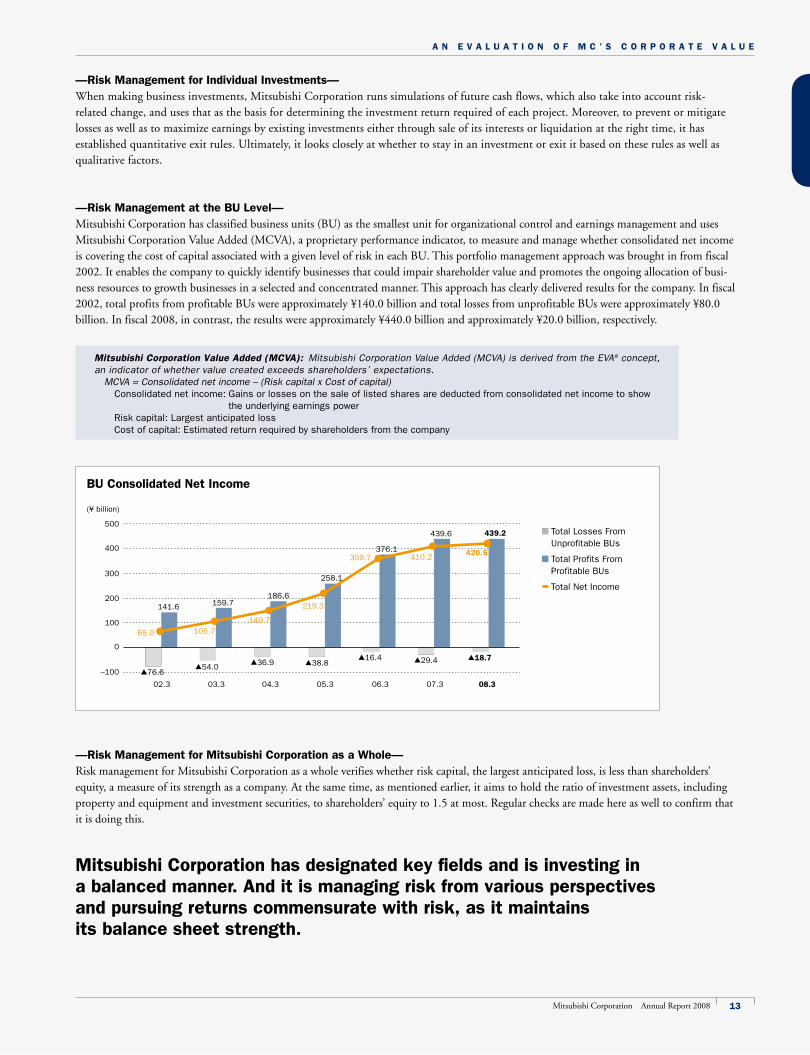
Bu Consolidated net income
(¥ billion)
0
–100
100
200
300
400
500
▲76.6▲54.0
08.3
▲18.7
05.304.302.3 03.3
159.7141.6
186.6
258.1
376.1
439.6 439.2
06.3 07.3
▲36.9 ▲38.8▲16.4 ▲29.4
105.765.0
149.7
219.3
359.7 410.2420.5
n Total Losses From Unprofitable BUs
n Total Profits From Profitable BUs
Total Net Income
Mitsubishi Corporation has designated key fields and is investing in a balanced manner. And it is managing risk from various perspectives and pursuing returns commensurate with risk, as it maintains its balance sheet strength.
—risk Management for individual investments—When making business investments, Mitsubishi Corporation runs simulations of future cash flows, which also take into account risk-related change, and uses that as the basis for determining the investment return required of each project. Moreover, to prevent or mitigate losses as well as to maximize earnings by existing investments either through sale of its interests or liquidation at the right time, it has established quantitative exit rules. Ultimately, it looks closely at whether to stay in an investment or exit it based on these rules as well as qualitative factors.
—risk Management at the Bu level—Mitsubishi Corporation has classified business units (BU) as the smallest unit for organizational control and earnings management and uses Mitsubishi Corporation Value Added (MCVA), a proprietary performance indicator, to measure and manage whether consolidated net income is covering the cost of capital associated with a given level of risk in each BU. This portfolio management approach was brought in from fiscal 2002. It enables the company to quickly identify businesses that could impair shareholder value and promotes the ongoing allocation of busi-ness resources to growth businesses in a selected and concentrated manner. This approach has clearly delivered results for the company. In fiscal 2002, total profits from profitable BUs were approximately ¥140.0 billion and total losses from unprofitable BUs were approximately ¥80.0 billion. In fiscal 2008, in contrast, the results were approximately ¥440.0 billion and approximately ¥20.0 billion, respectively.
—risk Management for Mitsubishi Corporation as a Whole—Risk management for Mitsubishi Corporation as a whole verifies whether risk capital, the largest anticipated loss, is less than shareholders’ equity, a measure of its strength as a company. At the same time, as mentioned earlier, it aims to hold the ratio of investment assets, including property and equipment and investment securities, to shareholders’ equity to 1.5 at most. Regular checks are made here as well to confirm that it is doing this.
Mitsubishi Corporation Value Added (MCVA): Mitsubishi Corporation Value Added (MCVA) is derived from the EVA® concept, an indicator of whether value created exceeds shareholders’ expectations. MCVA = Consolidated net income – (Risk capital x Cost of capital) Consolidated net income: Gains or losses on the sale of listed shares are deducted from consolidated net income to show
the underlying earnings power Risk capital: Largest anticipated loss Cost of capital: Estimated return required by shareholders from the company
A n E v A l u A t i o n o f M C ’ s C o r p o r A t E v A l u E
14 Mitsubishi Corporation Annual Report 2008
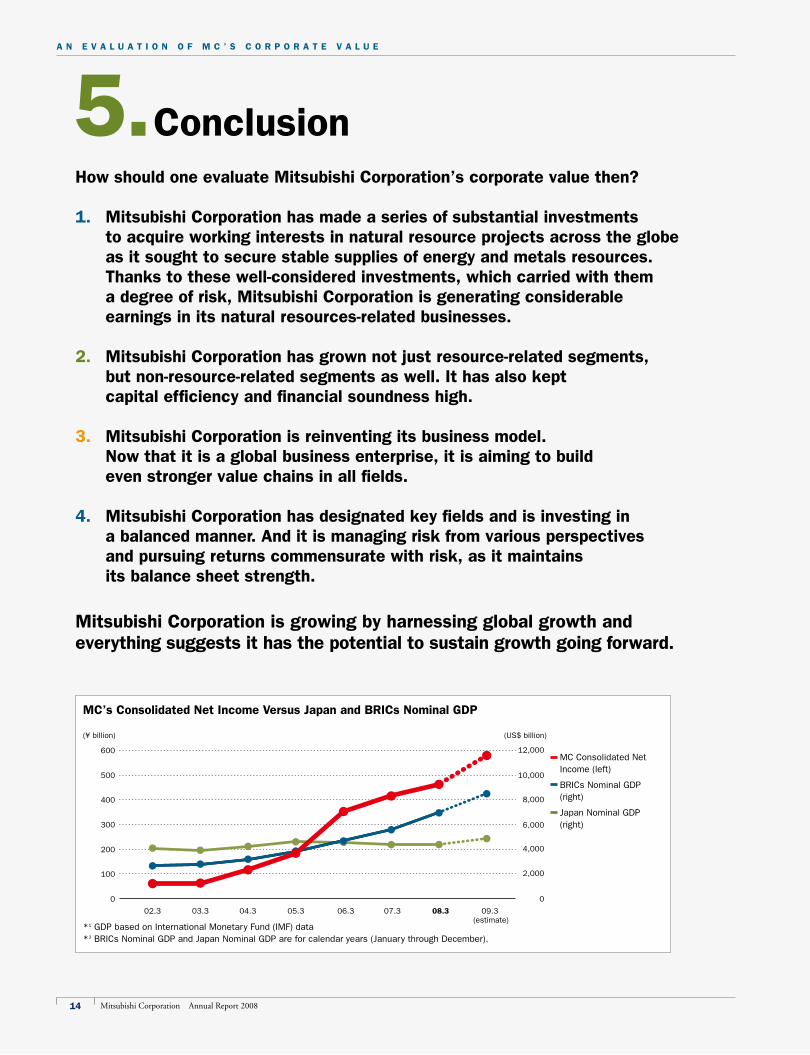
5.ConclusionHow should one evaluate Mitsubishi Corporation’s corporate value then?
1. Mitsubishi Corporation has made a series of substantial investments to acquire working interests in natural resource projects across the globe as it sought to secure stable supplies of energy and metals resources. thanks to these well-considered investments, which carried with them a degree of risk, Mitsubishi Corporation is generating considerable earnings in its natural resources-related businesses.
2. Mitsubishi Corporation has grown not just resource-related segments, but non-resource-related segments as well. it has also kept capital efficiency and financial soundness high.
3. Mitsubishi Corporation is reinventing its business model. now that it is a global business enterprise, it is aiming to build even stronger value chains in all fields.
4. Mitsubishi Corporation has designated key fields and is investing in a balanced manner. And it is managing risk from various perspectives and pursuing returns commensurate with risk, as it maintains its balance sheet strength.
Mitsubishi Corporation is growing by harnessing global growth and everything suggests it has the potential to sustain growth going forward.
MC’s Consolidated net income versus Japan and BriCs nominal GDp
(¥ billion) (US$ billion)
0
100
200
300
400
500
600 12,000
0
4,000
2,000
6,000
8,000
10,000
08.305.304.302.3 03.3 06.3 07.3 09.3
MC Consolidated Net Income (left)
BRICs Nominal GDP (right)
Japan Nominal GDP (right)
*1 GDP based on International Monetary Fund (IMF) data*2 BRICs Nominal GDP and Japan Nominal GDP are for calendar years (January through December).
(estimate)
15Mitsubishi Corporation Annual Report 2008
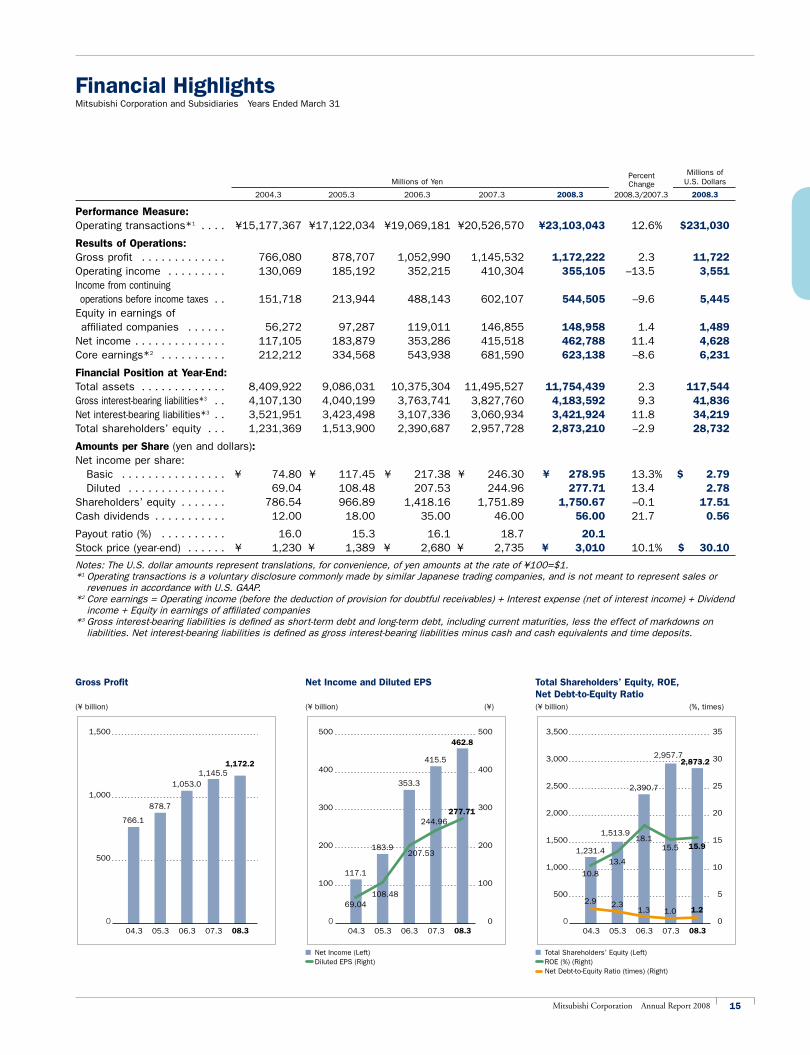
financial HighlightsMitsubishi Corporation and Subsidiaries Years Ended March 31
Millions of Millions of Yen U.S. Dollars
2004.3 2005.3 2006.3 2007.3 2008.3 2008.3/2007.3 2008.3
performance Measure:Operating transactions*1 . . . . ¥15,177,367 ¥17,122,034 ¥19,069,181 ¥20,526,570 ¥23,103,043 12.6% $231,030
results of operations:Gross profit . . . . . . . . . . . . . 766,080 878,707 1,052,990 1,145,532 1,172,222 2.3 11,722Operating income . . . . . . . . . 130,069 185,192 352,215 410,304 355,105 –13.5 3,551Income from continuing operations before income taxes . . 151,718 213,944 488,143 602,107 544,505 –9.6 5,445Equity in earnings of affiliated companies . . . . . . 56,272 97,287 119,011 146,855 148,958 1.4 1,489Net income . . . . . . . . . . . . . . 117,105 183,879 353,286 415,518 462,788 11.4 4,628Core earnings*2 . . . . . . . . . . 212,212 334,568 543,938 681,590 623,138 –8.6 6,231
financial position at Year-End:Total assets . . . . . . . . . . . . . 8,409,922 9,086,031 10,375,304 11,495,527 11,754,439 2.3 117,544Gross interest-bearing liabilities*3 . . 4,107,130 4,040,199 3,763,741 3,827,760 4,183,592 9.3 41,836Net interest-bearing liabilities*3 . . 3,521,951 3,423,498 3,107,336 3,060,934 3,421,924 11.8 34,219Total shareholders’ equity . . . 1,231,369 1,513,900 2,390,687 2,957,728 2,873,210 –2.9 28,732
Amounts per share (yen and dollars):Net income per share: Basic . . . . . . . . . . . . . . . . ¥ 74.80 ¥ 117.45 ¥ 217.38 ¥ 246.30 ¥ 278.95 13.3% $ 2.79 Diluted . . . . . . . . . . . . . . . 69.04 108.48 207.53 244.96 277.71 13.4 2.78Shareholders’ equity . . . . . . . 786.54 966.89 1,418.16 1,751.89 1,750.67 –0.1 17.51Cash dividends . . . . . . . . . . . 12.00 18.00 35.00 46.00 56.00 21.7 0.56
Payout ratio (%) . . . . . . . . . . 16.0 15.3 16.1 18.7 20.1Stock price (year-end) . . . . . . ¥ 1,230 ¥ 1,389 ¥ 2,680 ¥ 2,735 ¥ 3,010 10.1% $ 30.10
Notes: The U.S. dollar amounts represent translations, for convenience, of yen amounts at the rate of ¥100=$1.*1 Operating transactions is a voluntary disclosure commonly made by similar Japanese trading companies, and is not meant to represent sales or
revenues in accordance with U.S. GAAP.*2 Core earnings = Operating income (before the deduction of provision for doubtful receivables) + Interest expense (net of interest income) + Dividend
income + Equity in earnings of affiliated companies*3 Gross interest-bearing liabilities is defined as short-term debt and long-term debt, including current maturities, less the effect of markdowns on
liabilities. Net interest-bearing liabilities is defined as gross interest-bearing liabilities minus cash and cash equivalents and time deposits.
Gross profit
(¥ billion)
net income and Diluted Eps
(¥ billion) (¥)
total shareholders’ Equity, roE, net Debt-to-Equity ratio(¥ billion) (%, times)
n Total Shareholders’ Equity (Left) ROE (%) (Right) Net Debt-to-Equity Ratio (times) (Right)
n Net Income (Left) Diluted EPS (Right)
1,145.51,172.2
04.3 05.3 06.3 07.3 08.3
766.1
878.7
1,053.0
0
500
1,000
1,500
415.5
244.96277.71
462.8
04.3 05.3 06.3 07.3 08.3
117.1
69.04
183.9
108.48
353.3
207.53
0
100
200
300
400
500
0
100
200
300
400
500
2,957.72,873.2
15.5
1.0
15.9
1.2
04.3 05.3 06.3 07.3 08.3
1,231.4
2.9
10.8
1,513.9
13.4
2.3
2,390.7
18.1
1.3
0
500
1,000
1,500
2,000
2,500
3,000
3,500
0
5
10
15
20
25
30
35
Percent Change
16 Mitsubishi Corporation Annual Report 2008
0
100
50
200
150
300
250
400
350
450
500
07.3 08.3
31.81.9
74.1
186.4
58.0
20.0
48.3
–5.0
1.117.7
94.2
158.2
66.5
34.7
51.0
39.4
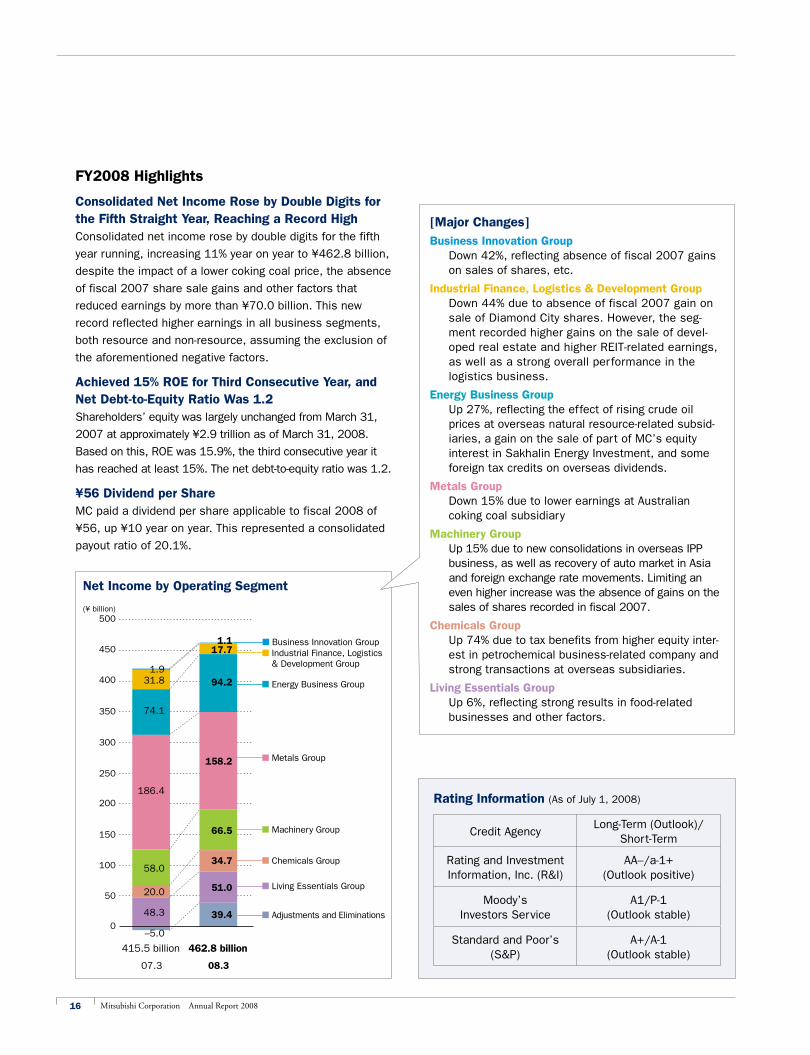
rating information (As of July 1, 2008)
Credit AgencyLong-Term (Outlook)/
Short-Term
Rating and Investment Information, Inc. (R&I)
AA–/a-1+ (Outlook positive)
Moody’s Investors Service
A1/P-1 (Outlook stable)
Standard and Poor’s (S&P)
A+/A-1 (Outlook stable)
fY2008 Highlights
Consolidated net income rose by Double Digits for the fifth straight Year, reaching a record HighConsolidated net income rose by double digits for the fifth
year running, increasing 11% year on year to ¥462.8 billion,
despite the impact of a lower coking coal price, the absence
of fiscal 2007 share sale gains and other factors that
reduced earnings by more than ¥70.0 billion. This new
record reflected higher earnings in all business segments,
both resource and non-resource, assuming the exclusion of
the aforementioned negative factors.
Achieved 15% roE for third Consecutive Year, and net Debt-to-Equity ratio Was 1.2Shareholders’ equity was largely unchanged from March 31,
2007 at approximately ¥2.9 trillion as of March 31, 2008.
Based on this, ROE was 15.9%, the third consecutive year it
has reached at least 15%. The net debt-to-equity ratio was 1.2.
¥56 Dividend per share MC paid a dividend per share applicable to fiscal 2008 of
¥56, up ¥10 year on year. This represented a consolidated
payout ratio of 20.1%.
net income by operating segment
(¥ billion)
n Business Innovation Groupn Industrial Finance, Logistics
& Development Group
n Energy Business Group
n Metals Group
n Machinery Group
n Chemicals Group
n Living Essentials Group
n Adjustments and Eliminations
415.5 billion 462.8 billion
[Major Changes]Business innovation Group
Down 42%, reflecting absence of fiscal 2007 gains on sales of shares, etc.
industrial finance, logistics & Development GroupDown 44% due to absence of fiscal 2007 gain on sale of Diamond City shares. However, the seg-ment recorded higher gains on the sale of devel-oped real estate and higher REIT-related earnings, as well as a strong overall per formance in the logistics business.
Energy Business GroupUp 27%, reflecting the effect of rising crude oil prices at overseas natural resource-related subsid-iaries, a gain on the sale of part of MC’s equity interest in Sakhalin Energy Investment, and some foreign tax credits on overseas dividends.
Metals GroupDown 15% due to lower earnings at Australian coking coal subsidiary
Machinery GroupUp 15% due to new consolidations in overseas IPP business, as well as recovery of auto market in Asia and foreign exchange rate movements. Limiting an even higher increase was the absence of gains on the sales of shares recorded in fiscal 2007.
Chemicals GroupUp 74% due to tax benefits from higher equity inter-est in petrochemical business-related company and strong transactions at overseas subsidiaries.
living Essentials GroupUp 6%, reflecting strong results in food-related businesses and other factors.
17Mitsubishi Corporation Annual Report 2008
I’m pleased to be writing to all shareholders and other stakeholders again this year.
For the past four years, we have implemented the INNOVATION 2007 medium-term man-
agement plan, which laid out our vision of MC as “A New Industry Innovator.” This plan
saw us take steps to strengthen core businesses, centered on what we call Strategic
Fields, and fields that we see as strategically important for the future. These efforts cul-
minated in record consolidated net income for the fifth straight year in fiscal 2008—we
posted ¥462.8 billion. We also saw total shareholders’ equity increase to approximately
¥2.9 trillion at March 31, 2008. Our credit ratings have improved as well. So, besides
having increased earnings substantially, we are now much stronger operationally and
financially. As we built shareholders’ equity, we used it to make investments of approxi-
mately ¥1.9 trillion during the four-year INNOVATION 2007 period. These investments
were made as part of stepped-up initiatives designed to ensure we sustain our growth.
We looked beyond that, too, to develop new businesses that will drive growth over the
medium term. Actions included establishing two new business groups: Business Innova-
tion Group, and Industrial Finance, Logistics & Development Group. Developing and utiliz-
ing our people was another key focus. In this vein, we established the Center for Human
Resources Development to develop human resources across the MC Group in an inte-
grated manner. Besides these actions, we strengthened our internal control systems,
enhanced our system infrastructure and took other actions to continuously strengthen
our management system. If I were to grade our efforts under INNOVATION 2007, I would
say we passed with flying colors.
In April this year, we launched a new two-year plan called INNOVATION 2009 to ensure
we maintain our high standards of performance. INNOVATION 2009 carries on the same
basic stance as its four-year predecessor. Our goal is to contribute to the continuous
advancement of society while sustaining our growth and raising consolidated corporate
value as a global business enterprise.
To Our Stakeholders
From INNOVATION 2007 to INNOVATION 2009
18 Mitsubishi Corporation Annual Report 2008
INNOVATION 2009—Opening Up A New EraINNOVATION 2009 covers the two-year period ending March 31,
2010. Our vision under this plan, as it was under INNOVATION
2007, is to be “A New Industry Innovator.” This means we will
continue to grow along with society with the lofty ambition of
opening up a new era. I think we live in an era in which this sort
of thinking is needed more than ever before.
The past four years has seen strong economic conditions
globally, with the rapid development of emerging nations driving
unprecedented growth. However, the much-talked-about sub-
prime loan crisis has triggered a worldwide economic slowdown.
Add to this the growing severity of environmental problems,
economic disparity and other social issues, as well as multipo-
larization on the political and economic fronts, and it is clear we
live in an era of increasing uncertainty.
Yorihiko KojimaPresident and CEO
Pursuing More Value Under INNOVATION 2009
19Mitsubishi Corporation Annual Report 2008
MC has benefited from the run-up in natural resource prices
and favorable global economic conditions, growing steadily to
date. However, to sustain our growth in a difficult era of high
uncertainty, we must accurately harness the forces of global
change and turn this change into business opportunities. It
will be important to respond to this change with speed and
with a clear direction for the future. Rather than just react to
change, one needs to anticipate societal and economic
change and have the foresight, courage and conviction to take
the first steps before others. Survival in a global economy
depends on this.
This is also an era that demands more of companies in
terms of fulfilling their corporate social responsibilities (CSR).
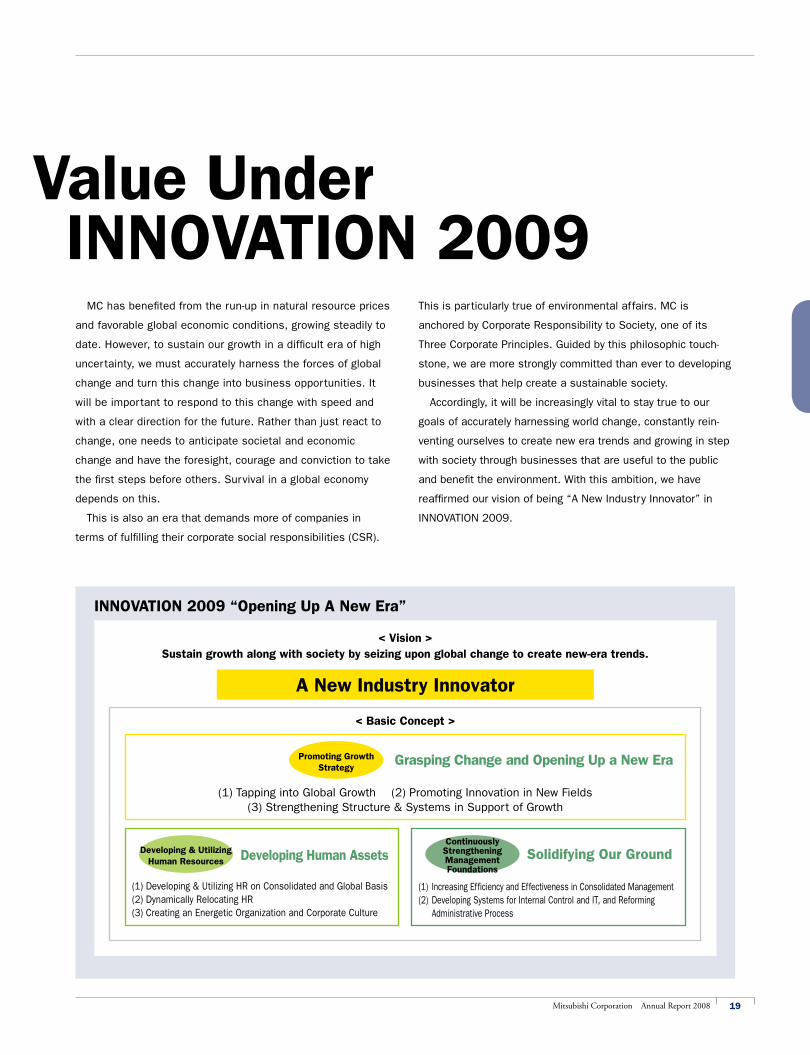
INNOVATION 2009 “Opening Up A New Era”
< Vision >Sustain growth along with society by seizing upon global change to create new-era trends.
< Basic Concept >
Promoting Growth Strategy
Grasping Change and Opening Up a New Era
(1) Tapping into Global Growth (2) Promoting Innovation in New Fields (3) Strengthening Structure & Systems in Support of Growth
(1) Developing & Utilizing HR on Consolidated and Global Basis(2) Dynamically Relocating HR(3) Creating an Energetic Organization and Corporate Culture
(1) Increasing Efficiency and Effectiveness in Consolidated Management(2) Developing Systems for Internal Control and IT, and Reforming
Administrative Process
A New Industry Innovator
This is particularly true of environmental affairs. MC is
anchored by Corporate Responsibility to Society, one of its
Three Corporate Principles. Guided by this philosophic touch-
stone, we are more strongly committed than ever to developing
businesses that help create a sustainable society.
Accordingly, it will be increasingly vital to stay true to our
goals of accurately harnessing world change, constantly rein-
venting ourselves to create new era trends and growing in step
with society through businesses that are useful to the public
and benefit the environment. With this ambition, we have
reaffirmed our vision of being “A New Industry Innovator” in
INNOVATION 2009.
Developing & Utilizing Human Resources
Continuously Strengthening Management Foundations
Developing Human Assets Solidifying Our Ground
Pursuing More Value Under INNOVATION 2009
20 Mitsubishi Corporation Annual Report 2008
We regard the next two years as a period for both building
on our achievements thus far and consolidating on our posi-
tion for the future. We are thus not taking a short-sighted view
of things. In terms of the first of these two points, we plan to
strengthen and expand existing core business domains while
pursuing even greater prioritization of resources. In concert
with this, we will promote innovation across the company in a
bid to create growth businesses of the future. Regarding the
second point, we will steadily enhance Group management,
our internal control systems and other aspects of our manage-
ment system as the foundation for ensuring sustained growth.
The basic concepts of INNOVATION 2009 are explained later in
this section.
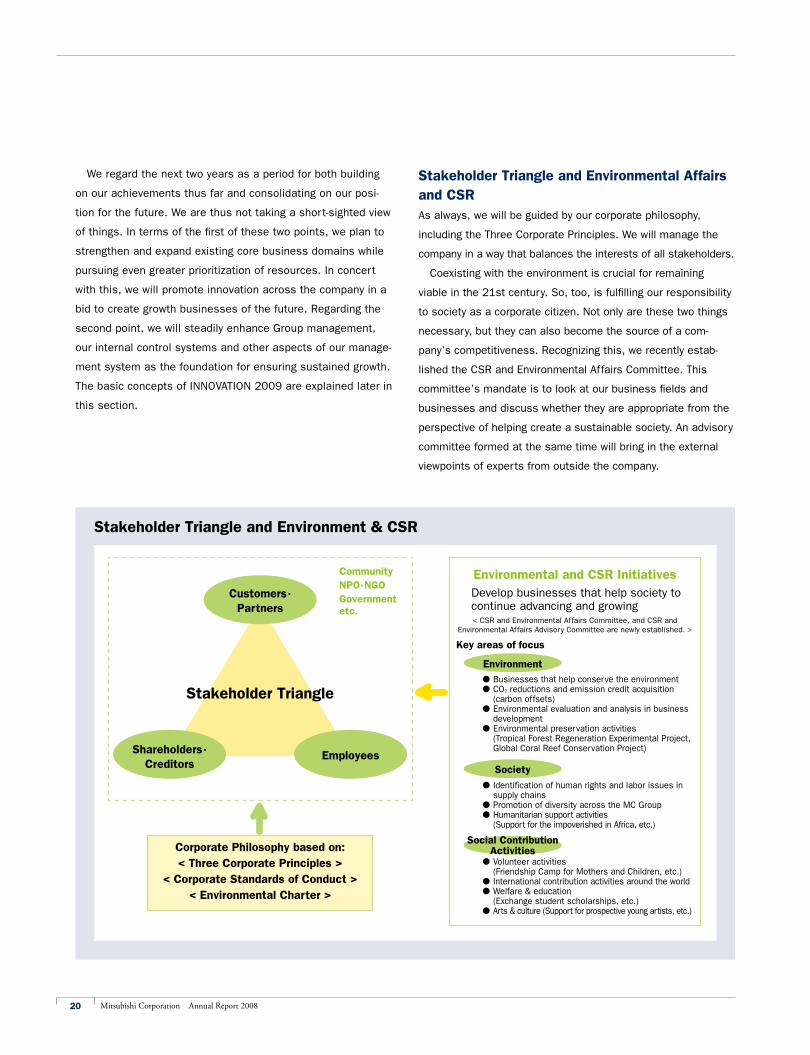
Stakeholder Triangle and Environmental Affairs and CSRAs always, we will be guided by our corporate philosophy,
including the Three Corporate Principles. We will manage the
company in a way that balances the interests of all stakeholders.
Coexisting with the environment is crucial for remaining
viable in the 21st century. So, too, is fulfilling our responsibility
to society as a corporate citizen. Not only are these two things
necessary, but they can also become the source of a com-
pany’s competitiveness. Recognizing this, we recently estab-
lished the CSR and Environmental Affairs Committee. This
committee’s mandate is to look at our business fields and
businesses and discuss whether they are appropriate from the
perspective of helping create a sustainable society. An advisory
committee formed at the same time will bring in the external
viewpoints of experts from outside the company.
Stakeholder Triangle and Environment & CSR
Stakeholder Triangle
Corporate Philosophy based on:< Three Corporate Principles >
< Corporate Standards of Conduct >< Environmental Charter >
Customers· Partners
Shareholders· Creditors
Employees
CommunityNPO·NGOGovernment etc.
l Businesses that help conserve the environmentl CO2 reductions and emission credit acquisition
(carbon offsets)l Environmental evaluation and analysis in business
developmentl Environmental preservation activities
(Tropical Forest Regeneration Experimental Project, Global Coral Reef Conservation Project)
l Identification of human rights and labor issues in supply chains
l Promotion of diversity across the MC Groupl Humanitarian support activities
(Support for the impoverished in Africa, etc.)
l Volunteer activities (Friendship Camp for Mothers and Children, etc.)
l International contribution activities around the worldl Welfare & education
(Exchange student scholarships, etc.)l Arts & culture (Support for prospective young artists, etc.)
Environment
Environmental and CSR InitiativesDevelop businesses that help society to continue advancing and growing< CSR and Environmental Affairs Committee, and CSR and
Environmental Affairs Advisory Committee are newly established. >
Key areas of focus
Social Contribution Activities
Society
21Mitsubishi Corporation Annual Report 2008
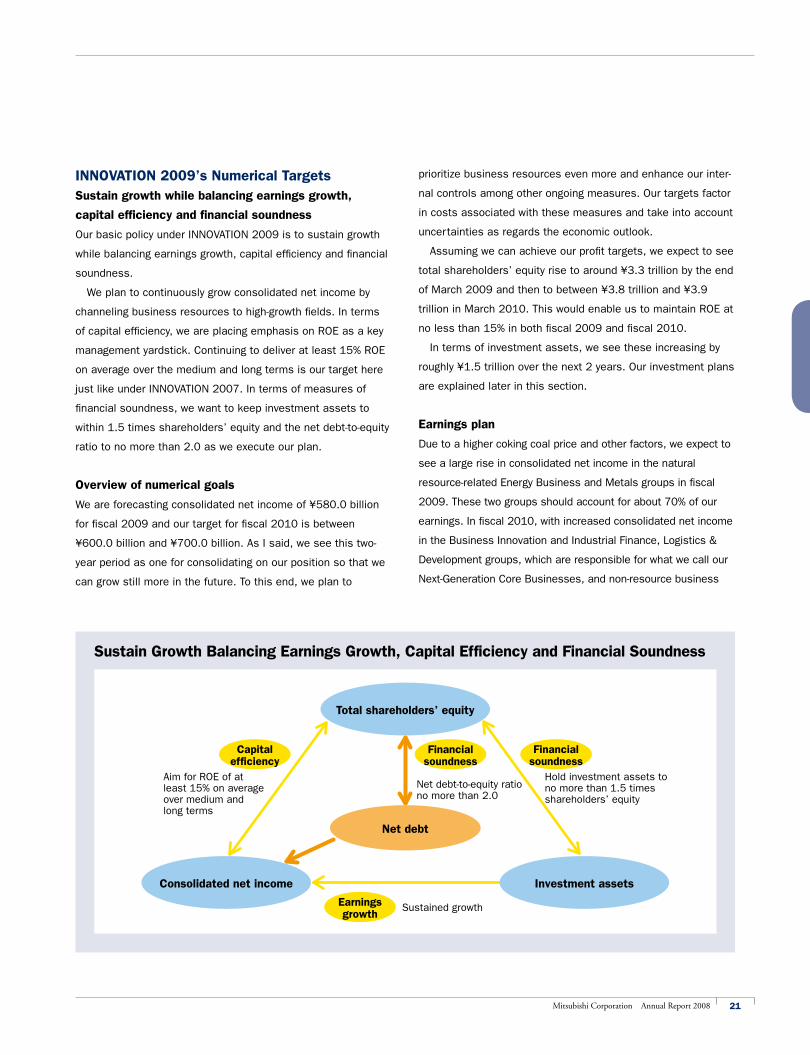
Sustain Growth Balancing Earnings Growth, Capital Efficiency and Financial Soundness
Sustained growth
Aim for ROE of at least 15% on average over medium and long terms
Hold investment assets to no more than 1.5 times shareholders’ equity
Net debt-to-equity ratio no more than 2.0
Total shareholders’ equity
Consolidated net income Investment assets
Net debt
Capital efficiency
Financial soundness
Financial soundness
Earnings growth
INNOVATION 2009’s Numerical TargetsSustain growth while balancing earnings growth,
capital efficiency and financial soundness
Our basic policy under INNOVATION 2009 is to sustain growth
while balancing earnings growth, capital efficiency and financial
soundness.
We plan to continuously grow consolidated net income by
channeling business resources to high-growth fields. In terms
of capital efficiency, we are placing emphasis on ROE as a key
management yardstick. Continuing to deliver at least 15% ROE
on average over the medium and long terms is our target here
just like under INNOVATION 2007. In terms of measures of
financial soundness, we want to keep investment assets to
within 1.5 times shareholders’ equity and the net debt-to-equity
ratio to no more than 2.0 as we execute our plan.
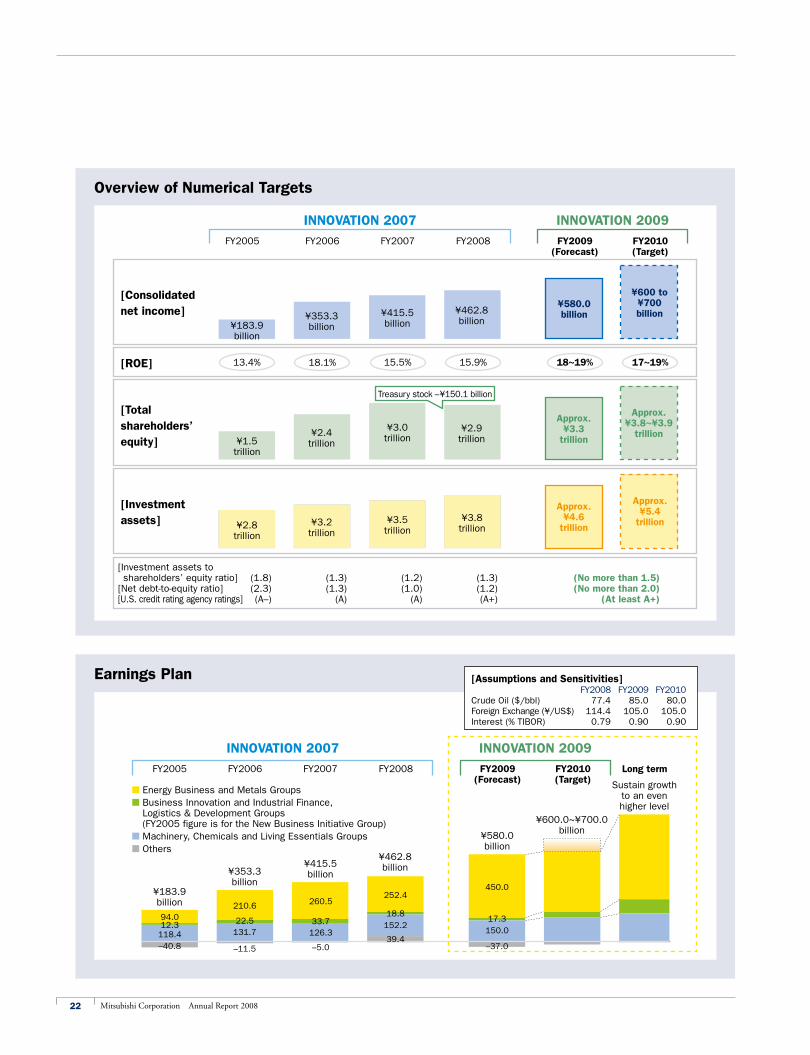
Overview of numerical goals
We are forecasting consolidated net income of ¥580.0 billion
for fiscal 2009 and our target for fiscal 2010 is between
¥600.0 billion and ¥700.0 billion. As I said, we see this two-
year period as one for consolidating on our position so that we
can grow still more in the future. To this end, we plan to
prioritize business resources even more and enhance our inter-
nal controls among other ongoing measures. Our targets factor
in costs associated with these measures and take into account
uncertainties as regards the economic outlook.
Assuming we can achieve our profit targets, we expect to see
total shareholders’ equity rise to around ¥3.3 trillion by the end
of March 2009 and then to between ¥3.8 trillion and ¥3.9
trillion in March 2010. This would enable us to maintain ROE at
no less than 15% in both fiscal 2009 and fiscal 2010.
In terms of investment assets, we see these increasing by
roughly ¥1.5 trillion over the next 2 years. Our investment plans
are explained later in this section.
Earnings plan
Due to a higher coking coal price and other factors, we expect to
see a large rise in consolidated net income in the natural
resource-related Energy Business and Metals groups in fiscal
2009. These two groups should account for about 70% of our
earnings. In fiscal 2010, with increased consolidated net income
in the Business Innovation and Industrial Finance, Logistics &
Development groups, which are responsible for what we call our
Next-Generation Core Businesses, and non-resource business
22 Mitsubishi Corporation Annual Report 2008
Earnings Plan
INNOVATION 2007 INNOVATION 2009
FY2005 FY2006 FY2007 FY2008 FY2009 (Forecast)
FY2010 (Target) Sustain growth
to an even higher level
94.0210.6
118.4 131.7
–40.8 –11.5
12.3 22.5
¥183.9 billion
¥353.3 billion
¥415.5 billion
¥462.8 billion
¥580.0 billion
¥600.0~¥700.0 billion
n Energy Business and Metals Groupsn Business Innovation and Industrial Finance,
Logistics & Development Groups (FY2005 figure is for the New Business Initiative Group)
n Machinery, Chemicals and Living Essentials Groupsn Others
260.5
126.3
–5.0
33.7
252.4
152.2
39.4
18.8
450.0
150.0
–37.0
17.3
Long term
[Assumptions and Sensitivities] FY2008 FY2009 FY2010Crude Oil ($/bbl) 77.4 85.0 80.0Foreign Exchange (¥/US$) 114.4 105.0 105.0Interest (% TIBOR) 0.79 0.90 0.90
[Investment assets to shareholders’ equity ratio] (1.8) (1.3) (1.2) (1.3) (No more than 1.5) [Net debt-to-equity ratio] (2.3) (1.3) (1.0) (1.2) (No more than 2.0) [U.S. credit rating agency ratings] (A–) (A) (A) (A+) (At least A+)
Overview of Numerical Targets
INNOVATION 2007 INNOVATION 2009
FY2005 FY2006 FY2007 FY2008 FY2009 (Forecast)
FY2010 (Target)
[Consolidated net income]
[Total shareholders’ equity]
[Investment assets]
[ROE]
¥183.9 billion
¥1.5 trillion
¥2.8 trillion
13.4%
¥353.3 billion
¥2.4 trillion
¥3.2 trillion
18.1%
¥415.5 billion
¥3.0 trillion
¥3.5 trillion
15.5%
¥462.8 billion
¥2.9 trillion
¥3.8 trillion
15.9%
¥580.0 billion
Approx. ¥3.3
trillion
Approx. ¥4.6
trillion
18~19%
¥600 to ¥700 billion
Approx. ¥3.8~¥3.9
trillion
Approx. ¥5.4
trillion
17~19%
Treasury stock –¥150.1 billion
23Mitsubishi Corporation Annual Report 2008
groups, namely the Machinery, Chemicals and Living Essentials
groups, we believe we can generate consolidated net income of
between ¥600.0 billion and ¥700.0 billion.
The share of earnings generated by natural resources and
energy should rise for the time being. But we are also trying to
grow other promising growth fields because I believe that
achieving a balanced earnings structure as a global business
enterprise, one that can leverage its collective strengths in
wide-ranging fields, will sustain our growth.
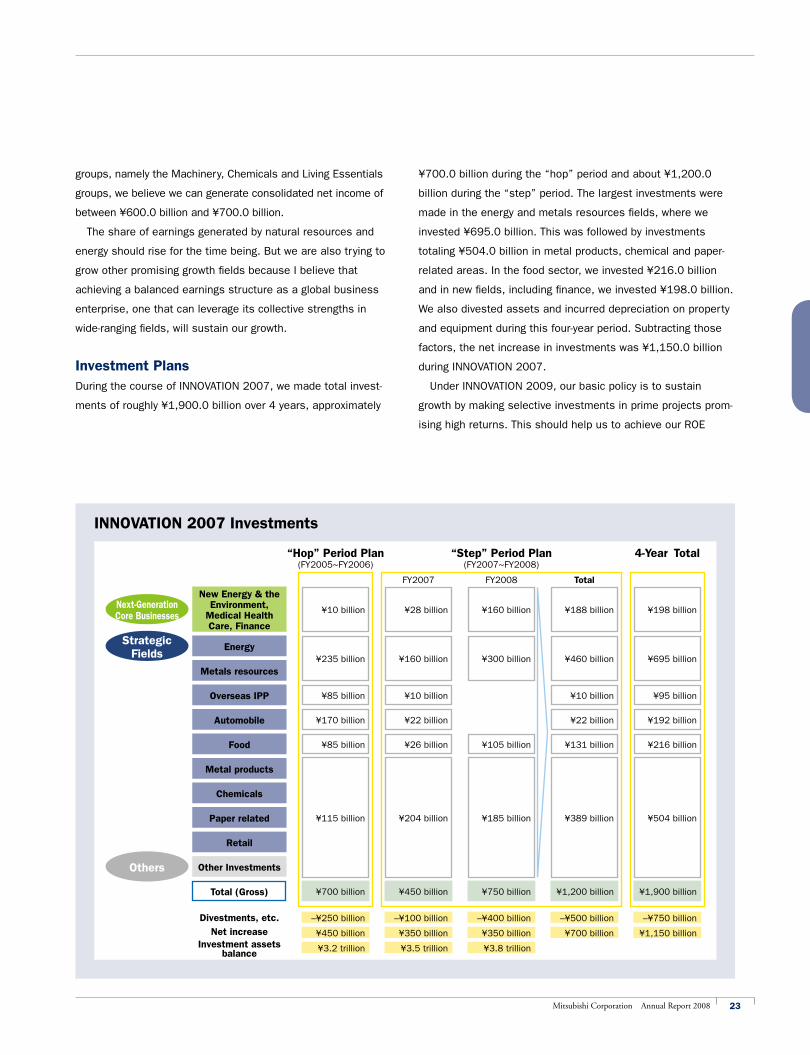
Investment PlansDuring the course of INNOVATION 2007, we made total invest-
ments of roughly ¥1,900.0 billion over 4 years, approximately
¥700.0 billion during the “hop” period and about ¥1,200.0
billion during the “step” period. The largest investments were
made in the energy and metals resources fields, where we
invested ¥695.0 billion. This was followed by investments
totaling ¥504.0 billion in metal products, chemical and paper-
related areas. In the food sector, we invested ¥216.0 billion
and in new fields, including finance, we invested ¥198.0 billion.
We also divested assets and incurred depreciation on property
and equipment during this four-year period. Subtracting those
factors, the net increase in investments was ¥1,150.0 billion
during INNOVATION 2007.
Under INNOVATION 2009, our basic policy is to sustain
growth by making selective investments in prime projects prom-
ising high returns. This should help us to achieve our ROE
INNOVATION 2007 Investments
Next-Generation Core Businesses
Strategic Fields
Others
New Energy & the Environment,
Medical Health Care, Finance
Energy
Metals resources
Overseas IPP
Automobile
Food
Metal products
Chemicals
Paper related
Retail
Other Investments
Total (Gross)
Divestments, etc.Net increase
Investment assets balance
¥700 billion
–¥250 billion
¥450 billion
¥3.2 trillion
¥450 billion
–¥100 billion
¥350 billion
¥3.5 trillion
¥750 billion
–¥400 billion
¥350 billion
¥3.8 trillion
¥1,200 billion
–¥500 billion
¥700 billion
¥1,900 billion
–¥750 billion
¥1,150 billion
¥115 billion ¥204 billion ¥185 billion ¥389 billion ¥504 billion
¥85 billion ¥26 billion ¥105 billion ¥131 billion ¥216 billion
¥170 billion ¥22 billion ¥22 billion ¥192 billion
¥85 billion ¥10 billion ¥10 billion ¥95 billion
¥235 billion ¥160 billion ¥300 billion ¥460 billion ¥695 billion
¥10 billion ¥28 billion ¥160 billion ¥188 billion ¥198 billion
“Hop” Period Plan (FY2005~FY2006)
“Step” Period Plan(FY2007~FY2008)
4-Year Total
FY2007 FY2008 Total
24 Mitsubishi Corporation Annual Report 2008
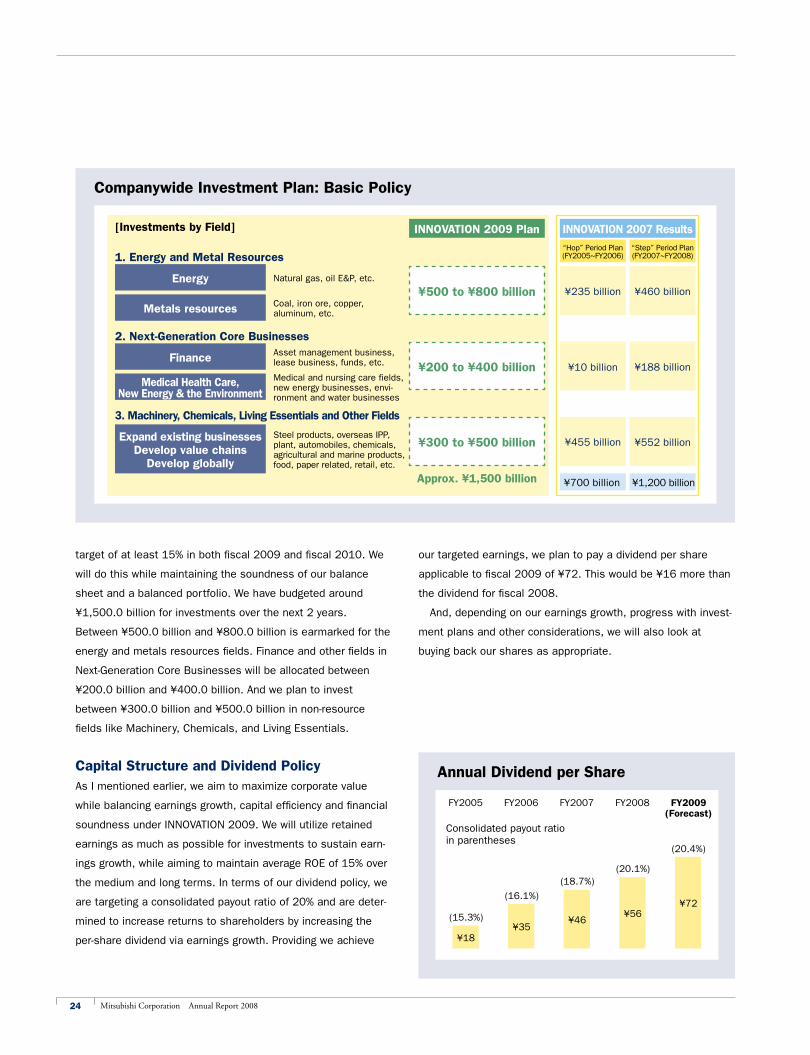
target of at least 15% in both fiscal 2009 and fiscal 2010. We
will do this while maintaining the soundness of our balance
sheet and a balanced portfolio. We have budgeted around
¥1,500.0 billion for investments over the next 2 years.
Between ¥500.0 billion and ¥800.0 billion is earmarked for the
energy and metals resources fields. Finance and other fields in
Next-Generation Core Businesses will be allocated between
¥200.0 billion and ¥400.0 billion. And we plan to invest
between ¥300.0 billion and ¥500.0 billion in non-resource
fields like Machinery, Chemicals, and Living Essentials.
Capital Structure and Dividend PolicyAs I mentioned earlier, we aim to maximize corporate value
while balancing earnings growth, capital efficiency and financial
soundness under INNOVATION 2009. We will utilize retained
earnings as much as possible for investments to sustain earn-
ings growth, while aiming to maintain average ROE of 15% over
the medium and long terms. In terms of our dividend policy, we
are targeting a consolidated payout ratio of 20% and are deter-
mined to increase returns to shareholders by increasing the
per-share dividend via earnings growth. Providing we achieve
Companywide Investment Plan: Basic Policy
[Investments by Field]
1. Energy and Metal Resources
2. Next-Generation Core Businesses
3. Machinery, Chemicals, Living Essentials and Other Fields
Energy
Finance
Expand existing businesses Develop value chains
Develop globally
Metals resources
Medical Health Care, New Energy & the Environment
Natural gas, oil E&P, etc.
Asset management business, lease business, funds, etc.
Steel products, overseas IPP, plant, automobiles, chemicals, agricultural and marine products, food, paper related, retail, etc.
Coal, iron ore, copper, aluminum, etc.
Medical and nursing care fields, new energy businesses, envi-ronment and water businesses
INNOVATION 2009 Plan INNOVATION 2007 Results
¥500 to ¥800 billion ¥235 billion
¥10 billion
¥455 billion
¥460 billion
¥188 billion
¥552 billion
¥200 to ¥400 billion
¥300 to ¥500 billion
Approx. ¥1,500 billion ¥700 billion ¥1,200 billion
“Hop” Period Plan (FY2005~FY2006)
“Step” Period Plan (FY2007~FY2008)
Annual Dividend per Share
FY2005 FY2006 FY2007 FY2008 FY2009 (Forecast)
¥18¥35
¥46¥56
¥72
(15.3%)
(16.1%)
(18.7%)(20.1%)
(20.4%)
Consolidated payout ratio in parentheses
our targeted earnings, we plan to pay a dividend per share
applicable to fiscal 2009 of ¥72. This would be ¥16 more than
the dividend for fiscal 2008.
And, depending on our earnings growth, progress with invest-
ment plans and other considerations, we will also look at
buying back our shares as appropriate.

25Mitsubishi Corporation Annual Report 2008
INNOVATION 2009 Basic Concepts1. Promoting Growth Strategies—
“Grasping Change and Opening Up a New Era”
To sustain growth, we will strengthen and expand core business
domains and develop Next- Generation Core Businesses. As the
world becomes increasingly complex and uncertain, grasping
changes in the business environment and promoting medium-
to long-term growth are more important than ever. MC will
harness global growth, strengthen its systems to propel
innovation, and review the delegation of authority. And we will
continue to reform internal systems to better concentrate
resources on selected areas.
Tapping into global growth
Global change is creating opportunities and we want to
capitalize on it.
That’s why we have appointed a Corporate Functional Officer
in charge of Global Strategy who is responsible for identifying
ever-changing global trends in an integrated fashion, and pro-
posing strategy direction. Executive Vice Presidents (EVPs) for
each region outside Japan and a Senior Executive Vice President
(SEVP) for Japan have also been appointed. Their role is to
assist this Corporate Functional Officer from a management
standpoint. And we have divided the world into 8 regions, and
assigned a Chief Regional Officer (CRO) to each. The CROs will
propose opportunities from their respective regions, which shall
be reflected in MC’s business strategies in a timely fashion.
Promoting innovation in new fields
MC has forged ahead with efforts to thoroughly strengthen
existing core businesses. At the same time, we will work to
create new earnings pillars for the 21st century.
We are currently developing Next-Generation Core Businesses—
Medical Health Care, New Energy & the Environment, and
Finance—and will continue strengthening systems to promote
companywide efforts in entirely new fields.
Strengthening structures & systems for
sustainable growth
As a measure to support growth, we have further demarcated
management and execution roles and strengthened company-
wide management systems. Two SEVPs (Food, Agricultural
Resources & Consumer Market Strategies, and Resources &
Energy Strategies) have been appointed to assist the president
My mission is to develop a comprehensive policy and strategies for MC for the food
and agricultural resources and consumer markets. On June 10, 2008, the Food and
Agricultural Resources Comprehensive Policy Committee and Consumer Market
Strategy Committee were established under the auspices of the Executive Committee
to help with this work. I head both of these new committees. The food and agricul-
tural resources field has seen prices soar and is confronting various environmental
issues. It is a field that is the subject of much discussion around the world. I want to
develop an expansive comprehensive policy that only MC can implement by fostering
greater collaboration among related business units. This collaboration will allow us
to develop businesses with a higher level of sophistication such as biofuels and also
strengthen our capacity to procure food and agricultural resources. The consumer
market, meanwhile, reflects new trends and developments in society and the econ-
omy. Leveraging our strengths as a sogo shosha, we can break new ground here by
focusing on implementing our strategies.
Senior Executive Vice President, Food, Agricultural Resources & Consumer Market Strategies
Senior Executive Vice President
Takeshi Inoue
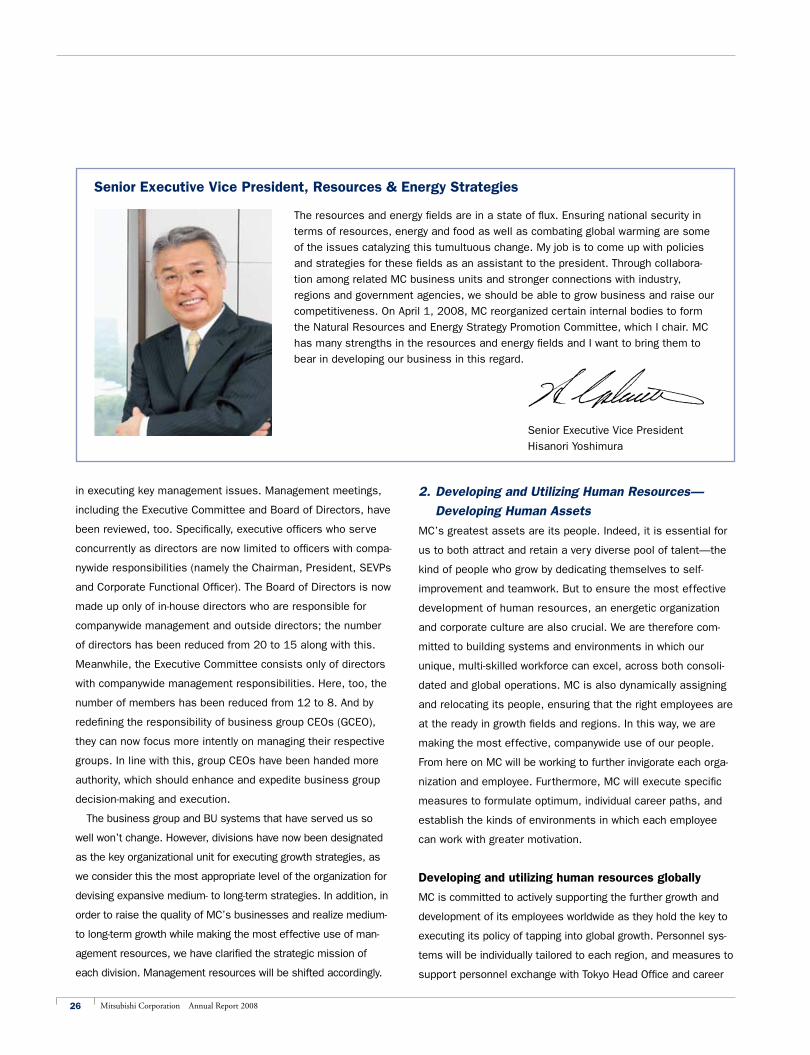
26 Mitsubishi Corporation Annual Report 2008
in executing key management issues. Management meetings,
including the Executive Committee and Board of Directors, have
been reviewed, too. Specifically, executive officers who serve
concurrently as directors are now limited to officers with compa-
nywide responsibilities (namely the Chairman, President, SEVPs
and Corporate Functional Officer). The Board of Directors is now
made up only of in-house directors who are responsible for
companywide management and outside directors; the number
of directors has been reduced from 20 to 15 along with this.
Meanwhile, the Executive Committee consists only of directors
with companywide management responsibilities. Here, too, the
number of members has been reduced from 12 to 8. And by
redefining the responsibility of business group CEOs (GCEO),
they can now focus more intently on managing their respective
groups. In line with this, group CEOs have been handed more
authority, which should enhance and expedite business group
decision-making and execution.
The business group and BU systems that have served us so
well won’t change. However, divisions have now been designated
as the key organizational unit for executing growth strategies, as
we consider this the most appropriate level of the organization for
devising expansive medium- to long-term strategies. In addition, in
order to raise the quality of MC’s businesses and realize medium-
to long-term growth while making the most effective use of man-
agement resources, we have clarified the strategic mission of
each division. Management resources will be shifted accordingly.
2. Developing and Utilizing Human Resources—
Developing Human Assets
MC’s greatest assets are its people. Indeed, it is essential for
us to both attract and retain a very diverse pool of talent—the
kind of people who grow by dedicating themselves to self-
improvement and teamwork. But to ensure the most effective
development of human resources, an energetic organization
and corporate culture are also crucial. We are therefore com-
mitted to building systems and environments in which our
unique, multi-skilled workforce can excel, across both consoli-
dated and global operations. MC is also dynamically assigning
and relocating its people, ensuring that the right employees are
at the ready in growth fields and regions. In this way, we are
making the most effective, companywide use of our people.
From here on MC will be working to further invigorate each orga-
nization and employee. Furthermore, MC will execute specific
measures to formulate optimum, individual career paths, and
establish the kinds of environments in which each employee
can work with greater motivation.
Developing and utilizing human resources globally
MC is committed to actively supporting the further growth and
development of its employees worldwide as they hold the key to
executing its policy of tapping into global growth. Personnel sys-
tems will be individually tailored to each region, and measures to
support personnel exchange with Tokyo Head Office and career
The resources and energy fields are in a state of flux. Ensuring national security in
terms of resources, energy and food as well as combating global warming are some
of the issues catalyzing this tumultuous change. My job is to come up with policies
and strategies for these fields as an assistant to the president. Through collabora-
tion among related MC business units and stronger connections with industry,
regions and government agencies, we should be able to grow business and raise our
competitiveness. On April 1, 2008, MC reorganized certain internal bodies to form
the Natural Resources and Energy Strategy Promotion Committee, which I chair. MC
has many strengths in the resources and energy fields and I want to bring them to
bear in developing our business in this regard.
Senior Executive Vice President, Resources & Energy Strategies
Senior Executive Vice President
Hisanori Yoshimura
27Mitsubishi Corporation Annual Report 2008
development will be accelerated. The ultimate aim is to provide
working environments where our people can excel. Another key
issue is helping employees at MC Group companies to further
develop and succeed in their respective professional fields.
These employees will determine how effective MC can be in
raising its consolidated corporate value. As such, we plan to
extend further assistance to improve personnel systems at MC
Group companies. We will also enhance personnel exchange and
training programs designed for these companies.
Dynamically reallocating human resources
As a companywide initiative, MC aims to optimally allocate
human resources in accordance with its business strategy of
concentrating business resources on selected fields more than
ever. The most appropriate individuals will be assigned to
growth regions and fields. MC will also make even greater
efforts to transfer and reassign employees based on personal-
ized career path development, as well as foster internal person-
nel exchanges across business group and business unit lines.
Creating an energetic organization and corporate culture
Through a variety of measures, we will work to create the most
energetic organization and corporate culture possible. Plans call
for strengthening management’s capacity in organizational
administration, further improving and running companywide
training programs, implementing initiatives to support employees
in attaining a good “work-life balance,” and running programs to
enlighten people on diversity. Ensuring that we make good use of
long-serving employees is part and parcel of our overall plan too.
3. Continuously Strengthening Management
Systems—Reinforcing Internal Systems
Our business model now revolves much more around invest-
ment than trading. As we evolve into a global business enter-
prise, management of the MC Group as a whole is taking on
more importance.
MC therefore aims to develop a strong sense of unity
throughout its consolidated companies, and shore up manage-
ment systems of each company, as it aims to build a corporate
group that is linked by bonds of “trust and responsibility.” The
goal is to raise overall corporate value on a consolidated basis
and achieve sustainable growth, ultimately contributing to the
continuous development of society.
Increasing management efficiency and effectiveness
MC will enhance the sophistication of its offices around the
world, develop personnel systems and promote personnel
exchange on a consolidated basis, and enhance group financing
and other activities. MC Group companies will work in collabora-
tion with MC to promote the establishment of internal control
and other systems that meet or exceed a given standard. In this
manner, MC will strengthen its management system on a consoli-
dated basis.
Actions Concerning Mitsubishi Motors CorporationWe injected equity totaling ¥140.0 billion into Mitsubishi Motors Corporation (MMC) between June 2004 and January 2006, follow-ing requests by MMC. For fiscal 2008, ended March 31, 2008, the final year of the Mitsubishi Motors Revitalization Plan announced in January 2005, MMC posted consolidated sales of ¥2,682.1 billion, operating profit of ¥108.6 billion and net income of ¥34.7 billion. In February 2008, MMC announced a new mid-term management plan for building the foundations of growth. In addition to having direct dealings with MMC, we conduct busi-nesses with this automaker, mainly overseas, such as automobile-related distribution and sales businesses in Asia and finance businesses for automobile-related sales in Europe. As a business partner, Mitsubishi Corporation is determined to continuously support MMC’s efforts to achieve a successful outcome to its new plan. Our total MMC-related risk exposure was roughly ¥420.0 billion as of March 31, 2008.
Actions Concerning the Sakhalin II ProjectMC, together with OAO Gazprom (Gazprom), Royal Dutch/Shell Group and Mitsui & Co., Ltd., is participating in the Sakhalin II Project, an LNG and crude oil development project on Sakhalin, Russian Federation, through investment in a joint venture, Sakhalin Energy Investment Co., Ltd. MC and the two other original share-holders sold some of their shares in Sakhalin Energy Investment to Gazprom in April 2007. As a result, MC’s shareholding in Sakhalin Energy Investment is now 10%. This project began first-stage devel-opment activities with the commencement of half-year (summer) oil production in July 1999, and a final investment decision for stage-two development activities (year-round production of crude oil and LNG production) was made in May 2003. As of March 31, 2008, stage-two development activities were more than 90% complete. MC is determined to continue working with the other shareholders to see this project through to successful completion. MC’s total investment in Sakhalin Energy Investment as of March 31, 2008 was approximately ¥200.0 billion.
28 Mitsubishi Corporation Annual Report 2008
INNOVATION 2007 and its various initiatives elevated MC to a new stage of excellence. Under INNOVATION 2009, we want to sustain our growth to further elevate corporate and shareholder value. We want to do this as a global business enterprise, one that generates value through the interplay of varied businesses—and as a company that develops businesses with a strong awareness of fulfilling its responsibilities to society and the environment.
Developing systems for internal control and IT,
and reforming administrative processes
MC will ensure that its operations are in compliance with the
Financial Instruments and Exchange Law, which came into effect
in 2008 and ushered in stricter internal controls on financial
reporting. As part of this compliance process, we will standardize
MC Group administrative procedures. This will ensure the cor-
rectness of administration on a consolidated basis and respond
to the greater demands being placed on corporate activities.
MC revamped its existing systems infrastructure under
INNOVATION 2007. However, in order to reinforce consolidated
management, the scope of infrastructure reviews will be
extended to cover consolidated operations. Meanwhile,
systems will be integrated through the standardization and
across-the-board implementation of administrative procedures.
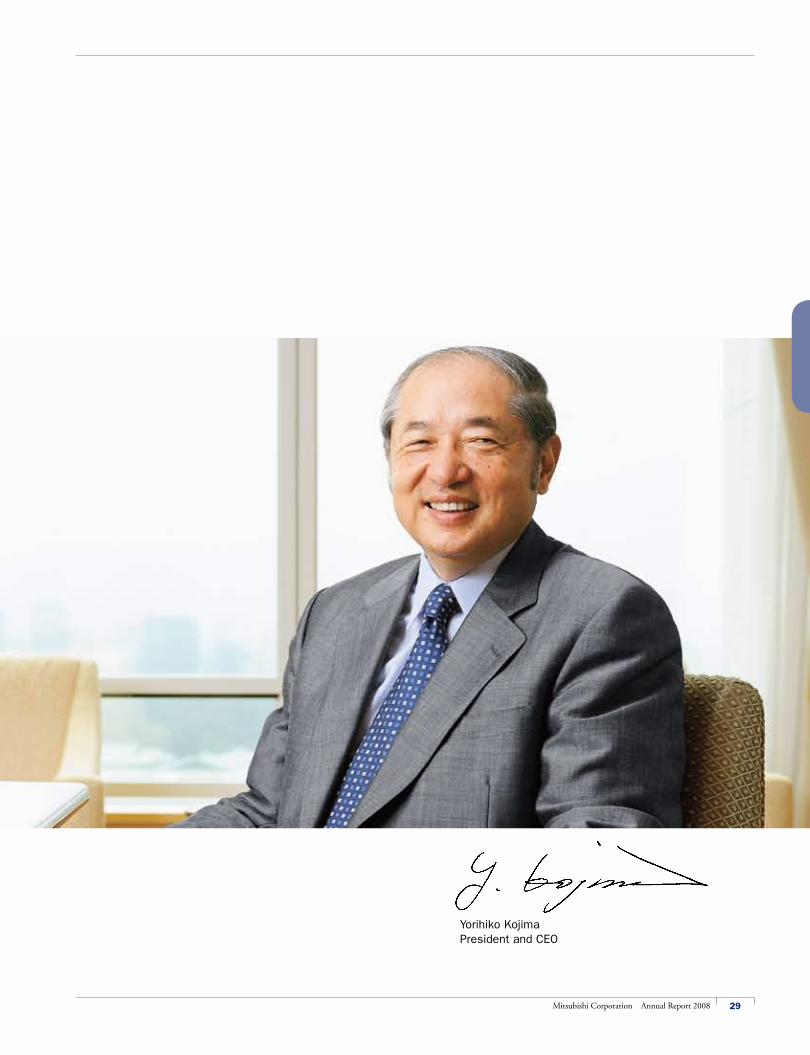
29Mitsubishi Corporation Annual Report 2008
Yorihiko KojimaPresident and CEO
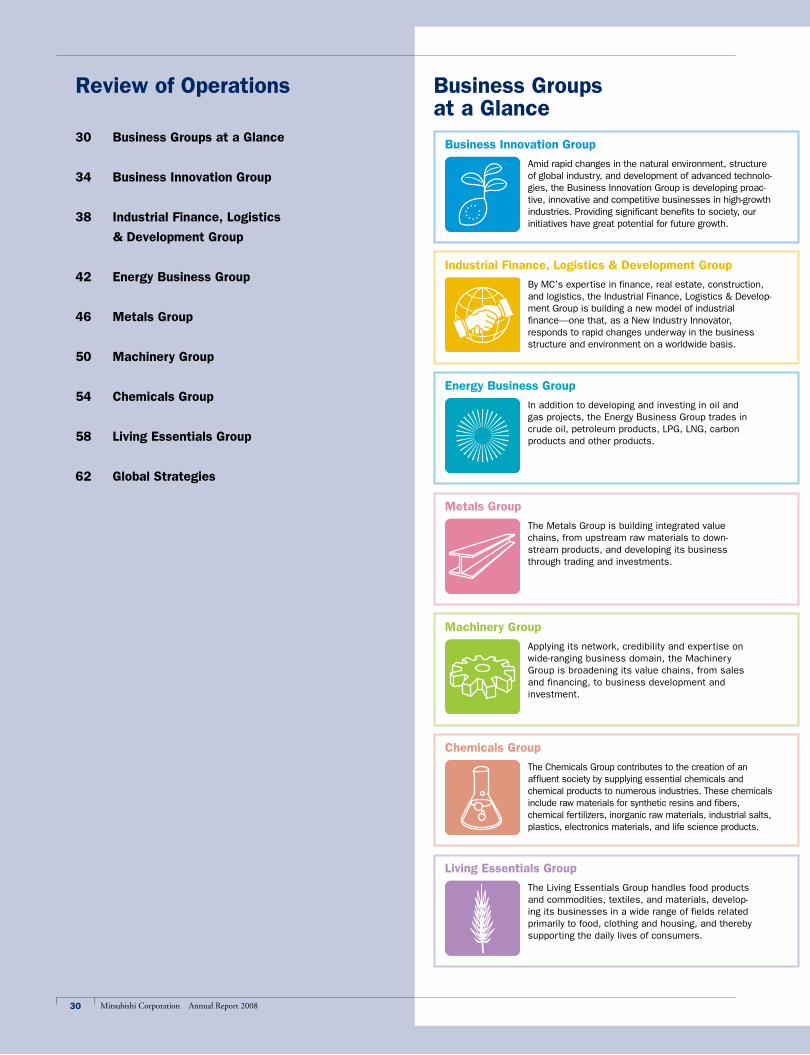
30 Mitsubishi Corporation Annual Report 2008
Review of Operations Business Groups at a Glance
Energy Business Group
Business Innovation Group
Industrial Finance, Logistics & Development Group
Metals Group
Machinery Group
Chemicals Group
Living Essentials Group
Amid rapid changes in the natural environment, structure of global industry, and development of advanced technolo-gies, the Business Innovation Group is developing proac-tive, innovative and competitive businesses in high-growth industries. Providing significant benefits to society, our initiatives have great potential for future growth.
By MC’s expertise in finance, real estate, construction, and logistics, the Industrial Finance, Logistics & Develop-ment Group is building a new model of industrial finance—one that, as a New Industry Innovator, responds to rapid changes underway in the business structure and environment on a worldwide basis.
In addition to developing and investing in oil and gas projects, the Energy Business Group trades in crude oil, petroleum products, LPG, LNG, carbon products and other products.
The Metals Group is building integrated value chains, from upstream raw materials to down-stream products, and developing its business through trading and investments.
Applying its network, credibility and expertise on wide-ranging business domain, the Machinery Group is broadening its value chains, from sales and financing, to business development and investment.
The Chemicals Group contributes to the creation of an affluent society by supplying essential chemicals and chemical products to numerous industries. These chemicals include raw materials for synthetic resins and fibers, chemical fertilizers, inorganic raw materials, industrial salts, plastics, electronics materials, and life science products.
The Living Essentials Group handles food products and commodities, textiles, and materials, develop-ing its businesses in a wide range of fields related primarily to food, clothing and housing, and thereby supporting the daily lives of consumers.
30 Business Groups at a Glance
34 Business Innovation Group
38 Industrial Finance, Logistics
& Development Group
42 Energy Business Group
46 Metals Group
50 Machinery Group
54 Chemicals Group
58 Living Essentials Group
62 Global Strategies
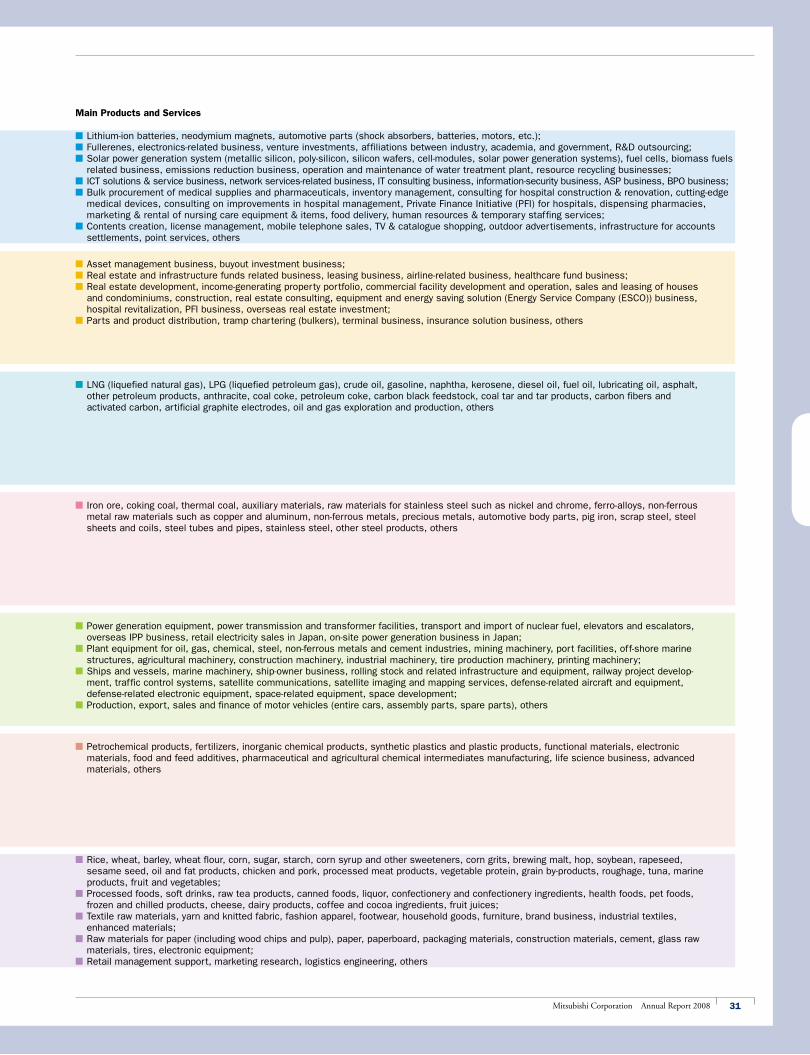
31Mitsubishi Corporation Annual Report 2008
n Power generation equipment, power transmission and transformer facilities, transport and import of nuclear fuel, elevators and escalators, overseas IPP business, retail electricity sales in Japan, on-site power generation business in Japan;
n Plant equipment for oil, gas, chemical, steel, non-ferrous metals and cement industries, mining machinery, port facilities, off-shore marine structures, agricultural machinery, construction machinery, industrial machinery, tire production machinery, printing machinery;
n Ships and vessels, marine machinery, ship-owner business, rolling stock and related infrastructure and equipment, railway project develop-ment, traffic control systems, satellite communications, satellite imaging and mapping services, defense-related aircraft and equipment, defense-related electronic equipment, space-related equipment, space development;
n Production, export, sales and finance of motor vehicles (entire cars, assembly parts, spare parts), others
n Lithium-ion batteries, neodymium magnets, automotive parts (shock absorbers, batteries, motors, etc.);n Fullerenes, electronics-related business, venture investments, affiliations between industry, academia, and government, R&D outsourcing;n Solar power generation system (metallic silicon, poly-silicon, silicon wafers, cell-modules, solar power generation systems), fuel cells, biomass fuels
related business, emissions reduction business, operation and maintenance of water treatment plant, resource recycling businesses;n ICT solutions & service business, network services-related business, IT consulting business, information-security business, ASP business, BPO business;n Bulk procurement of medical supplies and pharmaceuticals, inventory management, consulting for hospital construction & renovation, cutting-edge
medical devices, consulting on improvements in hospital management, Private Finance Initiative (PFI) for hospitals, dispensing pharmacies, marketing & rental of nursing care equipment & items, food delivery, human resources & temporary staffing services;
n Contents creation, license management, mobile telephone sales, TV & catalogue shopping, outdoor advertisements, infrastructure for accounts settlements, point services, others
n Asset management business, buyout investment business;n Real estate and infrastructure funds related business, leasing business, airline-related business, healthcare fund business;n Real estate development, income-generating property portfolio, commercial facility development and operation, sales and leasing of houses
and condominiums, construction, real estate consulting, equipment and energy saving solution (Energy Service Company (ESCO)) business, hospital revitalization, PFI business, overseas real estate investment;
n Parts and product distribution, tramp chartering (bulkers), terminal business, insurance solution business, others
n LNG (liquefied natural gas), LPG (liquefied petroleum gas), crude oil, gasoline, naphtha, kerosene, diesel oil, fuel oil, lubricating oil, asphalt, other petroleum products, anthracite, coal coke, petroleum coke, carbon black feedstock, coal tar and tar products, carbon fibers and activated carbon, artificial graphite electrodes, oil and gas exploration and production, others
n Iron ore, coking coal, thermal coal, auxiliary materials, raw materials for stainless steel such as nickel and chrome, ferro-alloys, non-ferrous metal raw materials such as copper and aluminum, non-ferrous metals, precious metals, automotive body parts, pig iron, scrap steel, steel sheets and coils, steel tubes and pipes, stainless steel, other steel products, others
n Petrochemical products, fertilizers, inorganic chemical products, synthetic plastics and plastic products, functional materials, electronic materials, food and feed additives, pharmaceutical and agricultural chemical intermediates manufacturing, life science business, advanced materials, others
n Rice, wheat, barley, wheat flour, corn, sugar, starch, corn syrup and other sweeteners, corn grits, brewing malt, hop, soybean, rapeseed, sesame seed, oil and fat products, chicken and pork, processed meat products, vegetable protein, grain by-products, roughage, tuna, marine products, fruit and vegetables;
n Processed foods, soft drinks, raw tea products, canned foods, liquor, confectionery and confectionery ingredients, health foods, pet foods, frozen and chilled products, cheese, dairy products, coffee and cocoa ingredients, fruit juices;
n Textile raw materials, yarn and knitted fabric, fashion apparel, footwear, household goods, furniture, brand business, industrial textiles, enhanced materials;
n Raw materials for paper (including wood chips and pulp), paper, paperboard, packaging materials, construction materials, cement, glass raw materials, tires, electronic equipment;
n Retail management support, marketing research, logistics engineering, others
Main Products and Services
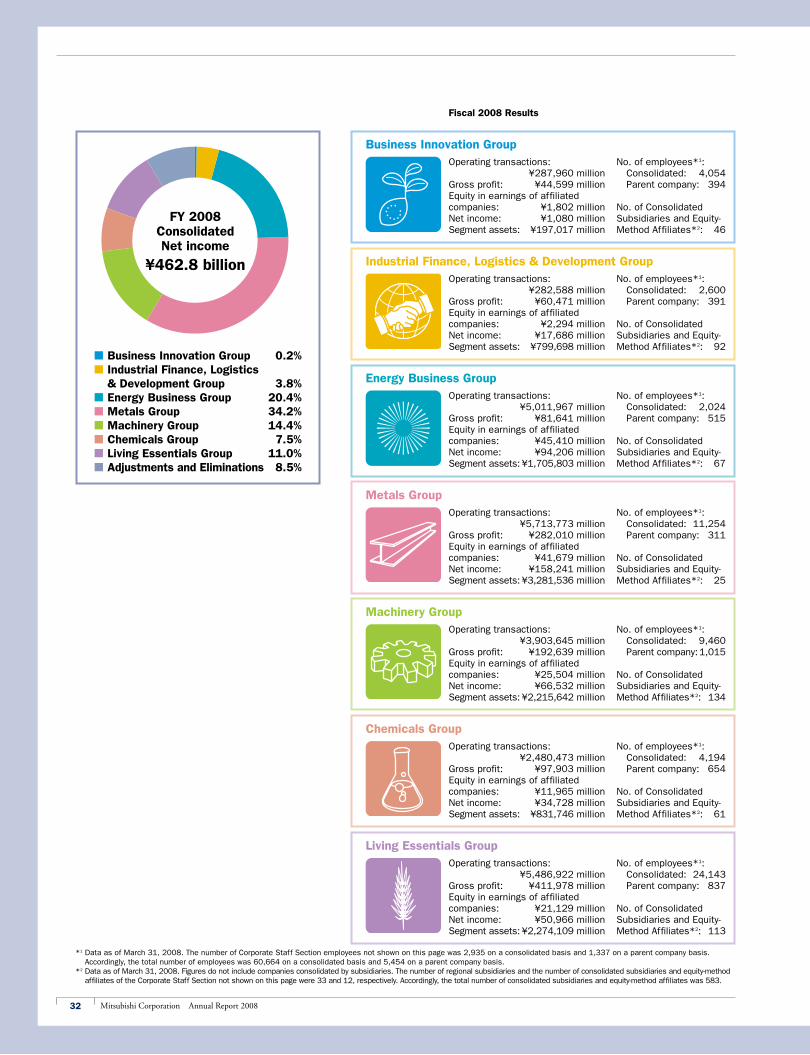
32 Mitsubishi Corporation Annual Report 2008
Fiscal 2008 Results
Energy Business GroupOperating transactions: ¥5,011,967 millionGross profit: ¥81,641 millionEquity in earnings of affiliated companies: ¥45,410 millionNet income: ¥94,206 millionSegment assets: ¥1,705,803 million
Metals Group Operating transactions: ¥5,713,773 millionGross profit: ¥282,010 millionEquity in earnings of affiliated companies: ¥41,679 millionNet income: ¥158,241 millionSegment assets: ¥3,281,536 million
Business Innovation GroupOperating transactions: ¥287,960 millionGross profit: ¥44,599 millionEquity in earnings of affiliated companies: ¥1,802 millionNet income: ¥1,080 millionSegment assets: ¥197,017 million
Industrial Finance, Logistics & Development GroupOperating transactions: ¥282,588 millionGross profit: ¥60,471 millionEquity in earnings of affiliated companies: ¥2,294 millionNet income: ¥17,686 millionSegment assets: ¥799,698 million
Machinery Group Operating transactions: ¥3,903,645 millionGross profit: ¥192,639 millionEquity in earnings of affiliated companies: ¥25,504 millionNet income: ¥66,532 millionSegment assets: ¥2,215,642 million
Chemicals Group Operating transactions: ¥2,480,473 millionGross profit: ¥97,903 millionEquity in earnings of affiliated companies: ¥11,965 millionNet income: ¥34,728 millionSegment assets: ¥831,746 million
Living Essentials GroupOperating transactions: ¥5,486,922 millionGross profit: ¥411,978 millionEquity in earnings of affiliated companies: ¥21,129 millionNet income: ¥50,966 millionSegment assets: ¥2,274,109 million
*1 Data as of March 31, 2008. The number of Corporate Staff Section employees not shown on this page was 2,935 on a consolidated basis and 1,337 on a parent company basis. Accordingly, the total number of employees was 60,664 on a consolidated basis and 5,454 on a parent company basis.
*2 Data as of March 31, 2008. Figures do not include companies consolidated by subsidiaries. The number of regional subsidiaries and the number of consolidated subsidiaries and equity-method affiliates of the Corporate Staff Section not shown on this page were 33 and 12, respectively. Accordingly, the total number of consolidated subsidiaries and equity-method affiliates was 583.
No. of employees*1: Consolidated: 2,024 Parent company: 515
No. of Consolidated Subsidiaries and Equity- Method Affiliates*2: 67
No. of employees*1: Consolidated: 11,254 Parent company: 311
No. of Consolidated Subsidiaries and Equity- Method Affiliates*2: 25
No. of employees*1: Consolidated: 4,054 Parent company: 394
No. of Consolidated Subsidiaries and Equity- Method Affiliates*2: 46
No. of employees*1: Consolidated: 2,600 Parent company: 391
No. of Consolidated Subsidiaries and Equity- Method Affiliates*2: 92
No. of employees*1: Consolidated: 9,460 Parent company: 1,015
No. of Consolidated Subsidiaries and Equity- Method Affiliates*2: 134
No. of employees*1: Consolidated: 4,194 Parent company: 654
No. of Consolidated Subsidiaries and Equity- Method Affiliates*2: 61
No. of employees*1: Consolidated: 24,143 Parent company: 837
No. of Consolidated Subsidiaries and Equity- Method Affiliates*2: 113
n Business Innovation Group 0.2%n Industrial Finance, Logistics
& Development Group 3.8%n Energy Business Group 20.4%n Metals Group 34.2%n Machinery Group 14.4%n Chemicals Group 7.5%n Living Essentials Group 11.0%n Adjustments and Eliminations 8.5%
FY 2008Consolidated Net income
¥462.8 billion
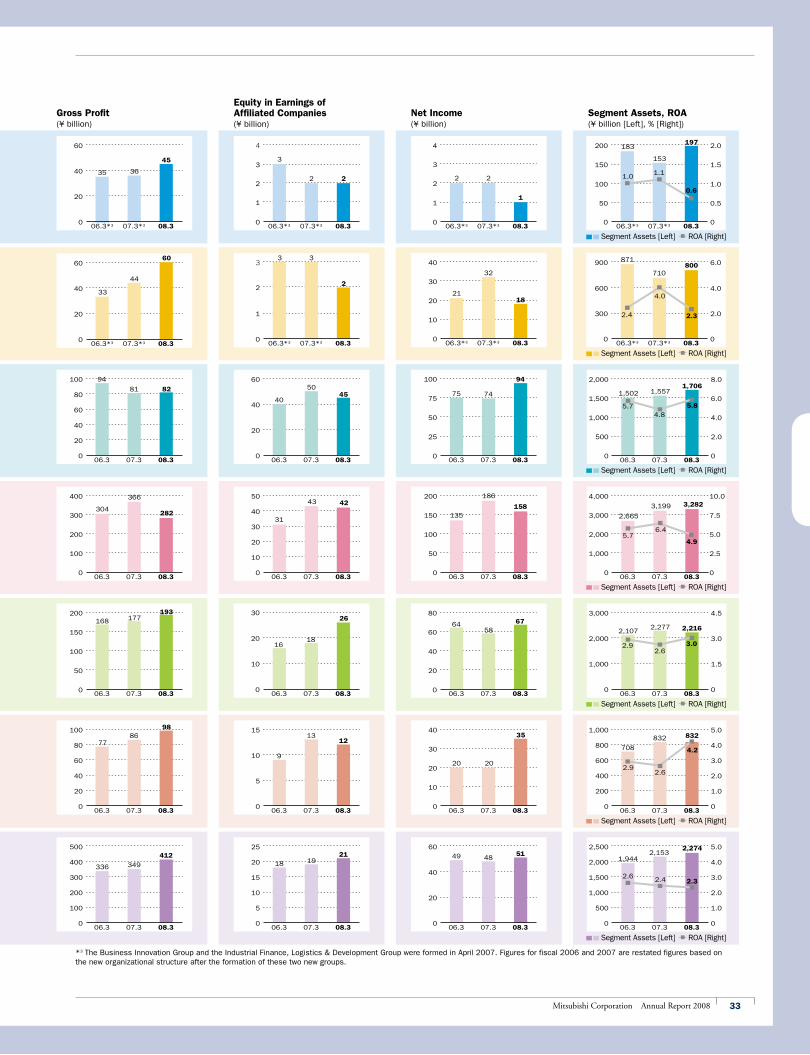
33Mitsubishi Corporation Annual Report 2008
2,000 8.0
6.0
4.0
2.0500
1,500
1,000
0 0
5.74.8
1,502
06.3 07.3 08.3
1,5571,706
5.8
4,000 10.0
7.5
5.0
2.5
2,000
1,000
3,000
0 0
2,665
5.76.4
4.9
3,199 3,282
06.3 07.3 08.3
3,000 4.5
3.0
1.51,000
2,000
0 0
2.92.6
3.0
2,1072,277 2,216
06.3 07.3 08.3
1,000 5.0
4.0
3.0
2.0
1.0200
600
400
800
0 0
4.2
832
708
832
06.3 07.3 08.3
2.92.6
2,500 5.0
4.0
3.0
2.0
1.0500
1,500
1,000
2,000
0 0
2.6 2.4 2.3
1,9442,153
2,274
06.3 07.3 08.3
900 6.0
4.0
2.0300
600
0 0
4.0
2.4 2.3
710800
07.3*3
871
06.3*3 08.3
200 2.0
1.0
1.5
0.550
100
150
0 0
1.11.0
0.6
153
197
07.3*3
183
06.3*3 08.3
60
40
20
0
3635
45
07.3*306.3*3 08.3
100
60
40
80
20
0
94
81
06.3 07.3 08.3
82
60
40
20
0
40
50
06.3 07.3 08.3
45 75 74
94
06.3 07.3 08.30
25
50
75
100
400
200
100
300
0
304
366
282
06.3 07.3 08.3
50
40
20
10
30
0
31
43 42
06.3 07.3 08.3
200
150
50
100
0
135
186
158
06.3 07.3 08.3
168 177193
06.3 07.3 08.30
50
100
150
200
1816
26
06.3 07.3 08.30
10
20
30
6458
67
06.3 07.3 08.30
20
40
60
80
100
40
20
60
80
0
98
7786
06.3 07.3 08.3
15
10
5
0
12
9
13
06.3 07.3 08.3
40
20
30
10
0
20 20
35
06.3 07.3 08.3
500
400
100
200
300
0
336 349
412
06.3 07.3 08.3
25
20
5
10
15
0
18 1921
06.3 07.3 08.3
60
20
40
0
49 4851
06.3 07.3 08.3
Gross Profit(¥ billion)
Equity in Earnings of Affiliated Companies(¥ billion)
Net Income(¥ billion)
Segment Assets [Left] ROA [Right]
*3 The Business Innovation Group and the Industrial Finance, Logistics & Development Group were formed in April 2007. Figures for fiscal 2006 and 2007 are restated figures based on the new organizational structure after the formation of these two new groups.
60
40
20
0
44
60
07.3*3
33
06.3*3 08.3
3
2
1
0
3
2
07.3*3
3
06.3*3 08.3
40
20
30
10
0
32
18
07.3*3
21
06.3*3 08.3
4
1
2
3
0
2 2
07.3*3
3
06.3*3 08.3
4
1
2
3
0
2
1
07.3*3
2
06.3*3 08.3
Segment Assets, ROA(¥ billion [Left], % [Right])
Segment Assets [Left] ROA [Right]
Segment Assets [Left] ROA [Right]
Segment Assets [Left] ROA [Right]
Segment Assets [Left] ROA [Right]
Segment Assets [Left] ROA [Right]
Segment Assets [Left] ROA [Right]
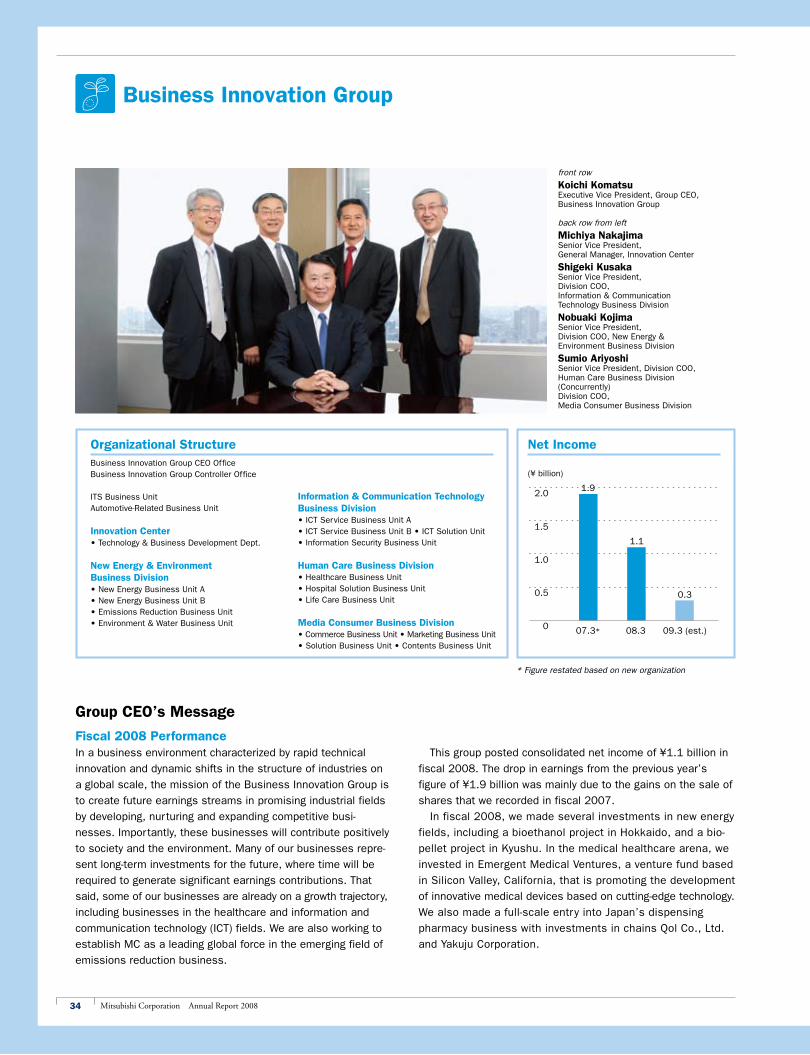
34 Mitsubishi Corporation Annual Report 2008
1.5
2.0
1.0
0.5
0 07.3* 08.3 09.3 (est.)
1.9
1.1
0.3
Business Innovation Group
front row
Koichi KomatsuExecutive Vice President, Group CEO, Business Innovation Group
back row from left
Michiya NakajimaSenior Vice President, General Manager, Innovation Center
Shigeki KusakaSenior Vice President, Division COO, Information & Communication Technology Business Division
Nobuaki KojimaSenior Vice President, Division COO, New Energy & Environment Business Division
Sumio AriyoshiSenior Vice President, Division COO, Human Care Business Division (Concurrently) Division COO, Media Consumer Business Division
Group CEO’s Message
Fiscal 2008 PerformanceIn a business environment characterized by rapid technical
innovation and dynamic shifts in the structure of industries on
a global scale, the mission of the Business Innovation Group is
to create future earnings streams in promising industrial fields
by developing, nurturing and expanding competitive busi-
nesses. Importantly, these businesses will contribute positively
to society and the environment. Many of our businesses repre-
sent long-term investments for the future, where time will be
required to generate significant earnings contributions. That
said, some of our businesses are already on a growth trajectory,
including businesses in the healthcare and information and
communication technology (ICT) fields. We are also working to
establish MC as a leading global force in the emerging field of
emissions reduction business.
This group posted consolidated net income of ¥1.1 billion in
fiscal 2008. The drop in earnings from the previous year’s
figure of ¥1.9 billion was mainly due to the gains on the sale of
shares that we recorded in fiscal 2007.
In fiscal 2008, we made several investments in new energy
fields, including a bioethanol project in Hokkaido, and a bio-
pellet project in Kyushu. In the medical healthcare arena, we
invested in Emergent Medical Ventures, a venture fund based
in Silicon Valley, California, that is promoting the development
of innovative medical devices based on cutting-edge technology.
We also made a full-scale entry into Japan’s dispensing
pharmacy business with investments in chains Qol Co., Ltd.
and Yakuju Corporation.
Net Income
(¥ billion)
* Figure restated based on new organization
Organizational StructureBusiness Innovation Group CEO OfficeBusiness Innovation Group Controller Office
ITS Business UnitAutomotive-Related Business Unit
Innovation Center• Technology & Business Development Dept.
New Energy & Environment Business Division• New Energy Business Unit A• New Energy Business Unit B• Emissions Reduction Business Unit• Environment & Water Business Unit
Information & Communication Technology Business Division• ICT Service Business Unit A• ICT Service Business Unit B • ICT Solution Unit• Information Security Business Unit
Human Care Business Division• Healthcare Business Unit • Hospital Solution Business Unit • Life Care Business Unit
Media Consumer Business Division • Commerce Business Unit • Marketing Business Unit • Solution Business Unit • Contents Business Unit
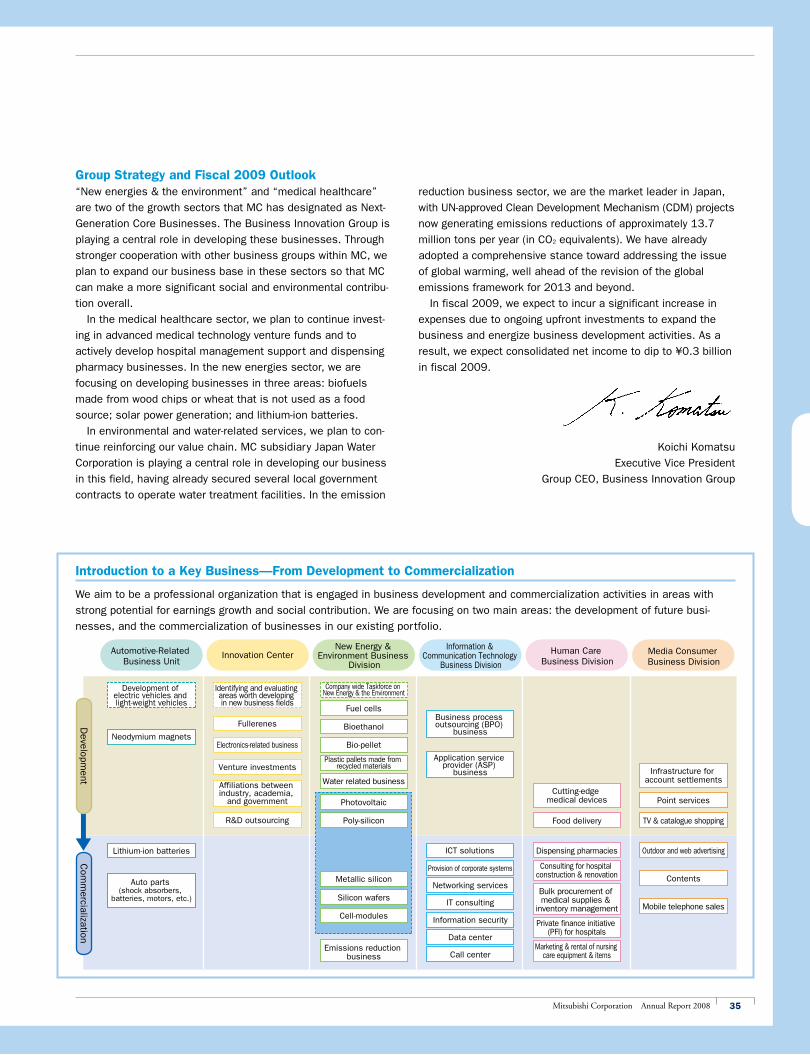
35Mitsubishi Corporation Annual Report 2008
We aim to be a professional organization that is engaged in business development and commercialization activities in areas with
strong potential for earnings growth and social contribution. We are focusing on two main areas: the development of future busi-
nesses, and the commercialization of businesses in our existing portfolio.
Introduction to a Key Business—From Development to Commercialization
Group Strategy and Fiscal 2009 Outlook“New energies & the environment” and “medical healthcare”
are two of the growth sectors that MC has designated as Next-
Generation Core Businesses. The Business Innovation Group is
playing a central role in developing these businesses. Through
stronger cooperation with other business groups within MC, we
plan to expand our business base in these sectors so that MC
can make a more significant social and environmental contribu-
tion overall.
In the medical healthcare sector, we plan to continue invest-
ing in advanced medical technology venture funds and to
actively develop hospital management support and dispensing
pharmacy businesses. In the new energies sector, we are
focusing on developing businesses in three areas: biofuels
made from wood chips or wheat that is not used as a food
source; solar power generation; and lithium-ion batteries.
In environmental and water-related services, we plan to con-
tinue reinforcing our value chain. MC subsidiary Japan Water
Corporation is playing a central role in developing our business
in this field, having already secured several local government
contracts to operate water treatment facilities. In the emission
reduction business sector, we are the market leader in Japan,
with UN-approved Clean Development Mechanism (CDM) projects
now generating emissions reductions of approximately 13.7
million tons per year (in CO2 equivalents). We have already
adopted a comprehensive stance toward addressing the issue
of global warming, well ahead of the revision of the global
emissions framework for 2013 and beyond.
In fiscal 2009, we expect to incur a significant increase in
expenses due to ongoing upfront investments to expand the
business and energize business development activities. As a
result, we expect consolidated net income to dip to ¥0.3 billion
in fiscal 2009.
Koichi Komatsu
Executive Vice President
Group CEO, Business Innovation Group
Metallic silicon
Silicon wafers
Cell-modules
Emissions reduction business
Auto parts (shock absorbers,
batteries, motors, etc.)
ICT solutions
Business process outsourcing (BPO)
business
Application service provider (ASP)
business
Provision of corporate systems
Networking services
IT consulting
Dispensing pharmacies
Consulting for hospital construction & renovation
Private finance initiative (PFI) for hospitals
Bulk procurement of medical supplies &
inventory management
Marketing & rental of nursing care equipment & items
Outdoor and web advertising
Contents
Mobile telephone sales
Com
mercialization
Innovation CenterAutomotive-Related Business Unit
New Energy & Environment Business
Division
Information & Communication Technology
Business Division
Human Care Business Division
Media Consumer Business Division
Company wide Taskforce on New Energy & the Environment
Fuel cells
Bioethanol
Bio-pellet
Plastic pallets made from recycled materials
Water related business
Photovoltaic
Poly-silicon
Development of electric vehicles and light-weight vehicles
Neodymium magnets
Lithium-ion batteries
Identifying and evaluating areas worth developing in new business fields
R&D outsourcing
Fullerenes
Electronics-related business
Venture investments
Affiliations between industry, academia,
and governmentCutting-edge
medical devices
Food delivery
Infrastructure for account settlements
Point services
TV & catalogue shopping
Developm
ent
Information security
Data center
Call center
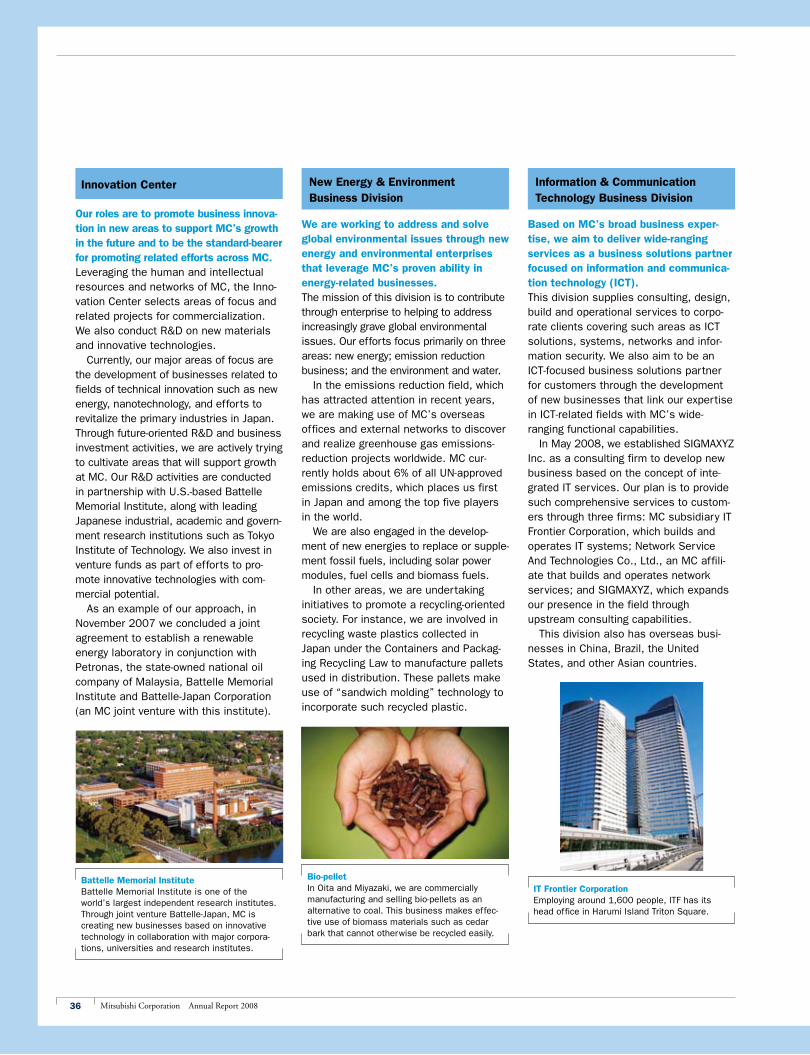
36 Mitsubishi Corporation Annual Report 2008
IT Frontier CorporationEmploying around 1,600 people, ITF has its head office in Harumi Island Triton Square.
Battelle Memorial InstituteBattelle Memorial Institute is one of the world’s largest independent research institutes. Through joint venture Battelle-Japan, MC is creating new businesses based on innovative technology in collaboration with major corpora-tions, universities and research institutes.
Bio-pelletIn Oita and Miyazaki, we are commercially manufacturing and selling bio-pellets as an alternative to coal. This business makes effec-tive use of biomass materials such as cedar bark that cannot otherwise be recycled easily.
Innovation Center
Our roles are to promote business innova-tion in new areas to support MC’s growth in the future and to be the standard-bearer for promoting related efforts across MC.Leveraging the human and intellectual resources and networks of MC, the Inno-vation Center selects areas of focus and related projects for commercialization. We also conduct R&D on new materials and innovative technologies. Currently, our major areas of focus are the development of businesses related to fields of technical innovation such as new energy, nanotechnology, and efforts to revitalize the primary industries in Japan. Through future-oriented R&D and business investment activities, we are actively trying to cultivate areas that will support growth at MC. Our R&D activities are conducted in partnership with U.S.-based Battelle Memorial Institute, along with leading Japanese industrial, academic and govern-ment research institutions such as Tokyo Institute of Technology. We also invest in venture funds as part of efforts to pro-mote innovative technologies with com-mercial potential. As an example of our approach, in November 2007 we concluded a joint agreement to establish a renewable energy laboratory in conjunction with Petronas, the state-owned national oil company of Malaysia, Battelle Memorial Institute and Battelle-Japan Corporation (an MC joint venture with this institute).
New Energy & Environment Business Division
We are working to address and solve global environmental issues through new energy and environmental enterprises that leverage MC’s proven ability in energy-related businesses.The mission of this division is to contribute through enterprise to helping to address increasingly grave global environmental issues. Our efforts focus primarily on three areas: new energy; emission reduction business; and the environment and water. In the emissions reduction field, which has attracted attention in recent years, we are making use of MC’s overseas offices and external networks to discover and realize greenhouse gas emissions- reduction projects worldwide. MC cur-rently holds about 6% of all UN-approved emissions credits, which places us first in Japan and among the top five players in the world. We are also engaged in the develop-ment of new energies to replace or supple-ment fossil fuels, including solar power modules, fuel cells and biomass fuels. In other areas, we are undertaking initiatives to promote a recycling-oriented society. For instance, we are involved in recycling waste plastics collected in Japan under the Containers and Packag-ing Recycling Law to manufacture pallets used in distribution. These pallets make use of “sandwich molding” technology to incorporate such recycled plastic.
Information & Communication Technology Business Division
Based on MC’s broad business exper-tise, we aim to deliver wide-ranging services as a business solutions partner focused on information and communica-tion technology (ICT).This division supplies consulting, design, build and operational services to corpo-rate clients covering such areas as ICT solutions, systems, networks and infor-mation security. We also aim to be an ICT-focused business solutions partner for customers through the development of new businesses that link our expertise in ICT-related fields with MC’s wide- ranging functional capabilities. In May 2008, we established SIGMAXYZ Inc. as a consulting firm to develop new business based on the concept of inte-grated IT services. Our plan is to provide such comprehensive services to custom-ers through three firms: MC subsidiary IT Frontier Corporation, which builds and operates IT systems; Network Service And Technologies Co., Ltd., an MC affili-ate that builds and operates network services; and SIGMAXYZ, which expands our presence in the field through upstream consulting capabilities. This division also has overseas busi-nesses in China, Brazil, the United States, and other Asian countries.
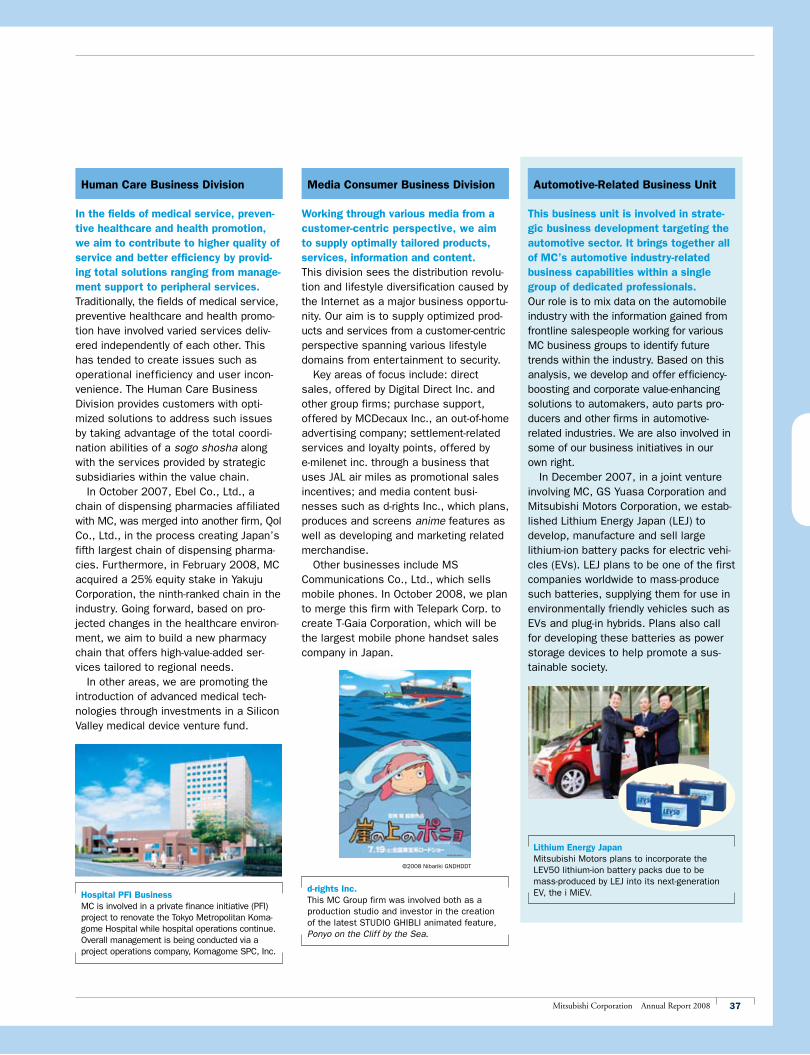
37Mitsubishi Corporation Annual Report 2008
Hospital PFI BusinessMC is involved in a private finance initiative (PFI) project to renovate the Tokyo Metropolitan Koma-gome Hospital while hospital operations continue. Overall management is being conducted via a project operations company, Komagome SPC, Inc.
Lithium Energy JapanMitsubishi Motors plans to incorporate the LEV50 lithium-ion battery packs due to be mass-produced by LEJ into its next-generation EV, the i MiEV.d-rights Inc.
This MC Group firm was involved both as a production studio and investor in the creation of the latest STUDIO GHIBLI animated feature, Ponyo on the Cliff by the Sea.
©2008 Nibariki GNDHDDT
Human Care Business Division
In the fields of medical service, preven-tive healthcare and health promotion, we aim to contribute to higher quality of service and better efficiency by provid-ing total solutions ranging from manage-ment support to peripheral services.Traditionally, the fields of medical service, preventive healthcare and health promo-tion have involved varied services deliv-ered independently of each other. This has tended to create issues such as operational inefficiency and user incon-venience. The Human Care Business Division provides customers with opti-mized solutions to address such issues by taking advantage of the total coordi-nation abilities of a sogo shosha along with the services provided by strategic subsidiaries within the value chain. In October 2007, Ebel Co., Ltd., a chain of dispensing pharmacies affiliated with MC, was merged into another firm, Qol Co., Ltd., in the process creating Japan’s fifth largest chain of dispensing pharma-cies. Furthermore, in February 2008, MC acquired a 25% equity stake in Yakuju Corporation, the ninth-ranked chain in the industry. Going forward, based on pro-jected changes in the healthcare environ-ment, we aim to build a new pharmacy chain that offers high-value-added ser-vices tailored to regional needs. In other areas, we are promoting the introduction of advanced medical tech-nologies through investments in a Silicon Valley medical device venture fund.
Media Consumer Business Division
Working through various media from a customer-centric perspective, we aim to supply optimally tailored products, services, information and content.This division sees the distribution revolu-tion and lifestyle diversification caused by the Internet as a major business opportu-nity. Our aim is to supply optimized prod-ucts and services from a customer-centric perspective spanning various lifestyle domains from entertainment to security. Key areas of focus include: direct sales, offered by Digital Direct Inc. and other group firms; purchase support, offered by MCDecaux Inc., an out-of-home advertising company; settlement-related services and loyalty points, offered by e-milenet inc. through a business that uses JAL air miles as promotional sales incentives; and media content busi-nesses such as d-rights Inc., which plans, produces and screens anime features as well as developing and marketing related merchandise. Other businesses include MS Communications Co., Ltd., which sells mobile phones. In October 2008, we plan to merge this firm with Telepark Corp. to create T-Gaia Corporation, which will be the largest mobile phone handset sales company in Japan.
Automotive-Related Business Unit
This business unit is involved in strate-gic business development targeting the automotive sector. It brings together all of MC’s automotive industry-related business capabilities within a single group of dedicated professionals.Our role is to mix data on the automobile industry with the information gained from frontline salespeople working for various MC business groups to identify future trends within the industry. Based on this analysis, we develop and offer efficiency-boosting and corporate value-enhancing solutions to automakers, auto parts pro-ducers and other firms in automotive-related industries. We are also involved in some of our business initiatives in our own right. In December 2007, in a joint venture involving MC, GS Yuasa Corporation and Mitsubishi Motors Corporation, we estab-lished Lithium Energy Japan (LEJ) to develop, manufacture and sell large lithium-ion battery packs for electric vehi-cles (EVs). LEJ plans to be one of the first companies worldwide to mass-produce such batteries, supplying them for use in environmentally friendly vehicles such as EVs and plug-in hybrids. Plans also call for developing these batteries as power storage devices to help promote a sus-tainable society.

38 Mitsubishi Corporation Annual Report 2008
30
40
20
10
0 07.3* 08.3 09.3 (est.)
31.8
10.5
17.7 17.0
Industrial Finance, Logistics & Development Group
front row from left
Ken KobayashiExecutive Vice President, Group CEO, Industrial Finance, Logistics & Development Group
Hideshi TakeuchiExecutive Vice President, Group COO, Industrial Finance, Logistics & Development Group(Concurrently) Division COO, Merchant Banking, M&A Division
back row from left
Michio IzumiSenior Vice President, Division COO, Logistics Services Division
Yasuyuki SakataSenior Vice President, Division COO, Asset Finance & Business Development Division
Yasushi AriyoshiSenior Vice President, Division COO, Development & Construction Project Division
Organizational StructureIndustrial Finance, Logistics & Development Group CEO OfficeIndustrial Finance, Logistics & Development Group Controller Office
Merchant Banking, M&A Division• Merchant Banking & Investment Unit • Private Equity Investment Unit
Asset Finance & Business Development Division• Financial Services Unit • Real Estate & Project Finance Unit • Leasing & Finance Unit • Airline Business Unit
Development & Construction Project Division• Commercial Property Development & Management Unit • Urban & Residential Development Unit • Construction & Building Equipment Unit • Overseas Property & Project Development Unit
Logistics Services Division• Risk Engineering Unit • Logistics Business Unit • Tramp Chartering Business Unit • Tank Terminals Business Unit
Group CEO’s Message
Fiscal 2008 PerformanceIntegrating expertise in assets and businesses that MC has
acquired as a sogo shosha with financial expertise, the
Industrial Finance, Logistics & Development Group is develop-
ing shosha-type industrial finance businesses in areas such as
asset finance.
Consolidated net income for fiscal 2008, this group’s first
year, was ¥17.7 billion, ahead of the initial target of ¥17.0
billion. This marked a year-on-year increase of ¥7.2 billion com-
pared with the pro forma figure of ¥10.5 billion for fiscal 2007,
which excluded the gain on the sale of shares in Diamond City
Co., Ltd. (on paper, net income fell by ¥14.1 billion due to the
latter effect). The growth in earnings was mainly due to gains
on sales of developed real estate, increased earnings related
to real estate investment trusts (REITs), and a solid perfor-
mance in the logistics business.
We also built up our asset base with the view to generating
future earnings through acquisition of aircraft leasing assets,
and investments in overseas infrastructure funds and Asian
property funds, income-generating properties in Japan and so
on. In addition, Mitsubishi Corp.-UBS Realty Inc. (MCUBSR), a
REIT management joint venture between MC and UBS AG.,
launched Industrial & Infrastructure Fund Investment Corporation
(IIF) in October 2007. IIF, MCUBSR’s second listed J-REIT,
focuses on logistics facilities and other industrial infrastructure,
while Japan Retail Fund Investment Corporation (JRF), MCUBSR’s
first listed J-REIT, specializes in retail facilities.
Net Income
(¥ billion)
* Figure restated based on new organization After deducting gain on sale of Diamond City shares
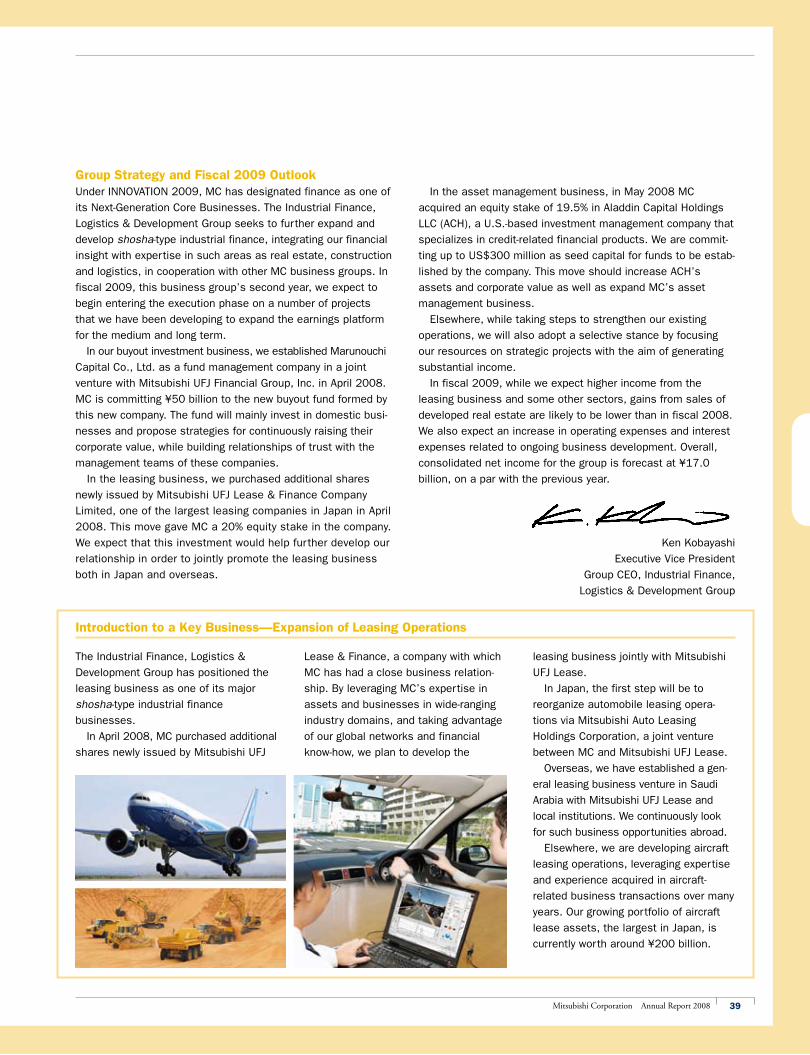
39Mitsubishi Corporation Annual Report 2008
The Industrial Finance, Logistics &
Development Group has positioned the
leasing business as one of its major
shosha-type industrial finance
businesses.
In April 2008, MC purchased additional
shares newly issued by Mitsubishi UFJ
Introduction to a Key Business —Expansion of Leasing Operations
Lease & Finance, a company with which
MC has had a close business relation-
ship. By leveraging MC’s expertise in
assets and businesses in wide-ranging
industry domains, and taking advantage
of our global networks and financial
know-how, we plan to develop the
Group Strategy and Fiscal 2009 OutlookUnder INNOVATION 2009, MC has designated finance as one of
its Next-Generation Core Businesses. The Industrial Finance,
Logistics & Development Group seeks to further expand and
develop shosha-type industrial finance, integrating our financial
insight with expertise in such areas as real estate, construction
and logistics, in cooperation with other MC business groups. In
fiscal 2009, this business group’s second year, we expect to
begin entering the execution phase on a number of projects
that we have been developing to expand the earnings platform
for the medium and long term.
In our buyout investment business, we established Marunouchi
Capital Co., Ltd. as a fund management company in a joint
venture with Mitsubishi UFJ Financial Group, Inc. in April 2008.
MC is committing ¥50 billion to the new buyout fund formed by
this new company. The fund will mainly invest in domestic busi-
nesses and propose strategies for continuously raising their
corporate value, while building relationships of trust with the
management teams of these companies.
In the leasing business, we purchased additional shares
newly issued by Mitsubishi UFJ Lease & Finance Company
Limited, one of the largest leasing companies in Japan in April
2008. This move gave MC a 20% equity stake in the company.
We expect that this investment would help further develop our
relationship in order to jointly promote the leasing business
both in Japan and overseas.
In the asset management business, in May 2008 MC
acquired an equity stake of 19.5% in Aladdin Capital Holdings
LLC (ACH), a U.S.-based investment management company that
specializes in credit-related financial products. We are commit-
ting up to US$300 million as seed capital for funds to be estab-
lished by the company. This move should increase ACH’s
assets and corporate value as well as expand MC’s asset
management business.
Elsewhere, while taking steps to strengthen our existing
operations, we will also adopt a selective stance by focusing
our resources on strategic projects with the aim of generating
substantial income.
In fiscal 2009, while we expect higher income from the
leasing business and some other sectors, gains from sales of
developed real estate are likely to be lower than in fiscal 2008.
We also expect an increase in operating expenses and interest
expenses related to ongoing business development. Overall,
consolidated net income for the group is forecast at ¥17.0
billion, on a par with the previous year.
Ken Kobayashi
Executive Vice President
Group CEO, Industrial Finance,
Logistics & Development Group
leasing business jointly with Mitsubishi
UFJ Lease.
In Japan, the first step will be to
reorganize automobile leasing opera-
tions via Mitsubishi Auto Leasing
Holdings Corporation, a joint venture
between MC and Mitsubishi UFJ Lease.
Overseas, we have established a gen-
eral leasing business venture in Saudi
Arabia with Mitsubishi UFJ Lease and
local institutions. We continuously look
for such business opportunities abroad.
Elsewhere, we are developing aircraft
leasing operations, leveraging expertise
and experience acquired in aircraft-
related business transactions over many
years. Our growing portfolio of aircraft
lease assets, the largest in Japan, is
currently worth around ¥200 billion.
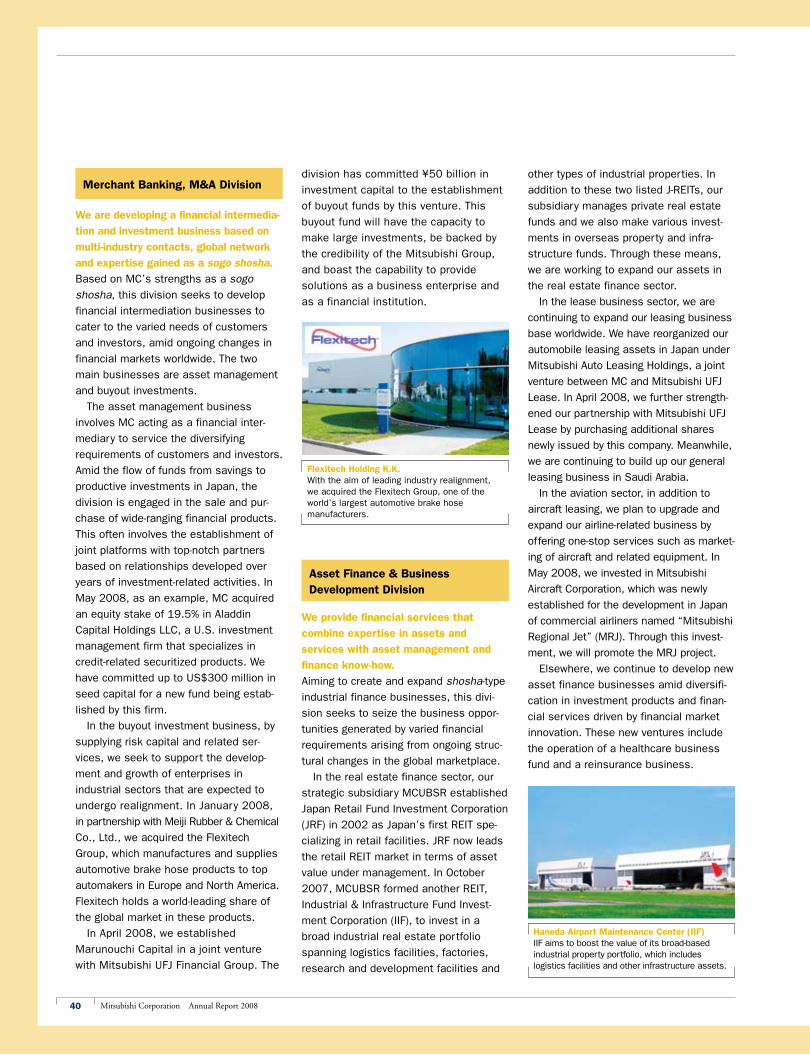
40 Mitsubishi Corporation Annual Report 2008
Flexitech Holding K.K.With the aim of leading industry realignment, we acquired the Flexitech Group, one of the world’s largest automotive brake hose manufacturers.
Haneda Airport Maintenance Center (IIF)IIF aims to boost the value of its broad-based industrial property portfolio, which includes logistics facilities and other infrastructure assets.
Merchant Banking, M&A Division
We are developing a financial intermedia-
tion and investment business based on
multi-industry contacts, global network
and expertise gained as a sogo shosha.
Based on MC’s strengths as a sogo
shosha, this division seeks to develop
financial intermediation businesses to
cater to the varied needs of customers
and investors, amid ongoing changes in
financial markets worldwide. The two
main businesses are asset management
and buyout investments.
The asset management business
involves MC acting as a financial inter-
mediary to service the diversifying
requirements of customers and investors.
Amid the flow of funds from savings to
productive investments in Japan, the
division is engaged in the sale and pur-
chase of wide-ranging financial products.
This often involves the establishment of
joint platforms with top-notch partners
based on relationships developed over
years of investment-related activities. In
May 2008, as an example, MC acquired
an equity stake of 19.5% in Aladdin
Capital Holdings LLC, a U.S. investment
management firm that specializes in
credit-related securitized products. We
have committed up to US$300 million in
seed capital for a new fund being estab-
lished by this firm.
In the buyout investment business, by
supplying risk capital and related ser-
vices, we seek to support the develop-
ment and growth of enterprises in
industrial sectors that are expected to
undergo realignment. In January 2008,
in partnership with Meiji Rubber & Chemical
Co., Ltd., we acquired the Flexitech
Group, which manufactures and supplies
automotive brake hose products to top
automakers in Europe and North America.
Flexitech holds a world-leading share of
the global market in these products.
In April 2008, we established
Marunouchi Capital in a joint venture
with Mitsubishi UFJ Financial Group. The
division has committed ¥50 billion in
investment capital to the establishment
of buyout funds by this venture. This
buyout fund will have the capacity to
make large investments, be backed by
the credibility of the Mitsubishi Group,
and boast the capability to provide
solutions as a business enterprise and
as a financial institution.
Asset Finance & Business Development Division
We provide financial services that
combine expertise in assets and
services with asset management and
finance know-how.
Aiming to create and expand shosha-type
industrial finance businesses, this divi-
sion seeks to seize the business oppor-
tunities generated by varied financial
requirements arising from ongoing struc-
tural changes in the global marketplace.
In the real estate finance sector, our
strategic subsidiary MCUBSR established
Japan Retail Fund Investment Corporation
(JRF) in 2002 as Japan’s first REIT spe-
cializing in retail facilities. JRF now leads
the retail REIT market in terms of asset
value under management. In October
2007, MCUBSR formed another REIT,
Industrial & Infrastructure Fund Invest-
ment Corporation (IIF), to invest in a
broad industrial real estate portfolio
spanning logistics facilities, factories,
research and development facilities and
other types of industrial properties. In
addition to these two listed J-REITs, our
subsidiary manages private real estate
funds and we also make various invest-
ments in overseas property and infra-
structure funds. Through these means,
we are working to expand our assets in
the real estate finance sector.
In the lease business sector, we are
continuing to expand our leasing business
base worldwide. We have reorganized our
automobile leasing assets in Japan under
Mitsubishi Auto Leasing Holdings, a joint
venture between MC and Mitsubishi UFJ
Lease. In April 2008, we further strength-
ened our partnership with Mitsubishi UFJ
Lease by purchasing additional shares
newly issued by this company. Meanwhile,
we are continuing to build up our general
leasing business in Saudi Arabia.
In the aviation sector, in addition to
aircraft leasing, we plan to upgrade and
expand our airline-related business by
offering one-stop services such as market-
ing of aircraft and related equipment. In
May 2008, we invested in Mitsubishi
Aircraft Corporation, which was newly
established for the development in Japan
of commercial airliners named “Mitsubishi
Regional Jet” (MRJ). Through this invest-
ment, we will promote the MRJ project.
Elsewhere, we continue to develop new
asset finance businesses amid diversifi-
cation in investment products and finan-
cial services driven by financial market
innovation. These new ventures include
the operation of a healthcare business
fund and a reinsurance business.
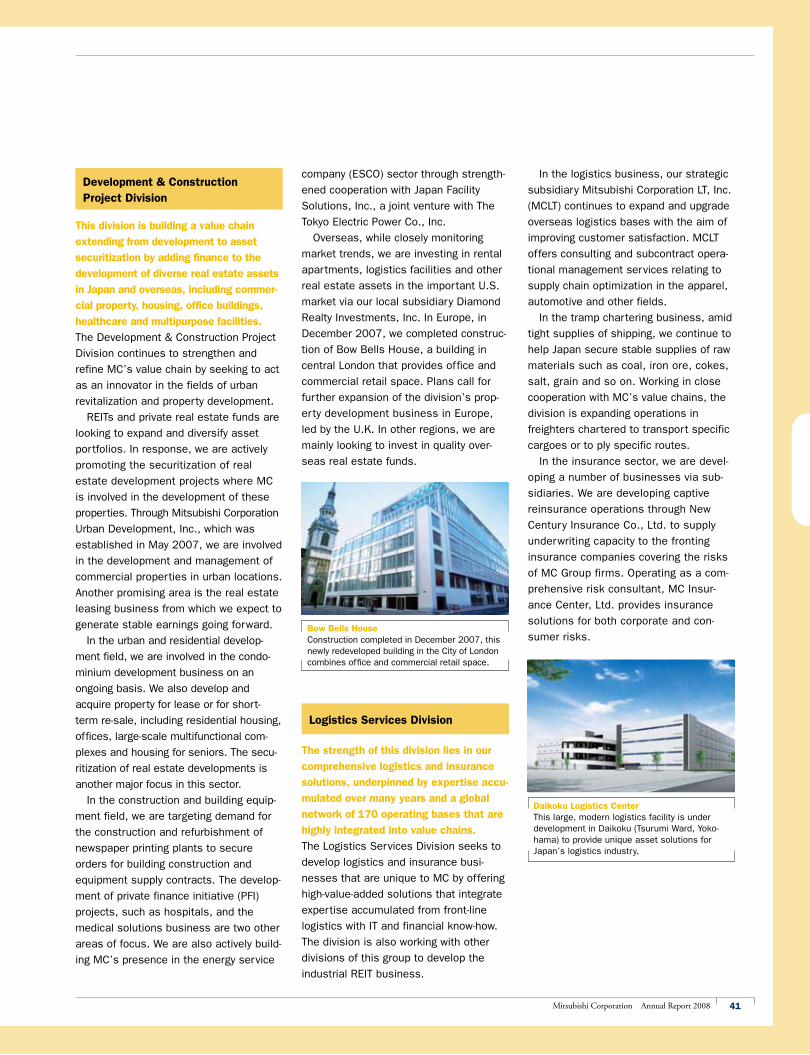
41Mitsubishi Corporation Annual Report 2008
Bow Bells HouseConstruction completed in December 2007, this newly redeveloped building in the City of London combines office and commercial retail space.
Daikoku Logistics Center This large, modern logistics facility is under development in Daikoku (Tsurumi Ward, Yoko-hama) to provide unique asset solutions for Japan’s logistics industry.
Development & Construction Project Division
This division is building a value chain
extending from development to asset
securitization by adding finance to the
development of diverse real estate assets
in Japan and overseas, including commer-
cial property, housing, office buildings,
healthcare and multipurpose facilities.
The Development & Construction Project
Division continues to strengthen and
refine MC’s value chain by seeking to act
as an innovator in the fields of urban
revitalization and property development.
REITs and private real estate funds are
looking to expand and diversify asset
portfolios. In response, we are actively
promoting the securitization of real
estate development projects where MC
is involved in the development of these
properties. Through Mitsubishi Corporation
Urban Development, Inc., which was
established in May 2007, we are involved
in the development and management of
commercial properties in urban locations.
Another promising area is the real estate
leasing business from which we expect to
generate stable earnings going forward.
In the urban and residential develop-
ment field, we are involved in the condo-
minium development business on an
ongoing basis. We also develop and
acquire property for lease or for short-
term re-sale, including residential housing,
offices, large-scale multifunctional com-
plexes and housing for seniors. The secu-
ritization of real estate developments is
another major focus in this sector.
In the construction and building equip-
ment field, we are targeting demand for
the construction and refurbishment of
newspaper printing plants to secure
orders for building construction and
equipment supply contracts. The develop-
ment of private finance initiative (PFI)
projects, such as hospitals, and the
medical solutions business are two other
areas of focus. We are also actively build-
ing MC’s presence in the energy service
company (ESCO) sector through strength-
ened cooperation with Japan Facility
Solutions, Inc., a joint venture with The
Tokyo Electric Power Co., Inc.
Overseas, while closely monitoring
market trends, we are investing in rental
apartments, logistics facilities and other
real estate assets in the important U.S.
market via our local subsidiary Diamond
Realty Investments, Inc. In Europe, in
December 2007, we completed construc-
tion of Bow Bells House, a building in
central London that provides office and
commercial retail space. Plans call for
further expansion of the division’s prop-
erty development business in Europe,
led by the U.K. In other regions, we are
mainly looking to invest in quality over-
seas real estate funds.
Logistics Services Division
The strength of this division lies in our
comprehensive logistics and insurance
solutions, underpinned by expertise accu-
mulated over many years and a global
network of 170 operating bases that are
highly integrated into value chains.
The Logistics Services Division seeks to
develop logistics and insurance busi-
nesses that are unique to MC by offering
high-value-added solutions that integrate
expertise accumulated from front-line
logistics with IT and financial know-how.
The division is also working with other
divisions of this group to develop the
industrial REIT business.
In the logistics business, our strategic
subsidiary Mitsubishi Corporation LT, Inc.
(MCLT) continues to expand and upgrade
overseas logistics bases with the aim of
improving customer satisfaction. MCLT
offers consulting and subcontract opera-
tional management services relating to
supply chain optimization in the apparel,
automotive and other fields.
In the tramp chartering business, amid
tight supplies of shipping, we continue to
help Japan secure stable supplies of raw
materials such as coal, iron ore, cokes,
salt, grain and so on. Working in close
cooperation with MC’s value chains, the
division is expanding operations in
freighters chartered to transport specific
cargoes or to ply specific routes.
In the insurance sector, we are devel-
oping a number of businesses via sub-
sidiaries. We are developing captive
reinsurance operations through New
Century Insurance Co., Ltd. to supply
underwriting capacity to the fronting
insurance companies covering the risks
of MC Group firms. Operating as a com-
prehensive risk consultant, MC Insur-
ance Center, Ltd. provides insurance
solutions for both corporate and con-
sumer risks.
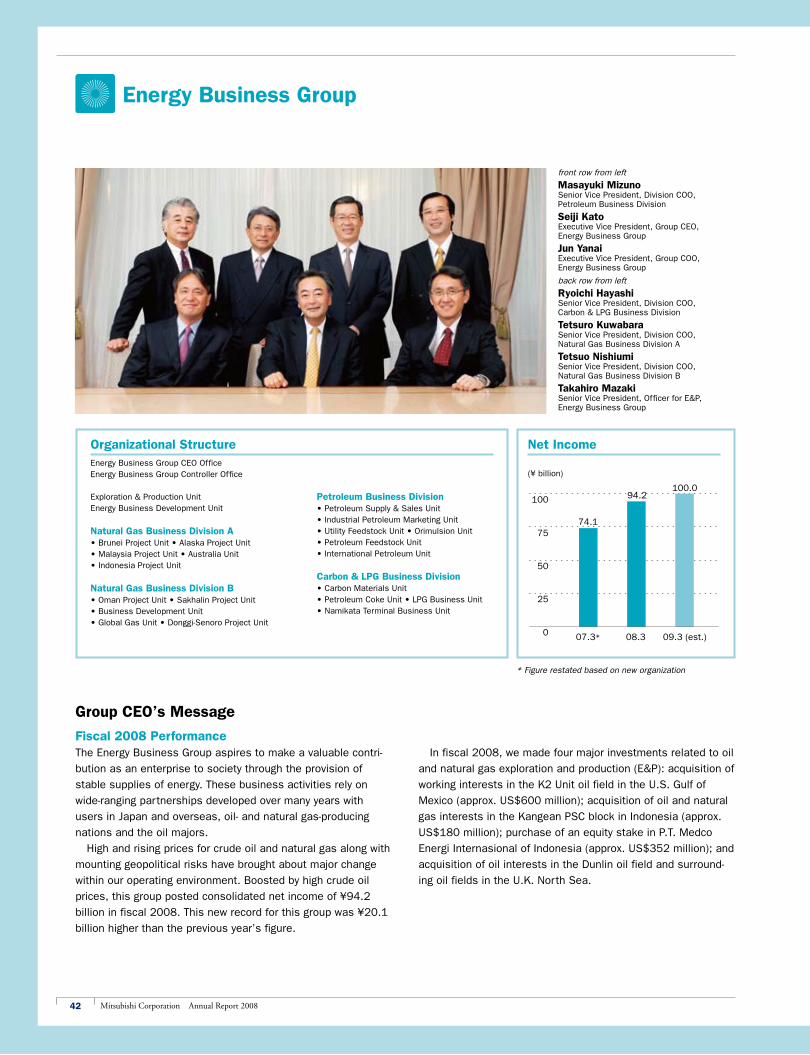
42 Mitsubishi Corporation Annual Report 2008
75
100
50
25
0 07.3* 08.3 09.3 (est.)
74.1
94.2100.0
Energy Business Group
front row from left
Masayuki MizunoSenior Vice President, Division COO, Petroleum Business Division
Seiji KatoExecutive Vice President, Group CEO, Energy Business Group
Jun YanaiExecutive Vice President, Group COO, Energy Business Group
back row from left
Ryoichi HayashiSenior Vice President, Division COO, Carbon & LPG Business Division
Tetsuro KuwabaraSenior Vice President, Division COO, Natural Gas Business Division A
Tetsuo NishiumiSenior Vice President, Division COO, Natural Gas Business Division B
Takahiro MazakiSenior Vice President, Officer for E&P, Energy Business Group
Organizational StructureEnergy Business Group CEO OfficeEnergy Business Group Controller Office
Exploration & Production UnitEnergy Business Development Unit
Natural Gas Business Division A• Brunei Project Unit • Alaska Project Unit • Malaysia Project Unit • Australia Unit • Indonesia Project Unit
Natural Gas Business Division B• Oman Project Unit • Sakhalin Project Unit • Business Development Unit • Global Gas Unit • Donggi-Senoro Project Unit
Petroleum Business Division• Petroleum Supply & Sales Unit • Industrial Petroleum Marketing Unit • Utility Feedstock Unit • Orimulsion Unit • Petroleum Feedstock Unit • International Petroleum Unit
Carbon & LPG Business Division• Carbon Materials Unit • Petroleum Coke Unit • LPG Business Unit • Namikata Terminal Business Unit
Group CEO’s Message
Fiscal 2008 PerformanceThe Energy Business Group aspires to make a valuable contri-
bution as an enterprise to society through the provision of
stable supplies of energy. These business activities rely on
wide-ranging partnerships developed over many years with
users in Japan and overseas, oil- and natural gas-producing
nations and the oil majors.
High and rising prices for crude oil and natural gas along with
mounting geopolitical risks have brought about major change
within our operating environment. Boosted by high crude oil
prices, this group posted consolidated net income of ¥94.2
billion in fiscal 2008. This new record for this group was ¥20.1
billion higher than the previous year’s figure.
In fiscal 2008, we made four major investments related to oil
and natural gas exploration and production (E&P): acquisition of
working interests in the K2 Unit oil field in the U.S. Gulf of
Mexico (approx. US$600 million); acquisition of oil and natural
gas interests in the Kangean PSC block in Indonesia (approx.
US$180 million); purchase of an equity stake in P.T. Medco
Energi Internasional of Indonesia (approx. US$352 million); and
acquisition of oil interests in the Dunlin oil field and surround-
ing oil fields in the U.K. North Sea.
Net Income
(¥ billion)
* Figure restated based on new organization
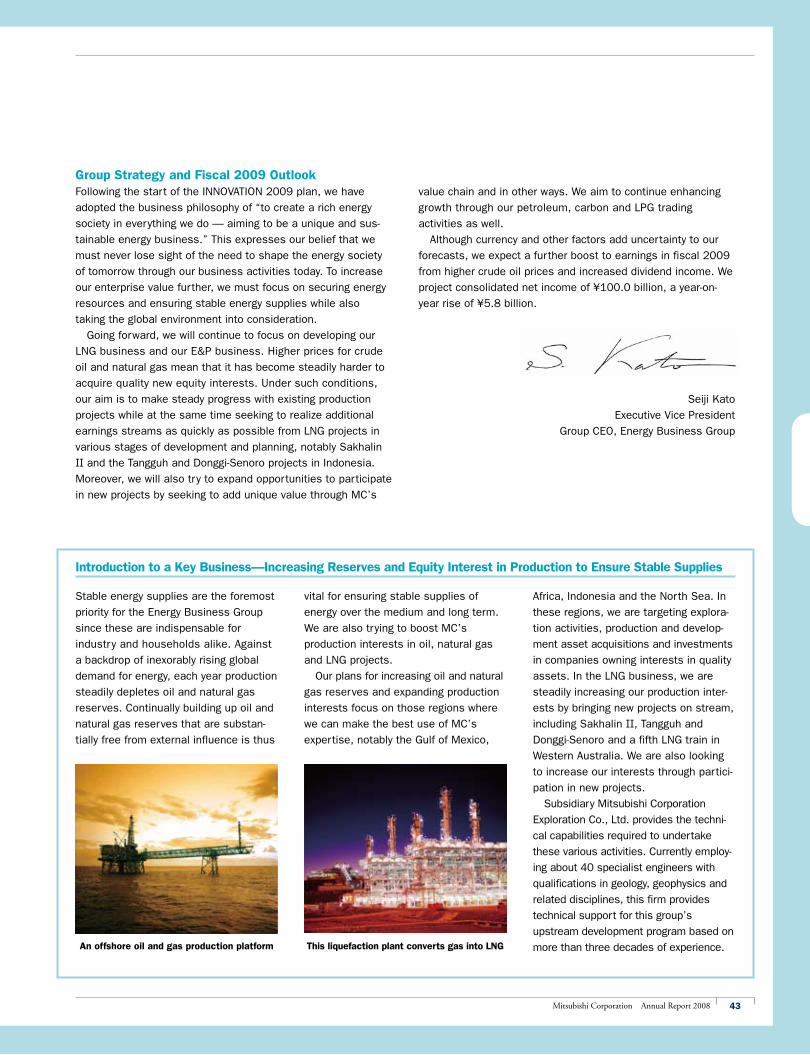
43Mitsubishi Corporation Annual Report 2008
Stable energy supplies are the foremost
priority for the Energy Business Group
since these are indispensable for
industry and households alike. Against
a backdrop of inexorably rising global
demand for energy, each year production
steadily depletes oil and natural gas
reserves. Continually building up oil and
natural gas reserves that are substan-
tially free from external influence is thus
Introduction to a Key Business—Increasing Reserves and Equity Interest in Production to Ensure Stable Supplies
vital for ensuring stable supplies of
energy over the medium and long term.
We are also trying to boost MC’s
production interests in oil, natural gas
and LNG projects.
Our plans for increasing oil and natural
gas reserves and expanding production
interests focus on those regions where
we can make the best use of MC’s
expertise, notably the Gulf of Mexico,
Group Strategy and Fiscal 2009 OutlookFollowing the start of the INNOVATION 2009 plan, we have
adopted the business philosophy of “to create a rich energy
society in everything we do — aiming to be a unique and sus-
tainable energy business.” This expresses our belief that we
must never lose sight of the need to shape the energy society
of tomorrow through our business activities today. To increase
our enterprise value further, we must focus on securing energy
resources and ensuring stable energy supplies while also
taking the global environment into consideration.
Going forward, we will continue to focus on developing our
LNG business and our E&P business. Higher prices for crude
oil and natural gas mean that it has become steadily harder to
acquire quality new equity interests. Under such conditions,
our aim is to make steady progress with existing production
projects while at the same time seeking to realize additional
earnings streams as quickly as possible from LNG projects in
various stages of development and planning, notably Sakhalin
II and the Tangguh and Donggi-Senoro projects in Indonesia.
Moreover, we will also try to expand opportunities to participate
in new projects by seeking to add unique value through MC’s
value chain and in other ways. We aim to continue enhancing
growth through our petroleum, carbon and LPG trading
activities as well.
Although currency and other factors add uncertainty to our
forecasts, we expect a further boost to earnings in fiscal 2009
from higher crude oil prices and increased dividend income. We
project consolidated net income of ¥100.0 billion, a year-on-
year rise of ¥5.8 billion.
Seiji Kato
Executive Vice President
Group CEO, Energy Business Group
Africa, Indonesia and the North Sea. In
these regions, we are targeting explora-
tion activities, production and develop-
ment asset acquisitions and investments
in companies owning interests in quality
assets. In the LNG business, we are
steadily increasing our production inter-
ests by bringing new projects on stream,
including Sakhalin II, Tangguh and
Donggi-Senoro and a fifth LNG train in
Western Australia. We are also looking
to increase our interests through partici-
pation in new projects.
Subsidiary Mitsubishi Corporation
Exploration Co., Ltd. provides the techni-
cal capabilities required to undertake
these various activities. Currently employ-
ing about 40 specialist engineers with
qualifications in geology, geophysics and
related disciplines, this firm provides
technical support for this group’s
upstream development program based on
more than three decades of experience.An offshore oil and gas production platform This liquefaction plant converts gas into LNG
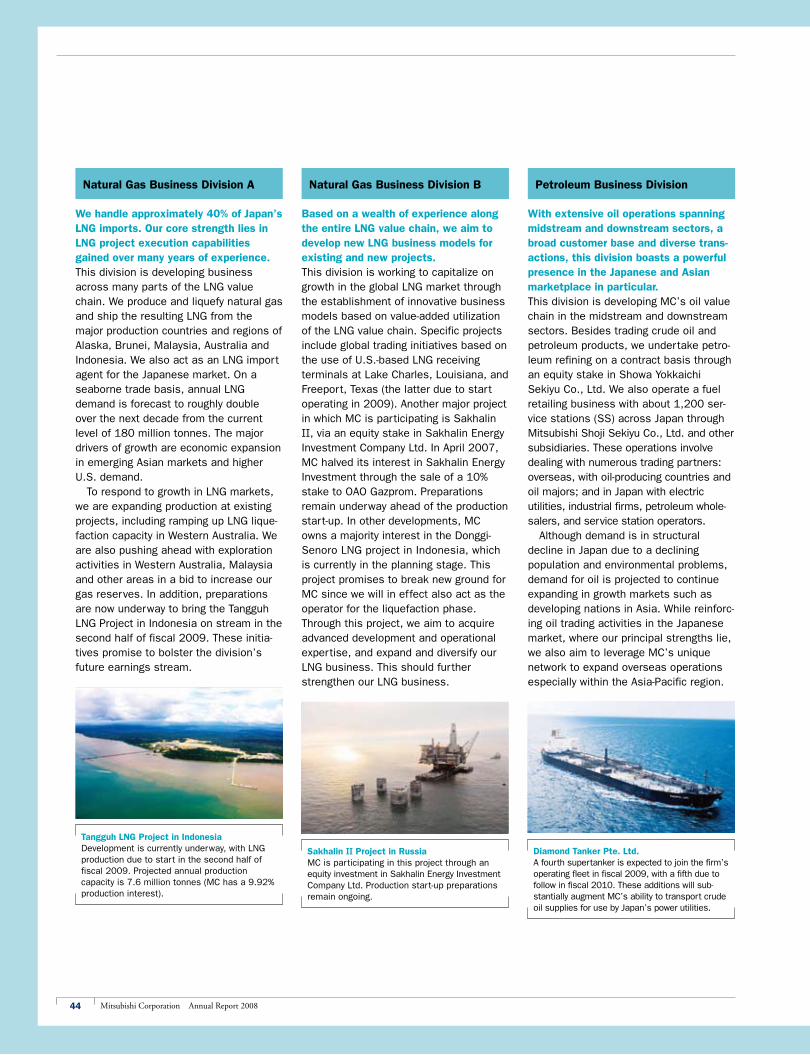
44 Mitsubishi Corporation Annual Report 2008
Tangguh LNG Project in IndonesiaDevelopment is currently underway, with LNG production due to start in the second half of fiscal 2009. Projected annual production capacity is 7.6 million tonnes (MC has a 9.92% production interest).
Sakhalin II Project in RussiaMC is participating in this project through an equity investment in Sakhalin Energy Investment Company Ltd. Production start-up preparations remain ongoing.
Diamond Tanker Pte. Ltd.A fourth supertanker is expected to join the firm’s operating fleet in fiscal 2009, with a fifth due to follow in fiscal 2010. These additions will sub-stantially augment MC’s ability to transport crude oil supplies for use by Japan’s power utilities.
Natural Gas Business Division A
We handle approximately 40% of Japan’s LNG imports. Our core strength lies in LNG project execution capabilities gained over many years of experience.This division is developing business across many parts of the LNG value chain. We produce and liquefy natural gas and ship the resulting LNG from the major production countries and regions of Alaska, Brunei, Malaysia, Australia and Indonesia. We also act as an LNG import agent for the Japanese market. On a seaborne trade basis, annual LNG demand is forecast to roughly double over the next decade from the current level of 180 million tonnes. The major drivers of growth are economic expansion in emerging Asian markets and higher U.S. demand. To respond to growth in LNG markets, we are expanding production at existing projects, including ramping up LNG lique-faction capacity in Western Australia. We are also pushing ahead with exploration activities in Western Australia, Malaysia and other areas in a bid to increase our gas reserves. In addition, preparations are now underway to bring the Tangguh LNG Project in Indonesia on stream in the second half of fiscal 2009. These initia-tives promise to bolster the division’s future earnings stream.
Natural Gas Business Division B
Based on a wealth of experience along the entire LNG value chain, we aim to develop new LNG business models for existing and new projects.This division is working to capitalize on growth in the global LNG market through the establishment of innovative business models based on value-added utilization of the LNG value chain. Specific projects include global trading initiatives based on the use of U.S.-based LNG receiving terminals at Lake Charles, Louisiana, and Freeport, Texas (the latter due to start operating in 2009). Another major project in which MC is participating is Sakhalin II, via an equity stake in Sakhalin Energy Investment Company Ltd. In April 2007, MC halved its interest in Sakhalin Energy Investment through the sale of a 10% stake to OAO Gazprom. Preparations remain underway ahead of the production start-up. In other developments, MC owns a majority interest in the Donggi-Senoro LNG project in Indonesia, which is currently in the planning stage. This project promises to break new ground for MC since we will in effect also act as the operator for the liquefaction phase. Through this project, we aim to acquire advanced development and operational expertise, and expand and diversify our LNG business. This should further strengthen our LNG business.
Petroleum Business Division
With extensive oil operations spanning midstream and downstream sectors, a broad customer base and diverse trans-actions, this division boasts a powerful presence in the Japanese and Asian marketplace in particular.This division is developing MC’s oil value chain in the midstream and downstream sectors. Besides trading crude oil and petroleum products, we undertake petro-leum refining on a contract basis through an equity stake in Showa Yokkaichi Sekiyu Co., Ltd. We also operate a fuel retailing business with about 1,200 ser-vice stations (SS) across Japan through Mitsubishi Shoji Sekiyu Co., Ltd. and other subsidiaries. These operations involve dealing with numerous trading partners: overseas, with oil-producing countries and oil majors; and in Japan with electric utilities, industrial firms, petroleum whole-salers, and service station operators. Although demand is in structural decline in Japan due to a declining population and environmental problems, demand for oil is projected to continue expanding in growth markets such as developing nations in Asia. While reinforc-ing oil trading activities in the Japanese market, where our principal strengths lie, we also aim to leverage MC’s unique network to expand overseas operations especially within the Asia-Pacific region.
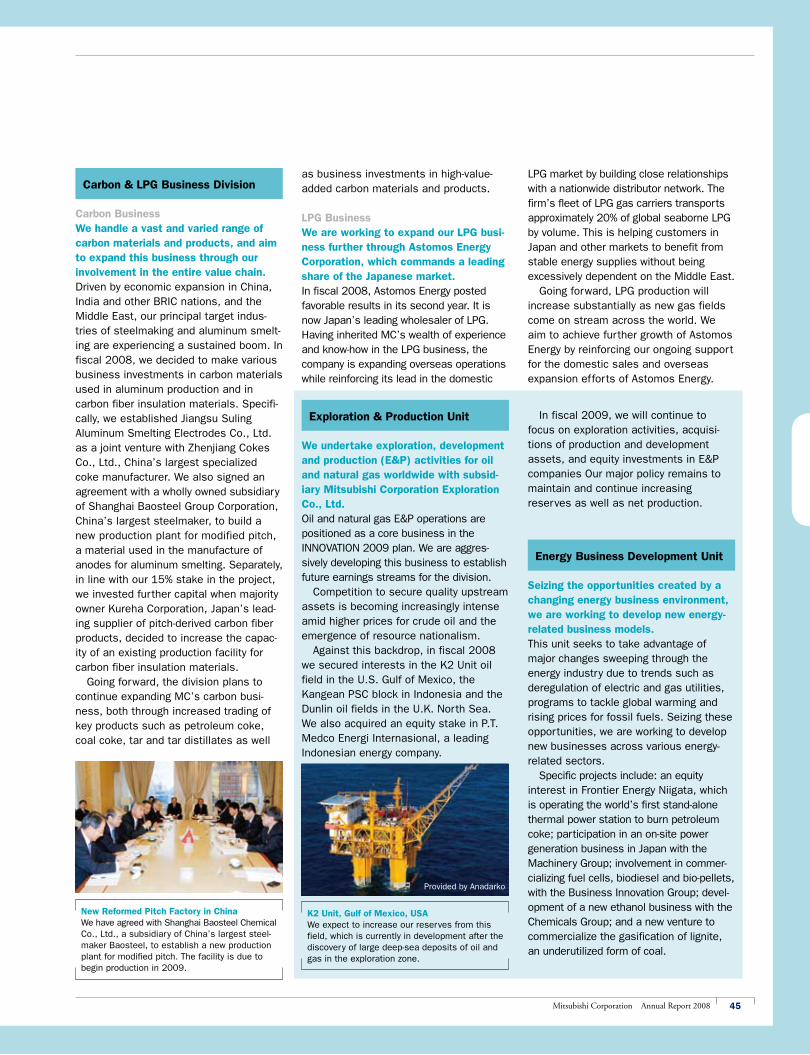
45Mitsubishi Corporation Annual Report 2008
New Reformed Pitch Factory in ChinaWe have agreed with Shanghai Baosteel Chemical Co., Ltd., a subsidiary of China’s largest steel-maker Baosteel, to establish a new production plant for modified pitch. The facility is due to begin production in 2009.
K2 Unit, Gulf of Mexico, USAWe expect to increase our reserves from this field, which is currently in development after the discovery of large deep-sea deposits of oil and gas in the exploration zone.
Provided by Anadarko
Carbon & LPG Business Division
Carbon BusinessWe handle a vast and varied range of carbon materials and products, and aim to expand this business through our involvement in the entire value chain.Driven by economic expansion in China, India and other BRIC nations, and the Middle East, our principal target indus-tries of steelmaking and aluminum smelt-ing are experiencing a sustained boom. In fiscal 2008, we decided to make various business investments in carbon materials used in aluminum production and in carbon fiber insulation materials. Specifi-cally, we established Jiangsu Suling Aluminum Smelting Electrodes Co., Ltd. as a joint venture with Zhenjiang Cokes Co., Ltd., China’s largest specialized coke manufacturer. We also signed an agreement with a wholly owned subsidiary of Shanghai Baosteel Group Corporation, China’s largest steelmaker, to build a new production plant for modified pitch, a material used in the manufacture of anodes for aluminum smelting. Separately, in line with our 15% stake in the project, we invested further capital when majority owner Kureha Corporation, Japan’s lead-ing supplier of pitch-derived carbon fiber products, decided to increase the capac-ity of an existing production facility for carbon fiber insulation materials. Going forward, the division plans to continue expanding MC’s carbon busi-ness, both through increased trading of key products such as petroleum coke, coal coke, tar and tar distillates as well
as business investments in high-value-added carbon materials and products.
LPG BusinessWe are working to expand our LPG busi-ness further through Astomos Energy Corporation, which commands a leading share of the Japanese market.In fiscal 2008, Astomos Energy posted favorable results in its second year. It is now Japan’s leading wholesaler of LPG. Having inherited MC’s wealth of experience and know-how in the LPG business, the company is expanding overseas operations while reinforcing its lead in the domestic
Exploration & Production Unit
We undertake exploration, development and production (E&P) activities for oil and natural gas worldwide with subsid-iary Mitsubishi Corporation Exploration Co., Ltd.Oil and natural gas E&P operations are positioned as a core business in the INNOVATION 2009 plan. We are aggres-sively developing this business to establish future earnings streams for the division. Competition to secure quality upstream assets is becoming increasingly intense amid higher prices for crude oil and the emergence of resource nationalism. Against this backdrop, in fiscal 2008 we secured interests in the K2 Unit oil field in the U.S. Gulf of Mexico, the Kangean PSC block in Indonesia and the Dunlin oil fields in the U.K. North Sea. We also acquired an equity stake in P.T. Medco Energi Internasional, a leading Indonesian energy company.
LPG market by building close relationships with a nationwide distributor network. The firm’s fleet of LPG gas carriers transports approximately 20% of global seaborne LPG by volume. This is helping customers in Japan and other markets to benefit from stable energy supplies without being excessively dependent on the Middle East. Going forward, LPG production will increase substantially as new gas fields come on stream across the world. We aim to achieve further growth of Astomos Energy by reinforcing our ongoing support for the domestic sales and overseas expansion efforts of Astomos Energy.
In fiscal 2009, we will continue to focus on exploration activities, acquisi-tions of production and development assets, and equity investments in E&P companies Our major policy remains to maintain and continue increasing reserves as well as net production.
Energy Business Development Unit
Seizing the opportunities created by a changing energy business environment, we are working to develop new energy-related business models.This unit seeks to take advantage of major changes sweeping through the energy industry due to trends such as deregulation of electric and gas utilities, programs to tackle global warming and rising prices for fossil fuels. Seizing these opportunities, we are working to develop new businesses across various energy-related sectors. Specific projects include: an equity interest in Frontier Energy Niigata, which is operating the world’s first stand-alone thermal power station to burn petroleum coke; participation in an on-site power generation business in Japan with the Machinery Group; involvement in commer-cializing fuel cells, biodiesel and bio- pellets, with the Business Innovation Group; devel-opment of a new ethanol business with the Chemicals Group; and a new venture to commercialize the gasification of lignite, an underutilized form of coal.
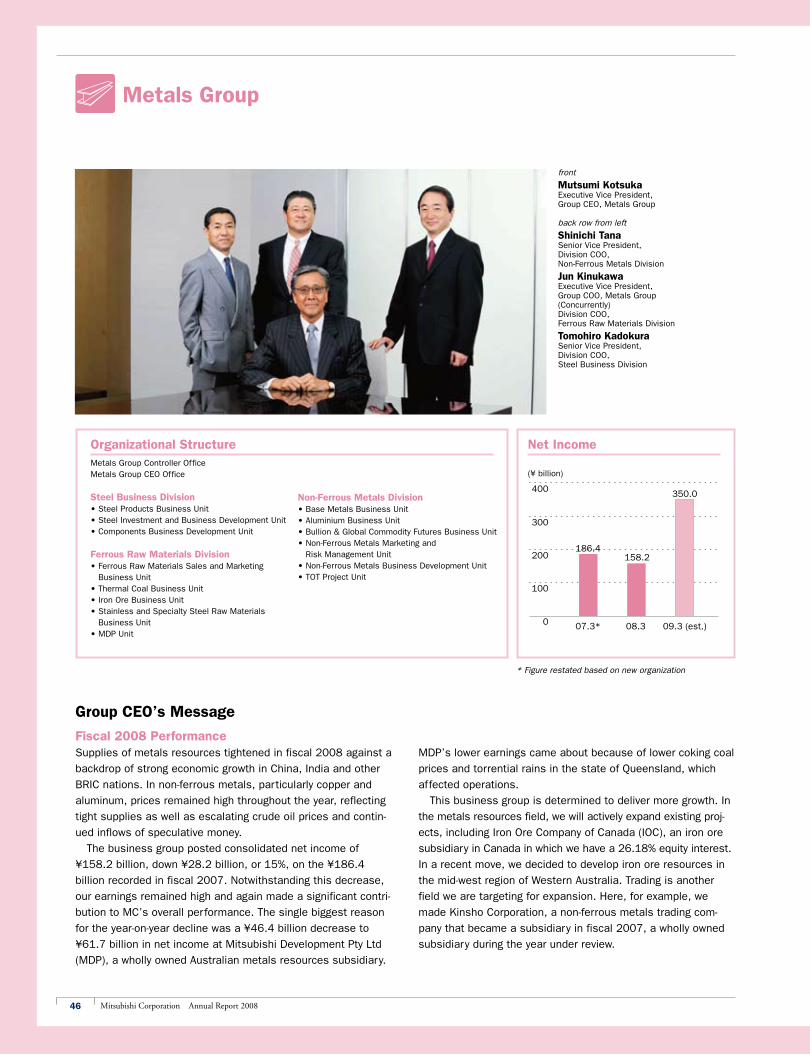
46 Mitsubishi Corporation Annual Report 2008
300
400
200
100
0 07.3* 08.3 09.3 (est.)
186.4158.2
350.0
Metals Group
front
Mutsumi KotsukaExecutive Vice President, Group CEO, Metals Group
back row from left
Shinichi TanaSenior Vice President, Division COO, Non-Ferrous Metals Division
Jun KinukawaExecutive Vice President, Group COO, Metals Group(Concurrently) Division COO, Ferrous Raw Materials Division
Tomohiro KadokuraSenior Vice President, Division COO, Steel Business Division
Organizational StructureMetals Group Controller OfficeMetals Group CEO Office
Steel Business Division• Steel Products Business Unit • Steel Investment and Business Development Unit • Components Business Development Unit
Ferrous Raw Materials Division• Ferrous Raw Materials Sales and Marketing
Business Unit • Thermal Coal Business Unit • Iron Ore Business Unit • Stainless and Specialty Steel Raw Materials
Business Unit • MDP Unit
Non-Ferrous Metals Division• Base Metals Business Unit • Aluminium Business Unit • Bullion & Global Commodity Futures Business Unit • Non-Ferrous Metals Marketing and
Risk Management Unit • Non-Ferrous Metals Business Development Unit • TOT Project Unit
Group CEO’s Message
Fiscal 2008 PerformanceSupplies of metals resources tightened in fiscal 2008 against a
backdrop of strong economic growth in China, India and other
BRIC nations. In non-ferrous metals, particularly copper and
aluminum, prices remained high throughout the year, reflecting
tight supplies as well as escalating crude oil prices and contin-
ued inflows of speculative money.
The business group posted consolidated net income of
¥158.2 billion, down ¥28.2 billion, or 15%, on the ¥186.4
billion recorded in fiscal 2007. Notwithstanding this decrease,
our earnings remained high and again made a significant contri-
bution to MC’s overall performance. The single biggest reason
for the year-on-year decline was a ¥46.4 billion decrease to
¥61.7 billion in net income at Mitsubishi Development Pty Ltd
(MDP), a wholly owned Australian metals resources subsidiary.
MDP’s lower earnings came about because of lower coking coal
prices and torrential rains in the state of Queensland, which
affected operations.
This business group is determined to deliver more growth. In
the metals resources field, we will actively expand existing proj-
ects, including Iron Ore Company of Canada (IOC), an iron ore
subsidiary in Canada in which we have a 26.18% equity interest.
In a recent move, we decided to develop iron ore resources in
the mid-west region of Western Australia. Trading is another
field we are targeting for expansion. Here, for example, we
made Kinsho Corporation, a non-ferrous metals trading com-
pany that became a subsidiary in fiscal 2007, a wholly owned
subsidiary during the year under review.
Net Income
(¥ billion)
* Figure restated based on new organization
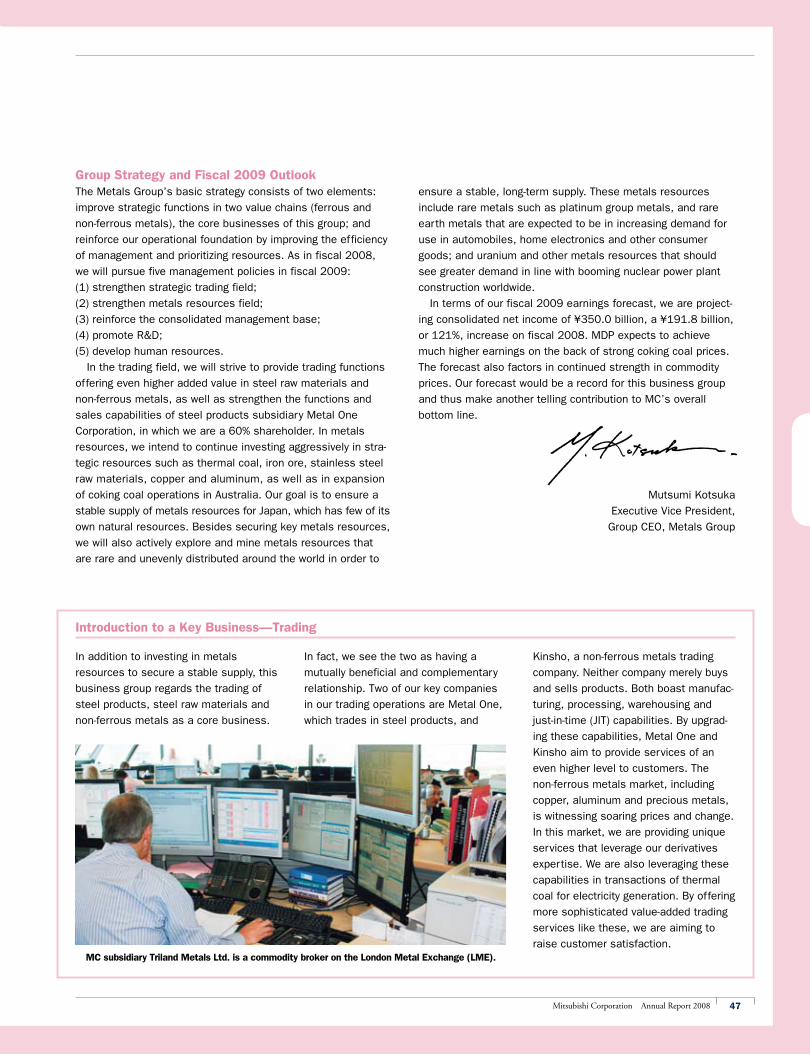
47Mitsubishi Corporation Annual Report 2008
In addition to investing in metals
resources to secure a stable supply, this
business group regards the trading of
steel products, steel raw materials and
non-ferrous metals as a core business.
Introduction to a Key Business—Trading
In fact, we see the two as having a
mutually beneficial and complementary
relationship. Two of our key companies
in our trading operations are Metal One,
which trades in steel products, and
Group Strategy and Fiscal 2009 OutlookThe Metals Group’s basic strategy consists of two elements:
improve strategic functions in two value chains (ferrous and
non-ferrous metals), the core businesses of this group; and
reinforce our operational foundation by improving the efficiency
of management and prioritizing resources. As in fiscal 2008,
we will pursue five management policies in fiscal 2009:
(1) strengthen strategic trading field;
(2) strengthen metals resources field;
(3) reinforce the consolidated management base;
(4) promote R&D;
(5) develop human resources.
In the trading field, we will strive to provide trading functions
offering even higher added value in steel raw materials and
non-ferrous metals, as well as strengthen the functions and
sales capabilities of steel products subsidiary Metal One
Corporation, in which we are a 60% shareholder. In metals
resources, we intend to continue investing aggressively in stra-
tegic resources such as thermal coal, iron ore, stainless steel
raw materials, copper and aluminum, as well as in expansion
of coking coal operations in Australia. Our goal is to ensure a
stable supply of metals resources for Japan, which has few of its
own natural resources. Besides securing key metals resources,
we will also actively explore and mine metals resources that
are rare and unevenly distributed around the world in order to
ensure a stable, long-term supply. These metals resources
include rare metals such as platinum group metals, and rare
earth metals that are expected to be in increasing demand for
use in automobiles, home electronics and other consumer
goods; and uranium and other metals resources that should
see greater demand in line with booming nuclear power plant
construction worldwide.
In terms of our fiscal 2009 earnings forecast, we are project-
ing consolidated net income of ¥350.0 billion, a ¥191.8 billion,
or 121%, increase on fiscal 2008. MDP expects to achieve
much higher earnings on the back of strong coking coal prices.
The forecast also factors in continued strength in commodity
prices. Our forecast would be a record for this business group
and thus make another telling contribution to MC’s overall
bottom line.
Mutsumi Kotsuka
Executive Vice President,
Group CEO, Metals Group
Kinsho, a non-ferrous metals trading
company. Neither company merely buys
and sells products. Both boast manufac-
turing, processing, warehousing and
just-in-time (JIT) capabilities. By upgrad-
ing these capabilities, Metal One and
Kinsho aim to provide services of an
even higher level to customers. The
non-ferrous metals market, including
copper, aluminum and precious metals,
is witnessing soaring prices and change.
In this market, we are providing unique
services that leverage our derivatives
expertise. We are also leveraging these
capabilities in transactions of thermal
coal for electricity generation. By offering
more sophisticated value-added trading
services like these, we are aiming to
raise customer satisfaction.MC subsidiary Triland Metals Ltd. is a commodity broker on the London Metal Exchange (LME).

48 Mitsubishi Corporation Annual Report 2008
Metal One CorporationIn April 2008, the Metal One Forum was launched as a platform for discussing the approach to group management among group companies and employees sharing the same corporate philosophy. The forum’s goal is to strengthen group management and the develop-ment of its employees.
Steel Business Division
This division includes Metal One, the
industry’s largest steel products trading
company with customers in all industries.
From the manufacture of steel products
to the end user, we function right along
the length and breadth of the value chain.
Through management of subsidiary Metal
One, which was established with the
former Nissho Iwai Corporation (now
Sojitz Corporation) in 2003, we are
streamlining distribution and strengthen-
ing the value chain in steel products. And
by forging stronger relationships with key
customer industries we are able to
quickly identify market needs and turn
them into business. In the fiscal year
ended December 31, 2007, Metal One
recorded consolidated net income of
¥35.1 billion, the result of progress
made reforming distribution and of rising
prices for steel products, which reflected
escalating resource prices.
The fiscal year ending March 31, 2009
will mark the end of Metal One’s Second
Mid-term Consolidated Management Plan,
which was launched in 2006. The goal of
this plan is to create a Metal One Group
that is “strong but flexible, ethically and
financially sound and has great growth
potential through the building of a global
value chain.” Metal One has worked to lay
the foundations for further growth guided
by this goal. The Steel Business Division
is determined to promote Metal One’s
sustained growth. In this regard, we will
support efforts to put in place a structure
for promoting efficient management to
reinforce operations. On the supply side,
we will help Metal One to strengthen its
steel purchasing function such as by
investing in overseas steel businesses
with steelmakers. On the demand side, we
will assist Metal One to strengthen sales
through cooperation with the Machinery
and Business Innovation groups to partici-
pate in businesses in key fields. One of
these is the auto industry. And one vehicle
for this is Thai-based autoparts manufac-
turer and distributor, DIA Modern
Engineering (Thailand) Co., Ltd. (DMET). By
developing businesses on both the supply
and demand sides of steel distribution in
this way, we will help strengthen Metal
One’s capabilities, thereby reinforcing the
steel value chain.
The goals for fiscal 2009 in the Steel
Business Division are the same as those
for fiscal 2008: make further progress
restructuring and streamlining steel
distribution; support the efficient man-
agement of Metal One and other consoli-
dated subsidiaries; and develop human
resources with the aim of offering
services of a higher quality. The steel
products sales sector is currently in the
middle of a restructuring phase.
Overseas we are seeing the ongoing
integration of major steel product manu-
facturers, while in Japan trading compa-
nies affiliated with steelmakers are
grabbing a higher market share as the
services of trading companies of old are
called into question. This business divi-
sion sees business opportunities in this
shifting industry landscape. We intend to
make the most of synergies created from
our information network and business
development capabilities as a sogo
shosha to capitalize on these opportuni-
ties. By promoting the development of
Metal One, we aim to create the biggest
and best steel products sales organiza-
tion, one that is without peer.
Ferrous Raw Materials Division
This division invests in the development
of a number of different types of minerals
and materials, which it also sources,
ships and markets. The division’s world-
wide operations supply essential minerals
and fuel that help to meet the needs of
global steel and electric power compa-
nies, and help to provide a stable supply.
Our major products include coking coal,
thermal coal, iron ore, stainless and
specialty raw materials, and uranium.
The Ferrous Raw Materials Division is
making efforts to enhance both invest-
ment and marketing operations. The
division’s investment business serves as
the main source of earnings supporting
the division’s continued growth. It is
committed to the further growth of BMA,
the world’s largest coking coal producer,
and is actively investing in a wide range
of business activities, including the pro-
duction of stainless steel raw materials
and iron ore, as well as coal and uranium
production for use as fuel for electricity
generation. In the sales area, MC
Resources Trade & Logistics, which was
established in April 2006 as a 100%
sales subsidiary, is responsible for MC’s
trade in such ferrous raw materials as
coking coal, iron ore, and stainless and
specialty raw materials and it sells them
on a global scale.
Across the world, especially in China
and other developing countries in Asia,
demand for ferrous raw materials and
fuel for electricity generation has been
strongly supported by an ongoing, long-
term growth trend. While keeping abreast
of such worldwide trends, we intend to
continue to proactively develop strategic
businesses, through investing in resource
development, and procuring, transport-
ing, and selling raw materials to ensure a
stable supply of raw materials and fuel to
our global customers.
Since 2001, we have strengthened our
ties with BHP Billiton Ltd., Australia’s
preeminent global resources company,
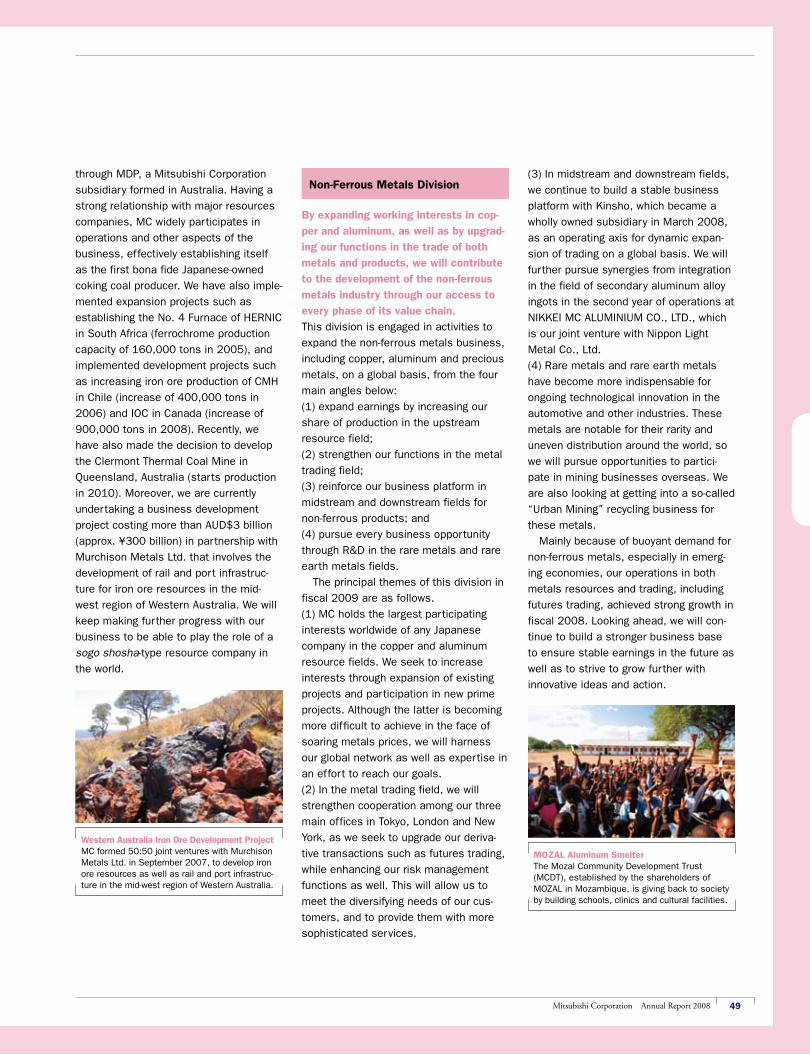
49Mitsubishi Corporation Annual Report 2008
Western Australia Iron Ore Development ProjectMC formed 50:50 joint ventures with Murchison Metals Ltd. in September 2007, to develop iron ore resources as well as rail and port infrastruc-ture in the mid-west region of Western Australia.
MOZAL Aluminum SmelterThe Mozal Community Development Trust (MCDT), established by the shareholders of MOZAL in Mozambique, is giving back to society by building schools, clinics and cultural facilities.
through MDP, a Mitsubishi Corporation
subsidiary formed in Australia. Having a
strong relationship with major resources
companies, MC widely participates in
operations and other aspects of the
business, effectively establishing itself
as the first bona fide Japanese-owned
coking coal producer. We have also imple-
mented expansion projects such as
establishing the No. 4 Furnace of HERNIC
in South Africa (ferrochrome production
capacity of 160,000 tons in 2005), and
implemented development projects such
as increasing iron ore production of CMH
in Chile (increase of 400,000 tons in
2006) and IOC in Canada (increase of
900,000 tons in 2008). Recently, we
have also made the decision to develop
the Clermont Thermal Coal Mine in
Queensland, Australia (starts production
in 2010). Moreover, we are currently
undertaking a business development
project costing more than AUD$3 billion
(approx. ¥300 billion) in partnership with
Murchison Metals Ltd. that involves the
development of rail and port infrastruc-
ture for iron ore resources in the mid-
west region of Western Australia. We will
keep making further progress with our
business to be able to play the role of a
sogo shosha-type resource company in
the world.
Non-Ferrous Metals Division
By expanding working interests in cop-
per and aluminum, as well as by upgrad-
ing our functions in the trade of both
metals and products, we will contribute
to the development of the non-ferrous
metals industry through our access to
every phase of its value chain.
This division is engaged in activities to
expand the non-ferrous metals business,
including copper, aluminum and precious
metals, on a global basis, from the four
main angles below:
(1) expand earnings by increasing our
share of production in the upstream
resource field;
(2) strengthen our functions in the metal
trading field;
(3) reinforce our business platform in
midstream and downstream fields for
non-ferrous products; and
(4) pursue every business opportunity
through R&D in the rare metals and rare
earth metals fields.
The principal themes of this division in
fiscal 2009 are as follows.
(1) MC holds the largest participating
interests worldwide of any Japanese
company in the copper and aluminum
resource fields. We seek to increase
interests through expansion of existing
projects and participation in new prime
projects. Although the latter is becoming
more difficult to achieve in the face of
soaring metals prices, we will harness
our global network as well as expertise in
an effort to reach our goals.
(2) In the metal trading field, we will
strengthen cooperation among our three
main offices in Tokyo, London and New
York, as we seek to upgrade our deriva-
tive transactions such as futures trading,
while enhancing our risk management
functions as well. This will allow us to
meet the diversifying needs of our cus-
tomers, and to provide them with more
sophisticated services.
(3) In midstream and downstream fields,
we continue to build a stable business
platform with Kinsho, which became a
wholly owned subsidiary in March 2008,
as an operating axis for dynamic expan-
sion of trading on a global basis. We will
further pursue synergies from integration
in the field of secondary aluminum alloy
ingots in the second year of operations at
NIKKEI MC ALUMINIUM CO., LTD., which
is our joint venture with Nippon Light
Metal Co., Ltd.
(4) Rare metals and rare earth metals
have become more indispensable for
ongoing technological innovation in the
automotive and other industries. These
metals are notable for their rarity and
uneven distribution around the world, so
we will pursue opportunities to partici-
pate in mining businesses overseas. We
are also looking at getting into a so-called
“Urban Mining” recycling business for
these metals.
Mainly because of buoyant demand for
non-ferrous metals, especially in emerg-
ing economies, our operations in both
metals resources and trading, including
futures trading, achieved strong growth in
fiscal 2008. Looking ahead, we will con-
tinue to build a stronger business base
to ensure stable earnings in the future as
well as to strive to grow further with
innovative ideas and action.
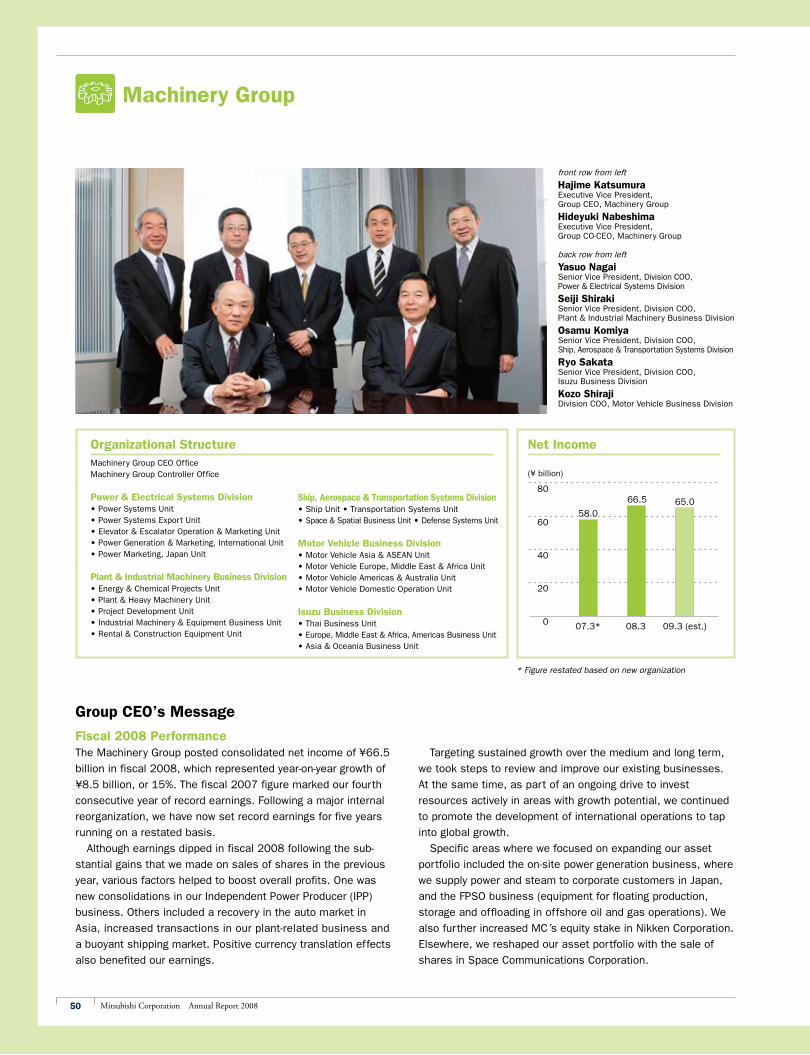
50 Mitsubishi Corporation Annual Report 2008
60
80
40
20
0 07.3* 08.3 09.3 (est.)
58.0
66.5 65.0
Machinery Group
Organizational StructureMachinery Group CEO OfficeMachinery Group Controller Office
Power & Electrical Systems Division• Power Systems Unit • Power Systems Export Unit • Elevator & Escalator Operation & Marketing Unit • Power Generation & Marketing, International Unit • Power Marketing, Japan Unit
Plant & Industrial Machinery Business Division• Energy & Chemical Projects Unit • Plant & Heavy Machinery Unit • Project Development Unit • Industrial Machinery & Equipment Business Unit • Rental & Construction Equipment Unit
Ship, Aerospace & Transportation Systems Division• Ship Unit • Transportation Systems Unit • Space & Spatial Business Unit • Defense Systems Unit
Motor Vehicle Business Division• Motor Vehicle Asia & ASEAN Unit • Motor Vehicle Europe, Middle East & Africa Unit • Motor Vehicle Americas & Australia Unit • Motor Vehicle Domestic Operation Unit
Isuzu Business Division• Thai Business Unit • Europe, Middle East & Africa, Americas Business Unit • Asia & Oceania Business Unit
Group CEO’s Message
Fiscal 2008 PerformanceThe Machinery Group posted consolidated net income of ¥66.5
billion in fiscal 2008, which represented year-on-year growth of
¥8.5 billion, or 15%. The fiscal 2007 figure marked our fourth
consecutive year of record earnings. Following a major internal
reorganization, we have now set record earnings for five years
running on a restated basis.
Although earnings dipped in fiscal 2008 following the sub-
stantial gains that we made on sales of shares in the previous
year, various factors helped to boost overall profits. One was
new consolidations in our Independent Power Producer (IPP)
business. Others included a recovery in the auto market in
Asia, increased transactions in our plant-related business and
a buoyant shipping market. Positive currency translation effects
also benefited our earnings.
Targeting sustained growth over the medium and long term,
we took steps to review and improve our existing businesses.
At the same time, as part of an ongoing drive to invest
resources actively in areas with growth potential, we continued
to promote the development of international operations to tap
into global growth.
Specific areas where we focused on expanding our asset
portfolio included the on-site power generation business, where
we supply power and steam to corporate customers in Japan,
and the FPSO business (equipment for floating production,
storage and offloading in offshore oil and gas operations). We
also further increased MC’s equity stake in Nikken Corporation.
Elsewhere, we reshaped our asset portfolio with the sale of
shares in Space Communications Corporation.
Net Income
(¥ billion)
* Figure restated based on new organization
front row from left
Hajime KatsumuraExecutive Vice President,Group CEO, Machinery Group
Hideyuki NabeshimaExecutive Vice President,Group CO-CEO, Machinery Group
back row from left
Yasuo NagaiSenior Vice President, Division COO, Power & Electrical Systems Division
Seiji ShirakiSenior Vice President, Division COO, Plant & Industrial Machinery Business Division
Osamu KomiyaSenior Vice President, Division COO, Ship, Aerospace & Transportation Systems Division
Ryo SakataSenior Vice President, Division COO, Isuzu Business Division
Kozo ShirajiDivision COO, Motor Vehicle Business Division
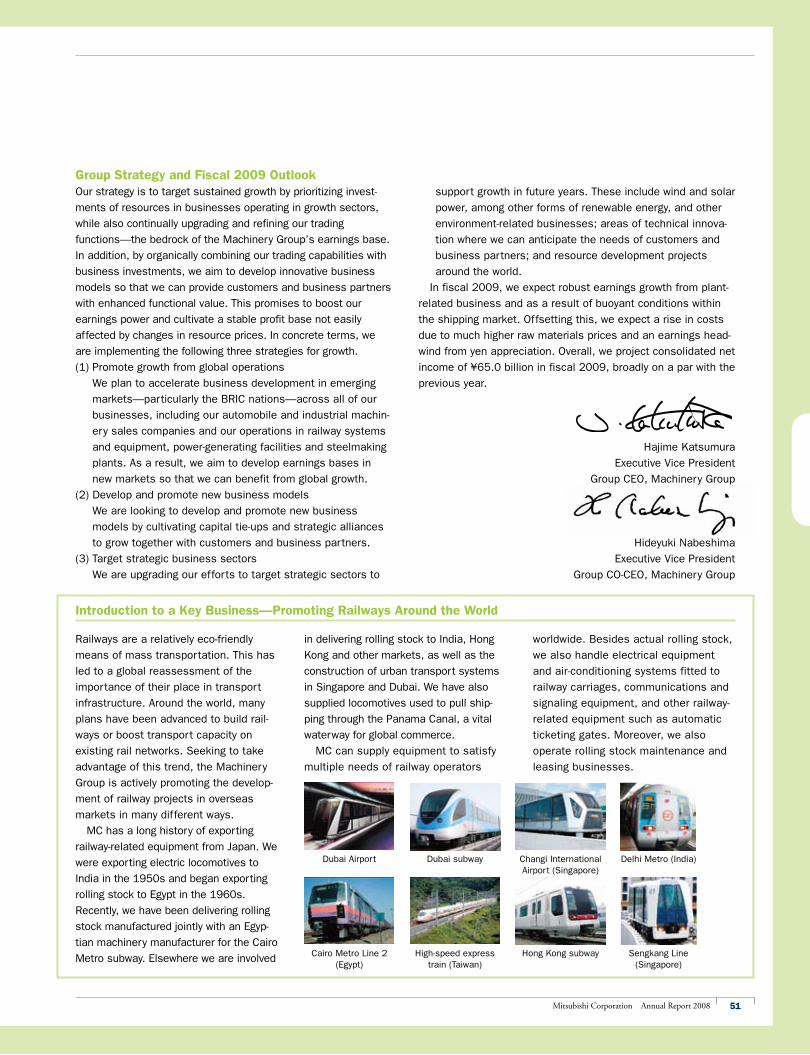
51Mitsubishi Corporation Annual Report 2008
Railways are a relatively eco-friendly
means of mass transportation. This has
led to a global reassessment of the
importance of their place in transport
infrastructure. Around the world, many
plans have been advanced to build rail-
ways or boost transport capacity on
existing rail networks. Seeking to take
advantage of this trend, the Machinery
Group is actively promoting the develop-
ment of railway projects in overseas
markets in many different ways.
MC has a long history of exporting
railway-related equipment from Japan. We
were exporting electric locomotives to
India in the 1950s and began exporting
rolling stock to Egypt in the 1960s.
Recently, we have been delivering rolling
stock manufactured jointly with an Egyp-
tian machinery manufacturer for the Cairo
Metro subway. Elsewhere we are involved
Introduction to a Key Business—Promoting Railways Around the World
in delivering rolling stock to India, Hong
Kong and other markets, as well as the
construction of urban transport systems
in Singapore and Dubai. We have also
supplied locomotives used to pull ship-
ping through the Panama Canal, a vital
waterway for global commerce.
MC can supply equipment to satisfy
multiple needs of railway operators
Group Strategy and Fiscal 2009 OutlookOur strategy is to target sustained growth by prioritizing invest-
ments of resources in businesses operating in growth sectors,
while also continually upgrading and refining our trading
functions—the bedrock of the Machinery Group’s earnings base.
In addition, by organically combining our trading capabilities with
business investments, we aim to develop innovative business
models so that we can provide customers and business partners
with enhanced functional value. This promises to boost our
earnings power and cultivate a stable profit base not easily
affected by changes in resource prices. In concrete terms, we
are implementing the following three strategies for growth.
(1) Promote growth from global operations
We plan to accelerate business development in emerging
markets—particularly the BRIC nations—across all of our
businesses, including our automobile and industrial machin-
ery sales companies and our operations in railway systems
and equipment, power-generating facilities and steelmaking
plants. As a result, we aim to develop earnings bases in
new markets so that we can benefit from global growth.
(2) Develop and promote new business models
We are looking to develop and promote new business
models by cultivating capital tie-ups and strategic alliances
to grow together with customers and business partners.
(3) Target strategic business sectors
We are upgrading our efforts to target strategic sectors to
support growth in future years. These include wind and solar
power, among other forms of renewable energy, and other
environment-related businesses; areas of technical innova-
tion where we can anticipate the needs of customers and
business partners; and resource development projects
around the world.
In fiscal 2009, we expect robust earnings growth from plant-
related business and as a result of buoyant conditions within
the shipping market. Offsetting this, we expect a rise in costs
due to much higher raw materials prices and an earnings head-
wind from yen appreciation. Overall, we project consolidated net
income of ¥65.0 billion in fiscal 2009, broadly on a par with the
previous year.
Hajime Katsumura
Executive Vice President
Group CEO, Machinery Group
Hideyuki Nabeshima
Executive Vice President
Group CO-CEO, Machinery Group
worldwide. Besides actual rolling stock,
we also handle electrical equipment
and air-conditioning systems fitted to
railway carriages, communications and
signaling equipment, and other railway-
related equipment such as automatic
ticketing gates. Moreover, we also
operate rolling stock maintenance and
leasing businesses.
Dubai Airport
Cairo Metro Line 2 (Egypt)
Dubai subway
High-speed express train (Taiwan)
Changi International Airport (Singapore)
Hong Kong subway
Delhi Metro (India)
Sengkang Line (Singapore)
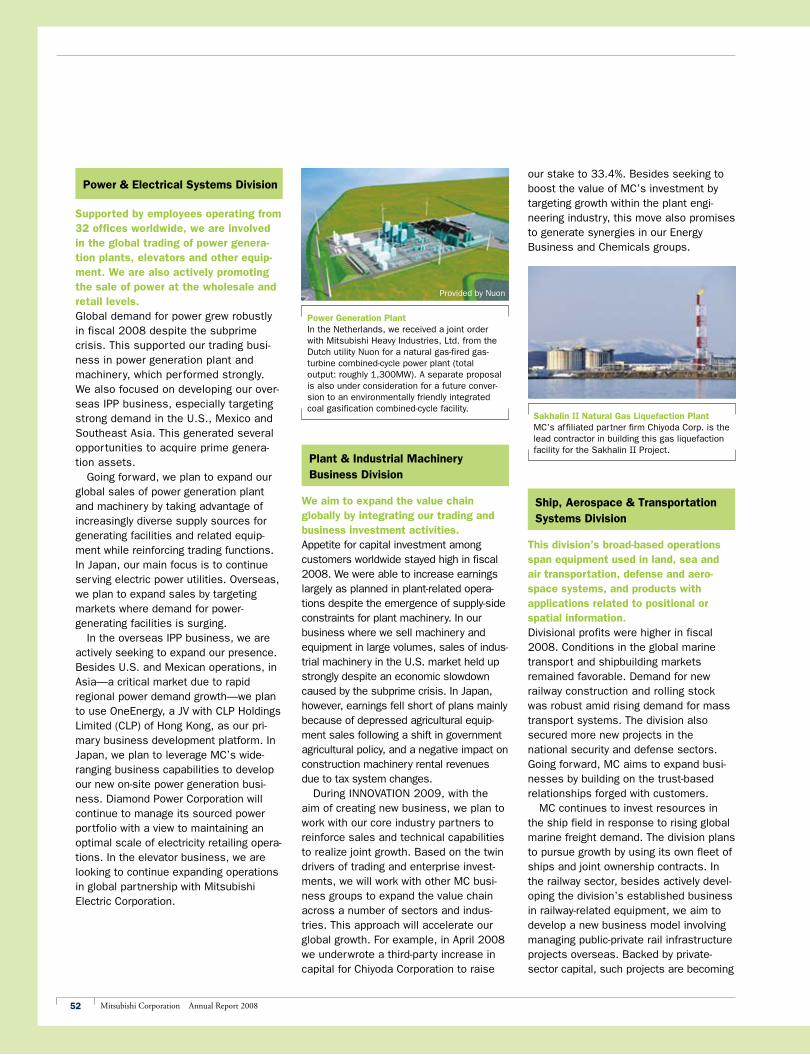
52 Mitsubishi Corporation Annual Report 2008
Power Generation Plant In the Netherlands, we received a joint order with Mitsubishi Heavy Industries, Ltd. from the Dutch utility Nuon for a natural gas-fired gas-turbine combined-cycle power plant (total output: roughly 1,300MW). A separate proposal is also under consideration for a future conver-sion to an environmentally friendly integrated coal gasification combined-cycle facility.
Sakhalin II Natural Gas Liquefaction PlantMC’s affiliated partner firm Chiyoda Corp. is the lead contractor in building this gas liquefaction facility for the Sakhalin II Project.
Power & Electrical Systems Division
Supported by employees operating from 32 offices worldwide, we are involved in the global trading of power genera-tion plants, elevators and other equip-ment. We are also actively promoting the sale of power at the wholesale and retail levels.Global demand for power grew robustly in fiscal 2008 despite the subprime crisis. This supported our trading busi-ness in power generation plant and machinery, which performed strongly. We also focused on developing our over-seas IPP business, especially targeting strong demand in the U.S., Mexico and Southeast Asia. This generated several opportunities to acquire prime genera-tion assets. Going forward, we plan to expand our global sales of power generation plant and machinery by taking advantage of increasingly diverse supply sources for generating facilities and related equip-ment while reinforcing trading functions. In Japan, our main focus is to continue serving electric power utilities. Overseas, we plan to expand sales by targeting markets where demand for power- generating facilities is surging. In the overseas IPP business, we are actively seeking to expand our presence. Besides U.S. and Mexican operations, in Asia—a critical market due to rapid regional power demand growth—we plan to use OneEnergy, a JV with CLP Holdings Limited (CLP) of Hong Kong, as our pri-mary business development platform. In Japan, we plan to leverage MC’s wide-ranging business capabilities to develop our new on-site power generation busi-ness. Diamond Power Corporation will continue to manage its sourced power portfolio with a view to maintaining an optimal scale of electricity retailing opera-tions. In the elevator business, we are looking to continue expanding operations in global partnership with Mitsubishi Electric Corporation.
Plant & Industrial Machinery Business Division
We aim to expand the value chain globally by integrating our trading and business investment activities.Appetite for capital investment among customers worldwide stayed high in fiscal 2008. We were able to increase earnings largely as planned in plant-related opera-tions despite the emergence of supply-side constraints for plant machinery. In our business where we sell machinery and equipment in large volumes, sales of indus-trial machinery in the U.S. market held up strongly despite an economic slowdown caused by the subprime crisis. In Japan, however, earnings fell short of plans mainly because of depressed agricultural equip-ment sales following a shift in government agricultural policy, and a negative impact on construction machinery rental revenues due to tax system changes. During INNOVATION 2009, with the aim of creating new business, we plan to work with our core industry partners to reinforce sales and technical capabilities to realize joint growth. Based on the twin drivers of trading and enterprise invest-ments, we will work with other MC busi-ness groups to expand the value chain across a number of sectors and indus-tries. This approach will accelerate our global growth. For example, in April 2008 we underwrote a third-party increase in capital for Chiyoda Corporation to raise
Provided by Nuon
our stake to 33.4%. Besides seeking to boost the value of MC’s investment by targeting growth within the plant engi-neering industry, this move also promises to generate synergies in our Energy Business and Chemicals groups.
Ship, Aerospace & Transportation Systems Division
This division’s broad-based operations span equipment used in land, sea and air transportation, defense and aero-space systems, and products with applications related to positional or spatial information.Divisional profits were higher in fiscal 2008. Conditions in the global marine transport and shipbuilding markets remained favorable. Demand for new railway construction and rolling stock was robust amid rising demand for mass transport systems. The division also secured more new projects in the national security and defense sectors. Going forward, MC aims to expand busi-nesses by building on the trust-based relationships forged with customers. MC continues to invest resources in the ship field in response to rising global marine freight demand. The division plans to pursue growth by using its own fleet of ships and joint ownership contracts. In the railway sector, besides actively devel-oping the division’s established business in railway-related equipment, we aim to develop a new business model involving managing public-private rail infrastructure projects overseas. Backed by private-sector capital, such projects are becoming
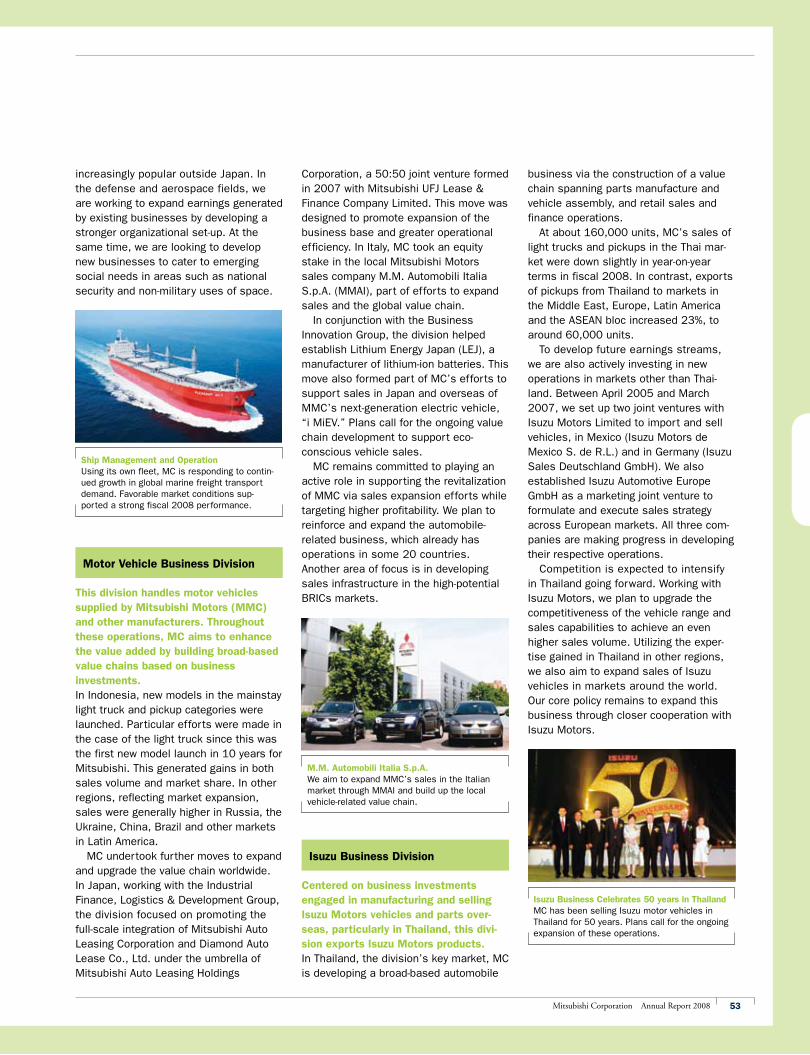
53Mitsubishi Corporation Annual Report 2008
Ship Management and OperationUsing its own fleet, MC is responding to contin-ued growth in global marine freight transport demand. Favorable market conditions sup-ported a strong fiscal 2008 performance.
M.M. Automobili Italia S.p.A. We aim to expand MMC’s sales in the Italian market through MMAI and build up the local vehicle-related value chain.
Isuzu Business Celebrates 50 years in ThailandMC has been selling Isuzu motor vehicles in Thailand for 50 years. Plans call for the ongoing expansion of these operations.
increasingly popular outside Japan. In the defense and aerospace fields, we are working to expand earnings generated by existing businesses by developing a stronger organizational set-up. At the same time, we are looking to develop new businesses to cater to emerging social needs in areas such as national security and non-military uses of space.
Motor Vehicle Business Division
This division handles motor vehicles supplied by Mitsubishi Motors (MMC) and other manufacturers. Throughout these operations, MC aims to enhance the value added by building broad-based value chains based on business investments.In Indonesia, new models in the mainstay light truck and pickup categories were launched. Particular efforts were made in the case of the light truck since this was the first new model launch in 10 years for Mitsubishi. This generated gains in both sales volume and market share. In other regions, reflecting market expansion, sales were generally higher in Russia, the Ukraine, China, Brazil and other markets in Latin America. MC undertook further moves to expand and upgrade the value chain worldwide. In Japan, working with the Industrial Finance, Logistics & Development Group, the division focused on promoting the full-scale integration of Mitsubishi Auto Leasing Corporation and Diamond Auto Lease Co., Ltd. under the umbrella of Mitsubishi Auto Leasing Holdings
Corporation, a 50:50 joint venture formed in 2007 with Mitsubishi UFJ Lease & Finance Company Limited. This move was designed to promote expansion of the business base and greater operational efficiency. In Italy, MC took an equity stake in the local Mitsubishi Motors sales company M.M. Automobili Italia S.p.A. (MMAI), part of efforts to expand sales and the global value chain. In conjunction with the Business Innovation Group, the division helped establish Lithium Energy Japan (LEJ), a manufacturer of lithium-ion batteries. This move also formed part of MC’s efforts to support sales in Japan and overseas of MMC’s next-generation electric vehicle, “i MiEV.” Plans call for the ongoing value chain development to support eco- conscious vehicle sales. MC remains committed to playing an active role in supporting the revitalization of MMC via sales expansion efforts while targeting higher profitability. We plan to reinforce and expand the automobile-related business, which already has operations in some 20 countries. Another area of focus is in developing sales infrastructure in the high-potential BRICs markets.
Isuzu Business Division
Centered on business investments engaged in manufacturing and selling Isuzu Motors vehicles and parts over-seas, particularly in Thailand, this divi-sion exports Isuzu Motors products.In Thailand, the division’s key market, MC is developing a broad-based automobile
business via the construction of a value chain spanning parts manufacture and vehicle assembly, and retail sales and finance operations. At about 160,000 units, MC’s sales of light trucks and pickups in the Thai mar-ket were down slightly in year-on-year terms in fiscal 2008. In contrast, exports of pickups from Thailand to markets in the Middle East, Europe, Latin America and the ASEAN bloc increased 23%, to around 60,000 units. To develop future earnings streams, we are also actively investing in new operations in markets other than Thai-land. Between April 2005 and March 2007, we set up two joint ventures with Isuzu Motors Limited to import and sell vehicles, in Mexico (Isuzu Motors de Mexico S. de R.L.) and in Germany (Isuzu Sales Deutschland GmbH). We also established Isuzu Automotive Europe GmbH as a marketing joint venture to formulate and execute sales strategy across European markets. All three com-panies are making progress in developing their respective operations. Competition is expected to intensify in Thailand going forward. Working with Isuzu Motors, we plan to upgrade the competitiveness of the vehicle range and sales capabilities to achieve an even higher sales volume. Utilizing the exper-tise gained in Thailand in other regions, we also aim to expand sales of Isuzu vehicles in markets around the world. Our core policy remains to expand this business through closer cooperation with Isuzu Motors.
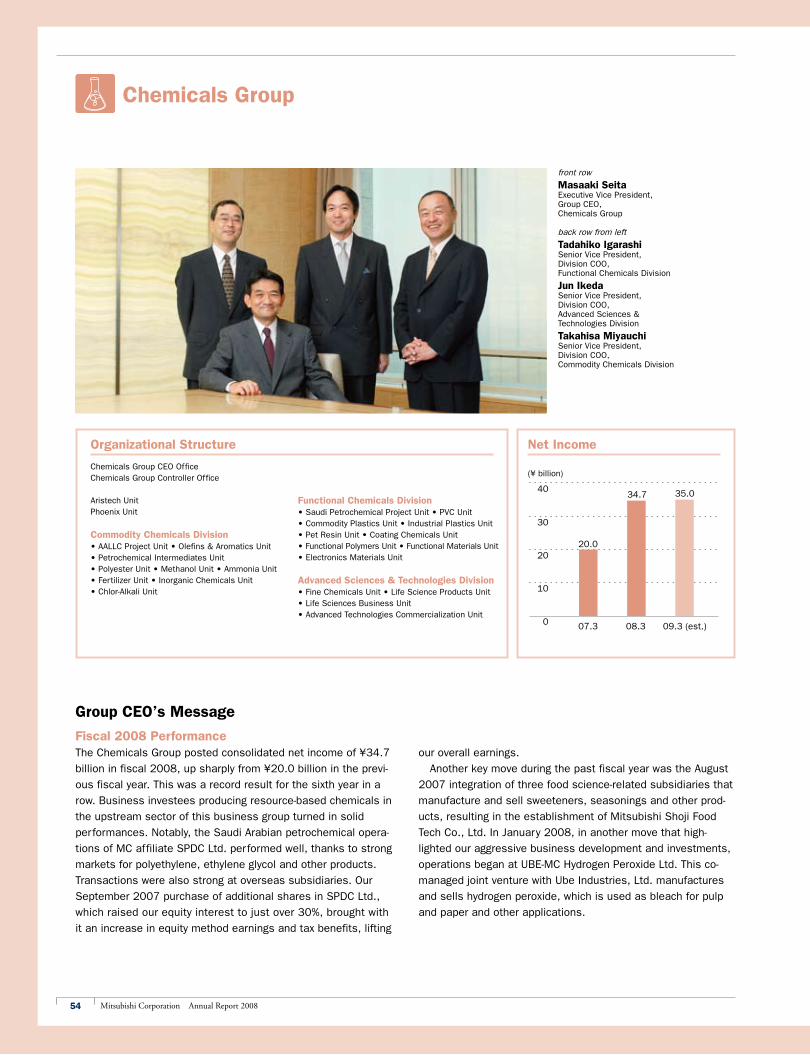
54 Mitsubishi Corporation Annual Report 2008
30
40
20
10
0 07.3 08.3 09.3 (est.)
20.0
34.7 35.0
Chemicals Group
front row
Masaaki SeitaExecutive Vice President, Group CEO, Chemicals Group
back row from left
Tadahiko IgarashiSenior Vice President, Division COO, Functional Chemicals Division
Jun IkedaSenior Vice President, Division COO, Advanced Sciences & Technologies Division
Takahisa MiyauchiSenior Vice President, Division COO, Commodity Chemicals Division
Organizational Structure
Chemicals Group CEO OfficeChemicals Group Controller Office
Aristech UnitPhoenix Unit
Commodity Chemicals Division• AALLC Project Unit • Olefins & Aromatics Unit • Petrochemical Intermediates Unit • Polyester Unit • Methanol Unit • Ammonia Unit • Fertilizer Unit • Inorganic Chemicals Unit • Chlor-Alkali Unit
Group CEO’s Message
Fiscal 2008 PerformanceThe Chemicals Group posted consolidated net income of ¥34.7
billion in fiscal 2008, up sharply from ¥20.0 billion in the previ-
ous fiscal year. This was a record result for the sixth year in a
row. Business investees producing resource-based chemicals in
the upstream sector of this business group turned in solid
performances. Notably, the Saudi Arabian petrochemical opera-
tions of MC affiliate SPDC Ltd. performed well, thanks to strong
markets for polyethylene, ethylene glycol and other products.
Transactions were also strong at overseas subsidiaries. Our
September 2007 purchase of additional shares in SPDC Ltd.,
which raised our equity interest to just over 30%, brought with
it an increase in equity method earnings and tax benefits, lifting
our overall earnings.
Another key move during the past fiscal year was the August
2007 integration of three food science-related subsidiaries that
manufacture and sell sweeteners, seasonings and other prod-
ucts, resulting in the establishment of Mitsubishi Shoji Food
Tech Co., Ltd. In January 2008, in another move that high-
lighted our aggressive business development and investments,
operations began at UBE-MC Hydrogen Peroxide Ltd. This co-
managed joint venture with Ube Industries, Ltd. manufactures
and sells hydrogen peroxide, which is used as bleach for pulp
and paper and other applications.
Net Income
(¥ billion)
Functional Chemicals Division• Saudi Petrochemical Project Unit • PVC Unit • Commodity Plastics Unit • Industrial Plastics Unit • Pet Resin Unit • Coating Chemicals Unit • Functional Polymers Unit • Functional Materials Unit • Electronics Materials Unit
Advanced Sciences & Technologies Division• Fine Chemicals Unit • Life Science Products Unit • Life Sciences Business Unit • Advanced Technologies Commercialization Unit
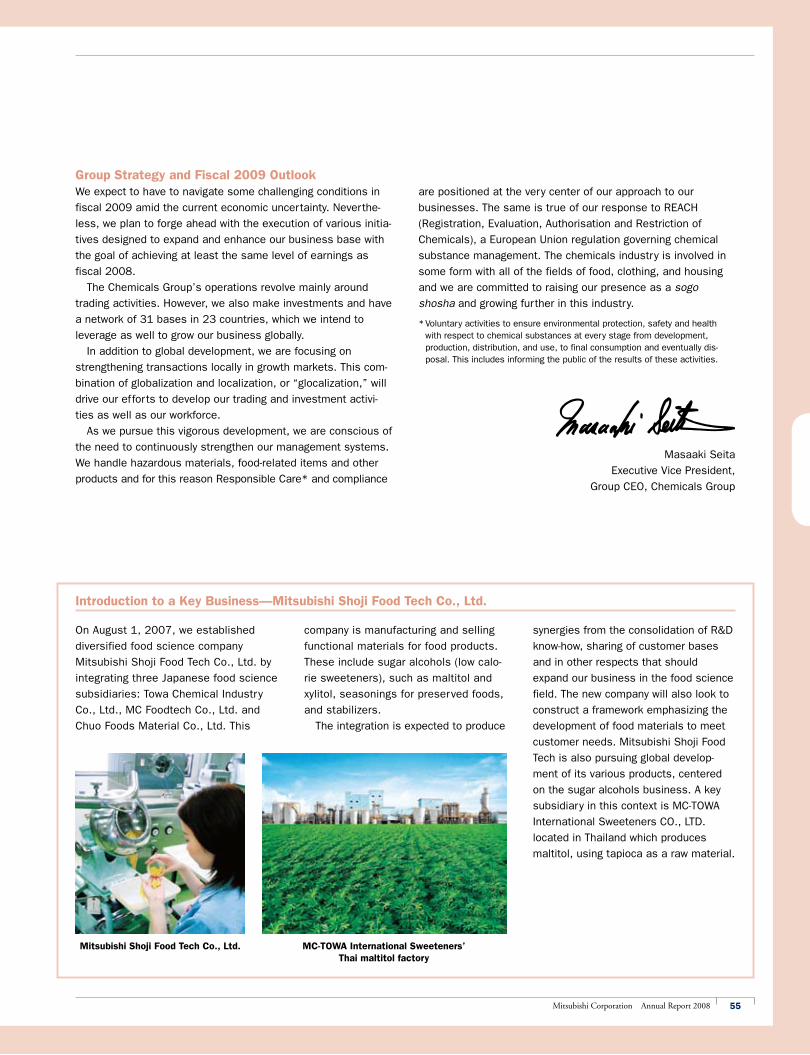
55Mitsubishi Corporation Annual Report 2008
On August 1, 2007, we established
diversified food science company
Mitsubishi Shoji Food Tech Co., Ltd. by
integrating three Japanese food science
subsidiaries: Towa Chemical Industry
Co., Ltd., MC Foodtech Co., Ltd. and
Chuo Foods Material Co., Ltd. This
Introduction to a Key Business—Mitsubishi Shoji Food Tech Co., Ltd.
company is manufacturing and selling
functional materials for food products.
These include sugar alcohols (low calo-
rie sweeteners), such as maltitol and
xylitol, seasonings for preserved foods,
and stabilizers.
The integration is expected to produce
MC-TOWA International Sweeteners’ Thai maltitol factory
Mitsubishi Shoji Food Tech Co., Ltd.
Group Strategy and Fiscal 2009 OutlookWe expect to have to navigate some challenging conditions in
fiscal 2009 amid the current economic uncertainty. Neverthe-
less, we plan to forge ahead with the execution of various initia-
tives designed to expand and enhance our business base with
the goal of achieving at least the same level of earnings as
fiscal 2008.
The Chemicals Group’s operations revolve mainly around
trading activities. However, we also make investments and have
a network of 31 bases in 23 countries, which we intend to
leverage as well to grow our business globally.
In addition to global development, we are focusing on
strengthening transactions locally in growth markets. This com-
bination of globalization and localization, or “glocalization,” will
drive our efforts to develop our trading and investment activi-
ties as well as our workforce.
As we pursue this vigorous development, we are conscious of
the need to continuously strengthen our management systems.
We handle hazardous materials, food-related items and other
products and for this reason Responsible Care* and compliance
are positioned at the very center of our approach to our
businesses. The same is true of our response to REACH
(Registration, Evaluation, Authorisation and Restriction of
Chemicals), a European Union regulation governing chemical
substance management. The chemicals industry is involved in
some form with all of the fields of food, clothing, and housing
and we are committed to raising our presence as a sogo
shosha and growing further in this industry.
* Voluntary activities to ensure environmental protection, safety and health with respect to chemical substances at every stage from development, production, distribution, and use, to final consumption and eventually dis-posal. This includes informing the public of the results of these activities.
Masaaki Seita
Executive Vice President,
Group CEO, Chemicals Group
synergies from the consolidation of R&D
know-how, sharing of customer bases
and in other respects that should
expand our business in the food science
field. The new company will also look to
construct a framework emphasizing the
development of food materials to meet
customer needs. Mitsubishi Shoji Food
Tech is also pursuing global develop-
ment of its various products, centered
on the sugar alcohols business. A key
subsidiary in this context is MC-TOWA
International Sweeteners CO., LTD.
located in Thailand which produces
maltitol, using tapioca as a raw material.
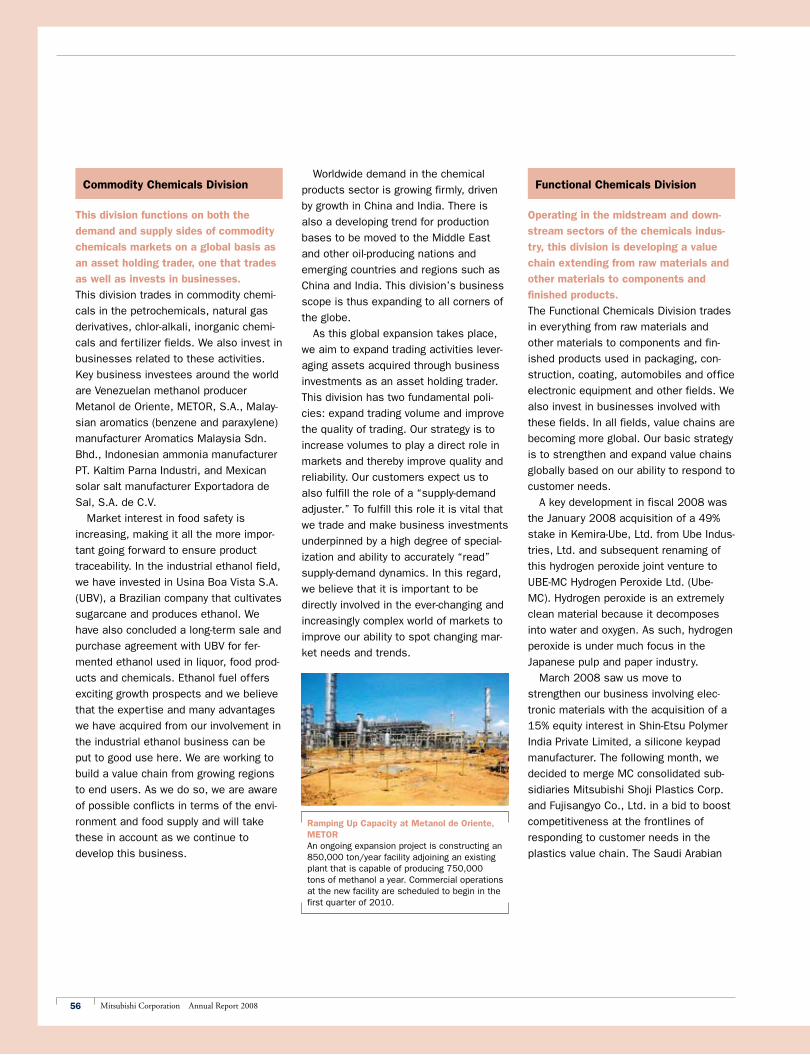
56 Mitsubishi Corporation Annual Report 2008
Ramping Up Capacity at Metanol de Oriente, METORAn ongoing expansion project is constructing an 850,000 ton/year facility adjoining an existing plant that is capable of producing 750,000 tons of methanol a year. Commercial operations at the new facility are scheduled to begin in the first quarter of 2010.
Commodity Chemicals Division
This division functions on both the
demand and supply sides of commodity
chemicals markets on a global basis as
an asset holding trader, one that trades
as well as invests in businesses.
This division trades in commodity chemi-
cals in the petrochemicals, natural gas
derivatives, chlor-alkali, inorganic chemi-
cals and fertilizer fields. We also invest in
businesses related to these activities.
Key business investees around the world
are Venezuelan methanol producer
Metanol de Oriente, METOR, S.A., Malay-
sian aromatics (benzene and paraxylene)
manufacturer Aromatics Malaysia Sdn.
Bhd., Indonesian ammonia manufacturer
PT. Kaltim Parna Industri, and Mexican
solar salt manufacturer Exportadora de
Sal, S.A. de C.V.
Market interest in food safety is
increasing, making it all the more impor-
tant going forward to ensure product
traceability. In the industrial ethanol field,
we have invested in Usina Boa Vista S.A.
(UBV), a Brazilian company that cultivates
sugarcane and produces ethanol. We
have also concluded a long-term sale and
purchase agreement with UBV for fer-
mented ethanol used in liquor, food prod-
ucts and chemicals. Ethanol fuel offers
exciting growth prospects and we believe
that the expertise and many advantages
we have acquired from our involvement in
the industrial ethanol business can be
put to good use here. We are working to
build a value chain from growing regions
to end users. As we do so, we are aware
of possible conflicts in terms of the envi-
ronment and food supply and will take
these in account as we continue to
develop this business.
Worldwide demand in the chemical
products sector is growing firmly, driven
by growth in China and India. There is
also a developing trend for production
bases to be moved to the Middle East
and other oil-producing nations and
emerging countries and regions such as
China and India. This division’s business
scope is thus expanding to all corners of
the globe.
As this global expansion takes place,
we aim to expand trading activities lever-
aging assets acquired through business
investments as an asset holding trader.
This division has two fundamental poli-
cies: expand trading volume and improve
the quality of trading. Our strategy is to
increase volumes to play a direct role in
markets and thereby improve quality and
reliability. Our customers expect us to
also fulfill the role of a “supply-demand
adjuster.” To fulfill this role it is vital that
we trade and make business investments
underpinned by a high degree of special-
ization and ability to accurately “read”
supply-demand dynamics. In this regard,
we believe that it is important to be
directly involved in the ever-changing and
increasingly complex world of markets to
improve our ability to spot changing mar-
ket needs and trends.
Functional Chemicals Division
Operating in the midstream and down-
stream sectors of the chemicals indus-
try, this division is developing a value
chain extending from raw materials and
other materials to components and
finished products.
The Functional Chemicals Division trades
in everything from raw materials and
other materials to components and fin-
ished products used in packaging, con-
struction, coating, automobiles and office
electronic equipment and other fields. We
also invest in businesses involved with
these fields. In all fields, value chains are
becoming more global. Our basic strategy
is to strengthen and expand value chains
globally based on our ability to respond to
customer needs.
A key development in fiscal 2008 was
the January 2008 acquisition of a 49%
stake in Kemira-Ube, Ltd. from Ube Indus-
tries, Ltd. and subsequent renaming of
this hydrogen peroxide joint venture to
UBE-MC Hydrogen Peroxide Ltd. (Ube-
MC). Hydrogen peroxide is an extremely
clean material because it decomposes
into water and oxygen. As such, hydrogen
peroxide is under much focus in the
Japanese pulp and paper industry.
March 2008 saw us move to
strengthen our business involving elec-
tronic materials with the acquisition of a
15% equity interest in Shin-Etsu Polymer
India Private Limited, a silicone keypad
manufacturer. The following month, we
decided to merge MC consolidated sub-
sidiaries Mitsubishi Shoji Plastics Corp.
and Fujisangyo Co., Ltd. in a bid to boost
competitiveness at the frontlines of
responding to customer needs in the
plastics value chain. The Saudi Arabian
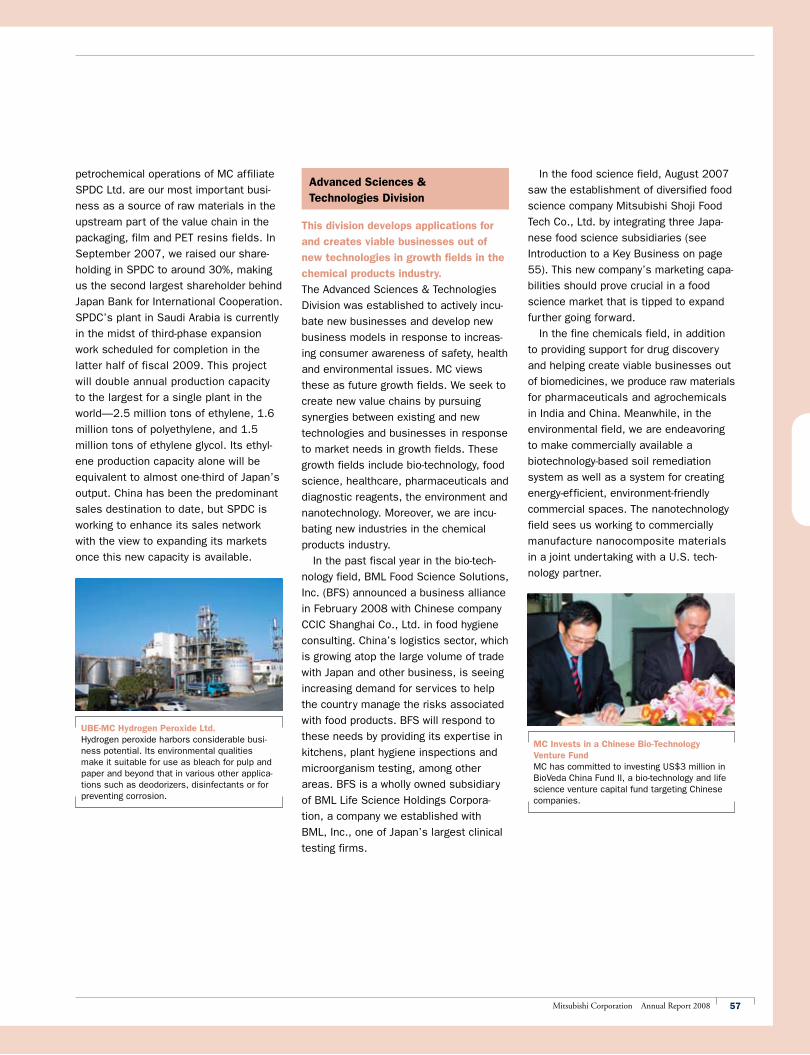
57Mitsubishi Corporation Annual Report 2008
UBE-MC Hydrogen Peroxide Ltd.Hydrogen peroxide harbors considerable busi-ness potential. Its environmental qualities make it suitable for use as bleach for pulp and paper and beyond that in various other applica-tions such as deodorizers, disinfectants or for preventing corrosion.
MC Invests in a Chinese Bio-Technology Venture FundMC has committed to investing US$3 million in BioVeda China Fund II, a bio-technology and life science venture capital fund targeting Chinese companies.
petrochemical operations of MC affiliate
SPDC Ltd. are our most important busi-
ness as a source of raw materials in the
upstream part of the value chain in the
packaging, film and PET resins fields. In
September 2007, we raised our share-
holding in SPDC to around 30%, making
us the second largest shareholder behind
Japan Bank for International Cooperation.
SPDC’s plant in Saudi Arabia is currently
in the midst of third-phase expansion
work scheduled for completion in the
latter half of fiscal 2009. This project
will double annual production capacity
to the largest for a single plant in the
world—2.5 million tons of ethylene, 1.6
million tons of polyethylene, and 1.5
million tons of ethylene glycol. Its ethyl-
ene production capacity alone will be
equivalent to almost one-third of Japan’s
output. China has been the predominant
sales destination to date, but SPDC is
working to enhance its sales network
with the view to expanding its markets
once this new capacity is available.
Advanced Sciences & Technologies Division
This division develops applications for
and creates viable businesses out of
new technologies in growth fields in the
chemical products industry.
The Advanced Sciences & Technologies
Division was established to actively incu-
bate new businesses and develop new
business models in response to increas-
ing consumer awareness of safety, health
and environmental issues. MC views
these as future growth fields. We seek to
create new value chains by pursuing
synergies between existing and new
technologies and businesses in response
to market needs in growth fields. These
growth fields include bio-technology, food
science, healthcare, pharmaceuticals and
diagnostic reagents, the environment and
nanotechnology. Moreover, we are incu-
bating new industries in the chemical
products industry.
In the past fiscal year in the bio-tech-
nology field, BML Food Science Solutions,
Inc. (BFS) announced a business alliance
in February 2008 with Chinese company
CCIC Shanghai Co., Ltd. in food hygiene
consulting. China’s logistics sector, which
is growing atop the large volume of trade
with Japan and other business, is seeing
increasing demand for services to help
the country manage the risks associated
with food products. BFS will respond to
these needs by providing its expertise in
kitchens, plant hygiene inspections and
microorganism testing, among other
areas. BFS is a wholly owned subsidiary
of BML Life Science Holdings Corpora-
tion, a company we established with
BML, Inc., one of Japan’s largest clinical
testing firms.
In the food science field, August 2007
saw the establishment of diversified food
science company Mitsubishi Shoji Food
Tech Co., Ltd. by integrating three Japa-
nese food science subsidiaries (see
Introduction to a Key Business on page
55). This new company’s marketing capa-
bilities should prove crucial in a food
science market that is tipped to expand
further going forward.
In the fine chemicals field, in addition
to providing support for drug discovery
and helping create viable businesses out
of biomedicines, we produce raw materials
for pharmaceuticals and agrochemicals
in India and China. Meanwhile, in the
environmental field, we are endeavoring
to make commercially available a
biotechnology-based soil remediation
system as well as a system for creating
energy-efficient, environment-friendly
commercial spaces. The nanotechnology
field sees us working to commercially
manufacture nanocomposite materials
in a joint undertaking with a U.S. tech-
nology partner.
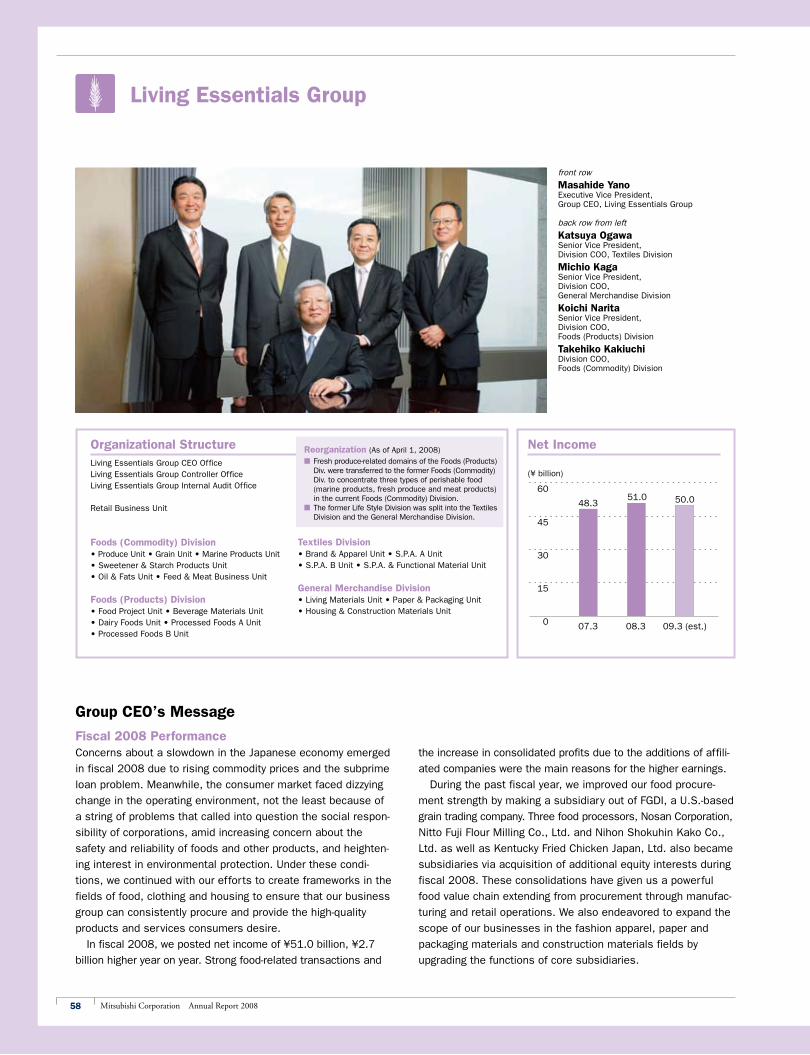
58 Mitsubishi Corporation Annual Report 2008
45
60
30
15
0 07.3 08.3 09.3 (est.)
48.351.0 50.0
Living Essentials Group
front row
Masahide YanoExecutive Vice President,Group CEO, Living Essentials Group
back row from left
Katsuya OgawaSenior Vice President,Division COO, Textiles Division
Michio Kaga Senior Vice President,Division COO, General Merchandise Division
Koichi Narita Senior Vice President,Division COO, Foods (Products) Division
Takehiko Kakiuchi Division COO, Foods (Commodity) Division
Organizational StructureLiving Essentials Group CEO OfficeLiving Essentials Group Controller OfficeLiving Essentials Group Internal Audit Office
Retail Business Unit
Foods (Commodity) Division• Produce Unit • Grain Unit • Marine Products Unit • Sweetener & Starch Products Unit • Oil & Fats Unit • Feed & Meat Business Unit
Foods (Products) Division• Food Project Unit • Beverage Materials Unit • Dairy Foods Unit • Processed Foods A Unit • Processed Foods B Unit
Textiles Division• Brand & Apparel Unit • S.P.A. A Unit • S.P.A. B Unit • S.P.A. & Functional Material Unit
General Merchandise Division• Living Materials Unit • Paper & Packaging Unit • Housing & Construction Materials Unit
Group CEO’s Message
Fiscal 2008 PerformanceConcerns about a slowdown in the Japanese economy emerged
in fiscal 2008 due to rising commodity prices and the subprime
loan problem. Meanwhile, the consumer market faced dizzying
change in the operating environment, not the least because of
a string of problems that called into question the social respon-
sibility of corporations, amid increasing concern about the
safety and reliability of foods and other products, and heighten-
ing interest in environmental protection. Under these condi-
tions, we continued with our efforts to create frameworks in the
fields of food, clothing and housing to ensure that our business
group can consistently procure and provide the high-quality
products and services consumers desire.
In fiscal 2008, we posted net income of ¥51.0 billion, ¥2.7
billion higher year on year. Strong food-related transactions and
the increase in consolidated profits due to the additions of affili-
ated companies were the main reasons for the higher earnings.
During the past fiscal year, we improved our food procure-
ment strength by making a subsidiary out of FGDI, a U.S.-based
grain trading company. Three food processors, Nosan Corporation,
Nitto Fuji Flour Milling Co., Ltd. and Nihon Shokuhin Kako Co.,
Ltd. as well as Kentucky Fried Chicken Japan, Ltd. also became
subsidiaries via acquisition of additional equity interests during
fiscal 2008. These consolidations have given us a powerful
food value chain extending from procurement through manufac-
turing and retail operations. We also endeavored to expand the
scope of our businesses in the fashion apparel, paper and
packaging materials and construction materials fields by
upgrading the functions of core subsidiaries.
Net Income
(¥ billion)
Reorganization (As of April 1, 2008)
n Fresh produce-related domains of the Foods (Products) Div. were transferred to the former Foods (Commodity) Div. to concentrate three types of perishable food (marine products, fresh produce and meat products) in the current Foods (Commodity) Division.
n The former Life Style Division was split into the Textiles Division and the General Merchandise Division.
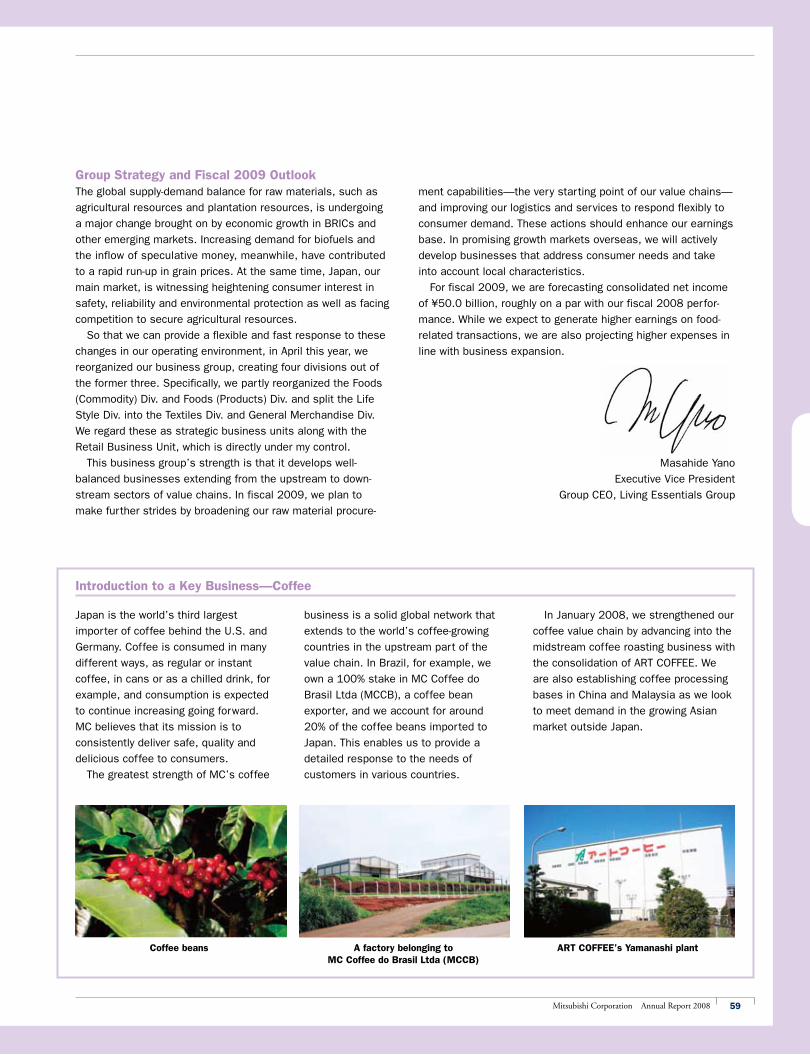
59Mitsubishi Corporation Annual Report 2008
Japan is the world’s third largest
importer of coffee behind the U.S. and
Germany. Coffee is consumed in many
different ways, as regular or instant
coffee, in cans or as a chilled drink, for
example, and consumption is expected
to continue increasing going forward.
MC believes that its mission is to
consistently deliver safe, quality and
delicious coffee to consumers.
The greatest strength of MC’s coffee
Introduction to a Key Business—Coffee
business is a solid global network that
extends to the world’s coffee-growing
countries in the upstream part of the
value chain. In Brazil, for example, we
own a 100% stake in MC Coffee do
Brasil Ltda (MCCB), a coffee bean
exporter, and we account for around
20% of the coffee beans imported to
Japan. This enables us to provide a
detailed response to the needs of
customers in various countries.
Group Strategy and Fiscal 2009 Outlook The global supply-demand balance for raw materials, such as
agricultural resources and plantation resources, is undergoing
a major change brought on by economic growth in BRICs and
other emerging markets. Increasing demand for biofuels and
the inflow of speculative money, meanwhile, have contributed
to a rapid run-up in grain prices. At the same time, Japan, our
main market, is witnessing heightening consumer interest in
safety, reliability and environmental protection as well as facing
competition to secure agricultural resources.
So that we can provide a flexible and fast response to these
changes in our operating environment, in April this year, we
reorganized our business group, creating four divisions out of
the former three. Specifically, we partly reorganized the Foods
(Commodity) Div. and Foods (Products) Div. and split the Life
Style Div. into the Textiles Div. and General Merchandise Div.
We regard these as strategic business units along with the
Retail Business Unit, which is directly under my control.
This business group’s strength is that it develops well-
balanced businesses extending from the upstream to down-
stream sectors of value chains. In fiscal 2009, we plan to
make further strides by broadening our raw material procure-
ment capabilities—the very starting point of our value chains—
and improving our logistics and services to respond flexibly to
consumer demand. These actions should enhance our earnings
base. In promising growth markets overseas, we will actively
develop businesses that address consumer needs and take
into account local characteristics.
For fiscal 2009, we are forecasting consolidated net income
of ¥50.0 billion, roughly on a par with our fiscal 2008 perfor-
mance. While we expect to generate higher earnings on food-
related transactions, we are also projecting higher expenses in
line with business expansion.
Masahide Yano
Executive Vice President
Group CEO, Living Essentials Group
In January 2008, we strengthened our
coffee value chain by advancing into the
midstream coffee roasting business with
the consolidation of ART COFFEE. We
are also establishing coffee processing
bases in China and Malaysia as we look
to meet demand in the growing Asian
market outside Japan.
A factory belonging to MC Coffee do Brasil Ltda (MCCB)
ART COFFEE’s Yamanashi plantCoffee beans

60 Mitsubishi Corporation Annual Report 2008
FGDI The U.S. is one of the world’s major exporters of grains. During fiscal 2008, we raised our shareholding in grain handling and sales com-pany FGDI to 75%, thereby upgrading our grain handling capability.
Kirin MC Danone Waters Co., Ltd.This MC Group company is supporting activities to supply clean and safe drinking water in the Republic of Mali as part of the “Volvic 1L for 10L” program being run by France’s Danone Group and UNICEF.
Foods (Commodity) Division
This division handles grains, fresh pro-duce, marine products, meat and other products and is working to develop value chains centered on sectors from the procurement of food raw materials to processing and distribution. The Foods (Commodity) Division took steps during fiscal 2008 to strengthen its integrated value chain, extending from the collection and handling of raw materi-als at farms to transportation, processing and distribution of products, as soaring prices of grains such as wheat and other raw materials grabbed everyone’s atten-tion. In June 2007, we made FGDI, a U.S.-based grain handling and sales company, a subsidiary in a bid to expand our U.S. grain handling and import opera-tions. In Japan in April 2007, we became the leading shareholder of Yonekyu Co., Ltd. by purchasing additional shares in this company. The following June, we conducted tender offers for three compa-nies that manufacture wheat flour, starch and animal feed, Nitto Fuji Flour Milling Co., Ltd., Nihon Shokuhin Kako Co., Ltd. and Nosan Corporation, respectively. These moves have strengthened our busi-ness base in raw materials processing. This division’s strategy going forward is to broaden and strengthen the value chain in Japan and abroad. Under this strategy, we will further strengthen our processing businesses by enhancing our structures for managing group companies. Moreover, with food supplies expected to stay tight worldwide, we will work to
secure stable supplies by strengthening procurement capabilities in key growing regions like the U.S. and expanding pro-curement sources. And we will continue to target the growing Asian market out-side Japan.
Foods (Products) Division
This division has an expansive network in Japan and overseas, extending from the procurement of food raw materials to product sales. This network allows us to meet diverse consumer needs.The food industry experienced a harsh operating environment in fiscal 2008, characterized by contracting demand in Japan as the country’s population declines and ages, and soaring raw mate-rials prices fueled by rapidly expanding global demand. This division, however, turned in a strong performance, thanks in particular to dairy product and marine produce-related transactions. Actions such as the acquisition of ART COFFEE, a coffee roasting and sales company, also boosted our processing capabilities as we made steady progress implementing our strategy. Our operating environment will continue to experience major change going for-ward. The supply-demand balance is changing, companies must step up their response to safety and reliability con-cerns, and consumer interest in environ-mental issues is rising. This division is determined to address these and other changes reshaping its operating environ-ment. We will strive to sustain our growth by strengthening our value chains while meeting customers’ multifarious needs. Procuring food raw materials from over-seas, in particular, is important as sup-plies are expected to tighten. With the aim of securing a stable and continuous supply of raw materials, we plan to expand supply sources of coffee, cocoa, juice, and dairy products, as well as deepen relationships with existing pro-curement bases. We will also continue to
support our domestic food wholesale-
related subsidiaries such as RYOSHOKU LIMITED and Meidi-ya Corporation as well as U.K. food manufacturing subsidiary Princes Limited in their efforts to broaden efficient distribution channels in con-sumer markets.
Textiles Division
From lifestyle-related products like clothes to raw materials, textile materi-als and high-function materials, this division provides wide-ranging products and comprehensive services worldwide.
This division handles not only lifestyle-
related products such as fashion apparel,
shoes, furniture and household goods but
also fiber, yarn, fabrics and high-function
materials like optical fiber. Its goal is to
be an organization capable of responding
flexibly and quickly to industry trends.
Fiscal 2008 was a challenging year for
the apparel industry in Japan as a whole
as the market saw major change. Some of
the challenges included unseasonable
weather, soaring raw materials prices and
growing risk surrounding China. Under
these conditions, we sought to raise cus-
tomer satisfaction by providing comprehen-
sive support, including introducing new
fashion brands and new business models
and supporting customers’ overseas busi-
nesses, centered on the OEM business,
which is a core business of this division.
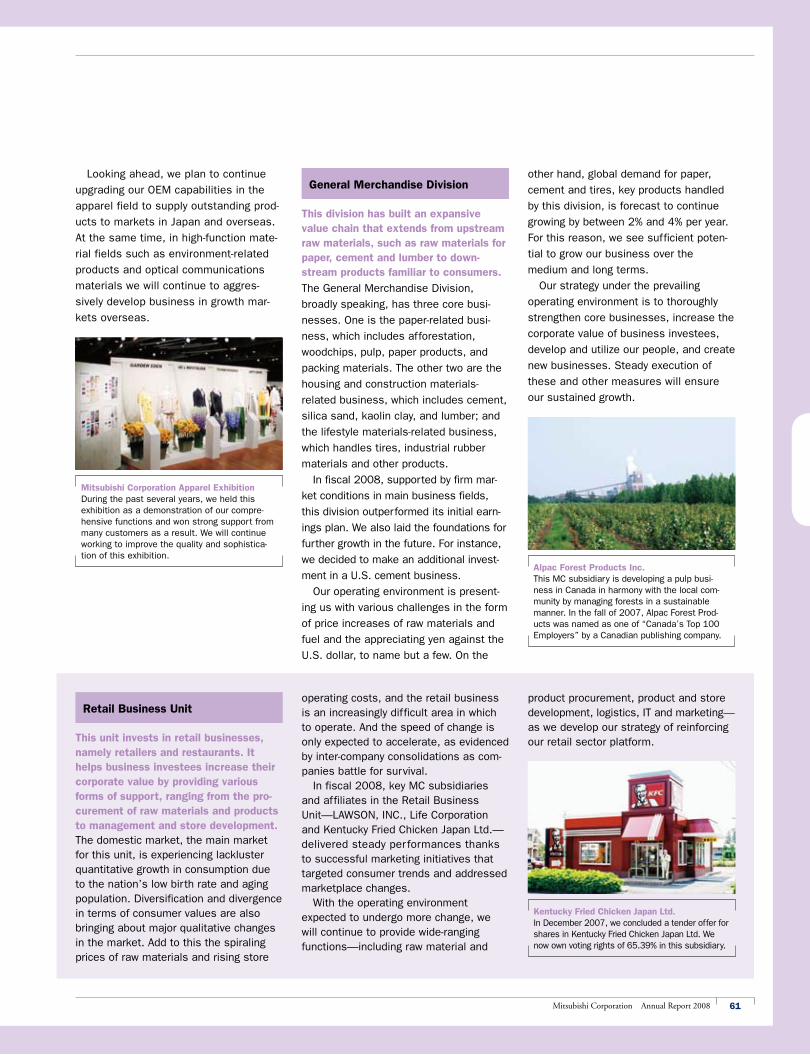
61Mitsubishi Corporation Annual Report 2008
Mitsubishi Corporation Apparel ExhibitionDuring the past several years, we held this exhibition as a demonstration of our compre-hensive functions and won strong support from many customers as a result. We will continue working to improve the quality and sophistica-tion of this exhibition.
Alpac Forest Products Inc.This MC subsidiary is developing a pulp busi-ness in Canada in harmony with the local com-munity by managing forests in a sustainable manner. In the fall of 2007, Alpac Forest Prod-ucts was named as one of “Canada’s Top 100 Employers” by a Canadian publishing company.
Kentucky Fried Chicken Japan Ltd.In December 2007, we concluded a tender offer for shares in Kentucky Fried Chicken Japan Ltd. We now own voting rights of 65.39% in this subsidiary.
Looking ahead, we plan to continue
upgrading our OEM capabilities in the
apparel field to supply outstanding prod-
ucts to markets in Japan and overseas.
At the same time, in high-function mate-
rial fields such as environment-related
products and optical communications
materials we will continue to aggres-
sively develop business in growth mar-
kets overseas.
other hand, global demand for paper,
cement and tires, key products handled
by this division, is forecast to continue
growing by between 2% and 4% per year.
For this reason, we see sufficient poten-
tial to grow our business over the
medium and long terms.
Our strategy under the prevailing
operating environment is to thoroughly
strengthen core businesses, increase the
corporate value of business investees,
develop and utilize our people, and create
new businesses. Steady execution of
these and other measures will ensure
our sustained growth.
Retail Business Unit
This unit invests in retail businesses, namely retailers and restaurants. It helps business investees increase their corporate value by providing various forms of support, ranging from the pro-curement of raw materials and products to management and store development.The domestic market, the main market for this unit, is experiencing lackluster quantitative growth in consumption due to the nation’s low birth rate and aging population. Diversification and divergence in terms of consumer values are also bringing about major qualitative changes in the market. Add to this the spiraling prices of raw materials and rising store
General Merchandise Division
This division has built an expansive value chain that extends from upstream raw materials, such as raw materials for paper, cement and lumber to down-stream products familiar to consumers.
The General Merchandise Division,
broadly speaking, has three core busi-
nesses. One is the paper-related busi-
ness, which includes afforestation,
woodchips, pulp, paper products, and
packing materials. The other two are the
housing and construction materials-
related business, which includes cement,
silica sand, kaolin clay, and lumber; and
the lifestyle materials-related business,
which handles tires, industrial rubber
materials and other products.
In fiscal 2008, supported by firm mar-
ket conditions in main business fields,
this division outperformed its initial earn-
ings plan. We also laid the foundations for
further growth in the future. For instance,
we decided to make an additional invest-
ment in a U.S. cement business.
Our operating environment is present-
ing us with various challenges in the form
of price increases of raw materials and
fuel and the appreciating yen against the
U.S. dollar, to name but a few. On the
operating costs, and the retail business is an increasingly difficult area in which to operate. And the speed of change is only expected to accelerate, as evidenced by inter-company consolidations as com-panies battle for survival. In fiscal 2008, key MC subsidiaries and affiliates in the Retail Business Unit— LAWSON, INC., Life Corporation and Kentucky Fried Chicken Japan Ltd.— delivered steady per formances thanks to successful marketing initiatives that targeted consumer trends and addressed marketplace changes. With the operating environment expected to undergo more change, we will continue to provide wide-ranging functions—including raw material and
product procurement, product and store development, logistics, IT and marketing—as we develop our strategy of reinforcing our retail sector platform.
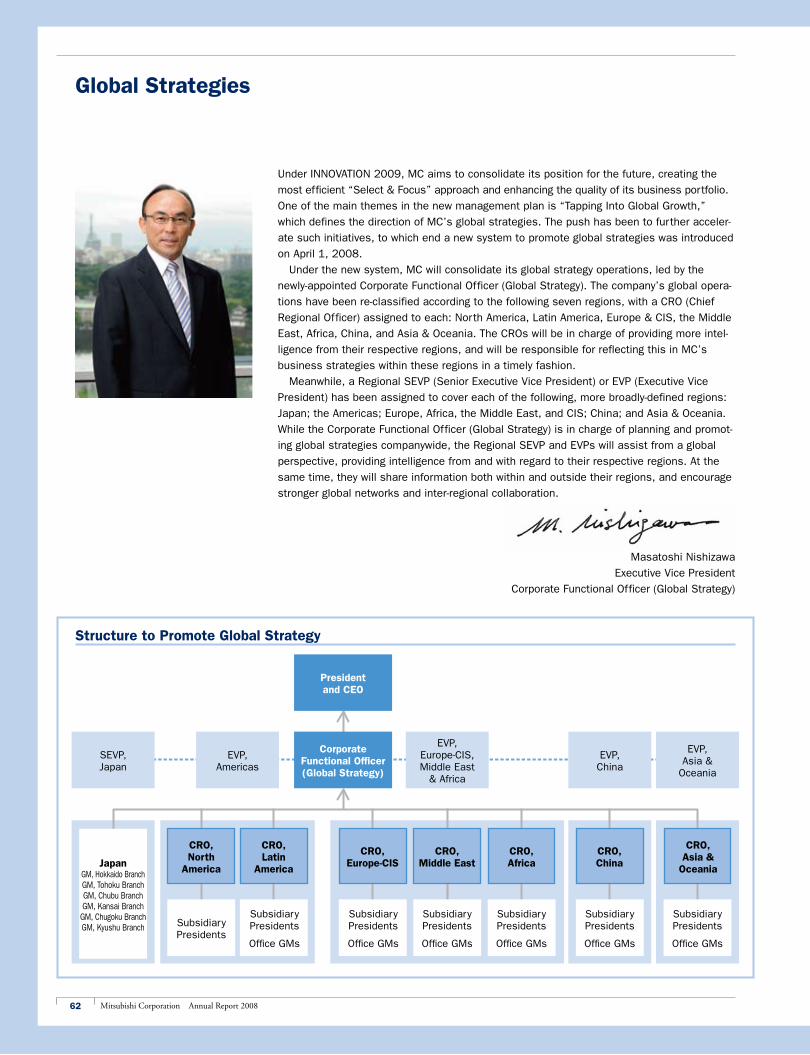
62 Mitsubishi Corporation Annual Report 2008
Under INNOVATION 2009, MC aims to consolidate its position for the future, creating the
most efficient “Select & Focus” approach and enhancing the quality of its business portfolio.
One of the main themes in the new management plan is “Tapping Into Global Growth,”
which defines the direction of MC’s global strategies. The push has been to further acceler-
ate such initiatives, to which end a new system to promote global strategies was introduced
on April 1, 2008.
Under the new system, MC will consolidate its global strategy operations, led by the
newly-appointed Corporate Functional Officer (Global Strategy). The company’s global opera-
tions have been re-classified according to the following seven regions, with a CRO (Chief
Regional Officer) assigned to each: North America, Latin America, Europe & CIS, the Middle
East, Africa, China, and Asia & Oceania. The CROs will be in charge of providing more intel-
ligence from their respective regions, and will be responsible for reflecting this in MC’s
business strategies within these regions in a timely fashion.
Meanwhile, a Regional SEVP (Senior Executive Vice President) or EVP (Executive Vice
President) has been assigned to cover each of the following, more broadly-defined regions:
Japan; the Americas; Europe, Africa, the Middle East, and CIS; China; and Asia & Oceania.
While the Corporate Functional Officer (Global Strategy) is in charge of planning and promot-
ing global strategies companywide, the Regional SEVP and EVPs will assist from a global
perspective, providing intelligence from and with regard to their respective regions. At the
same time, they will share information both within and outside their regions, and encourage
stronger global networks and inter-regional collaboration.
Masatoshi Nishizawa
Executive Vice President
Corporate Functional Officer (Global Strategy)
Global Strategies
JapanGM, Hokkaido BranchGM, Tohoku BranchGM, Chubu BranchGM, Kansai Branch
GM, Chugoku BranchGM, Kyushu Branch Subsidiary
Presidents
CRO, North
America
President and CEO
SEVP, Japan
Structure to Promote Global Strategy
Corporate Functional Officer (Global Strategy)
EVP, Americas
EVP, Europe-CIS, Middle East
& Africa
EVP, China
EVP, Asia &
Oceania
CRO, Latin
America
CRO, Europe-CIS
CRO, Middle East
CRO, Africa
CRO, China
CRO, Asia &
Oceania
Subsidiary Presidents
Office GMs
Subsidiary Presidents
Office GMs
Subsidiary Presidents
Office GMs
Subsidiary Presidents
Office GMs
Subsidiary Presidents
Office GMs
Subsidiary Presidents
Office GMs
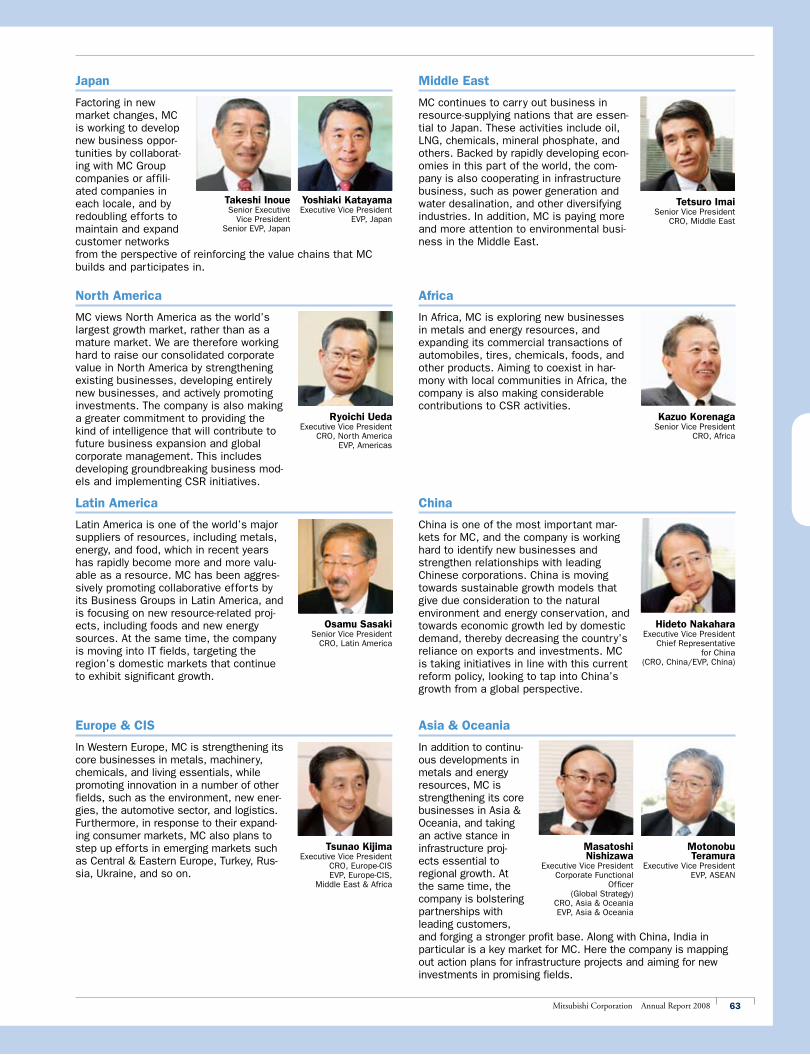
63Mitsubishi Corporation Annual Report 2008
MC views North America as the world’s largest growth market, rather than as a mature market. We are therefore working hard to raise our consolidated corporate value in North America by strengthening existing businesses, developing entirely new businesses, and actively promoting investments. The company is also making a greater commitment to providing the kind of intelligence that will contribute to future business expansion and global corporate management. This includes developing groundbreaking business mod-els and implementing CSR initiatives.
In Africa, MC is exploring new businesses in metals and energy resources, and expanding its commercial transactions of automobiles, tires, chemicals, foods, and other products. Aiming to coexist in har-mony with local communities in Africa, the company is also making considerable contributions to CSR activities.
Latin America is one of the world’s major suppliers of resources, including metals, energy, and food, which in recent years has rapidly become more and more valu-able as a resource. MC has been aggres-sively promoting collaborative efforts by its Business Groups in Latin America, and is focusing on new resource-related proj-ects, including foods and new energy sources. At the same time, the company is moving into IT fields, targeting the region’s domestic markets that continue to exhibit significant growth.
China is one of the most important mar-kets for MC, and the company is working hard to identify new businesses and strengthen relationships with leading Chinese corporations. China is moving towards sustainable growth models that give due consideration to the natural environment and energy conservation, and towards economic growth led by domestic demand, thereby decreasing the country’s reliance on exports and investments. MC is taking initiatives in line with this current reform policy, looking to tap into China’s growth from a global perspective.
In Western Europe, MC is strengthening its core businesses in metals, machinery, chemicals, and living essentials, while promoting innovation in a number of other fields, such as the environment, new ener-gies, the automotive sector, and logistics. Furthermore, in response to their expand-ing consumer markets, MC also plans to step up efforts in emerging markets such as Central & Eastern Europe, Turkey, Rus-sia, Ukraine, and so on.
In addition to continu-ous developments in metals and energy resources, MC is strengthening its core businesses in Asia & Oceania, and taking an active stance in infrastructure proj-ects essential to regional growth. At the same time, the company is bolstering partnerships with leading customers, and forging a stronger profit base. Along with China, India in particular is a key market for MC. Here the company is mapping out action plans for infrastructure projects and aiming for new investments in promising fields.
MC continues to carry out business in resource-supplying nations that are essen-tial to Japan. These activities include oil, LNG, chemicals, mineral phosphate, and others. Backed by rapidly developing econ-omies in this part of the world, the com-pany is also cooperating in infrastructure business, such as power generation and water desalination, and other diversifying industries. In addition, MC is paying more and more attention to environmental busi-ness in the Middle East.
Factoring in new market changes, MC is working to develop new business oppor-tunities by collaborat-ing with MC Group companies or affili-ated companies in each locale, and by redoubling efforts to maintain and expand customer networks from the perspective of reinforcing the value chains that MC builds and participates in.
North America Africa
Latin America China
Europe & CIS Asia & Oceania
Middle EastJapan
Yoshiaki KatayamaExecutive Vice President
EVP, Japan
Takeshi InoueSenior Executive
Vice PresidentSenior EVP, Japan
Ryoichi UedaExecutive Vice President
CRO, North AmericaEVP, Americas
Kazuo KorenagaSenior Vice President
CRO, Africa
Osamu SasakiSenior Vice President
CRO, Latin America
Hideto NakaharaExecutive Vice President
Chief Representative for China
(CRO, China/EVP, China)
Tsunao KijimaExecutive Vice President
CRO, Europe-CISEVP, Europe-CIS,
Middle East & Africa
Motonobu Teramura
Executive Vice PresidentEVP, ASEAN
Masatoshi Nishizawa
Executive Vice PresidentCorporate Functional
Officer(Global Strategy)
CRO, Asia & OceaniaEVP, Asia & Oceania
Tetsuro ImaiSenior Vice President
CRO, Middle East
64 Mitsubishi Corporation Annual Report 2008
Corporate Governance and Internal Control
65 MC’s Corporate Governance
66 Members of the Board
68 Corporate Governance Framework
70 Corporate Auditors
71 Internal Control System
74 CSR (Corporate Social Responsibility) &
Environmental Affairs
76 Executive Officers
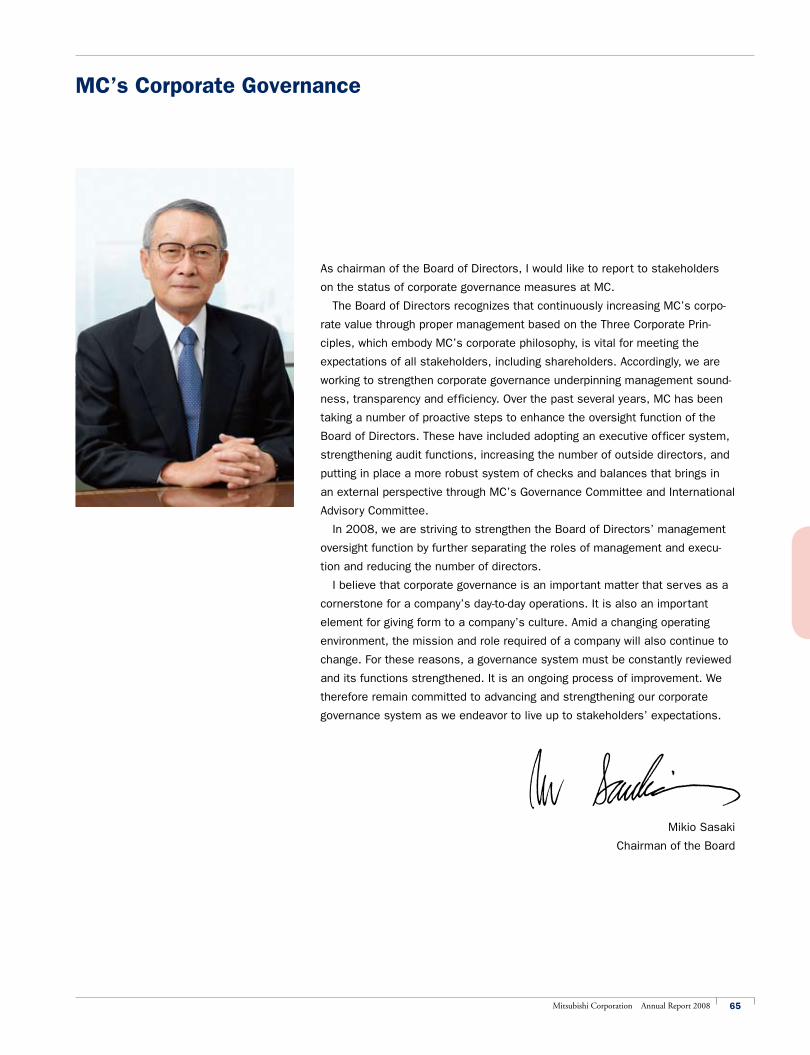
65Mitsubishi Corporation Annual Report 2008
As chairman of the Board of Directors, I would like to report to stakeholders
on the status of corporate governance measures at MC.
The Board of Directors recognizes that continuously increasing MC’s corpo-
rate value through proper management based on the Three Corporate Prin-
ciples, which embody MC’s corporate philosophy, is vital for meeting the
expectations of all stakeholders, including shareholders. Accordingly, we are
working to strengthen corporate governance underpinning management sound-
ness, transparency and efficiency. Over the past several years, MC has been
taking a number of proactive steps to enhance the oversight function of the
Board of Directors. These have included adopting an executive officer system,
strengthening audit functions, increasing the number of outside directors, and
putting in place a more robust system of checks and balances that brings in
an external perspective through MC’s Governance Committee and International
Advisory Committee.
In 2008, we are striving to strengthen the Board of Directors’ management
oversight function by further separating the roles of management and execu-
tion and reducing the number of directors.
I believe that corporate governance is an important matter that serves as a
cornerstone for a company’s day-to-day operations. It is also an important
element for giving form to a company’s culture. Amid a changing operating
environment, the mission and role required of a company will also continue to
change. For these reasons, a governance system must be constantly reviewed
and its functions strengthened. It is an ongoing process of improvement. We
therefore remain committed to advancing and strengthening our corporate
governance system as we endeavor to live up to stakeholders’ expectations.
Mikio Sasaki
Chairman of the Board
MC’s Corporate Governance
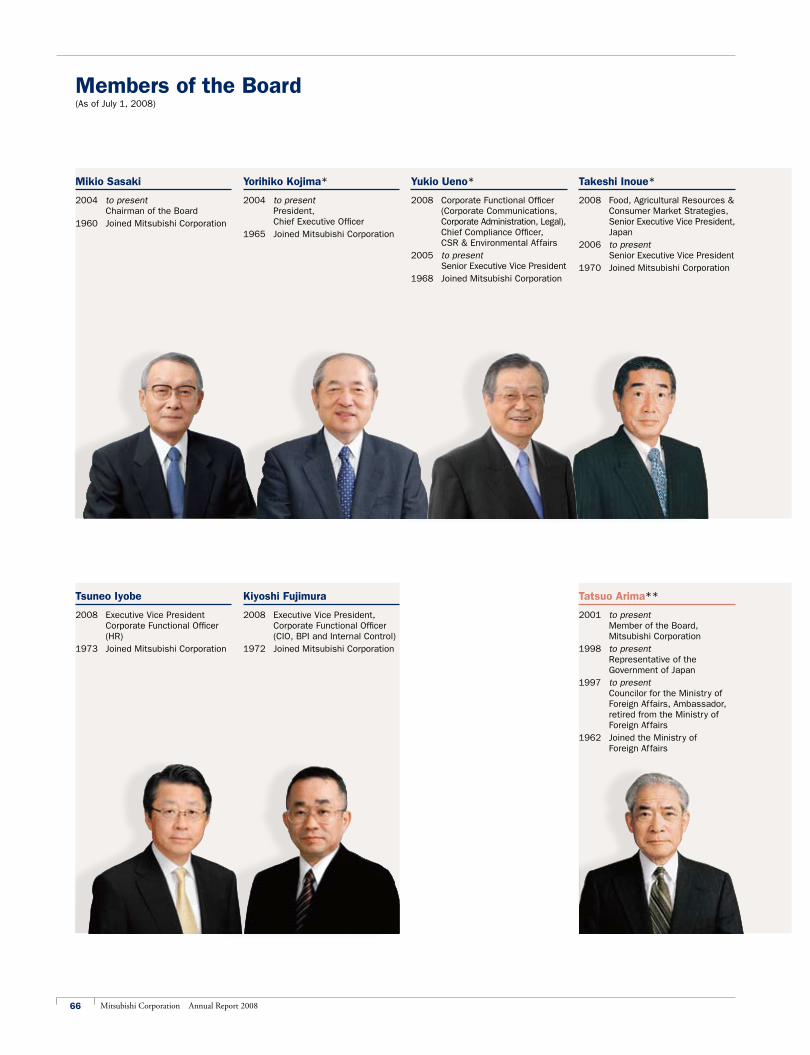
66 Mitsubishi Corporation Annual Report 2008
Members of the Board(As of July 1, 2008)
Mikio Sasaki
2004 to present Chairman of the Board
1960 Joined Mitsubishi Corporation
Yorihiko Kojima*
2004 to present President, Chief Executive Officer
1965 Joined Mitsubishi Corporation
Yukio Ueno*
2008 Corporate Functional Officer (Corporate Communications, Corporate Administration, Legal), Chief Compliance Officer, CSR & Environmental Affairs
2005 to present Senior Executive Vice President
1968 Joined Mitsubishi Corporation
Takeshi Inoue*
2008 Food, Agricultural Resources & Consumer Market Strategies, Senior Executive Vice President, Japan
2006 to present Senior Executive Vice President
1970 Joined Mitsubishi Corporation
Tsuneo Iyobe
2008 Executive Vice President Corporate Functional Officer (HR)
1973 Joined Mitsubishi Corporation
Kiyoshi Fujimura
2008 Executive Vice President, Corporate Functional Officer (CIO, BPI and Internal Control)
1972 Joined Mitsubishi Corporation
Tatsuo Arima**
2001 to present Member of the Board, Mitsubishi Corporation
1998 to present Representative of the Government of Japan
1997 to present Councilor for the Ministry of Foreign Affairs, Ambassador, retired from the Ministry of Foreign Affairs
1962 Joined the Ministry of Foreign Affairs
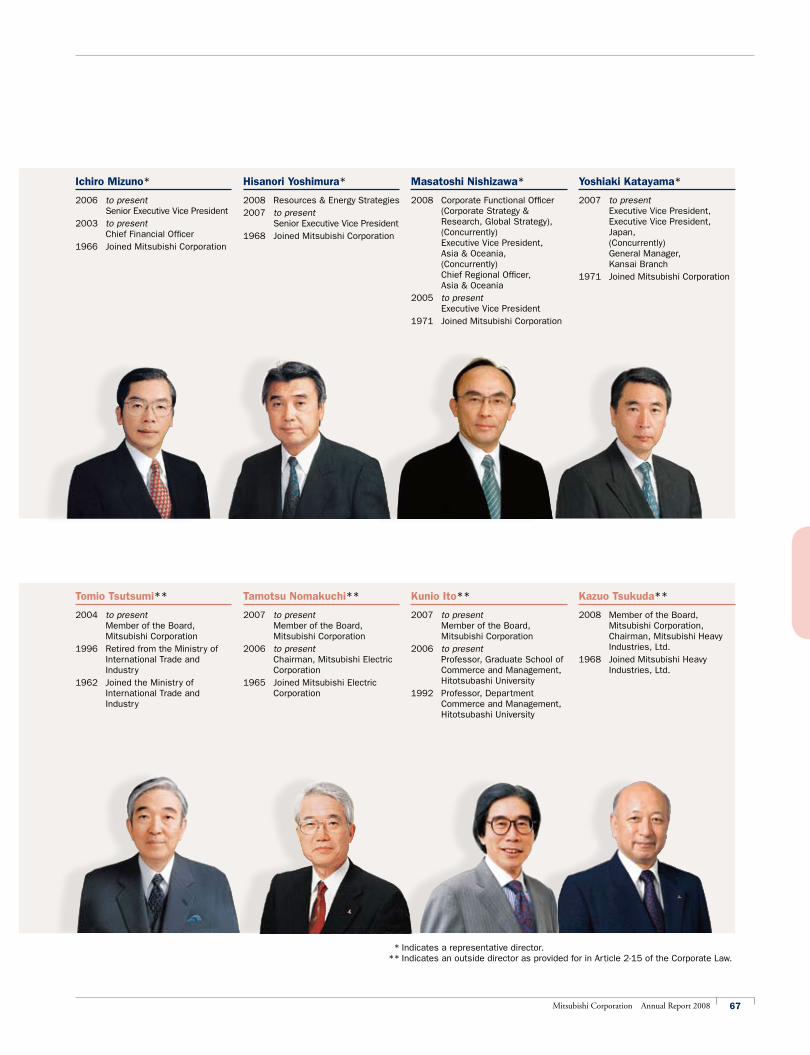
67Mitsubishi Corporation Annual Report 2008
Hisanori Yoshimura*
2008 Resources & Energy Strategies2007 to present
Senior Executive Vice President1968 Joined Mitsubishi Corporation
Yoshiaki Katayama*
2007 to present Executive Vice President, Executive Vice President, Japan, (Concurrently) General Manager, Kansai Branch
1971 Joined Mitsubishi Corporation
Masatoshi Nishizawa*
2008 Corporate Functional Officer (Corporate Strategy & Research, Global Strategy), (Concurrently) Executive Vice President, Asia & Oceania, (Concurrently) Chief Regional Officer, Asia & Oceania
2005 to present Executive Vice President
1971 Joined Mitsubishi Corporation
Ichiro Mizuno*
2006 to present Senior Executive Vice President
2003 to present Chief Financial Officer
1966 Joined Mitsubishi Corporation
* Indicates a representative director.** Indicates an outside director as provided for in Article 2-15 of the Corporate Law.
Tomio Tsutsumi**
2004 to present Member of the Board, Mitsubishi Corporation
1996 Retired from the Ministry of International Trade and Industry
1962 Joined the Ministry of International Trade and Industry
Tamotsu Nomakuchi**
2007 to present Member of the Board, Mitsubishi Corporation
2006 to present Chairman, Mitsubishi Electric Corporation
1965 Joined Mitsubishi Electric Corporation
Kunio Ito**
2007 to present Member of the Board, Mitsubishi Corporation
2006 to present Professor, Graduate School of Commerce and Management, Hitotsubashi University
1992 Professor, Department Commerce and Management, Hitotsubashi University
Kazuo Tsukuda**
2008 Member of the Board, Mitsubishi Corporation, Chairman, Mitsubishi Heavy Industries, Ltd.
1968 Joined Mitsubishi Heavy Industries, Ltd.
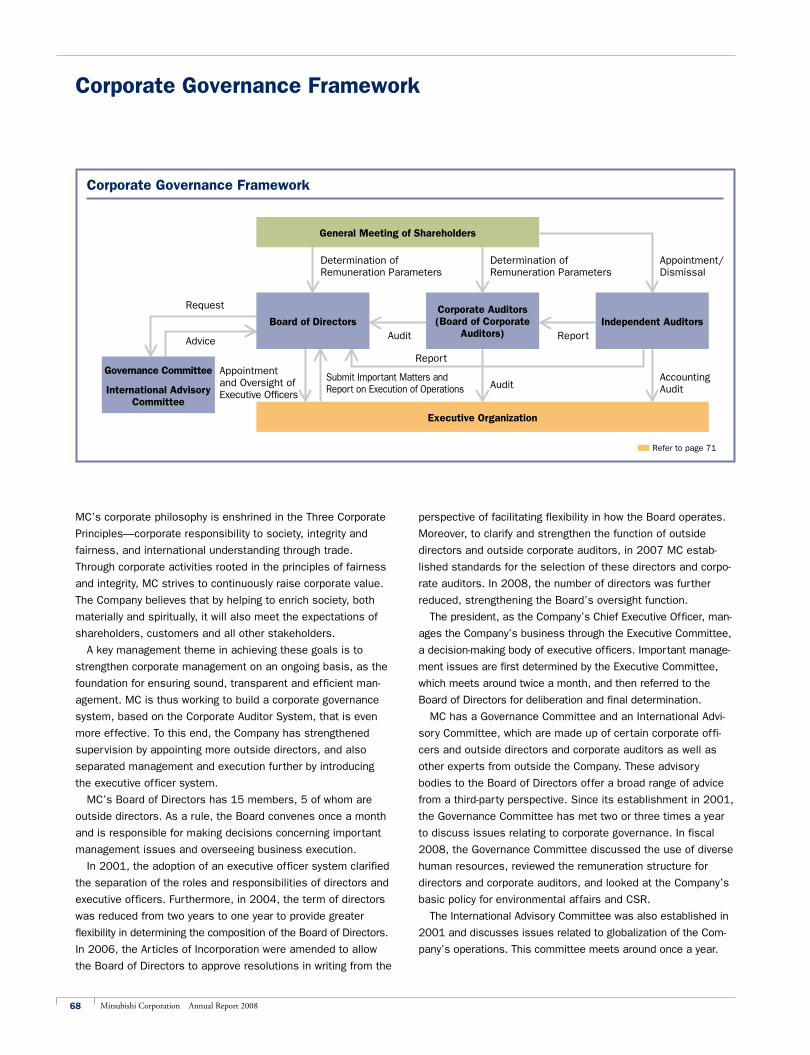
68 Mitsubishi Corporation Annual Report 2008
Corporate Governance Framework
MC’s corporate philosophy is enshrined in the Three Corporate
Principles—corporate responsibility to society, integrity and
fairness, and international understanding through trade.
Through corporate activities rooted in the principles of fairness
and integrity, MC strives to continuously raise corporate value.
The Company believes that by helping to enrich society, both
materially and spiritually, it will also meet the expectations of
shareholders, customers and all other stakeholders.
A key management theme in achieving these goals is to
strengthen corporate management on an ongoing basis, as the
foundation for ensuring sound, transparent and efficient man-
agement. MC is thus working to build a corporate governance
system, based on the Corporate Auditor System, that is even
more effective. To this end, the Company has strengthened
supervision by appointing more outside directors, and also
separated management and execution further by introducing
the executive officer system.
MC’s Board of Directors has 15 members, 5 of whom are
outside directors. As a rule, the Board convenes once a month
and is responsible for making decisions concerning important
management issues and overseeing business execution.
In 2001, the adoption of an executive officer system clarified
the separation of the roles and responsibilities of directors and
executive officers. Furthermore, in 2004, the term of directors
was reduced from two years to one year to provide greater
flexibility in determining the composition of the Board of Directors.
In 2006, the Articles of Incorporation were amended to allow
the Board of Directors to approve resolutions in writing from the
perspective of facilitating flexibility in how the Board operates.
Moreover, to clarify and strengthen the function of outside
directors and outside corporate auditors, in 2007 MC estab-
lished standards for the selection of these directors and corpo-
rate auditors. In 2008, the number of directors was further
reduced, strengthening the Board’s oversight function.
The president, as the Company’s Chief Executive Officer, man-
ages the Company’s business through the Executive Committee,
a decision-making body of executive officers. Important manage-
ment issues are first determined by the Executive Committee,
which meets around twice a month, and then referred to the
Board of Directors for deliberation and final determination.
MC has a Governance Committee and an International Advi-
sory Committee, which are made up of certain corporate offi-
cers and outside directors and corporate auditors as well as
other experts from outside the Company. These advisory
bodies to the Board of Directors offer a broad range of advice
from a third-party perspective. Since its establishment in 2001,
the Governance Committee has met two or three times a year
to discuss issues relating to corporate governance. In fiscal
2008, the Governance Committee discussed the use of diverse
human resources, reviewed the remuneration structure for
directors and corporate auditors, and looked at the Company’s
basic policy for environmental affairs and CSR.
The International Advisory Committee was also established in
2001 and discusses issues related to globalization of the Com-
pany’s operations. This committee meets around once a year.
Corporate Governance Framework
nn Refer to page 71
General Meeting of Shareholders
Board of Directors
Governance Committee
International Advisory Committee
Corporate Auditors (Board of Corporate
Auditors)
Executive Organization
Independent Auditors
Determination of Remuneration Parameters
Determination of Remuneration Parameters
Appointment/Dismissal
Request
Advice Audit Report
ReportAppointment and Oversight of Executive Officers
Submit Important Matters and Report on Execution of Operations Audit
Accounting Audit
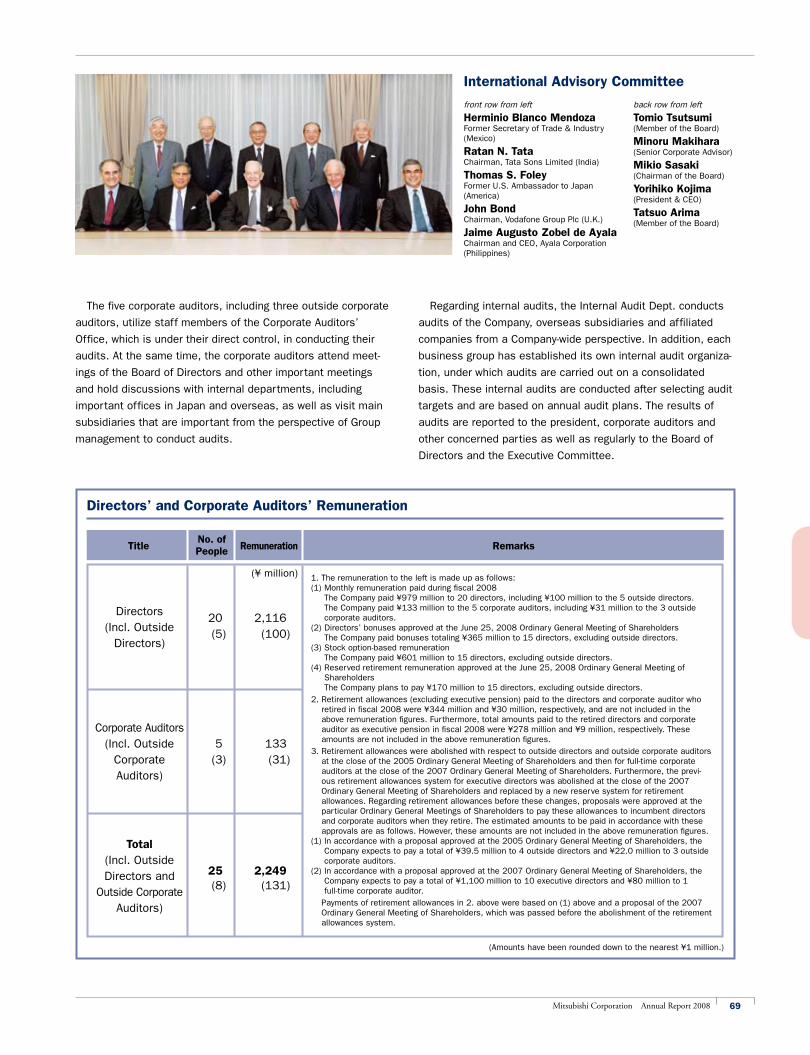
69Mitsubishi Corporation Annual Report 2008
The five corporate auditors, including three outside corporate
auditors, utilize staff members of the Corporate Auditors’
Office, which is under their direct control, in conducting their
audits. At the same time, the corporate auditors attend meet-
ings of the Board of Directors and other important meetings
and hold discussions with internal departments, including
important offices in Japan and overseas, as well as visit main
subsidiaries that are important from the perspective of Group
management to conduct audits.
Regarding internal audits, the Internal Audit Dept. conducts
audits of the Company, overseas subsidiaries and affiliated
companies from a Company-wide perspective. In addition, each
business group has established its own internal audit organiza-
tion, under which audits are carried out on a consolidated
basis. These internal audits are conducted after selecting audit
targets and are based on annual audit plans. The results of
audits are reported to the president, corporate auditors and
other concerned parties as well as regularly to the Board of
Directors and the Executive Committee.
(Amounts have been rounded down to the nearest ¥1 million.)
Directors’ and Corporate Auditors’ Remuneration
1. The remuneration to the left is made up as follows:(1) Monthly remuneration paid during fiscal 2008 The Company paid ¥979 million to 20 directors, including ¥100 million to the 5 outside directors. The Company paid ¥133 million to the 5 corporate auditors, including ¥31 million to the 3 outside
corporate auditors.(2) Directors’ bonuses approved at the June 25, 2008 Ordinary General Meeting of Shareholders The Company paid bonuses totaling ¥365 million to 15 directors, excluding outside directors.(3) Stock option-based remuneration The Company paid ¥601 million to 15 directors, excluding outside directors.(4) Reserved retirement remuneration approved at the June 25, 2008 Ordinary General Meeting of
Shareholders The Company plans to pay ¥170 million to 15 directors, excluding outside directors.2. Retirement allowances (excluding executive pension) paid to the directors and corporate auditor who
retired in fiscal 2008 were ¥344 million and ¥30 million, respectively, and are not included in the above remuneration figures. Furthermore, total amounts paid to the retired directors and corporate auditor as executive pension in fiscal 2008 were ¥278 million and ¥9 million, respectively. These amounts are not included in the above remuneration figures.
3. Retirement allowances were abolished with respect to outside directors and outside corporate auditors at the close of the 2005 Ordinary General Meeting of Shareholders and then for full-time corporate auditors at the close of the 2007 Ordinary General Meeting of Shareholders. Furthermore, the previ-ous retirement allowances system for executive directors was abolished at the close of the 2007 Ordinary General Meeting of Shareholders and replaced by a new reserve system for retirement allowances. Regarding retirement allowances before these changes, proposals were approved at the particular Ordinary General Meetings of Shareholders to pay these allowances to incumbent directors and corporate auditors when they retire. The estimated amounts to be paid in accordance with these approvals are as follows. However, these amounts are not included in the above remuneration figures.
(1) In accordance with a proposal approved at the 2005 Ordinary General Meeting of Shareholders, the Company expects to pay a total of ¥39.5 million to 4 outside directors and ¥22.0 million to 3 outside corporate auditors.
(2) In accordance with a proposal approved at the 2007 Ordinary General Meeting of Shareholders, the Company expects to pay a total of ¥1,100 million to 10 executive directors and ¥80 million to 1 full-time corporate auditor.
Payments of retirement allowances in 2. above were based on (1) above and a proposal of the 2007 Ordinary General Meeting of Shareholders, which was passed before the abolishment of the retirement allowances system.
No. of Title People Remuneration Remarks
Directors 20 2,116
(Incl. Outside (5) (100)
Directors)
Corporate Auditors (Incl. Outside 5 133 Corporate (3) (31) Auditors)
Total (Incl. Outside Directors and 25 2,249 Outside Corporate
(8) (131)
Auditors)
front row from left
Herminio Blanco MendozaFormer Secretary of Trade & Industry (Mexico)
Ratan N. TataChairman, Tata Sons Limited (India)
Thomas S. FoleyFormer U.S. Ambassador to Japan (America)
John BondChairman, Vodafone Group Plc (U.K.)
Jaime Augusto Zobel de AyalaChairman and CEO, Ayala Corporation (Philippines)
International Advisory Committee
back row from left
Tomio Tsutsumi(Member of the Board)
Minoru Makihara(Senior Corporate Advisor)
Mikio Sasaki(Chairman of the Board)
Yorihiko Kojima(President & CEO)
Tatsuo Arima(Member of the Board)
(¥ million)

70 Mitsubishi Corporation Annual Report 2008
* Indicates an outside corporate auditor as provided for in Article 2-16 of the Corporate Law.
Corporate Auditors(As of July 1, 2008)
Yuzo Shinkai
2001 to present Senior Corporate Auditor
1962 Joined Mitsubishi Corporation
Eiji Oshima
2007 to present Corporate Auditor
1973 Joined Mitsubishi Corporation
Shigeru Nakajima*
2004 to present Corporate Auditor, Mitsubishi Corporation
1984 Admitted to the Japan Patent Attorneys Association
1983 Founded Nakajima Transactional Law Office
1979 Admitted to the Japan Bar
Eiko Tsujiyama*
2008 Corporate Auditor, Mitsubishi Corporation
2003 to present Professor, Graduate School of Commerce, Waseda University
Eisuke Nagatomo*2008 Corporate Auditor,
Mitsubishi Corporation Visiting Professor, Graduate School of Commerce, Waseda University
2007 to present President, Chief Executive Officer, EN Associates Co., Ltd., retired from Tokyo Stock Exchange Inc.
2003 Managing Director, Tokyo Stock Exchange Inc.
1971 Joined Tokyo Stock Exchange
Message From the Senior Corporate AuditorYuzo Shinkai, Senior Corporate AuditorMC has two full-time and three outside corporate auditors, all
of whom have a wealth of experience in their respective fields.
The senior corporate auditor heads the Board of Corporate
Auditors and is also the specified corporate auditor stipulated
by the law. Corporate auditors are assisted by the 5-member
Corporate Auditors’ Office, which is an independent organiza-
tional body.
Corporate auditors and staff of the Corporate Auditors’ Office
attend important in-house meetings, so as to keep channels of
communication open with people in the company. Furthermore,
we work to stay abreast of the company’s circumstances
through close contact and regular meetings with MC’s indepen-
dent auditors and Internal Audit Department. We also regularly
exchange information with full-time auditors of main subsidiar-
ies and affiliates in our efforts to create an environment condu-
cive to auditing the corporate group. At the same time, we hold
regular discussions with respected individuals from outside the
company who give us their expert opinions.
MC is striving to sustain healthy growth while answering
society’s demands, and in this regard we want to contribute to
strengthening the company’s management base.
Message From Outside Corporate AuditorShigeru Nakajima, Corporate AuditorI pay attention to two things in particular as an outside corpo-
rate auditor. One is to objectively and fairly monitor MC’s busi-
ness operations as an “outsider.” Second is to connect with
people in the company and understand the passion of people
at the frontline as an auditor. I believe that only by approaching
this responsibility from these two perspectives, can one accom-
plish the mission entrusted to an outside corporate auditor.
I meet regularly with the other corporate auditors and inde-
pendent auditors and talk with the president and other execu-
tives whenever the opportunity arises. I also attend, as much
as possible, meetings where corporate auditors of MC Group
companies exchange information.
Based on insight into information gathered in this way, I use
my attendance at Board of Directors’ meetings to ask directors
to take a closer look at certain points or recommend further
discussion from a different perspective. Going forward, I am
determined to play my part, however small, in helping to raise
society’s level of trust in MC.
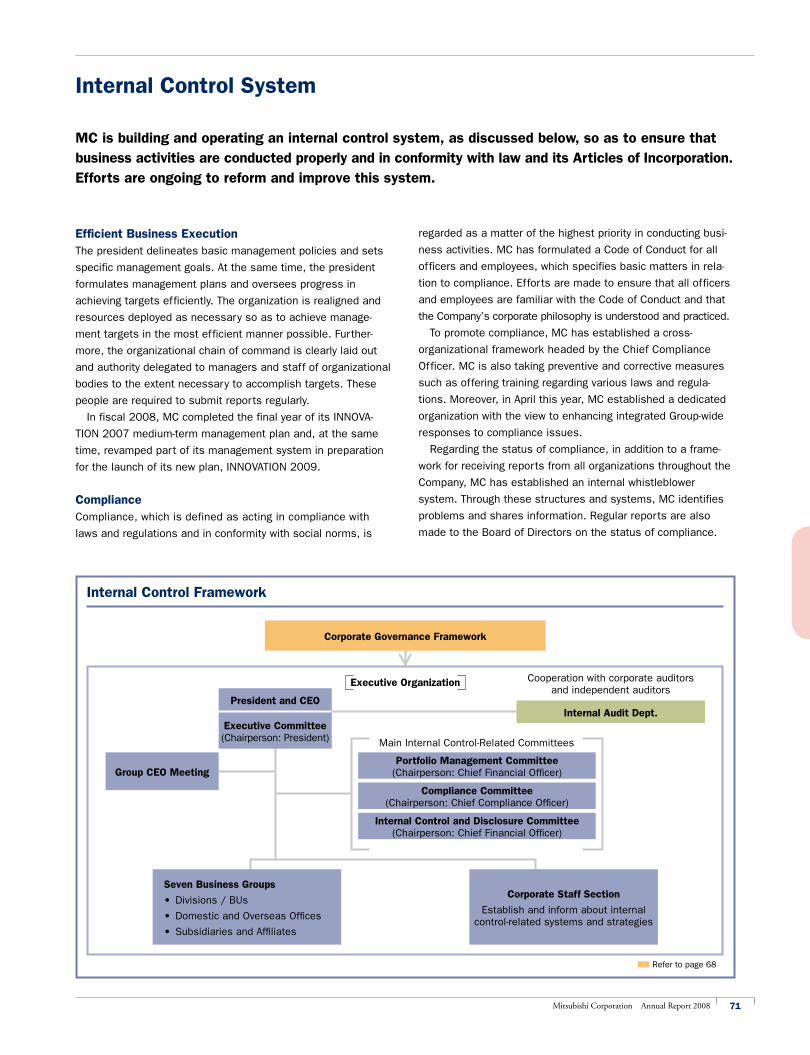
71Mitsubishi Corporation Annual Report 2008
Efficient Business ExecutionThe president delineates basic management policies and sets
specific management goals. At the same time, the president
formulates management plans and oversees progress in
achieving targets efficiently. The organization is realigned and
resources deployed as necessary so as to achieve manage-
ment targets in the most efficient manner possible. Further-
more, the organizational chain of command is clearly laid out
and authority delegated to managers and staff of organizational
bodies to the extent necessary to accomplish targets. These
people are required to submit reports regularly.
In fiscal 2008, MC completed the final year of its INNOVA-
TION 2007 medium-term management plan and, at the same
time, revamped part of its management system in preparation
for the launch of its new plan, INNOVATION 2009.
ComplianceCompliance, which is defined as acting in compliance with
laws and regulations and in conformity with social norms, is
regarded as a matter of the highest priority in conducting busi-
ness activities. MC has formulated a Code of Conduct for all
officers and employees, which specifies basic matters in rela-
tion to compliance. Efforts are made to ensure that all officers
and employees are familiar with the Code of Conduct and that
the Company’s corporate philosophy is understood and practiced.
To promote compliance, MC has established a cross-
organizational framework headed by the Chief Compliance
Officer. MC is also taking preventive and corrective measures
such as offering training regarding various laws and regula-
tions. Moreover, in April this year, MC established a dedicated
organization with the view to enhancing integrated Group-wide
responses to compliance issues.
Regarding the status of compliance, in addition to a frame-
work for receiving reports from all organizations throughout the
Company, MC has established an internal whistleblower
system. Through these structures and systems, MC identifies
problems and shares information. Regular reports are also
made to the Board of Directors on the status of compliance.
Internal Control System
MC is building and operating an internal control system, as discussed below, so as to ensure that business activities are conducted properly and in conformity with law and its Articles of Incorporation. Efforts are ongoing to reform and improve this system.
Internal Control Framework
Corporate Governance Framework
Executive Organization
President and CEO
Seven Business Groups
•Divisions/BUs
•DomesticandOverseasOffices
• SubsidiariesandAffiliates
Corporate Staff Section
Establish and inform about internal control-related systems and strategies
Internal Audit Dept.Executive Committee(Chairperson: President)
Cooperation with corporate auditors and independent auditors
Main Internal Control-Related Committees
Portfolio Management Committee(Chairperson: Chief Financial Officer)
Compliance Committee(Chairperson: Chief Compliance Officer)
Internal Control and Disclosure Committee(Chairperson: Chief Financial Officer)
nn Refer to page 68
Group CEO Meeting
72 Mitsubishi Corporation Annual Report 2008
Risk ManagementRegarding risks associated with business activities, MC has
designated categories of risk—such as credit, market, busi-
ness investment, country, compliance, legal, information
management, environmental, and natural disaster-related
risks—and has established departments responsible for each
category. MC also has in place policies, systems and proce-
dures for managing risk. Furthermore, MC responds to new
risks by immediately designating a responsible department to
manage such risks.
With respect to individual projects, the person responsible for
the applicable department makes decisions within the scope of
their prescribed authority after analyzing and assessing the
risk-return profile of each project in accordance with Company-
wide policies and procedures. Projects are executed and man-
aged on an individual basis in accordance with this approach.
In addition to managing risk on an individual project basis, MC
assesses risk for the Company as a whole with respect to risks
that are capable of being monitored quantitatively and manages
these risks properly, making reassessments as necessary.
Financial ReportingTo ensure the proper and timely disclosure of financial state-
ments, MC has appointed personnel responsible for financial
reporting and prepares financial statements in conformity with
legal requirements and accounting standards. These financial
statements are released after being discussed and confirmed
by the committee responsible for financial reporting. Regarding
the establishment of internal controls over financial reporting,
MC has a dedicated internal organization, which documents,
evaluates and improves Company-wide internal controls and
administrative processes at important business locations
based on the Financial Instruments and Exchange Law and the
U.S. Sarbanes-Oxley Act of 2002.
Management and Storage of InformationRegarding information related to business activities, personnel
responsible for managing business activities classify informa-
tion individually in accordance with its degree of importance.
These individuals also instruct users on the handling of this
information. The aim is to ensure information security while
promoting efficient administrative processing and the sharing
of information.
Responsible personnel store for a predetermined period
documents that must be stored by law and information that the
Company specifies as important in terms of internal manage-
ment. For all other information, responsible personnel deter-
mine the necessity and period for storage of information and
store such information accordingly.
Ensuring Proper Business in Group ManagementMC specifies a responsible department for the oversight of
each subsidiary and affiliate and quantitatively monitors busi-
ness performance, management efficiency and other opera-
tional aspects of each company every year. Efforts are also
made to monitor qualitative issues such as compliance and
risk management.
MC strives to ensure proper business conduct by subsidiar-
ies and affiliates by sending directors to sit on their boards,
executing joint venture agreements, exercising its voting rights
and in other ways. In this way, and through various initiatives
designed to sustain growth at each company, MC aims to raise
corporate value on a consolidated basis.
Auditing and MonitoringEach organization takes responsibility for reviewing and improv-
ing its business activities on a regular basis. In addition, to
more objectively review and evaluate the business activities of
each organization, MC conducts regular audits through an inter-
nal audit organization.
Corporate AuditorsCorporate auditors attend and express opinions at meetings of the
Board of Directors and other important management meetings. In
addition, corporate auditors gather information and conduct sur-
veys, keeping channels of communication open with directors,
employees and others who cooperate with these efforts.
If there is a risk of a certain level of financial loss or a major
problem, the person responsible for the department concerned
is required to immediately report to corporate auditors in accor-
dance with predetermined standards and procedures.
To raise the effectiveness of audits conducted by corporate
auditors, personnel are appointed to assist corporate auditors
in carrying out their duties. Mindful of the need for indepen-
dence, the opinions of corporate auditors are respected and
other factors taken into consideration when evaluating and
selecting people to assist them.
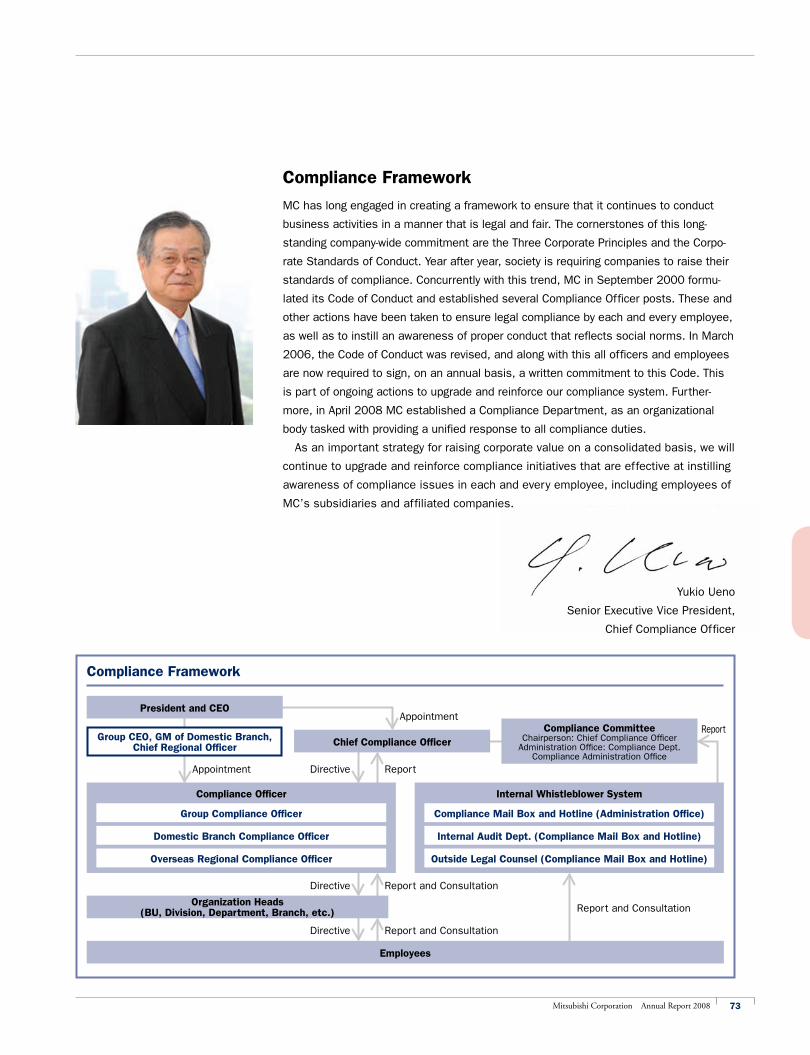
73Mitsubishi Corporation Annual Report 2008
Compliance Framework
MC has long engaged in creating a framework to ensure that it continues to conduct
business activities in a manner that is legal and fair. The cornerstones of this long-
standing company-wide commitment are the Three Corporate Principles and the Corpo-
rate Standards of Conduct. Year after year, society is requiring companies to raise their
standards of compliance. Concurrently with this trend, MC in September 2000 formu-
lated its Code of Conduct and established several Compliance Officer posts. These and
other actions have been taken to ensure legal compliance by each and every employee,
as well as to instill an awareness of proper conduct that reflects social norms. In March
2006, the Code of Conduct was revised, and along with this all officers and employees
are now required to sign, on an annual basis, a written commitment to this Code. This
is part of ongoing actions to upgrade and reinforce our compliance system. Further-
more, in April 2008 MC established a Compliance Department, as an organizational
body tasked with providing a unified response to all compliance duties.
As an important strategy for raising corporate value on a consolidated basis, we will
continue to upgrade and reinforce compliance initiatives that are effective at instilling
awareness of compliance issues in each and every employee, including employees of
MC’s subsidiaries and affiliated companies.
Yukio Ueno
Senior Executive Vice President,
Chief Compliance Officer
Compliance Framework
President and CEO
Group Compliance Officer Compliance Mail Box and Hotline (Administration Office)
Domestic Branch Compliance Officer Internal Audit Dept. (Compliance Mail Box and Hotline)
Overseas Regional Compliance Officer Outside Legal Counsel (Compliance Mail Box and Hotline)
Compliance Officer
Organization Heads (BU, Division, Department, Branch, etc.)
Employees
Internal Whistleblower System
Chief Compliance OfficerCompliance Committee
Chairperson: Chief Compliance OfficerAdministration Office: Compliance Dept.
Compliance Administration Office
Group CEO, GM of Domestic Branch, Chief Regional Officer
Appointment
Report
Report and Consultation
Report and Consultation
Report and Consultation
Appointment Directive
Directive
Directive
Report
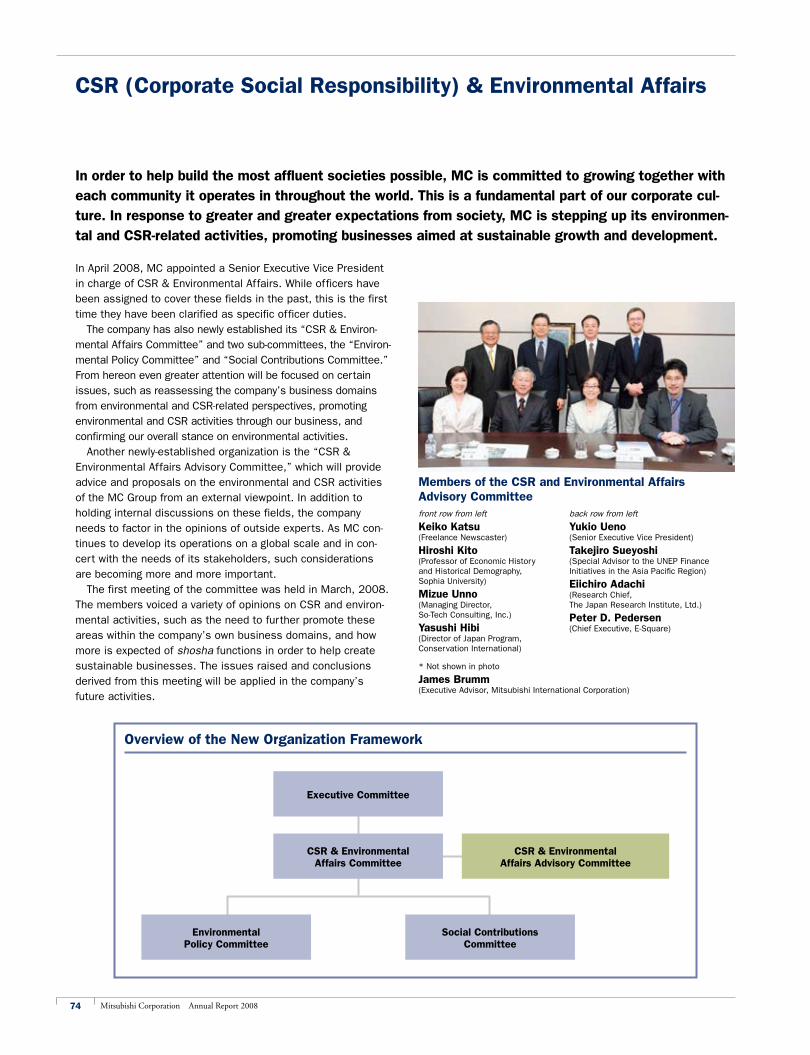
74 Mitsubishi Corporation Annual Report 2008
CSR (Corporate Social Responsibility) & Environmental Affairs
Overview of the New Organization Framework
Executive Committee
CSR & Environmental Affairs Committee
CSR & Environmental Affairs Advisory Committee
Environmental Policy Committee
Social Contributions Committee
In order to help build the most affluent societies possible, MC is committed to growing together with each community it operates in throughout the world. This is a fundamental part of our corporate cul-ture. In response to greater and greater expectations from society, MC is stepping up its environmen-tal and CSR-related activities, promoting businesses aimed at sustainable growth and development.
In April 2008, MC appointed a Senior Executive Vice President in charge of CSR & Environmental Affairs. While officers have been assigned to cover these fields in the past, this is the first time they have been clarified as specific officer duties. The company has also newly established its “CSR & Environ-mental Affairs Committee” and two sub-committees, the “Environ-mental Policy Committee” and “Social Contributions Committee.” From hereon even greater attention will be focused on certain issues, such as reassessing the company’s business domains from environmental and CSR-related perspectives, promoting environmental and CSR activities through our business, and confirming our overall stance on environmental activities. Another newly-established organization is the “CSR & Environmental Affairs Advisory Committee,” which will provide advice and proposals on the environmental and CSR activities of the MC Group from an external viewpoint. In addition to holding internal discussions on these fields, the company needs to factor in the opinions of outside experts. As MC con-tinues to develop its operations on a global scale and in con-cert with the needs of its stakeholders, such considerations are becoming more and more important. The first meeting of the committee was held in March, 2008. The members voiced a variety of opinions on CSR and environ-mental activities, such as the need to further promote these areas within the company’s own business domains, and how more is expected of shosha functions in order to help create sustainable businesses. The issues raised and conclusions derived from this meeting will be applied in the company’s future activities.
Members of the CSR and Environmental Affairs Advisory Committee
back row from left
Yukio Ueno (Senior Executive Vice President)
Takejiro Sueyoshi(Special Advisor to the UNEP Finance Initiatives in the Asia Pacific Region)
Eiichiro Adachi (Research Chief, The Japan Research Institute, Ltd.)
Peter D. Pedersen(Chief Executive, E-Square)
front row from left
Keiko Katsu(Freelance Newscaster)
Hiroshi Kito(Professor of Economic History and Historical Demography, Sophia University)
Mizue Unno (Managing Director, So-Tech Consulting, Inc.)
Yasushi Hibi (Director of Japan Program, Conservation International)
* Not shown in photo
James Brumm (Executive Advisor, Mitsubishi International Corporation)
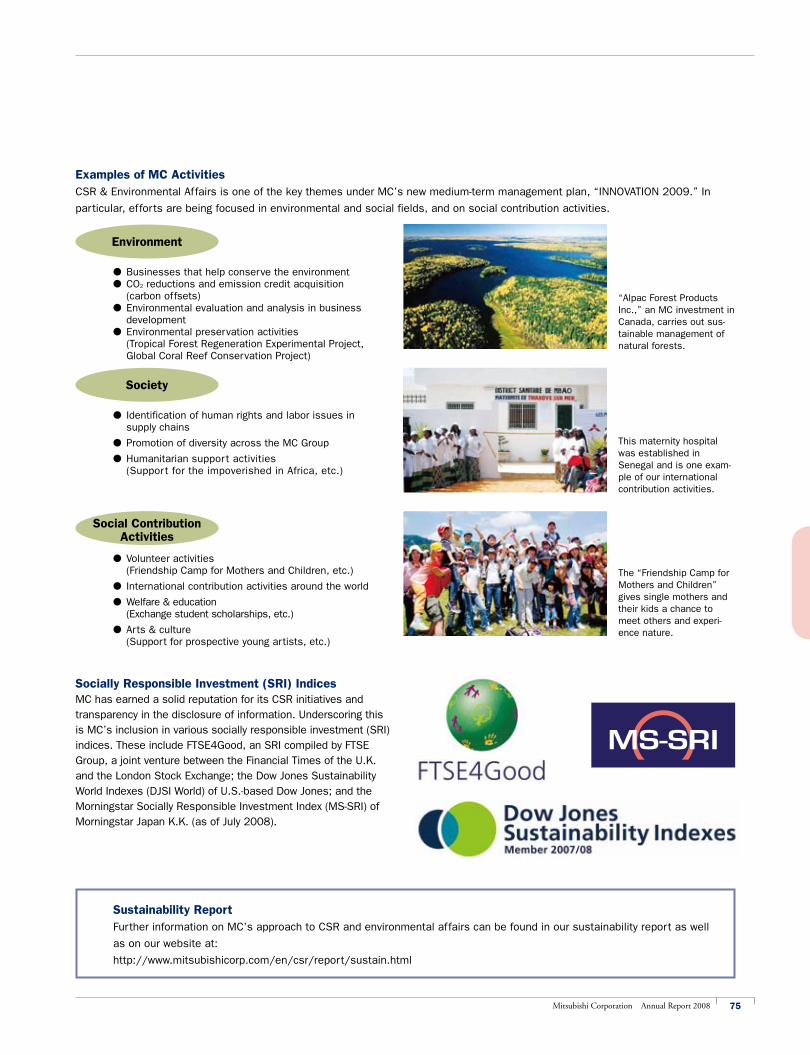
75Mitsubishi Corporation Annual Report 2008
Sustainability ReportFurther information on MC’s approach to CSR and environmental affairs can be found in our sustainability report as well
as on our website at:
http://www.mitsubishicorp.com/en/csr/report/sustain.html
Examples of MC ActivitiesCSR & Environmental Affairs is one of the key themes under MC’s new medium-term management plan, “INNOVATION 2009.” In
particular, efforts are being focused in environmental and social fields, and on social contribution activities.
Socially Responsible Investment (SRI) IndicesMC has earned a solid reputation for its CSR initiatives and transparency in the disclosure of information. Underscoring this is MC’s inclusion in various socially responsible investment (SRI) indices. These include FTSE4Good, an SRI compiled by FTSE Group, a joint venture between the Financial Times of the U.K. and the London Stock Exchange; the Dow Jones Sustainability World Indexes (DJSI World) of U.S.-based Dow Jones; and the Morningstar Socially Responsible Investment Index (MS-SRI) of Morningstar Japan K.K. (as of July 2008).
l Businesses that help conserve the environmentl CO2 reductions and emission credit acquisition
(carbon offsets)l Environmental evaluation and analysis in business
developmentl Environmental preservation activities
(Tropical Forest Regeneration Experimental Project, Global Coral Reef Conservation Project)
l Identification of human rights and labor issues in supply chains
l Promotion of diversity across the MC Group
l Humanitarian support activities (Support for the impoverished in Africa, etc.)
l Volunteer activities (Friendship Camp for Mothers and Children, etc.)
l International contribution activities around the world
l Welfare & education (Exchange student scholarships, etc.)
l Arts & culture (Support for prospective young artists, etc.)
“Alpac Forest Products Inc.,” an MC investment in Canada, carries out sus-tainable management of natural forests.
This maternity hospital was established in Senegal and is one exam-ple of our inter national contribution activities.
The “Friendship Camp for Mothers and Children” gives single mothers and their kids a chance to meet others and experi-ence nature.
Environment
Society
Social Contribution Activities
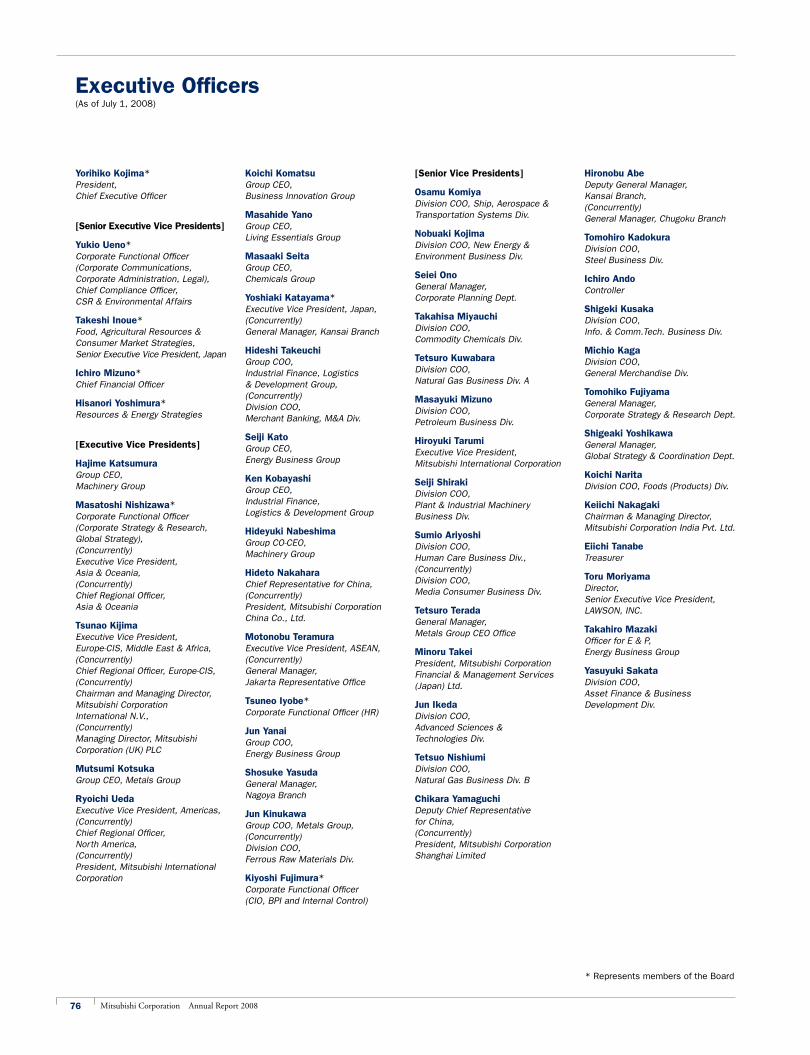
76 Mitsubishi Corporation Annual Report 2008
Executive Officers(As of July 1, 2008)
* Represents members of the Board
Yorihiko Kojima*President, Chief Executive Officer
[Senior Executive Vice Presidents]
Yukio Ueno*Corporate Functional Officer (Corporate Communications, Corporate Administration, Legal), Chief Compliance Officer, CSR & Environmental Affairs
Takeshi Inoue*Food, Agricultural Resources & Consumer Market Strategies, Senior Executive Vice President, Japan
Ichiro Mizuno*Chief Financial Officer
Hisanori Yoshimura*Resources & Energy Strategies
[Executive Vice Presidents]
Hajime KatsumuraGroup CEO, Machinery Group
Masatoshi Nishizawa*Corporate Functional Officer (Corporate Strategy & Research, Global Strategy),(Concurrently)Executive Vice President, Asia & Oceania,(Concurrently)Chief Regional Officer, Asia & Oceania
Tsunao KijimaExecutive Vice President, Europe-CIS, Middle East & Africa,(Concurrently)Chief Regional Officer, Europe-CIS,(Concurrently)Chairman and Managing Director, Mitsubishi Corporation International N.V.,(Concurrently)Managing Director, Mitsubishi Corporation (UK) PLC
Mutsumi KotsukaGroup CEO, Metals Group
Ryoichi UedaExecutive Vice President, Americas,(Concurrently)Chief Regional Officer, North America,(Concurrently)President, Mitsubishi International Corporation
Koichi KomatsuGroup CEO, Business Innovation Group
Masahide YanoGroup CEO, Living Essentials Group
Masaaki SeitaGroup CEO, Chemicals Group
Yoshiaki Katayama*Executive Vice President, Japan,(Concurrently)General Manager, Kansai Branch
Hideshi TakeuchiGroup COO, Industrial Finance, Logistics& Development Group,(Concurrently)Division COO, Merchant Banking, M&A Div.
Seiji KatoGroup CEO, Energy Business Group
Ken KobayashiGroup CEO, Industrial Finance, Logistics & Development Group
Hideyuki NabeshimaGroup CO-CEO, Machinery Group
Hideto NakaharaChief Representative for China,(Concurrently)President, Mitsubishi Corporation China Co., Ltd.
Motonobu TeramuraExecutive Vice President, ASEAN,(Concurrently)General Manager, Jakarta Representative Office
Tsuneo Iyobe*Corporate Functional Officer (HR)
Jun YanaiGroup COO, Energy Business Group
Shosuke YasudaGeneral Manager, Nagoya Branch
Jun KinukawaGroup COO, Metals Group,(Concurrently)Division COO, Ferrous Raw Materials Div.
Kiyoshi Fujimura*Corporate Functional Officer (CIO, BPI and Internal Control)
[Senior Vice Presidents]
Osamu KomiyaDivision COO, Ship, Aerospace & Transportation Systems Div.
Nobuaki KojimaDivision COO, New Energy & Environment Business Div.
Seiei OnoGeneral Manager, Corporate Planning Dept.
Takahisa MiyauchiDivision COO, Commodity Chemicals Div.
Tetsuro KuwabaraDivision COO, Natural Gas Business Div. A
Masayuki MizunoDivision COO, Petroleum Business Div.
Hiroyuki TarumiExecutive Vice President, Mitsubishi International Corporation
Seiji ShirakiDivision COO, Plant & Industrial Machinery Business Div.
Sumio AriyoshiDivision COO, Human Care Business Div.,(Concurrently)Division COO, Media Consumer Business Div.
Tetsuro TeradaGeneral Manager, Metals Group CEO Office
Minoru TakeiPresident, Mitsubishi Corporation Financial & Management Services (Japan) Ltd.
Jun IkedaDivision COO, Advanced Sciences & Technologies Div.
Tetsuo NishiumiDivision COO, Natural Gas Business Div. B
Chikara YamaguchiDeputy Chief Representative for China,(Concurrently)President, Mitsubishi Corporation Shanghai Limited
Hironobu AbeDeputy General Manager, Kansai Branch,(Concurrently)General Manager, Chugoku Branch
Tomohiro KadokuraDivision COO, Steel Business Div.
Ichiro AndoController
Shigeki KusakaDivision COO, Info. & Comm.Tech. Business Div.
Michio KagaDivision COO, General Merchandise Div.
Tomohiko FujiyamaGeneral Manager, Corporate Strategy & Research Dept.
Shigeaki YoshikawaGeneral Manager, Global Strategy & Coordination Dept.
Koichi NaritaDivision COO, Foods (Products) Div.
Keiichi NakagakiChairman & Managing Director, Mitsubishi Corporation India Pvt. Ltd.
Eiichi TanabeTreasurer
Toru MoriyamaDirector, Senior Executive Vice President, LAWSON, INC.
Takahiro MazakiOfficer for E & P, Energy Business Group
Yasuyuki SakataDivision COO, Asset Finance & Business Development Div.
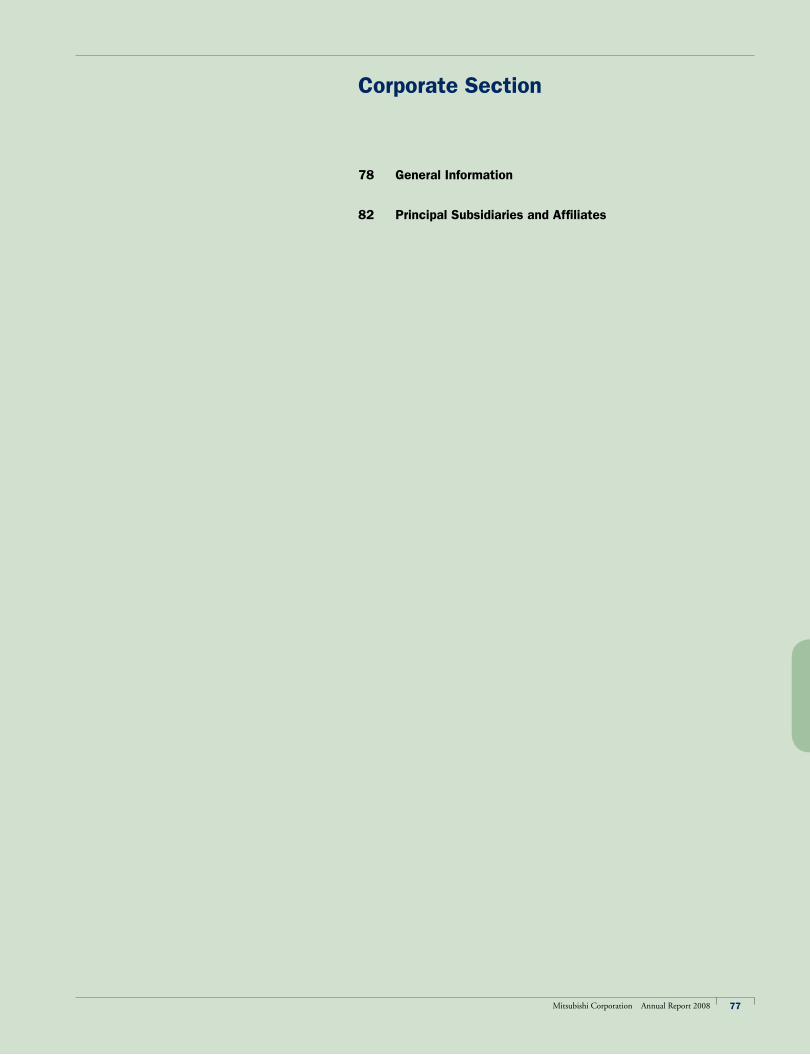
77Mitsubishi Corporation Annual Report 2008
Corporate Section
78 General Information
82 Principal Subsidiaries and Affiliates
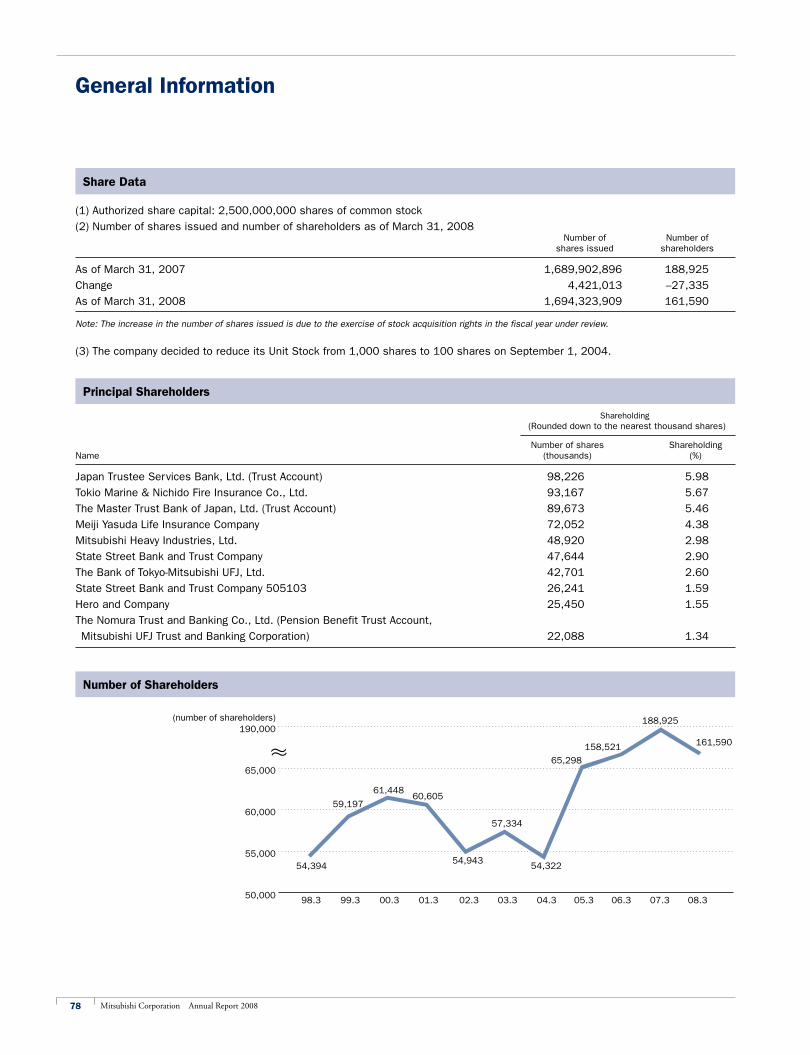
78 Mitsubishi Corporation Annual Report 2008
Share Data
(1) Authorized share capital: 2,500,000,000 shares of common stock
(2) Number of shares issued and number of shareholders as of March 31, 2008 Number of Number of shares issued shareholders
As of March 31, 2007 1,689,902,896 188,925
Change 4,421,013 –27,335
As of March 31, 2008 1,694,323,909 161,590
Note: The increase in the number of shares issued is due to the exercise of stock acquisition rights in the fiscal year under review.
(3) The company decided to reduce its Unit Stock from 1,000 shares to 100 shares on September 1, 2004.
Principal Shareholders
Shareholding (Rounded down to the nearest thousand shares)
Number of shares ShareholdingName (thousands) (%)
Japan Trustee Services Bank, Ltd. (Trust Account) 98,226 5.98
Tokio Marine & Nichido Fire Insurance Co., Ltd. 93,167 5.67
The Master Trust Bank of Japan, Ltd. (Trust Account) 89,673 5.46
Meiji Yasuda Life Insurance Company 72,052 4.38
Mitsubishi Heavy Industries, Ltd. 48,920 2.98
State Street Bank and Trust Company 47,644 2.90
The Bank of Tokyo-Mitsubishi UFJ, Ltd. 42,701 2.60
State Street Bank and Trust Company 505103 26,241 1.59
Hero and Company 25,450 1.55
The Nomura Trust and Banking Co., Ltd. (Pension Benefit Trust Account,
Mitsubishi UFJ Trust and Banking Corporation) 22,088 1.34
Number of Shareholders
General Information
(number of shareholders)
98.3 99.3 00.3 01.3 02.3 03.3 05.3 06.3 07.304.3
55,000
60,000
190,000
65,000
50,000 08.3
54,394
59,197
61,44860,605
54,943
57,334
54,322
158,521
188,925
65,298
161,590
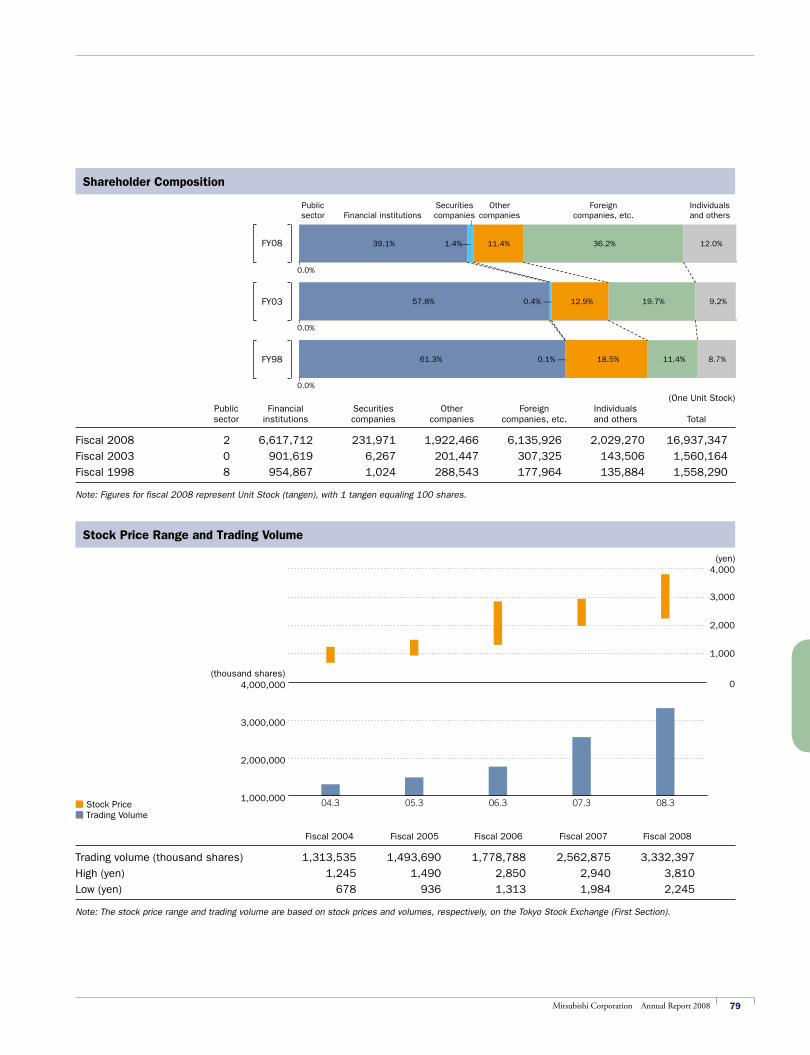
79Mitsubishi Corporation Annual Report 2008
Shareholder Composition
Public Securities Other Foreign Individuals sector Financial institutions companies companies companies, etc. and others
(One Unit Stock) Public Financial Securities Other Foreign Individuals sector institutions companies companies companies, etc. and others Total
Fiscal 2008 2 6,617,712 231,971 1,922,466 6,135,926 2,029,270 16,937,347
Fiscal 2003 0 901,619 6,267 201,447 307,325 143,506 1,560,164
Fiscal 1998 8 954,867 1,024 288,543 177,964 135,884 1,558,290
Note: Figures for fiscal 2008 represent Unit Stock (tangen), with 1 tangen equaling 100 shares.
Stock Price Range and Trading Volume
FY08
FY03
FY98
Fiscal 2004 Fiscal 2005 Fiscal 2006 Fiscal 2007 Fiscal 2008
Trading volume (thousand shares) 1,313,535 1,493,690 1,778,788 2,562,875 3,332,397
High (yen) 1,245 1,490 2,850 2,940 3,810
Low (yen) 678 936 1,313 1,984 2,245
Note: The stock price range and trading volume are based on stock prices and volumes, respectively, on the Tokyo Stock Exchange (First Section).
■ Stock Price ■ Trading Volume
(yen)
(thousand shares)
04.3 06.305.3 07.3 08.31,000,000
2,000,000
3,000,000
4,000,000 0
1,000
2,000
3,000
4,000
39.1% 1.4%— 11.4% 36.2% 12.0%
57.8% 0.4% — 12.9% 19.7% 9.2%
61.3% 0.1% — 18.5% 11.4% 8.7%
0.0%
0.0%
0.0%
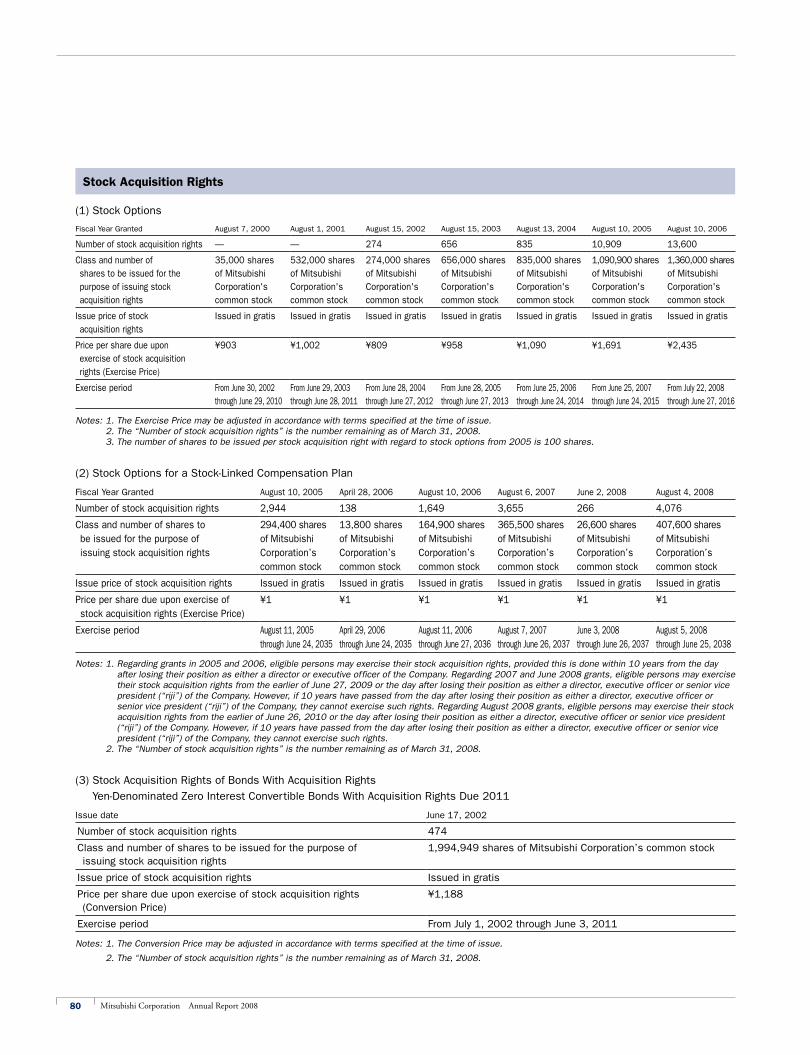
80 Mitsubishi Corporation Annual Report 2008
Stock Acquisition Rights
(1) Stock Options
Fiscal Year Granted August 7, 2000 August 1, 2001 August 15, 2002 August 15, 2003 August 13, 2004 August 10, 2005 August 10, 2006
Number of stock acquisition rights — — 274 656 835 10,909 13,600
Class and number of shares to be issued for the purpose of issuing stock acquisition rights
35,000 shares of Mitsubishi Corporation's common stock
532,000 shares of Mitsubishi Corporation's common stock
274,000 shares of Mitsubishi Corporation's common stock
656,000 shares of Mitsubishi Corporation's common stock
835,000 shares of Mitsubishi Corporation's common stock
1,090,900 shares of Mitsubishi Corporation's common stock
1,360,000 shares of Mitsubishi Corporation's common stock
Issue price of stock acquisition rights
Issued in gratis Issued in gratis Issued in gratis Issued in gratis Issued in gratis Issued in gratis Issued in gratis
Price per share due upon exercise of stock acquisition rights (Exercise Price)
¥903 ¥1,002 ¥809 ¥958 ¥1,090 ¥1,691 ¥2,435
Exercise period From June 30, 2002 through June 29, 2010
From June 29, 2003 through June 28, 2011
From June 28, 2004 through June 27, 2012
From June 28, 2005 through June 27, 2013
From June 25, 2006 through June 24, 2014
From June 25, 2007 through June 24, 2015
From July 22, 2008 through June 27, 2016
Notes: 1. The Exercise Price may be adjusted in accordance with terms specified at the time of issue. 2. The “Number of stock acquisition rights” is the number remaining as of March 31, 2008. 3. The number of shares to be issued per stock acquisition right with regard to stock options from 2005 is 100 shares.
(2) Stock Options for a Stock-Linked Compensation Plan
Fiscal Year Granted August 10, 2005 April 28, 2006 August 10, 2006 August 6, 2007 June 2, 2008 August 4, 2008
Number of stock acquisition rights 2,944 138 1,649 3,655 266 4,076
Class and number of shares to be issued for the purpose of issuing stock acquisition rights
294,400 shares of Mitsubishi Corporation’s common stock
13,800 shares of Mitsubishi Corporation’s common stock
164,900 shares of Mitsubishi Corporation’s common stock
365,500 shares of Mitsubishi Corporation’s common stock
26,600 shares of Mitsubishi Corporation’s common stock
407,600 shares of Mitsubishi Corporation’s common stock
Issue price of stock acquisition rights Issued in gratis Issued in gratis Issued in gratis Issued in gratis Issued in gratis Issued in gratis
Price per share due upon exercise of stock acquisition rights (Exercise Price)
¥1 ¥1 ¥1 ¥1 ¥1 ¥1
Exercise period August 11, 2005 through June 24, 2035
April 29, 2006 through June 24, 2035
August 11, 2006 through June 27, 2036
August 7, 2007 through June 26, 2037
June 3, 2008 through June 26, 2037
August 5, 2008 through June 25, 2038
Notes: 1. Regarding grants in 2005 and 2006, eligible persons may exercise their stock acquisition rights, provided this is done within 10 years from the day after losing their position as either a director or executive officer of the Company. Regarding 2007 and June 2008 grants, eligible persons may exercise their stock acquisition rights from the earlier of June 27, 2009 or the day after losing their position as either a director, executive officer or senior vice president (“riji”) of the Company. However, if 10 years have passed from the day after losing their position as either a director, executive officer or senior vice president (“riji”) of the Company, they cannot exercise such rights. Regarding August 2008 grants, eligible persons may exercise their stock acquisition rights from the earlier of June 26, 2010 or the day after losing their position as either a director, executive officer or senior vice president (“riji”) of the Company. However, if 10 years have passed from the day after losing their position as either a director, executive officer or senior vice president (“riji”) of the Company, they cannot exercise such rights.
2. The “Number of stock acquisition rights” is the number remaining as of March 31, 2008.
(3) Stock Acquisition Rights of Bonds With Acquisition Rights
Yen-Denominated Zero Interest Convertible Bonds With Acquisition Rights Due 2011
Issue date June 17, 2002
Number of stock acquisition rights 474
Class and number of shares to be issued for the purpose of issuing stock acquisition rights
1,994,949 shares of Mitsubishi Corporation’s common stock
Issue price of stock acquisition rights Issued in gratis
Price per share due upon exercise of stock acquisition rights (Conversion Price)
¥1,188
Exercise period From July 1, 2002 through June 3, 2011
Notes: 1. The Conversion Price may be adjusted in accordance with terms specified at the time of issue.
2. The “Number of stock acquisition rights” is the number remaining as of March 31, 2008.
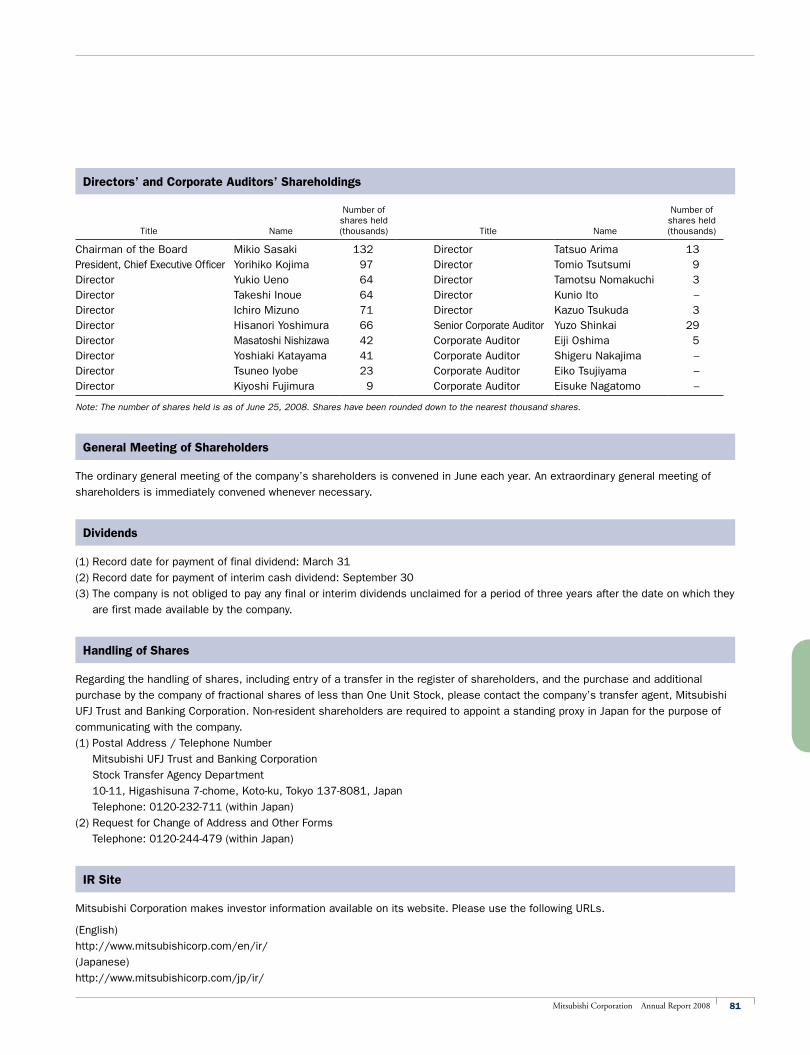
81Mitsubishi Corporation Annual Report 2008
Directors’ and Corporate Auditors’ Shareholdings
Title Name
Number of shares held (thousands) Title
Name
Number of shares held (thousands)
Chairman of the Board Mikio Sasaki 132 Director Tatsuo Arima 13President, Chief Executive Officer Yorihiko Kojima 97 Director Tomio Tsutsumi 9Director Yukio Ueno 64 Director Tamotsu Nomakuchi 3Director Takeshi Inoue 64 Director Kunio Ito –Director Ichiro Mizuno 71 Director Kazuo Tsukuda 3Director Hisanori Yoshimura 66 Senior Corporate Auditor Yuzo Shinkai 29Director Masatoshi Nishizawa 42 Corporate Auditor Eiji Oshima 5Director Yoshiaki Katayama 41 Corporate Auditor Shigeru Nakajima –Director Tsuneo Iyobe 23 Corporate Auditor Eiko Tsujiyama –Director Kiyoshi Fujimura 9 Corporate Auditor Eisuke Nagatomo –
Note: The number of shares held is as of June 25, 2008. Shares have been rounded down to the nearest thousand shares.
General Meeting of Shareholders
The ordinary general meeting of the company’s shareholders is convened in June each year. An extraordinary general meeting of
shareholders is immediately convened whenever necessary.
Dividends
(1) Record date for payment of final dividend: March 31
(2) Record date for payment of interim cash dividend: September 30
(3) The company is not obliged to pay any final or interim dividends unclaimed for a period of three years after the date on which they
are first made available by the company.
Handling of Shares
Regarding the handling of shares, including entry of a transfer in the register of shareholders, and the purchase and additional
p urchase by the company of fractional shares of less than One Unit Stock, please contact the company’s transfer agent, Mitsubishi
UFJ Trust and Banking Corporation. Non-resident shareholders are required to appoint a standing proxy in Japan for the purpose of
communicating with the company.
(1) Postal Address / Telephone Number
Mitsubishi UFJ Trust and Banking Corporation
Stock Transfer Agency Department
10-11, Higashisuna 7-chome, Koto-ku, Tokyo 137-8081, Japan
Telephone: 0120-232-711 (within Japan)
(2) Request for Change of Address and Other Forms
Telephone: 0120-244-479 (within Japan)
IR Site
Mitsubishi Corporation makes investor information available on its website. Please use the following URLs.
(English)
http://www.mitsubishicorp.com/en/ir/
(Japanese)
http://www.mitsubishicorp.com/jp/ir/
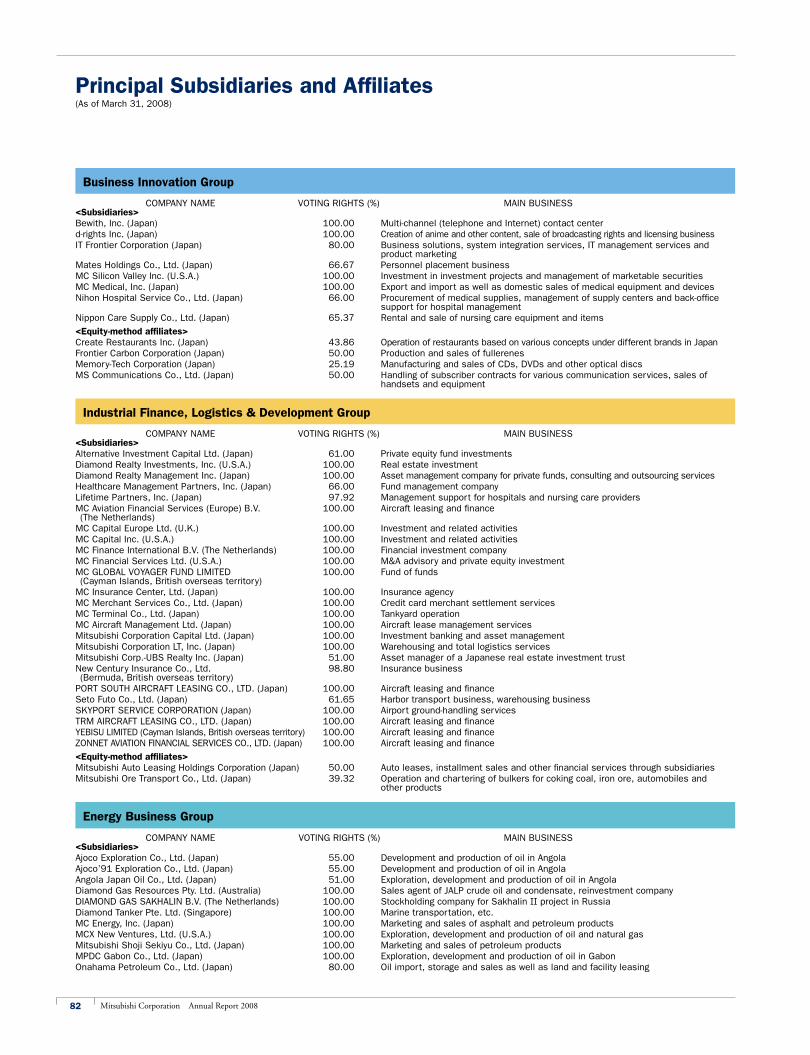
82 Mitsubishi Corporation Annual Report 2008
Business Innovation Group
COMPANY NAME VOTING RIGHTS (%) MAIN BUSINESS<Subsidiaries>Bewith, Inc. (Japan) 100.00 Multi-channel (telephone and Internet) contact centerd-rights Inc. (Japan) 100.00 Creation of anime and other content, sale of broadcasting rights and licensing businessIT Frontier Corporation (Japan) 80.00 Business solutions, system integration services, IT management services and
product marketingMates Holdings Co., Ltd. (Japan) 66.67 Personnel placement businessMC Silicon Valley Inc. (U.S.A.) 100.00 Investment in investment projects and management of marketable securitiesMC Medical, Inc. (Japan) 100.00 Export and import as well as domestic sales of medical equipment and devicesNihon Hospital Service Co., Ltd. (Japan) 66.00 Procurement of medical supplies, management of supply centers and back-office
support for hospital managementNippon Care Supply Co., Ltd. (Japan) 65.37 Rental and sale of nursing care equipment and items
<Equity-method affiliates>Create Restaurants Inc. (Japan) 43.86 Operation of restaurants based on various concepts under different brands in JapanFrontier Carbon Corporation (Japan) 50.00 Production and sales of fullerenesMemory-Tech Corporation (Japan) 25.19 Manufacturing and sales of CDs, DVDs and other optical discsMS Communications Co., Ltd. (Japan) 50.00 Handling of subscriber contracts for various communication services, sales of
handsets and equipment
Industrial Finance, Logistics & Development Group
COMPANY NAME VOTING RIGHTS (%) MAIN BUSINESS<Subsidiaries>Alternative Investment Capital Ltd. (Japan) 61.00 Private equity fund investmentsDiamond Realty Investments, Inc. (U.S.A.) 100.00 Real estate investmentDiamond Realty Management Inc. (Japan) 100.00 Asset management company for private funds, consulting and outsourcing servicesHealthcare Management Partners, Inc. (Japan) 66.00 Fund management companyLifetime Partners, Inc. (Japan) 97.92 Management support for hospitals and nursing care providersMC Aviation Financial Services (Europe) B.V. 100.00 Aircraft leasing and finance (The Netherlands)MC Capital Europe Ltd. (U.K.) 100.00 Investment and related activitiesMC Capital Inc. (U.S.A.) 100.00 Investment and related activitiesMC Finance International B.V. (The Netherlands) 100.00 Financial investment companyMC Financial Services Ltd. (U.S.A.) 100.00 M&A advisory and private equity investmentMC GLOBAL VOYAGER FUND LIMITED 100.00 Fund of funds (Cayman Islands, British overseas territory)MC Insurance Center, Ltd. (Japan) 100.00 Insurance agencyMC Merchant Services Co., Ltd. (Japan) 100.00 Credit card merchant settlement servicesMC Terminal Co., Ltd. (Japan) 100.00 Tankyard operationMC Aircraft Management Ltd. (Japan) 100.00 Aircraft lease management servicesMitsubishi Corporation Capital Ltd. (Japan) 100.00 Investment banking and asset managementMitsubishi Corporation LT, Inc. (Japan) 100.00 Warehousing and total logistics servicesMitsubishi Corp.-UBS Realty Inc. (Japan) 51.00 Asset manager of a Japanese real estate investment trustNew Century Insurance Co., Ltd. 98.80 Insurance business (Bermuda, British overseas territory)PORT SOUTH AIRCRAFT LEASING CO., LTD. (Japan) 100.00 Aircraft leasing and financeSeto Futo Co., Ltd. (Japan) 61.65 Harbor transport business, warehousing businessSKYPORT SERVICE CORPORATION (Japan) 100.00 Airport ground-handling servicesTRM AIRCRAFT LEASING CO., LTD. (Japan) 100.00 Aircraft leasing and financeYEBISU LIMITED (Cayman Islands, British overseas territory) 100.00 Aircraft leasing and financeZONNET AVIATION FINANCIAL SERVICES CO., LTD. (Japan) 100.00 Aircraft leasing and finance
<Equity-method affiliates>Mitsubishi Auto Leasing Holdings Corporation (Japan) 50.00 Auto leases, installment sales and other financial services through subsidiariesMitsubishi Ore Transport Co., Ltd. (Japan) 39.32 Operation and chartering of bulkers for coking coal, iron ore, automobiles and
other products
Energy Business Group
COMPANY NAME VOTING RIGHTS (%) MAIN BUSINESS<Subsidiaries>Ajoco Exploration Co., Ltd. (Japan) 55.00 Development and production of oil in AngolaAjoco’91 Exploration Co., Ltd. (Japan) 55.00 Development and production of oil in AngolaAngola Japan Oil Co., Ltd. (Japan) 51.00 Exploration, development and production of oil in AngolaDiamond Gas Resources Pty. Ltd. (Australia) 100.00 Sales agent of JALP crude oil and condensate, reinvestment companyDIAMOND GAS SAKHALIN B.V. (The Netherlands) 100.00 Stockholding company for Sakhalin II project in RussiaDiamond Tanker Pte. Ltd. (Singapore) 100.00 Marine transportation, etc.MC Energy, Inc. (Japan) 100.00 Marketing and sales of asphalt and petroleum productsMCX New Ventures, Ltd. (U.S.A.) 100.00 Exploration, development and production of oil and natural gasMitsubishi Shoji Sekiyu Co., Ltd. (Japan) 100.00 Marketing and sales of petroleum productsMPDC Gabon Co., Ltd. (Japan) 100.00 Exploration, development and production of oil in GabonOnahama Petroleum Co., Ltd. (Japan) 80.00 Oil import, storage and sales as well as land and facility leasing
Principal Subsidiaries and Affiliates(As of March 31, 2008)
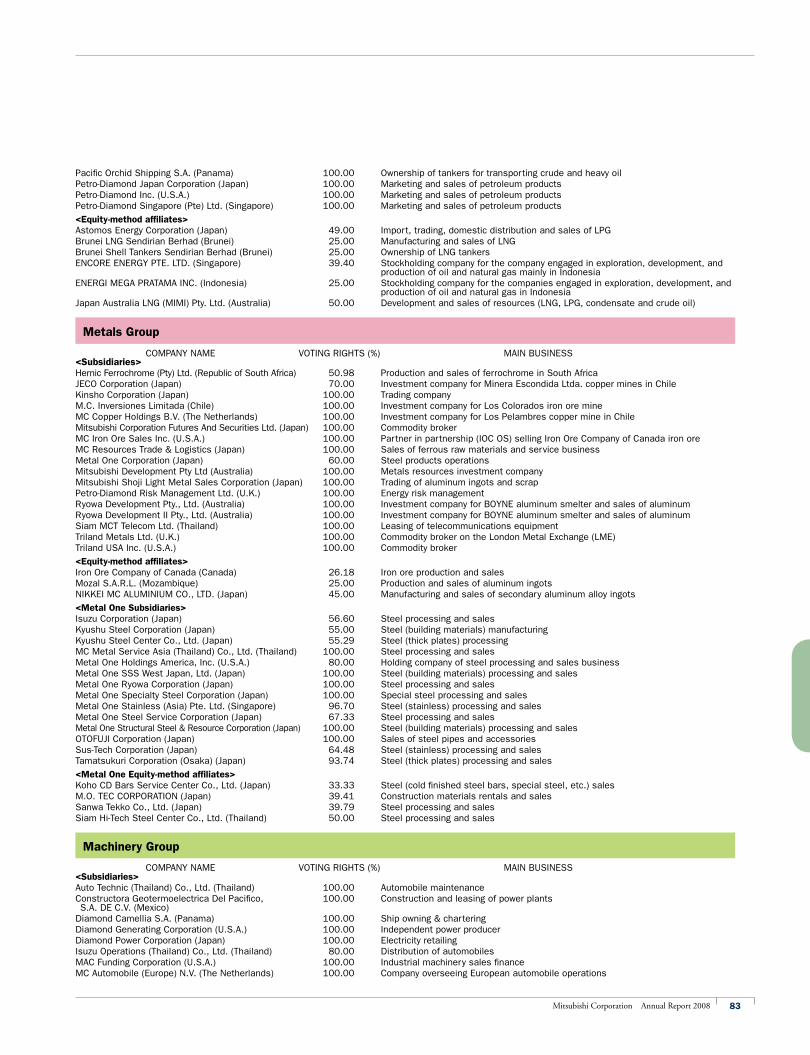
83Mitsubishi Corporation Annual Report 2008
Pacific Orchid Shipping S.A. (Panama) 100.00 Ownership of tankers for transporting crude and heavy oilPetro-Diamond Japan Corporation (Japan) 100.00 Marketing and sales of petroleum productsPetro-Diamond Inc. (U.S.A.) 100.00 Marketing and sales of petroleum productsPetro-Diamond Singapore (Pte) Ltd. (Singapore) 100.00 Marketing and sales of petroleum products
<Equity-method affiliates>Astomos Energy Corporation (Japan) 49.00 Import, trading, domestic distribution and sales of LPGBrunei LNG Sendirian Berhad (Brunei) 25.00 Manufacturing and sales of LNGBrunei Shell Tankers Sendirian Berhad (Brunei) 25.00 Ownership of LNG tankersENCORE ENERGY PTE. LTD. (Singapore) 39.40 Stockholding company for the company engaged in exploration, development, and
production of oil and natural gas mainly in IndonesiaENERGI MEGA PRATAMA INC. (Indonesia) 25.00 Stockholding company for the companies engaged in exploration, development, and
production of oil and natural gas in IndonesiaJapan Australia LNG (MIMI) Pty. Ltd. (Australia) 50.00 Development and sales of resources (LNG, LPG, condensate and crude oil)
Metals Group
COMPANY NAME VOTING RIGHTS (%) MAIN BUSINESS<Subsidiaries>Hernic Ferrochrome (Pty) Ltd. (Republic of South Africa) 50.98 Production and sales of ferrochrome in South AfricaJECO Corporation (Japan) 70.00 Investment company for Minera Escondida Ltda. copper mines in ChileKinsho Corporation (Japan) 100.00 Trading companyM.C. Inversiones Limitada (Chile) 100.00 Investment company for Los Colorados iron ore mineMC Copper Holdings B.V. (The Netherlands) 100.00 Investment company for Los Pelambres copper mine in ChileMitsubishi Corporation Futures And Securities Ltd. (Japan) 100.00 Commodity brokerMC Iron Ore Sales Inc. (U.S.A.) 100.00 Partner in partnership (IOC OS) selling Iron Ore Company of Canada iron oreMC Resources Trade & Logistics (Japan) 100.00 Sales of ferrous raw materials and service businessMetal One Corporation (Japan) 60.00 Steel products operationsMitsubishi Development Pty Ltd (Australia) 100.00 Metals resources investment companyMitsubishi Shoji Light Metal Sales Corporation (Japan) 100.00 Trading of aluminum ingots and scrapPetro-Diamond Risk Management Ltd. (U.K.) 100.00 Energy risk managementRyowa Development Pty., Ltd. (Australia) 100.00 Investment company for BOYNE aluminum smelter and sales of aluminumRyowa Development II Pty., Ltd. (Australia) 100.00 Investment company for BOYNE aluminum smelter and sales of aluminumSiam MCT Telecom Ltd. (Thailand) 100.00 Leasing of telecommunications equipmentTriland Metals Ltd. (U.K.) 100.00 Commodity broker on the London Metal Exchange (LME)Triland USA Inc. (U.S.A.) 100.00 Commodity broker
<Equity-method affiliates>Iron Ore Company of Canada (Canada) 26.18 Iron ore production and salesMozal S.A.R.L. (Mozambique) 25.00 Production and sales of aluminum ingotsNIKKEI MC ALUMINIUM CO., LTD. (Japan) 45.00 Manufacturing and sales of secondary aluminum alloy ingots
<Metal One Subsidiaries>Isuzu Corporation (Japan) 56.60 Steel processing and salesKyushu Steel Corporation (Japan) 55.00 Steel (building materials) manufacturingKyushu Steel Center Co., Ltd. (Japan) 55.29 Steel (thick plates) processingMC Metal Service Asia (Thailand) Co., Ltd. (Thailand) 100.00 Steel processing and salesMetal One Holdings America, Inc. (U.S.A.) 80.00 Holding company of steel processing and sales businessMetal One SSS West Japan, Ltd. (Japan) 100.00 Steel (building materials) processing and salesMetal One Ryowa Corporation (Japan) 100.00 Steel processing and salesMetal One Specialty Steel Corporation (Japan) 100.00 Special steel processing and salesMetal One Stainless (Asia) Pte. Ltd. (Singapore) 96.70 Steel (stainless) processing and salesMetal One Steel Service Corporation (Japan) 67.33 Steel processing and salesMetal One Structural Steel & Resource Corporation (Japan) 100.00 Steel (building materials) processing and salesOTOFUJI Corporation (Japan) 100.00 Sales of steel pipes and accessoriesSus-Tech Corporation (Japan) 64.48 Steel (stainless) processing and salesTamatsukuri Corporation (Osaka) (Japan) 93.74 Steel (thick plates) processing and sales
<Metal One Equity-method affiliates>Koho CD Bars Service Center Co., Ltd. (Japan) 33.33 Steel (cold finished steel bars, special steel, etc.) salesM.O. TEC CORPORATION (Japan) 39.41 Construction materials rentals and sales Sanwa Tekko Co., Ltd. (Japan) 39.79 Steel processing and salesSiam Hi-Tech Steel Center Co., Ltd. (Thailand) 50.00 Steel processing and sales
Machinery Group
COMPANY NAME VOTING RIGHTS (%) MAIN BUSINESS<Subsidiaries>Auto Technic (Thailand) Co., Ltd. (Thailand) 100.00 Automobile maintenanceConstructora Geotermoelectrica Del Pacifico, 100.00 Construction and leasing of power plants S.A. DE C.V. (Mexico)Diamond Camellia S.A. (Panama) 100.00 Ship owning & charteringDiamond Generating Corporation (U.S.A.) 100.00 Independent power producerDiamond Power Corporation (Japan) 100.00 Electricity retailingIsuzu Operations (Thailand) Co., Ltd. (Thailand) 80.00 Distribution of automobilesMAC Funding Corporation (U.S.A.) 100.00 Industrial machinery sales financeMC Automobile (Europe) N.V. (The Netherlands) 100.00 Company overseeing European automobile operations
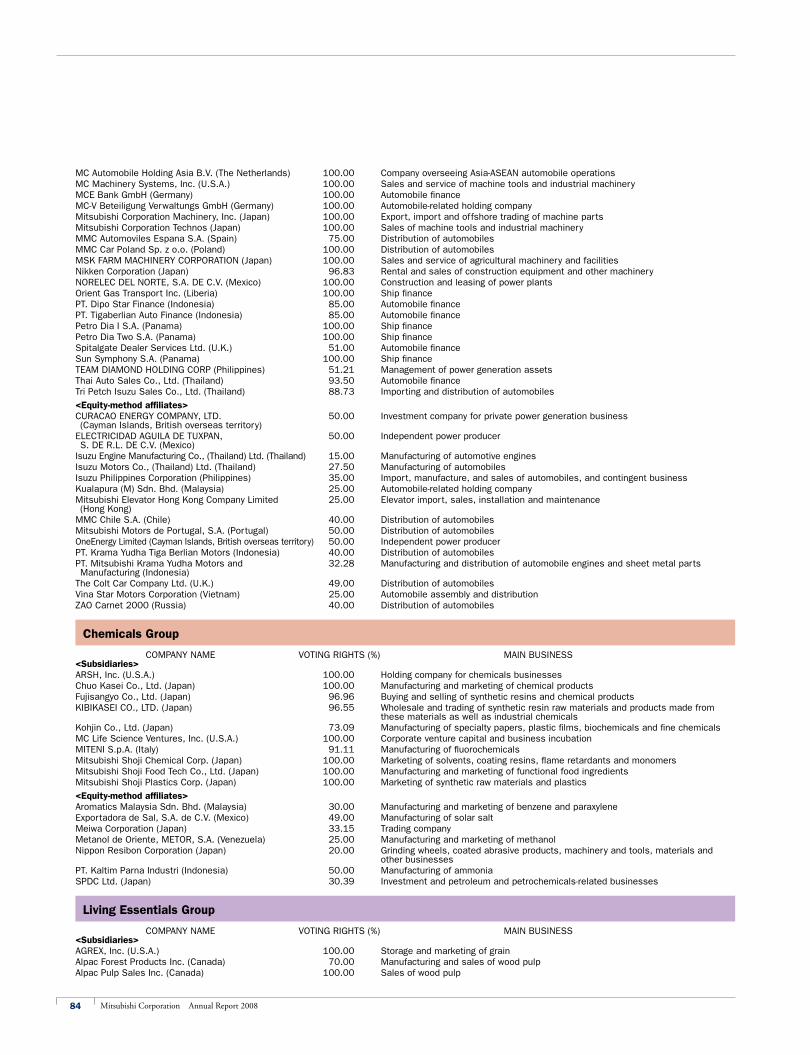
84 Mitsubishi Corporation Annual Report 2008
MC Automobile Holding Asia B.V. (The Netherlands) 100.00 Company overseeing Asia-ASEAN automobile operationsMC Machinery Systems, Inc. (U.S.A.) 100.00 Sales and service of machine tools and industrial machineryMCE Bank GmbH (Germany) 100.00 Automobile financeMC-V Beteiligung Verwaltungs GmbH (Germany) 100.00 Automobile-related holding companyMitsubishi Corporation Machinery, Inc. (Japan) 100.00 Export, import and offshore trading of machine partsMitsubishi Corporation Technos (Japan) 100.00 Sales of machine tools and industrial machineryMMC Automoviles Espana S.A. (Spain) 75.00 Distribution of automobilesMMC Car Poland Sp. z o.o. (Poland) 100.00 Distribution of automobilesMSK FARM MACHINERY CORPORATION (Japan) 100.00 Sales and service of agricultural machinery and facilitiesNikken Corporation (Japan) 96.83 Rental and sales of construction equipment and other machineryNORELEC DEL NORTE, S.A. DE C.V. (Mexico) 100.00 Construction and leasing of power plantsOrient Gas Transport Inc. (Liberia) 100.00 Ship financePT. Dipo Star Finance (Indonesia) 85.00 Automobile financePT. Tigaberlian Auto Finance (Indonesia) 85.00 Automobile financePetro Dia I S.A. (Panama) 100.00 Ship financePetro Dia Two S.A. (Panama) 100.00 Ship financeSpitalgate Dealer Services Ltd. (U.K.) 51.00 Automobile financeSun Symphony S.A. (Panama) 100.00 Ship financeTEAM DIAMOND HOLDING CORP (Philippines) 51.21 Management of power generation assetsThai Auto Sales Co., Ltd. (Thailand) 93.50 Automobile financeTri Petch Isuzu Sales Co., Ltd. (Thailand) 88.73 Importing and distribution of automobiles
<Equity-method affiliates>CURACAO ENERGY COMPANY, LTD. 50.00 Investment company for private power generation business (Cayman Islands, British overseas territory)ELECTRICIDAD AGUILA DE TUXPAN, 50.00 Independent power producer S. DE R.L. DE C.V. (Mexico) Isuzu Engine Manufacturing Co., (Thailand) Ltd. (Thailand) 15.00 Manufacturing of automotive enginesIsuzu Motors Co., (Thailand) Ltd. (Thailand) 27.50 Manufacturing of automobilesIsuzu Philippines Corporation (Philippines) 35.00 Import, manufacture, and sales of automobiles, and contingent businessKualapura (M) Sdn. Bhd. (Malaysia) 25.00 Automobile-related holding companyMitsubishi Elevator Hong Kong Company Limited 25.00 Elevator import, sales, installation and maintenance (Hong Kong)MMC Chile S.A. (Chile) 40.00 Distribution of automobilesMitsubishi Motors de Portugal, S.A. (Portugal) 50.00 Distribution of automobilesOneEnergy Limited (Cayman Islands, British overseas territory) 50.00 Independent power producerPT. Krama Yudha Tiga Berlian Motors (Indonesia) 40.00 Distribution of automobilesPT. Mitsubishi Krama Yudha Motors and 32.28 Manufacturing and distribution of automobile engines and sheet metal parts Manufacturing (Indonesia) The Colt Car Company Ltd. (U.K.) 49.00 Distribution of automobilesVina Star Motors Corporation (Vietnam) 25.00 Automobile assembly and distributionZAO Carnet 2000 (Russia) 40.00 Distribution of automobiles
Chemicals Group
COMPANY NAME VOTING RIGHTS (%) MAIN BUSINESS<Subsidiaries>ARSH, Inc. (U.S.A.) 100.00 Holding company for chemicals businessesChuo Kasei Co., Ltd. (Japan) 100.00 Manufacturing and marketing of chemical productsFujisangyo Co., Ltd. (Japan) 96.96 Buying and selling of synthetic resins and chemical productsKIBIKASEI CO., LTD. (Japan) 96.55 Wholesale and trading of synthetic resin raw materials and products made from
these materials as well as industrial chemicalsKohjin Co., Ltd. (Japan) 73.09 Manufacturing of specialty papers, plastic films, biochemicals and fine chemicalsMC Life Science Ventures, Inc. (U.S.A.) 100.00 Corporate venture capital and business incubationMITENI S.p.A. (Italy) 91.11 Manufacturing of fluorochemicalsMitsubishi Shoji Chemical Corp. (Japan) 100.00 Marketing of solvents, coating resins, flame retardants and monomersMitsubishi Shoji Food Tech Co., Ltd. (Japan) 100.00 Manufacturing and marketing of functional food ingredientsMitsubishi Shoji Plastics Corp. (Japan) 100.00 Marketing of synthetic raw materials and plastics
<Equity-method affiliates>Aromatics Malaysia Sdn. Bhd. (Malaysia) 30.00 Manufacturing and marketing of benzene and paraxyleneExportadora de Sal, S.A. de C.V. (Mexico) 49.00 Manufacturing of solar saltMeiwa Corporation (Japan) 33.15 Trading companyMetanol de Oriente, METOR, S.A. (Venezuela) 25.00 Manufacturing and marketing of methanolNippon Resibon Corporation (Japan) 20.00 Grinding wheels, coated abrasive products, machinery and tools, materials and
other businessesPT. Kaltim Parna Industri (Indonesia) 50.00 Manufacturing of ammoniaSPDC Ltd. (Japan) 30.39 Investment and petroleum and petrochemicals-related businesses
Living Essentials Group
COMPANY NAME VOTING RIGHTS (%) MAIN BUSINESS<Subsidiaries>AGREX, Inc. (U.S.A.) 100.00 Storage and marketing of grainAlpac Forest Products Inc. (Canada) 70.00 Manufacturing and sales of wood pulpAlpac Pulp Sales Inc. (Canada) 100.00 Sales of wood pulp
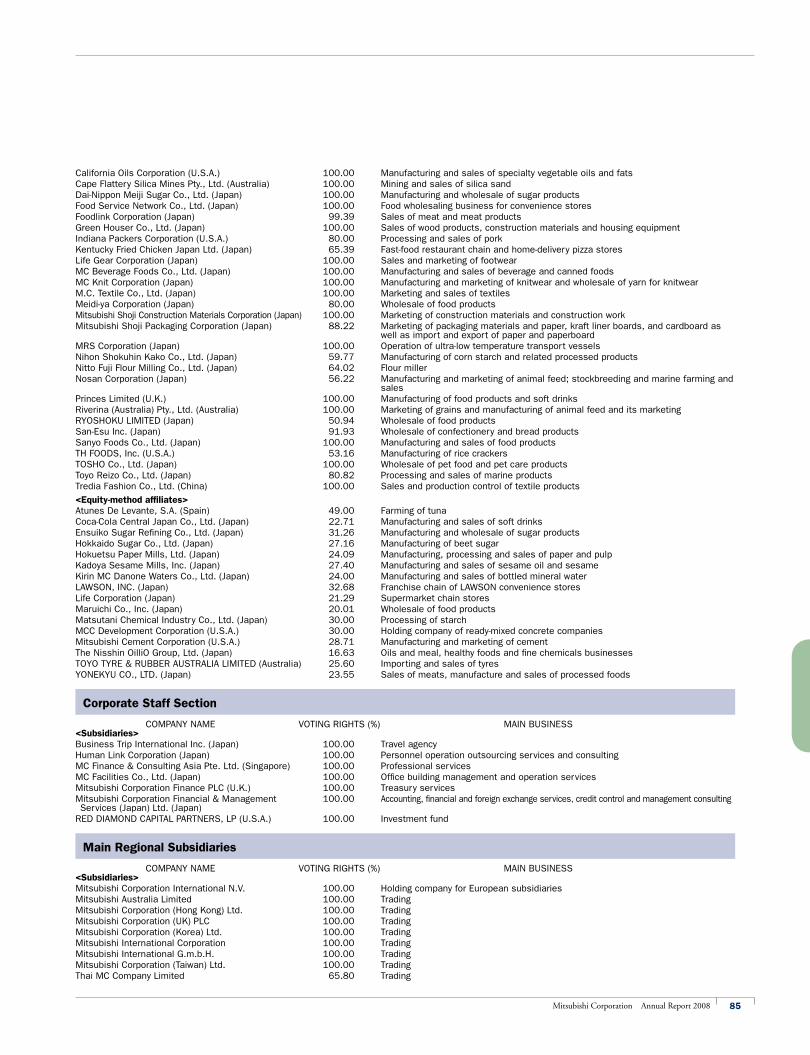
85Mitsubishi Corporation Annual Report 2008
California Oils Corporation (U.S.A.) 100.00 Manufacturing and sales of specialty vegetable oils and fatsCape Flattery Silica Mines Pty., Ltd. (Australia) 100.00 Mining and sales of silica sandDai-Nippon Meiji Sugar Co., Ltd. (Japan) 100.00 Manufacturing and wholesale of sugar productsFood Service Network Co., Ltd. (Japan) 100.00 Food wholesaling business for convenience storesFoodlink Corporation (Japan) 99.39 Sales of meat and meat productsGreen Houser Co., Ltd. (Japan) 100.00 Sales of wood products, construction materials and housing equipmentIndiana Packers Corporation (U.S.A.) 80.00 Processing and sales of porkKentucky Fried Chicken Japan Ltd. (Japan) 65.39 Fast-food restaurant chain and home-delivery pizza storesLife Gear Corporation (Japan) 100.00 Sales and marketing of footwearMC Beverage Foods Co., Ltd. (Japan) 100.00 Manufacturing and sales of beverage and canned foodsMC Knit Corporation (Japan) 100.00 Manufacturing and marketing of knitwear and wholesale of yarn for knitwearM.C. Textile Co., Ltd. (Japan) 100.00 Marketing and sales of textilesMeidi-ya Corporation (Japan) 80.00 Wholesale of food productsMitsubishi Shoji Construction Materials Corporation (Japan) 100.00 Marketing of construction materials and construction workMitsubishi Shoji Packaging Corporation (Japan) 88.22 Marketing of packaging materials and paper, kraft liner boards, and cardboard as
well as import and export of paper and paperboardMRS Corporation (Japan) 100.00 Operation of ultra-low temperature transport vesselsNihon Shokuhin Kako Co., Ltd. (Japan) 59.77 Manufacturing of corn starch and related processed productsNitto Fuji Flour Milling Co., Ltd. (Japan) 64.02 Flour millerNosan Corporation (Japan) 56.22 Manufacturing and marketing of animal feed; stockbreeding and marine farming and
salesPrinces Limited (U.K.) 100.00 Manufacturing of food products and soft drinksRiverina (Australia) Pty., Ltd. (Australia) 100.00 Marketing of grains and manufacturing of animal feed and its marketingRYOSHOKU LIMITED (Japan) 50.94 Wholesale of food productsSan-Esu Inc. (Japan) 91.93 Wholesale of confectionery and bread productsSanyo Foods Co., Ltd. (Japan) 100.00 Manufacturing and sales of food productsTH FOODS, Inc. (U.S.A.) 53.16 Manufacturing of rice crackersTOSHO Co., Ltd. (Japan) 100.00 Wholesale of pet food and pet care productsToyo Reizo Co., Ltd. (Japan) 80.82 Processing and sales of marine productsTredia Fashion Co., Ltd. (China) 100.00 Sales and production control of textile products
<Equity-method affiliates> Atunes De Levante, S.A. (Spain) 49.00 Farming of tunaCoca-Cola Central Japan Co., Ltd. (Japan) 22.71 Manufacturing and sales of soft drinksEnsuiko Sugar Refining Co., Ltd. (Japan) 31.26 Manufacturing and wholesale of sugar productsHokkaido Sugar Co., Ltd. (Japan) 27.16 Manufacturing of beet sugarHokuetsu Paper Mills, Ltd. (Japan) 24.09 Manufacturing, processing and sales of paper and pulpKadoya Sesame Mills, Inc. (Japan) 27.40 Manufacturing and sales of sesame oil and sesameKirin MC Danone Waters Co., Ltd. (Japan) 24.00 Manufacturing and sales of bottled mineral waterLAWSON, INC. (Japan) 32.68 Franchise chain of LAWSON convenience storesLife Corporation (Japan) 21.29 Supermarket chain storesMaruichi Co., Inc. (Japan) 20.01 Wholesale of food productsMatsutani Chemical Industry Co., Ltd. (Japan) 30.00 Processing of starchMCC Development Corporation (U.S.A.) 30.00 Holding company of ready-mixed concrete companiesMitsubishi Cement Corporation (U.S.A.) 28.71 Manufacturing and marketing of cementThe Nisshin OilliO Group, Ltd. (Japan) 16.63 Oils and meal, healthy foods and fine chemicals businessesTOYO TYRE & RUBBER AUSTRALIA LIMITED (Australia) 25.60 Importing and sales of tyresYONEKYU CO., LTD. (Japan) 23.55 Sales of meats, manufacture and sales of processed foods
Corporate Staff Section
COMPANY NAME VOTING RIGHTS (%) MAIN BUSINESS<Subsidiaries>Business Trip International Inc. (Japan) 100.00 Travel agencyHuman Link Corporation (Japan) 100.00 Personnel operation outsourcing services and consultingMC Finance & Consulting Asia Pte. Ltd. (Singapore) 100.00 Professional servicesMC Facilities Co., Ltd. (Japan) 100.00 Office building management and operation servicesMitsubishi Corporation Finance PLC (U.K.) 100.00 Treasury servicesMitsubishi Corporation Financial & Management 100.00 Accounting, financial and foreign exchange services, credit control and management consulting Services (Japan) Ltd. (Japan)RED DIAMOND CAPITAL PARTNERS, LP (U.S.A.) 100.00 Investment fund
Main Regional Subsidiaries
COMPANY NAME VOTING RIGHTS (%) MAIN BUSINESS<Subsidiaries>Mitsubishi Corporation International N.V. 100.00 Holding company for European subsidiariesMitsubishi Australia Limited 100.00 TradingMitsubishi Corporation (Hong Kong) Ltd. 100.00 TradingMitsubishi Corporation (UK) PLC 100.00 TradingMitsubishi Corporation (Korea) Ltd. 100.00 TradingMitsubishi International Corporation 100.00 TradingMitsubishi International G.m.b.H. 100.00 TradingMitsubishi Corporation (Taiwan) Ltd. 100.00 TradingThai MC Company Limited 65.80 Trading
86 Mitsubishi Corporation Annual Report 2008
Financial Section
88 Management’s Discussion and Analysis of
Financial Condition and Results of Operations
114 Six-Year Financial Summary
116 Consolidated Balance Sheets
118 Consolidated Statements of Income
119 Consolidated Statements of Comprehensive Income
120 Consolidated Statements of Shareholders’ Equity
121 Consolidated Statements of Cash Flows
122 Notes to Consolidated Financial Statements
158 Independent Auditors’ Report
159 Responsibility Statement
87Mitsubishi Corporation Annual Report 2008
The Three Corporate Principles and the Corporate Standards of Conduct, the cornerstones of our corporate philoso-
phy, underpin our system for ensuring the fairness of financial information. These are the basis upon which we have
established internal regulations and ensure that all employees comply with these regulations. Furthermore, we have
made public a Corporate Disclosure Policy that prescribes our basic position with respect to the release of significant
information in accordance with laws such as the Financial Instruments and Exchange Law and the Companies Act in
Japan and regulations of the Tokyo Stock Exchange.
Furthermore, we maintain an effective framework for deciding on important management issues. Such issues are
first discussed and decisions are reached by the Executive Committee, MC’s highest-ranking decision-making body of
executive officers, and then passed on to the Board of Directors for a final resolution. Moreover, the status of busi-
ness execution and other important management information is reported to the Executive Committee and the Board
of Directors. Regarding business processes and the status of management, the Internal Audit Dept. and internal
audit organizations of individual business groups and overseas offices conduct internal audits, including of affiliated
companies. The results of each internal audit are reported to the president, corporate auditors and other concerned
parties as well as to the Board of Directors and Executive Committee.
Based on this internal framework, we have clarified the division of duties and responsibilities for preparing finan-
cial information. Accounting procedures are performed in accordance with internal regulations based on the mainte-
nance of an adequate administrative system in each responsible division.
Since fiscal 2005, MC has had an Internal Control and Disclosure Committee, made up of representatives from
internal departments associated with the preparation of financial reports. This committee, which I chair, evaluated
the information contained in the financial section of this annual report for the year ended March 31, 2008 and con-
firmed that the content is adequate. Regarding the consolidated financial statements included in this annual report,
we received an unqualified audit report from the independent auditors following a strict external audit.
Management is responsible for establishing adequate systems of internal control and financial reporting as above.
Ichiro MizunoSenior Executive Vice President,Chief Financial OfficerMitsubishi Corporation
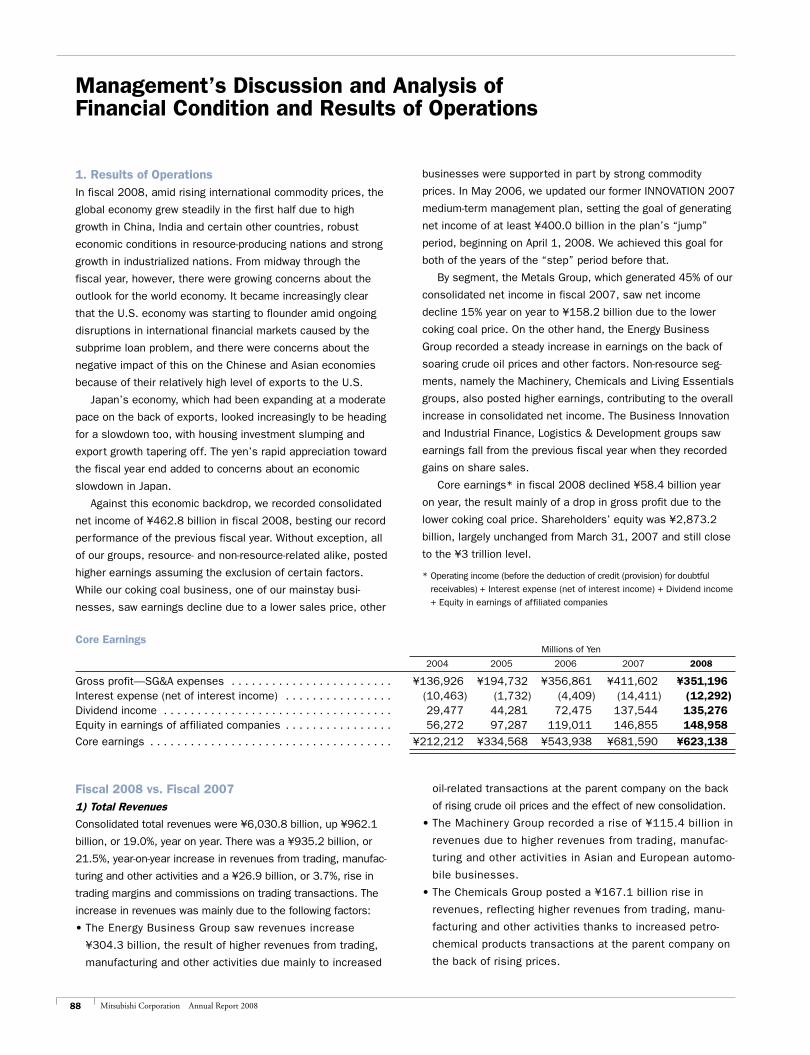
88 Mitsubishi Corporation Annual Report 2008
Management’s Discussion and Analysis of Financial Condition and Results of Operations
1. Results of OperationsIn fiscal 2008, amid rising international commodity prices, the
global economy grew steadily in the first half due to high
growth in China, India and certain other countries, robust
economic conditions in resource-producing nations and strong
growth in industrialized nations. From midway through the
fiscal year, however, there were growing concerns about the
outlook for the world economy. It became increasingly clear
that the U.S. economy was starting to flounder amid ongoing
disruptions in international financial markets caused by the
subprime loan problem, and there were concerns about the
negative impact of this on the Chinese and Asian economies
because of their relatively high level of exports to the U.S.
Japan’s economy, which had been expanding at a moderate
pace on the back of exports, looked increasingly to be heading
for a slowdown too, with housing investment slumping and
export growth tapering off. The yen’s rapid appreciation toward
the fiscal year end added to concerns about an economic
slowdown in Japan.
Against this economic backdrop, we recorded consolidated
net income of ¥462.8 billion in fiscal 2008, besting our record
performance of the previous fiscal year. Without exception, all
of our groups, resource- and non-resource-related alike, posted
higher earnings assuming the exclusion of certain factors.
While our coking coal business, one of our mainstay busi-
nesses, saw earnings decline due to a lower sales price, other
businesses were supported in part by strong commodity
prices. In May 2006, we updated our former INNOVATION 2007
medium-term management plan, setting the goal of generating
net income of at least ¥400.0 billion in the plan’s “jump”
period, beginning on April 1, 2008. We achieved this goal for
both of the years of the “step” period before that.
By segment, the Metals Group, which generated 45% of our
consolidated net income in fiscal 2007, saw net income
decline 15% year on year to ¥158.2 billion due to the lower
coking coal price. On the other hand, the Energy Business
Group recorded a steady increase in earnings on the back of
soaring crude oil prices and other factors. Non-resource seg-
ments, namely the Machinery, Chemicals and Living Essentials
groups, also posted higher earnings, contributing to the overall
increase in consolidated net income. The Business Innovation
and Industrial Finance, Logistics & Development groups saw
earnings fall from the previous fiscal year when they recorded
gains on share sales.
Core earnings* in fiscal 2008 declined ¥58.4 billion year
on year, the result mainly of a drop in gross profit due to the
lower coking coal price. Shareholders’ equity was ¥2,873.2
billion, largely unchanged from March 31, 2007 and still close
to the ¥3 trillion level.
* Operating income (before the deduction of credit (provision) for doubtful
receivables) + Interest expense (net of interest income) + Dividend income
+ Equity in earnings of affiliated companies
Core Earnings Millions of Yen
2004 2005 2006 2007 2008
Gross profit—SG&A expenses . . . . . . . . . . . . . . . . . . . . . . . . ¥136,926 ¥194,732 ¥356,861 ¥411,602 ¥351,196Interest expense (net of interest income) . . . . . . . . . . . . . . . . (10,463) (1,732) (4,409) (14,411) (12,292)Dividend income . . . . . . . . . . . . . . . . . . . . . . . . . . . . . . . . . . 29,477 44,281 72,475 137,544 135,276Equity in earnings of affiliated companies . . . . . . . . . . . . . . . . 56,272 97,287 119,011 146,855 148,958
Core earnings . . . . . . . . . . . . . . . . . . . . . . . . . . . . . . . . . . . . ¥212,212 ¥334,568 ¥543,938 ¥681,590 ¥623,138
Fiscal 2008 vs. Fiscal 20071) Total Revenues
Consolidated total revenues were ¥6,030.8 billion, up ¥962.1
billion, or 19.0%, year on year. There was a ¥935.2 billion, or
21.5%, year-on-year increase in revenues from trading, manufac-
turing and other activities and a ¥26.9 billion, or 3.7%, rise in
trading margins and commissions on trading transactions. The
increase in revenues was mainly due to the following factors:
•TheEnergyBusinessGroupsawrevenuesincrease
¥304.3 billion, the result of higher revenues from trading,
manufacturing and other activities due mainly to increased
oil-related transactions at the parent company on the back
of rising crude oil prices and the effect of new consolidation.
•TheMachineryGrouprecordedariseof¥115.4billionin
revenues due to higher revenues from trading, manufac-
turing and other activities in Asian and European automo-
bile businesses.
•TheChemicalsGroupposteda¥167.1billionrisein
revenues, reflecting higher revenues from trading, manu-
facturing and other activities thanks to increased petro-
chemical products transactions at the parent company on
the back of rising prices.
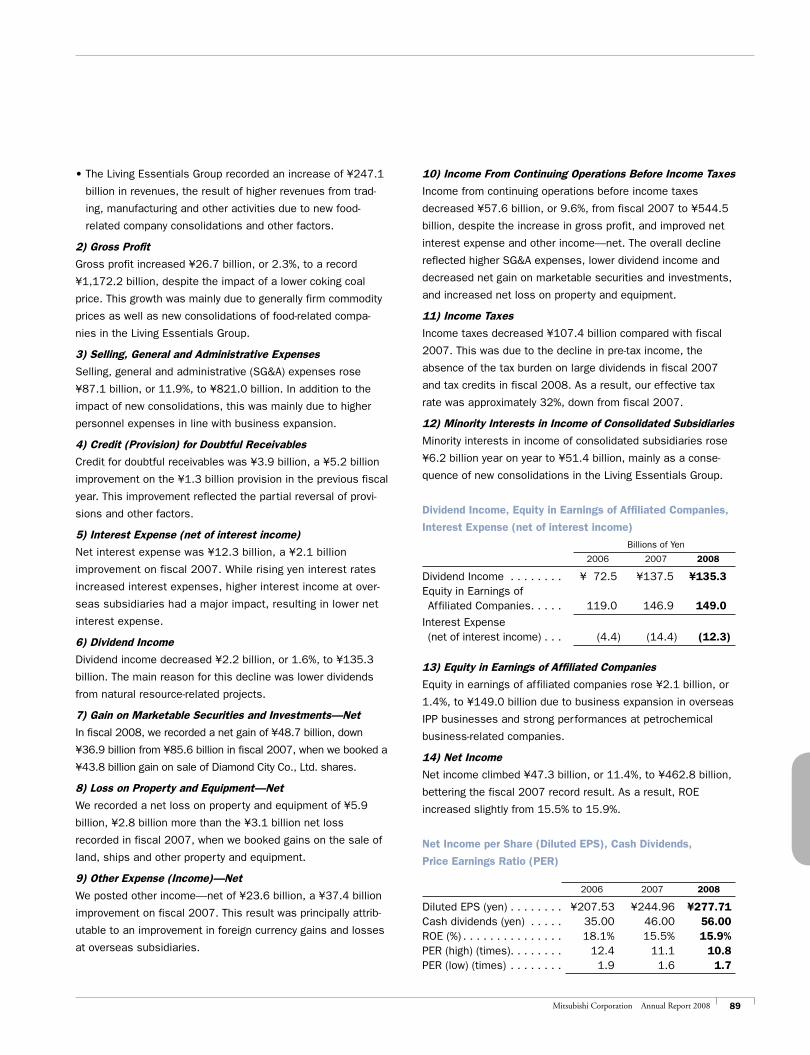
89Mitsubishi Corporation Annual Report 2008
•TheLivingEssentialsGrouprecordedanincreaseof¥247.1
billion in revenues, the result of higher revenues from trad-
ing, manufacturing and other activities due to new food-
related company consolidations and other factors.
2) Gross Profit
Gross profit increased ¥26.7 billion, or 2.3%, to a record
¥1,172.2 billion, despite the impact of a lower coking coal
price. This growth was mainly due to generally firm commodity
prices as well as new consolidations of food-related compa-
nies in the Living Essentials Group.
3) Selling, General and Administrative Expenses
Selling, general and administrative (SG&A) expenses rose
¥87.1 billion, or 11.9%, to ¥821.0 billion. In addition to the
impact of new consolidations, this was mainly due to higher
personnel expenses in line with business expansion.
4) Credit (Provision) for Doubtful Receivables
Credit for doubtful receivables was ¥3.9 billion, a ¥5.2 billion
improvement on the ¥1.3 billion provision in the previous fiscal
year. This improvement reflected the partial reversal of provi-
sions and other factors.
5) Interest Expense (net of interest income)
Net interest expense was ¥12.3 billion, a ¥2.1 billion
improvement on fiscal 2007. While rising yen interest rates
increased interest expenses, higher interest income at over-
seas subsidiaries had a major impact, resulting in lower net
interest expense.
6) Dividend Income
Dividend income decreased ¥2.2 billion, or 1.6%, to ¥135.3
billion. The main reason for this decline was lower dividends
from natural resource-related projects.
7) Gain on Marketable Securities and Investments—Net
In fiscal 2008, we recorded a net gain of ¥48.7 billion, down
¥36.9 billion from ¥85.6 billion in fiscal 2007, when we booked a
¥43.8 billion gain on sale of Diamond City Co., Ltd. shares.
8) Loss on Property and Equipment—Net
We recorded a net loss on property and equipment of ¥5.9
billion, ¥2.8 billion more than the ¥3.1 billion net loss
recorded in fiscal 2007, when we booked gains on the sale of
land, ships and other property and equipment.
9) Other Expense (Income)—Net
We posted other income—net of ¥23.6 billion, a ¥37.4 billion
improvement on fiscal 2007. This result was principally attrib-
utable to an improvement in foreign currency gains and losses
at overseas subsidiaries.
10) Income From Continuing Operations Before Income Taxes
Income from continuing operations before income taxes
decreased ¥57.6 billion, or 9.6%, from fiscal 2007 to ¥544.5
billion, despite the increase in gross profit, and improved net
interest expense and other income—net. The overall decline
reflected higher SG&A expenses, lower dividend income and
decreased net gain on marketable securities and investments,
and increased net loss on property and equipment.
11) Income Taxes
Income taxes decreased ¥107.4 billion compared with fiscal
2007. This was due to the decline in pre-tax income, the
absence of the tax burden on large dividends in fiscal 2007
and tax credits in fiscal 2008. As a result, our effective tax
rate was approximately 32%, down from fiscal 2007.
12) Minority Interests in Income of Consolidated Subsidiaries
Minority interests in income of consolidated subsidiaries rose
¥6.2 billion year on year to ¥51.4 billion, mainly as a conse-
quence of new consolidations in the Living Essentials Group.
Dividend Income, Equity in Earnings of Affiliated Companies,
Interest Expense (net of interest income)
Billions of Yen
2006 2007 2008
Dividend Income . . . . . . . . ¥ 72.5 ¥137.5 ¥135.3Equity in Earnings of Affiliated Companies . . . . . 119.0 146.9 149.0
Interest Expense (net of interest income) . . . (4.4) (14.4) (12.3)
13) Equity in Earnings of Affiliated Companies
Equity in earnings of affiliated companies rose ¥2.1 billion, or
1.4%, to ¥149.0 billion due to business expansion in overseas
IPP businesses and strong performances at petrochemical
business-related companies.
14) Net Income
Net income climbed ¥47.3 billion, or 11.4%, to ¥462.8 billion,
bettering the fiscal 2007 record result. As a result, ROE
increased slightly from 15.5% to 15.9%.
Net Income per Share (Diluted EPS), Cash Dividends,
Price Earnings Ratio (PER)
2006 2007 2008
Diluted EPS (yen) . . . . . . . . ¥207.53 ¥244.96 ¥277.71Cash dividends (yen) . . . . . 35.00 46.00 56.00ROE (%) . . . . . . . . . . . . . . . 18.1% 15.5% 15.9%PER (high) (times). . . . . . . . 12.4 11.1 10.8PER (low) (times) . . . . . . . . 1.9 1.6 1.7
90 Mitsubishi Corporation Annual Report 2008
Fiscal 2007 vs. Fiscal 20061) Total Revenues
Consolidated total revenues were ¥5,068.7 billion, up ¥256.6
billion, or 5.3%, year on year, due to a ¥221.0 billion, or 5.4%,
rise in revenues from trading, manufacturing and other activi-
ties and a ¥35.6 billion, or 5.2%, increase in trading margins
and commissions on trading transactions. The main reasons
for this result were as follows:
•TheEnergyBusinessGroupsawrevenuesdecline¥281.3
billion due to a decline in revenues from trading, manufactur-
ing and other activities, which resulted from the separation
and transfer of parent company LPG transactions to the
newly established Astomos Energy Corporation.
•TheMetalsGroupsawrevenuesincrease¥224.8billionoverall
on higher revenues from trading, manufacturing and other
activities, notably precious metals transactions at the parent
company and at Mitsubishi Development Pty. Ltd. (“MDP”).
•TheChemicalsGrouprecordedanoverallincreaseinrev-
enues of ¥126.5 billion, resulting from higher revenues from
trading, manufacturing and other activities due to increased
petrochemical product and other transactions at the parent
company because of higher prices.
•TheLivingEssentialsGroupsawrevenuesrise¥113.0
billion, reflecting increased revenues from trading, manufac-
turing and other activities, which was attributable mainly to
higher food-related transactions at the parent company and
overseas food-related subsidiaries.
2) Gross Profit
Gross profit increased ¥92.5 billion, or 8.8%, to a record ¥1,145.5
billion. This growth reflected strong performances at natural
resource-related subsidiaries due to higher coking coal and crude
oil prices and the consolidation of an overseas automotive-related
company, in addition to highly favorable food-related transactions at
Mitsubishi Corporation and domestic subsidiaries.
3) Selling, General and Administrative Expenses
Selling, general and administrative (SG&A) expenses rose
¥37.8 billion, or 5.4%, to ¥733.9 billion, despite lower person-
nel and facility expenses at Mitsubishi Corporation. The
increase in SG&A expenses was the result of new consolida-
tions at a U.S. regional subsidiary, the consolidation of a
European automotive-related company and higher costs accom-
panying the commencement of operations at a distribution
center run by a food-related subsidiary.
4) Provision for Doubtful Receivables
Provision for doubtful receivables was ¥1.3 billion, ¥3.3 billion
less than the ¥4.6 billion recorded in fiscal 2006.
5) Interest Expense (net of interest income)
Net interest expense was ¥14.4 billion, ¥10.0 billion higher
year on year, the result mainly of an increase in interest
expenses at Mitsubishi Corporation and subsidiaries due to
higher interest rates on borrowed funds.
6) Dividend Income
Dividend income rose sharply to ¥137.5 billion, a ¥65.1 bil-
lion, or 89.8%, increase from fiscal 2006. This was the result
of a large increase in dividends due to strong performances at
resource-related companies consistent with increase in the
prices of crude oil and non-ferrous metals.
7) Gain on Marketable Securities and Investments—Net
In fiscal 2007, we recorded a net gain of ¥85.6 billion, up
¥33.9 billion from ¥51.7 billion in fiscal 2006. The largest
contributor was a ¥43.8 billion gain on the sale of Diamond
City Co., Ltd. shares.
8) Loss on Property and Equipment—Net
We recorded a net loss on property and equipment of ¥3.1
billion, ¥1.0 billion more than the ¥2.1 billion net loss
recorded in fiscal 2006.
9) Other Expense (Income)—Net
We posted other expense—net of ¥13.9 billion, compared with
other income—net of ¥18.3 billion in fiscal 2006. The ¥32.2
billion change was primarily the result of higher foreign
exchange losses at overseas subsidiaries.
10) Income From Continuing Operations Before Income Taxes
Income from continuing operations before income taxes
climbed ¥114.0 billion, or 23.4%, to ¥602.1 billion, despite
SG&A expenses, net interest expense, higher net loss on
property and equipment—net and other expense—net. In
addition to increased gross profit, this result reflected a rise in
dividend income and a higher gain on marketable securities
and investments—net.
11) Income Taxes
Income taxes increased ¥69.4 billion from fiscal 2006 in
line with the increase in income from consolidated opera-
tions before income taxes and increased taxes due to addi-
tional dividend payments from subsidiaries. The effective
tax rate was up slightly from the previous fiscal year to
approximately 47%.
12) Minority Interests in Income of Consolidated Subsidiaries
Minority interests in income of consolidated subsidiaries rose
¥8.6 billion year on year to ¥45.2 billion, the result of higher
earnings at Metal One Corporation (“Metal One”), JECO
Corporation and other subsidiaries.
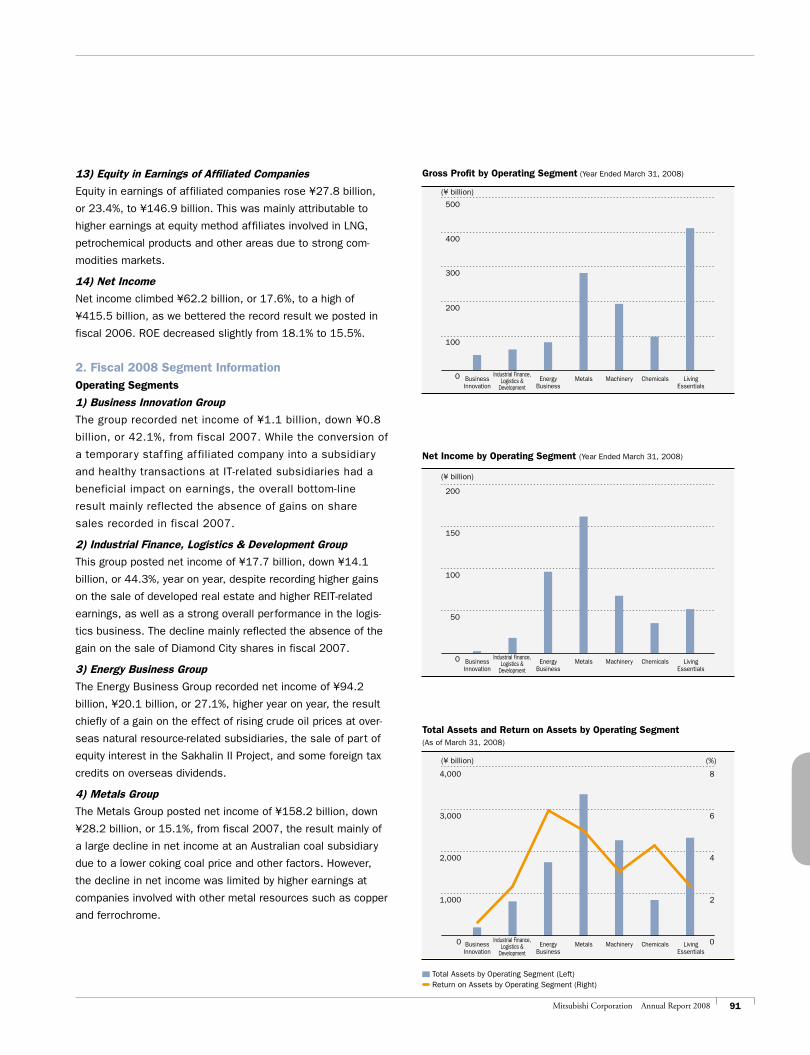
91Mitsubishi Corporation Annual Report 2008
Total Assets by Operating Segment (Left) Return on Assets by Operating Segment (Right)
500
300
400
200
100
0
200
150
100
50
0
4,000
2,000
3,000
1,000
0
8
6
4
2
0
13) Equity in Earnings of Affiliated Companies
Equity in earnings of affiliated companies rose ¥27.8 billion,
or 23.4%, to ¥146.9 billion. This was mainly attributable to
higher earnings at equity method affiliates involved in LNG,
petrochemical products and other areas due to strong com-
modities markets.
14) Net Income
Net income climbed ¥62.2 billion, or 17.6%, to a high of
¥415.5 billion, as we bettered the record result we posted in
fiscal 2006. ROE decreased slightly from 18.1% to 15.5%.
2. Fiscal 2008 Segment InformationOperating Segments
1) Business Innovation Group
The group recorded net income of ¥1.1 billion, down ¥0.8
billion, or 42.1%, from fiscal 2007. While the conversion of
a temporary staf fing af filiated company into a subsidiar y
and healthy transactions at IT-related subsidiaries had a
beneficial impact on earnings, the overall bottom-line
result mainly reflected the absence of gains on share
sales recorded in fiscal 2007.
2) Industrial Finance, Logistics & Development Group
This group posted net income of ¥17.7 billion, down ¥14.1
billion, or 44.3%, year on year, despite recording higher gains
on the sale of developed real estate and higher REIT-related
earnings, as well as a strong overall performance in the logis-
tics business. The decline mainly reflected the absence of the
gain on the sale of Diamond City shares in fiscal 2007.
3) Energy Business Group
The Energy Business Group recorded net income of ¥94.2
billion, ¥20.1 billion, or 27.1%, higher year on year, the result
chiefly of a gain on the effect of rising crude oil prices at over-
seas natural resource-related subsidiaries, the sale of part of
equity interest in the Sakhalin II Project, and some foreign tax
credits on overseas dividends.
4) Metals Group
The Metals Group posted net income of ¥158.2 billion, down
¥28.2 billion, or 15.1%, from fiscal 2007, the result mainly of
a large decline in net income at an Australian coal subsidiary
due to a lower coking coal price and other factors. However,
the decline in net income was limited by higher earnings at
companies involved with other metal resources such as copper
and ferrochrome.
Gross Profit by Operating Segment (Year Ended March 31, 2008)
(¥ billion)
Business Innovation
Industrial Finance,Logistics &
DevelopmentEnergy
BusinessMetals Machinery Chemicals Living
Essentials
Net Income by Operating Segment (Year Ended March 31, 2008)
(¥ billion)
Business Innovation
Industrial Finance,Logistics &
DevelopmentEnergy
BusinessMetals Machinery Chemicals Living
Essentials
Business Innovation
Industrial Finance,Logistics &
DevelopmentEnergy
BusinessMetals Machinery Chemicals Living
Essentials
Total Assets and Return on Assets by Operating Segment(As of March 31, 2008)
(¥ billion) (%)
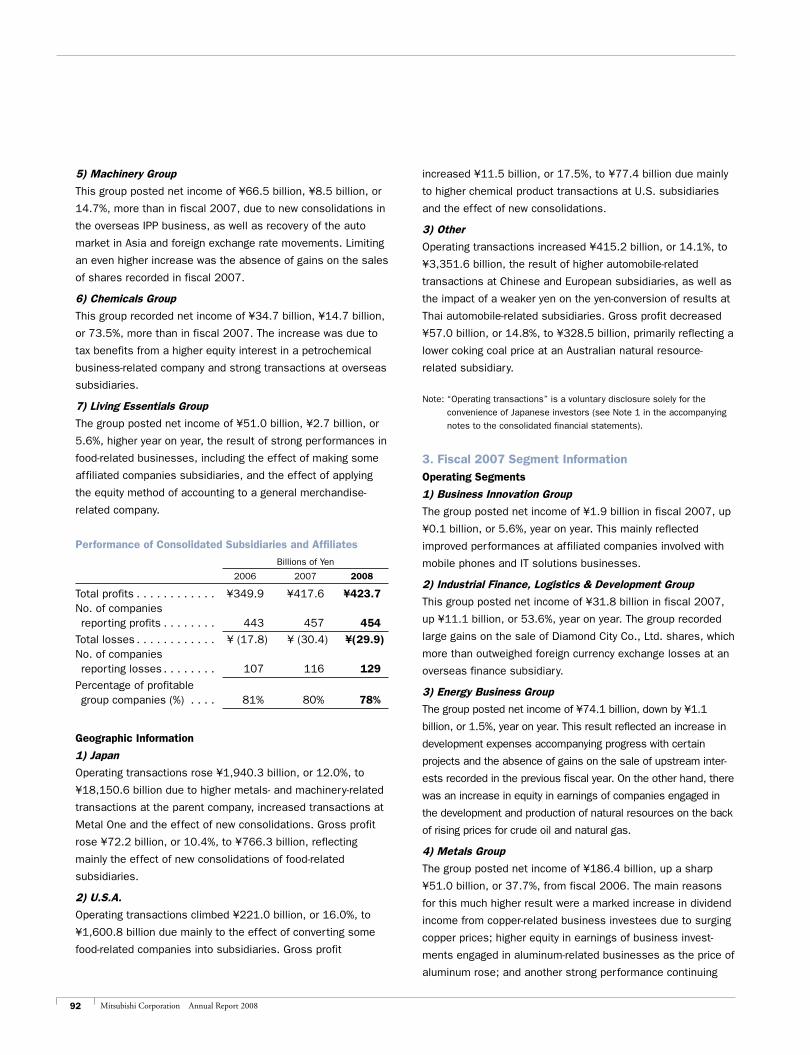
92 Mitsubishi Corporation Annual Report 2008
5) Machinery Group
This group posted net income of ¥66.5 billion, ¥8.5 billion, or
14.7%, more than in fiscal 2007, due to new consolidations in
the overseas IPP business, as well as recovery of the auto
market in Asia and foreign exchange rate movements. Limiting
an even higher increase was the absence of gains on the sales
of shares recorded in fiscal 2007.
6) Chemicals Group
This group recorded net income of ¥34.7 billion, ¥14.7 billion,
or 73.5%, more than in fiscal 2007. The increase was due to
tax benefits from a higher equity interest in a petrochemical
business-related company and strong transactions at overseas
subsidiaries.
7) Living Essentials Group
The group posted net income of ¥51.0 billion, ¥2.7 billion, or
5.6%, higher year on year, the result of strong performances in
food-related businesses, including the effect of making some
affiliated companies subsidiaries, and the effect of applying
the equity method of accounting to a general merchandise-
related company.
Performance of Consolidated Subsidiaries and Affiliates
Billions of Yen
2006 2007 2008
Total profits . . . . . . . . . . . . ¥349.9 ¥417.6 ¥423.7No. of companies reporting profits . . . . . . . . 443 457 454
Total losses . . . . . . . . . . . . ¥ (17.8) ¥ (30.4) ¥(29.9)No. of companies reporting losses . . . . . . . . 107 116 129
Percentage of profitable group companies (%) . . . . 81% 80% 78%
Geographic Information
1) Japan
Operating transactions rose ¥1,940.3 billion, or 12.0%, to
¥18,150.6 billion due to higher metals- and machinery-related
transactions at the parent company, increased transactions at
Metal One and the effect of new consolidations. Gross profit
rose ¥72.2 billion, or 10.4%, to ¥766.3 billion, reflecting
mainly the effect of new consolidations of food-related
subsidiaries.
2) U.S.A.
Operating transactions climbed ¥221.0 billion, or 16.0%, to
¥1,600.8 billion due mainly to the effect of converting some
food-related companies into subsidiaries. Gross profit
increased ¥11.5 billion, or 17.5%, to ¥77.4 billion due mainly
to higher chemical product transactions at U.S. subsidiaries
and the effect of new consolidations.
3) Other
Operating transactions increased ¥415.2 billion, or 14.1%, to
¥3,351.6 billion, the result of higher automobile-related
transactions at Chinese and European subsidiaries, as well as
the impact of a weaker yen on the yen-conversion of results at
Thai automobile-related subsidiaries. Gross profit decreased
¥57.0 billion, or 14.8%, to ¥328.5 billion, primarily reflecting a
lower coking coal price at an Australian natural resource-
related subsidiary.
Note: “Operating transactions” is a voluntary disclosure solely for the
convenience of Japanese investors (see Note 1 in the accompanying
notes to the consolidated financial statements).
3. Fiscal 2007 Segment InformationOperating Segments
1) Business Innovation Group
The group posted net income of ¥1.9 billion in fiscal 2007, up
¥0.1 billion, or 5.6%, year on year. This mainly reflected
improved performances at affiliated companies involved with
mobile phones and IT solutions businesses.
2) Industrial Finance, Logistics & Development Group
This group posted net income of ¥31.8 billion in fiscal 2007,
up ¥11.1 billion, or 53.6%, year on year. The group recorded
large gains on the sale of Diamond City Co., Ltd. shares, which
more than outweighed foreign currency exchange losses at an
overseas finance subsidiary.
3) Energy Business Group
The group posted net income of ¥74.1 billion, down by ¥1.1
billion, or 1.5%, year on year. This result reflected an increase in
development expenses accompanying progress with certain
projects and the absence of gains on the sale of upstream inter-
ests recorded in the previous fiscal year. On the other hand, there
was an increase in equity in earnings of companies engaged in
the development and production of natural resources on the back
of rising prices for crude oil and natural gas.
4) Metals Group
The group posted net income of ¥186.4 billion, up a sharp
¥51.0 billion, or 37.7%, from fiscal 2006. The main reasons
for this much higher result were a marked increase in dividend
income from copper-related business investees due to surging
copper prices; higher equity in earnings of business invest-
ments engaged in aluminum-related businesses as the price of
aluminum rose; and another strong performance continuing
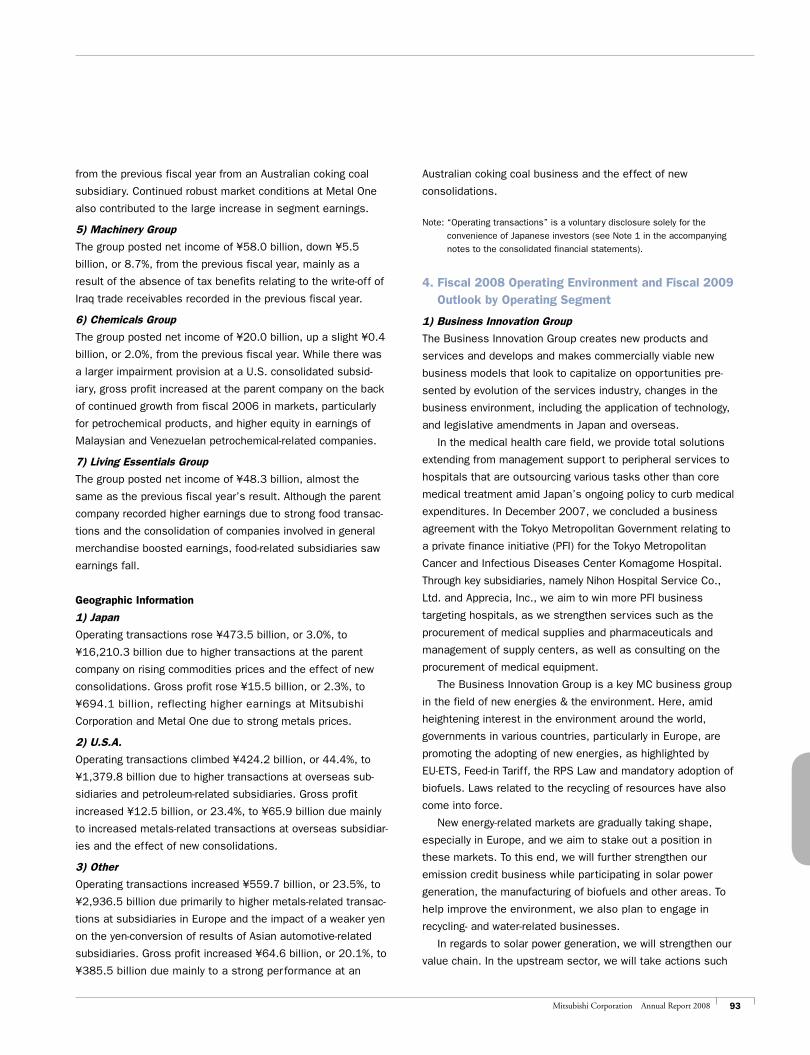
93Mitsubishi Corporation Annual Report 2008
from the previous fiscal year from an Australian coking coal
subsidiary. Continued robust market conditions at Metal One
also contributed to the large increase in segment earnings.
5) Machinery Group
The group posted net income of ¥58.0 billion, down ¥5.5
billion, or 8.7%, from the previous fiscal year, mainly as a
result of the absence of tax benefits relating to the write-off of
Iraq trade receivables recorded in the previous fiscal year.
6) Chemicals Group
The group posted net income of ¥20.0 billion, up a slight ¥0.4
billion, or 2.0%, from the previous fiscal year. While there was
a larger impairment provision at a U.S. consolidated subsid-
iary, gross profit increased at the parent company on the back
of continued growth from fiscal 2006 in markets, particularly
for petrochemical products, and higher equity in earnings of
Malaysian and Venezuelan petrochemical-related companies.
7) Living Essentials Group
The group posted net income of ¥48.3 billion, almost the
same as the previous fiscal year’s result. Although the parent
company recorded higher earnings due to strong food transac-
tions and the consolidation of companies involved in general
merchandise boosted earnings, food-related subsidiaries saw
earnings fall.
Geographic Information
1) Japan
Operating transactions rose ¥473.5 billion, or 3.0%, to
¥16,210.3 billion due to higher transactions at the parent
company on rising commodities prices and the effect of new
consolidations. Gross profit rose ¥15.5 billion, or 2.3%, to
¥694.1 billion, reflecting higher earnings at Mitsubishi
Corporation and Metal One due to strong metals prices.
2) U.S.A.
Operating transactions climbed ¥424.2 billion, or 44.4%, to
¥1,379.8 billion due to higher transactions at overseas sub-
sidiaries and petroleum-related subsidiaries. Gross profit
increased ¥12.5 billion, or 23.4%, to ¥65.9 billion due mainly
to increased metals-related transactions at overseas subsidiar-
ies and the effect of new consolidations.
3) Other
Operating transactions increased ¥559.7 billion, or 23.5%, to
¥2,936.5 billion due primarily to higher metals-related transac-
tions at subsidiaries in Europe and the impact of a weaker yen
on the yen-conversion of results of Asian automotive-related
subsidiaries. Gross profit increased ¥64.6 billion, or 20.1%, to
¥385.5 billion due mainly to a strong performance at an
Australian coking coal business and the effect of new
consolidations.
Note: “Operating transactions” is a voluntary disclosure solely for the
convenience of Japanese investors (see Note 1 in the accompanying
notes to the consolidated financial statements).
4. Fiscal 2008 Operating Environment and Fiscal 2009 Outlook by Operating Segment
1) Business Innovation Group
The Business Innovation Group creates new products and
services and develops and makes commercially viable new
business models that look to capitalize on opportunities pre-
sented by evolution of the services industry, changes in the
business environment, including the application of technology,
and legislative amendments in Japan and overseas.
In the medical health care field, we provide total solutions
extending from management support to peripheral services to
hospitals that are outsourcing various tasks other than core
medical treatment amid Japan’s ongoing policy to curb medical
expenditures. In December 2007, we concluded a business
agreement with the Tokyo Metropolitan Government relating to
a private finance initiative (PFI) for the Tokyo Metropolitan
Cancer and Infectious Diseases Center Komagome Hospital.
Through key subsidiaries, namely Nihon Hospital Service Co.,
Ltd. and Apprecia, Inc., we aim to win more PFI business
targeting hospitals, as we strengthen services such as the
procurement of medical supplies and pharmaceuticals and
management of supply centers, as well as consulting on the
procurement of medical equipment.
The Business Innovation Group is a key MC business group
in the field of new energies & the environment. Here, amid
heightening interest in the environment around the world,
governments in various countries, particularly in Europe, are
promoting the adopting of new energies, as highlighted by
EU-ETS, Feed-in Tariff, the RPS Law and mandatory adoption of
biofuels. Laws related to the recycling of resources have also
come into force.
New energy-related markets are gradually taking shape,
especially in Europe, and we aim to stake out a position in
these markets. To this end, we will further strengthen our
emission credit business while participating in solar power
generation, the manufacturing of biofuels and other areas. To
help improve the environment, we also plan to engage in
recycling- and water-related businesses.
In regards to solar power generation, we will strengthen our
value chain. In the upstream sector, we will take actions such
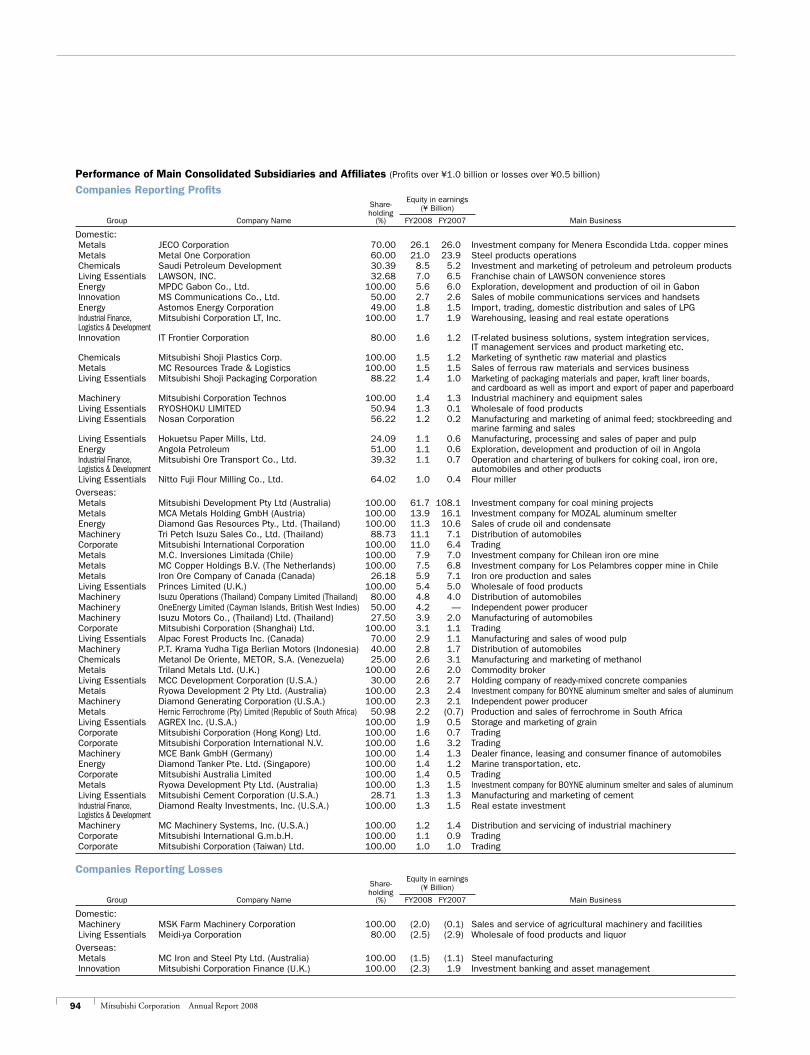
94 Mitsubishi Corporation Annual Report 2008
Performance of Main Consolidated Subsidiaries and Affiliates (Profits over ¥1.0 billion or losses over ¥0.5 billion)
Companies Reporting Profits
Share- Equity in earnings
holding
(¥ Billion)
Group Company Name (%) FY2008 FY2007 Main Business
Domestic: Metals JECO Corporation 70.00 26.1 26.0 Investment company for Menera Escondida Ltda. copper mines Metals Metal One Corporation 60.00 21.0 23.9 Steel products operations Chemicals Saudi Petroleum Development 30.39 8.5 5.2 Investment and marketing of petroleum and petroleum products Living Essentials LAWSON, INC. 32.68 7.0 6.5 Franchise chain of LAWSON convenience stores Energy MPDC Gabon Co., Ltd. 100.00 5.6 6.0 Exploration, development and production of oil in Gabon Innovation MS Communications Co., Ltd. 50.00 2.7 2.6 Sales of mobile communications services and handsets Energy Astomos Energy Corporation 49.00 1.8 1.5 Import, trading, domestic distribution and sales of LPG Industrial Finance, Mitsubishi Corporation LT, Inc. 100.00 1.7 1.9 Warehousing, leasing and real estate operations Logistics & Development Innovation IT Frontier Corporation 80.00 1.6 1.2 IT-related business solutions, system integration services,
IT management services and product marketing etc. Chemicals Mitsubishi Shoji Plastics Corp. 100.00 1.5 1.2 Marketing of synthetic raw material and plastics Metals MC Resources Trade & Logistics 100.00 1.5 1.5 Sales of ferrous raw materials and services business Living Essentials Mitsubishi Shoji Packaging Corporation 88.22 1.4 1.0 Marketing of packaging materials and paper, kraft liner boards,
and cardboard as well as import and export of paper and paperboard Machinery Mitsubishi Corporation Technos 100.00 1.4 1.3 Industrial machinery and equipment sales Living Essentials RYOSHOKU LIMITED 50.94 1.3 0.1 Wholesale of food products Living Essentials Nosan Corporation 56.22 1.2 0.2 Manufacturing and marketing of animal feed; stockbreeding and
marine farming and sales Living Essentials Hokuetsu Paper Mills, Ltd. 24.09 1.1 0.6 Manufacturing, processing and sales of paper and pulp Energy Angola Petroleum 51.00 1.1 0.6 Exploration, development and production of oil in Angola Industrial Finance, Mitsubishi Ore Transport Co., Ltd. 39.32 1.1 0.7 Operation and chartering of bulkers for coking coal, iron ore, Logistics & Development automobiles and other products Living Essentials Nitto Fuji Flour Milling Co., Ltd. 64.02 1.0 0.4 Flour miller
Overseas: Metals Mitsubishi Development Pty Ltd (Australia) 100.00 61.7 108.1 Investment company for coal mining projects Metals MCA Metals Holding GmbH (Austria) 100.00 13.9 16.1 Investment company for MOZAL aluminum smelter Energy Diamond Gas Resources Pty., Ltd. (Thailand) 100.00 11.3 10.6 Sales of crude oil and condensate Machinery Tri Petch Isuzu Sales Co., Ltd. (Thailand) 88.73 11.1 7.1 Distribution of automobiles Corporate Mitsubishi International Corporation 100.00 11.0 6.4 Trading Metals M.C. Inversiones Limitada (Chile) 100.00 7.9 7.0 Investment company for Chilean iron ore mine Metals MC Copper Holdings B.V. (The Netherlands) 100.00 7.5 6.8 Investment company for Los Pelambres copper mine in Chile Metals Iron Ore Company of Canada (Canada) 26.18 5.9 7.1 Iron ore production and sales Living Essentials Princes Limited (U.K.) 100.00 5.4 5.0 Wholesale of food products Machinery Isuzu Operations (Thailand) Company Limited (Thailand) 80.00 4.8 4.0 Distribution of automobiles Machinery OneEnergy Limited (Cayman Islands, British West Indies) 50.00 4.2 — Independent power producer Machinery Isuzu Motors Co., (Thailand) Ltd. (Thailand) 27.50 3.9 2.0 Manufacturing of automobiles Corporate Mitsubishi Corporation (Shanghai) Ltd. 100.00 3.1 1.1 Trading Living Essentials Alpac Forest Products Inc. (Canada) 70.00 2.9 1.1 Manufacturing and sales of wood pulp Machinery P.T. Krama Yudha Tiga Berlian Motors (Indonesia) 40.00 2.8 1.7 Distribution of automobiles Chemicals Metanol De Oriente, METOR, S.A. (Venezuela) 25.00 2.6 3.1 Manufacturing and marketing of methanol Metals Triland Metals Ltd. (U.K.) 100.00 2.6 2.0 Commodity broker Living Essentials MCC Development Corporation (U.S.A.) 30.00 2.6 2.7 Holding company of ready-mixed concrete companies Metals Ryowa Development 2 Pty Ltd. (Australia) 100.00 2.3 2.4 Investment company for BOYNE aluminum smelter and sales of aluminum Machinery Diamond Generating Corporation (U.S.A.) 100.00 2.3 2.1 Independent power producer Metals Hernic Ferrochrome (Pty) Limited (Republic of South Africa) 50.98 2.2 (0.7) Production and sales of ferrochrome in South Africa Living Essentials AGREX Inc. (U.S.A.) 100.00 1.9 0.5 Storage and marketing of grain Corporate Mitsubishi Corporation (Hong Kong) Ltd. 100.00 1.6 0.7 Trading Corporate Mitsubishi Corporation International N.V. 100.00 1.6 3.2 Trading Machinery MCE Bank GmbH (Germany) 100.00 1.4 1.3 Dealer finance, leasing and consumer finance of automobiles Energy Diamond Tanker Pte. Ltd. (Singapore) 100.00 1.4 1.2 Marine transportation, etc. Corporate Mitsubishi Australia Limited 100.00 1.4 0.5 Trading Metals Ryowa Development Pty Ltd. (Australia) 100.00 1.3 1.5 Investment company for BOYNE aluminum smelter and sales of aluminum Living Essentials Mitsubishi Cement Corporation (U.S.A.) 28.71 1.3 1.3 Manufacturing and marketing of cement Industrial Finance, Diamond Realty Investments, Inc. (U.S.A.) 100.00 1.3 1.5 Real estate investment Logistics & Development Machinery MC Machinery Systems, Inc. (U.S.A.) 100.00 1.2 1.4 Distribution and servicing of industrial machinery Corporate Mitsubishi International G.m.b.H. 100.00 1.1 0.9 Trading Corporate Mitsubishi Corporation (Taiwan) Ltd. 100.00 1.0 1.0 Trading
Companies Reporting Losses
Share- Equity in earnings
holding
(¥ Billion)
Group Company Name (%) FY2008 FY2007 Main Business
Domestic: Machinery MSK Farm Machinery Corporation 100.00 (2.0) (0.1) Sales and service of agricultural machinery and facilities Living Essentials Meidi-ya Corporation 80.00 (2.5) (2.9) Wholesale of food products and liquor
Overseas: Metals MC Iron and Steel Pty Ltd. (Australia) 100.00 (1.5) (1.1) Steel manufacturing Innovation Mitsubishi Corporation Finance (U.K.) 100.00 (2.3) 1.9 Investment banking and asset management
95Mitsubishi Corporation Annual Report 2008
as investing and trading in raw materials, while downstream we
will participate in IPP businesses based on existing cell and
module transactions. In other areas, we are making upfront
investments in bio-pellet manufacturing in Oita and Miyazaki
prefectures and bio-ethanol manufacturing in Hokkaido.
Information and communication (ICT) and media and con-
sumer businesses are another focus of this business group.
The business landscape here is being shaped by various
developments. These include the increasing sophistication
and complexity of the ICT features required by business infra-
structure nowadays; and expanding business related to the
refinement of internal control systems accompanying J-SOX,
which came into force effective from the fiscal year beginning
April 1, 2008. Advances in various media are also prompting
more direct sales to consumers. Centered on IT Frontier
Corporation, we provide IT systems for corporations. We are
also upgrading our consultation capabilities so that we can
propose and implement optimal solutions that address
issues facing customers. In parallel, we will work to develop
platforms for directly connecting producers with consumers,
including TV shopping, shopping point sharing schemes and
settlement systems.
We are also developing fields with an eye on the future.
Eyeing the uptake of environmentally friendly cars, we will help
manufacture lithium-ion batteries, engage in business related
to neodymium magnets and look at other areas.
2) Industrial Finance, Logistics & Development Group
Formed on April 1, 2007, the Industrial Finance, Logistics &
Development Group aims to develop finance, which MC’s busi-
ness groups have used as a tool supporting supply chains, as
a business in its own right.
Growing uncertainty triggered by the subprime loan prob-
lem in the U.S. from midway through 2007 affected not just
financial markets but also the global economy as a whole in
the past fiscal year. Up to this point, financial institutions,
particularly in the U.S. and Europe, are reported to have
booked subprime-related losses amounting to tens of trillions
of yen. Close attention also needs to be paid to how this
problem will unfold going forward. Some temporary adjust-
ments notwithstanding, there has been no fundamental
change in the medium- to long-term trends shaping the finan-
cial market environment in Japan. One trend is the emer-
gence of institutions other than banks that are meeting
corporate finance needs, such as non-banks and funds.
Another market dynamic is the increasing propensity of
Japanese people to invest rather than save their money.
Thirdly, the flow of private-sector capital into the debt-ridden
public sector continues unabated. We view these changes as
business opportunities. Leveraging our strengths as a gen-
eral trading company (sogo shosha)—that is, our knowledge
of various assets, our involvement in all industries and our
extensive global network—we are focused on building unique
value chains and developing a new finance business model
using different approaches than financial institutions.
Mitsubishi Corporation has been a pioneer in real estate
securitization and liquidation-related businesses in Japan.
Linking MC Group finance, development and construction and
logistics services, one of our major business investees,
Mitsubishi Corp.-UBS Realty Inc. (MCUBSR) publicly listed in
October 2007 Industrial & Infrastructure Fund Investment
Corporation, a J-REIT (Japanese real estate investment trust)
that targets investments in logistics facilities, factories and
other manufacturing facilities and other industrial real estate.
In finance businesses outside real estate-related fields, we
are active in leasing operations where we can make use of our
knowledge of goods and supply chains. In leasing operations
during the past fiscal year, we acquired aircraft leasing assets
from a major U.K. bank in the latter half of fiscal 2008. In April
2008, we purchased additional shares in Mitsubishi UFJ Lease &
Finance Company Limited in response to a private placement to
increase capital. The buyout business is another field where we
can draw on our collective strengths as a sogo shosha. In April
2008, we joined forces with Mitsubishi UFJ Financial Group, Inc.
to establish Marunouchi Capital Co., Ltd. to conduct buyout
investments principally in Japan. Additionally, we are involved with
funds targeting overseas infrastructure, overseas real estate
funds and asset management businesses.
In the development and construction field, taking our cue
from trends in the real estate market and the impact of
amendments to The Building Standard Law of Japan, we will
build up a portfolio of quality assets balancing assets for sale
and those for leasing. This will see us leverage our competitive
advantage in having a value chain extending from development
through management and operation to securitization. We will
also engage in the real estate business overseas, particularly
in North America, taking a cautious approach to markets.
In the logistics field, a fine-tuned response is now more
important than ever as companies offer an increasing and
varied range of products and services. In this changing envi-
ronment, we will advance sophisticated trading company
logistics services based on our wealth of information on
customer needs and by leveraging a worldwide network of
distribution bases.

96 Mitsubishi Corporation Annual Report 2008
100
80
60
40
2003.4 04.4 05.4 06.4 07.4 08.3
Crude Oil Price (Dubai Spot Price)
(US$/BBL)
3) Energy Business Group
Crude oil prices remained at a high level in fiscal 2008, above
those of fiscal 2007. The average price in 2007 of West Texas
Intermediate (WTI) crude oil on the New York Mercantile
Exchange (NYMEX) exceeded US$72 per barrel, rising more
than US$6 per barrel above the previous year’s average. Since
the beginning of 2008, the price has broken through the
US$100 barrier and continues to march upward.
Behind the run-up in crude oil prices is a robust demand for
oil accompanying steady expansion in the world economy.
Growth in demand is particularly rapid in China, India and the
U.S. At the same time, concerns about future supply combined
to create a sense of tight supplies. These included geopolitical
risks centered on the Middle East, limited surplus production
capacity among OPEC (Organization of the Petroleum Exporting
Countries) member countries, and escalating costs associated
with the development and production of new oil fields. Addi-
tionally, in recent years there has been a large inflow of specu-
lative money from hedge funds and other investors into the
crude oil futures market. The active movement of these specu-
lative funds has driven the price of oil much higher.
The depreciation of the U.S. dollar, which was triggered by
the subprime loan problem from the second half of 2007, has
accelerated from the beginning of 2008. This has seen specu-
lative money begin moving in droves from U.S. dollar-denomi-
nated financial products such as shares and bonds to real
assets such as oil and grain. This large shift in investment
focus has led to a large increase in the price of oil on the
futures market and further driven up the crude oil price.
Tight supplies in the world oil market and the movement of
speculative money into oil futures, effectively a financial
product, is expected to continue from April 2008 onward,
meaning the price of crude oil is likely to remain at a high
level. Several market observers are predicting that the aver-
age annual price on the NYMEX in 2008 will be considerably
higher than in 2007.
Our fiscal 2009 net income projection for this business
group assumes a crude oil price of US$85/BBL (Dubai spot
price). The Energy Business Group owns upstream rights to
LNG and oil and liquefaction facilities in Western Australia,
Malaysia, Brunei, the U.S., including the Gulf of Mexico,
Gabon, Angola and other parts of the world. Therefore, our
operating results are subject to the effect of fluctuations in the
price of crude oil. A US$1/BBL change in the price of crude oil
has an approximate ¥1.0 billion effect on net income, mainly
through a change in equity method earnings. However, because
of timing differences, this price fluctuation might not be imme-
diately reflected in our operating results in the fiscal year in
which it occurs.
4) Metals Group
In the metals and mineral resources business, supplies of
metal resources have been remarkably tight since the latter
half of 2003 due to rapid economic growth in the BRIC coun-
tries, especially China and India. This trend continued in fiscal
2008. In non-ferrous metals, particularly copper and alumi-
num, prices remained high throughout the past year due to
escalating crude oil prices and continued inflows of speculative
money. The average annual price of copper cathode in fiscal
2008 rose from US$3.20 per pound to US$3.40 per pound.
Meanwhile, the price of primary aluminum ingots was
US$2,624 per MT, largely unchanged from US$2,665 per MT
for fiscal 2007. Reflecting these high prices, we continued to
record a high level of dividend income from copper- and
aluminum-related business investees. On the other hand,
MDP, a key consolidated subsidiary that conducts coking coal
operations in Australia, saw its fiscal 2008 net income drop
¥46.4 billion to ¥61.7 billion, the result of a lower coking coal
price and the impact of torrential rain on operations in the
state of Queensland. While this brought down earnings in the
metals and mineral resources business, consolidated net
income remained at a high level.
Reflecting current tight supplies and soaring prices, a
number of mine expansions have been announced in the
metals and mineral resources field. However, because a lead
time of several years is required before the benefits of
increased production will show through, and because expan-
sion of capacity at smelters is not keeping pace with mine
expansion, supplies are expected to remain tight in 2008.
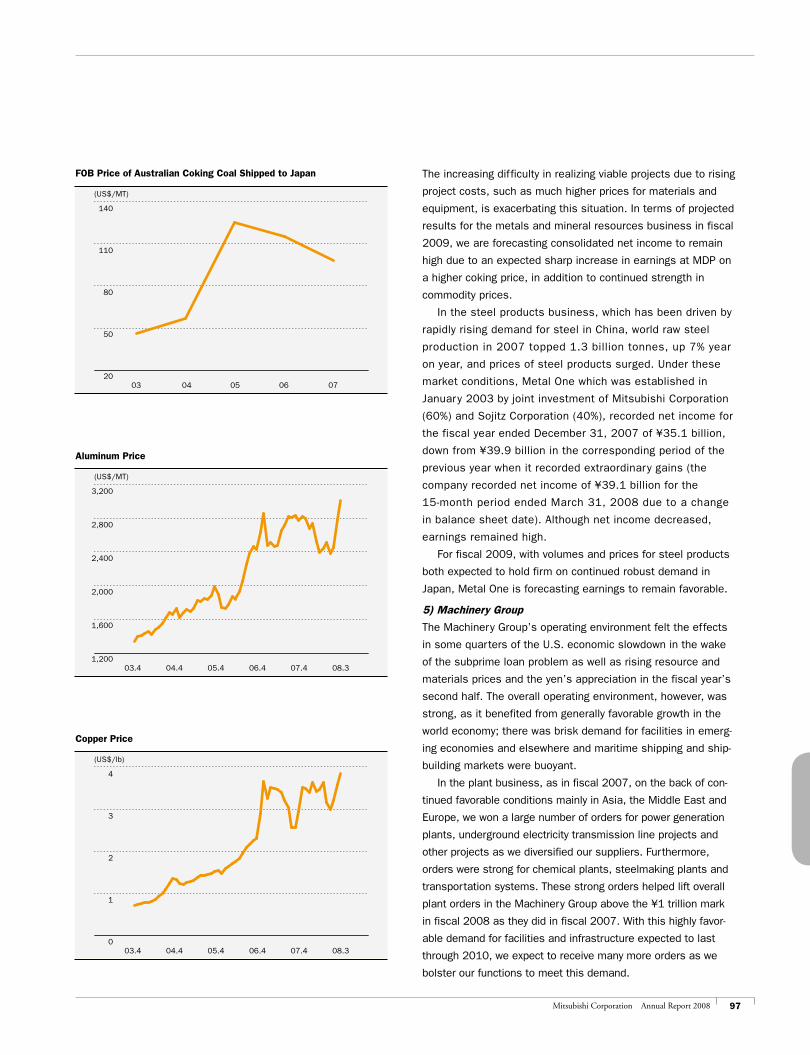
97Mitsubishi Corporation Annual Report 2008
140
110
80
50
2003 04 05 06 07
FOB Price of Australian Coking Coal Shipped to Japan
(US$/MT)
3,200
2,800
2,400
2,000
1,600
1,20003.4 04.4 05.4 06.4 07.4 08.3
Aluminum Price
(US$/MT)
4
2
3
1
003.4 04.4 05.4 06.4 07.4 08.3
Copper Price
(US$/lb)
The increasing difficulty in realizing viable projects due to rising
project costs, such as much higher prices for materials and
equipment, is exacerbating this situation. In terms of projected
results for the metals and mineral resources business in fiscal
2009, we are forecasting consolidated net income to remain
high due to an expected sharp increase in earnings at MDP on
a higher coking price, in addition to continued strength in
commodity prices.
In the steel products business, which has been driven by
rapidly rising demand for steel in China, world raw steel
production in 2007 topped 1.3 billion tonnes, up 7% year
on year, and prices of steel products surged. Under these
market conditions, Metal One which was established in
January 2003 by joint investment of Mitsubishi Corporation
(60%) and Sojitz Corporation (40%), recorded net income for
the fiscal year ended December 31, 2007 of ¥35.1 billion,
down from ¥39.9 billion in the corresponding period of the
previous year when it recorded extraordinary gains (the
company recorded net income of ¥39.1 billion for the
15-month period ended March 31, 2008 due to a change
in balance sheet date). Although net income decreased,
earnings remained high.
For fiscal 2009, with volumes and prices for steel products
both expected to hold firm on continued robust demand in
Japan, Metal One is forecasting earnings to remain favorable.
5) Machinery Group
The Machinery Group’s operating environment felt the effects
in some quarters of the U.S. economic slowdown in the wake
of the subprime loan problem as well as rising resource and
materials prices and the yen’s appreciation in the fiscal year’s
second half. The overall operating environment, however, was
strong, as it benefited from generally favorable growth in the
world economy; there was brisk demand for facilities in emerg-
ing economies and elsewhere and maritime shipping and ship-
building markets were buoyant.
In the plant business, as in fiscal 2007, on the back of con-
tinued favorable conditions mainly in Asia, the Middle East and
Europe, we won a large number of orders for power generation
plants, underground electricity transmission line projects and
other projects as we diversified our suppliers. Furthermore,
orders were strong for chemical plants, steelmaking plants and
transportation systems. These strong orders helped lift overall
plant orders in the Machinery Group above the ¥1 trillion mark
in fiscal 2008 as they did in fiscal 2007. With this highly favor-
able demand for facilities and infrastructure expected to last
through 2010, we expect to receive many more orders as we
bolster our functions to meet this demand.
98 Mitsubishi Corporation Annual Report 2008
In our business where we sell machinery and equipment in
large volumes, sales of industrial machinery put up a brave
fight in the face of the subprime loan fallout, thanks to busi-
ness development extending from the supply of machinery to
after-sales service through business investees in Japan and
overseas. However, changes in Japan’s agricultural policy and
the impact of a one-off increase in depreciation expenses due
to tax code revisions had an impact in some sectors.
Conditions in the maritime shipping and shipbuilding mar-
kets remained favorable. Our strategy here is to build up qual-
ity assets by continuing to enlarge our fleet and increase
projects for floating oil production and storage facilities (FPSO).
In business related to Mitsubishi Motors Corporation
(MMC) brand automobiles, sales were strong owing to a large
rise in demand, centered on Russia, the Ukraine and Latin
America, and recovery in Asia’s auto market. Looking ahead,
we will work with MMC to expand sales, with a focus on
developing BRICs and other emerging markets, and naturally
existing markets.
We also have a manufacturing and sales business for
commercial vehicles in Thailand that is operated as a joint
venture with Isuzu Motors Limited. While this business con-
tinued to be affected by political unease from last year, it
managed to minimize the year-on-year decline in total unit
sales in 2007 through well-conceived marketing. Macroeco-
nomic conditions in Thailand remain generally healthy,
although temporarily marking time. We are therefore upbeat
about market growth over the medium and long terms and so
will focus on expanding sales further in this market. We also
export finished vehicles from Thailand to other countries. In
this business, strong growth in the Middle East, Europe, Latin
America and elsewhere is supporting steady year-on-year
increases in export units. We aim to expand export unit sales
in all corners of the globe.
6) Chemicals Group
In terms of macroeconomic conditions surrounding the chemi-
cal products industry, ongoing rises in raw material and fuel
costs are prompting a strong response and globalization of
financial markets has generated uncertainty in the world econ-
omy, centered on the U.S. At the same time, oil-producing
countries are launching petrochemicals businesses one after
another using their national resources as well as using their oil
riches to make large chemical business acquisitions. Meanwhile,
demand in economic growth regions such as China, India,
Turkey, Russia and Eastern Europe continues to expand.
Heightening interest in how companies are responding to
environmental issues and global warming as well as lifestyle-
related issues is also shaping our operating environment. This
is true, above all, in food safety and quality and health.
Demand in the chemical industry is basically expected to
increase steadily over the medium and long terms, supported
by world economic growth. Assuming the growth rate in
demand remains above 4% in 2008, we expect the chemical
industry, which provides products to many different industries,
to grow at a similar pace. For example, worldwide demand for
ethylene is forecast to grow by at least 4 million tons, assum-
ing growth in demand of more than 4%.
On the other hand, large-scale facility expansions planned
in the Middle East and China, while slightly behind schedule
should come on stream in 2008 and 2009, are causing con-
cern for the market from 2009 onward as the gap between
supply and demand grows. The recent trend toward building
larger facilities is also widening this gap.
Moreover, the knock-on effects of the EU’s REACH (Reg-
istration, Evaluation and Authorisation of Chemicals) regula-
tion portends the spread of similar regulations on chemical
products businesses not just within the EU but also in the
U.S. and Asia.
Developments such as these in the economic environment
and chemicals industry will spawn business opportunities. We
will focus on strengthening local transactions in growth mar-
kets to seize these opportunities.
At the same time as strengthening core businesses,
namely Saudi Arabian petrochemical operations, Venezuelan
methanol business and aromatics in Malaysia, we will con-
tinue to develop the value chain in midstream and down-
stream sectors and strengthen consolidated businesses. We
will also continue to take up the challenge of entering new
fields, such as the testing and diagnostic business, which
respond to increasing needs. Along with these actions, to
grow our earnings further, we will step up efforts to
strengthen trading and make related business investments.
7) Living Essentials Group
Japan, the main market for the Living Essentials Group, is
seeing overall demand peak out as the population ages and
bir thrate declines. At the same time, consumer values are
diversifying and diverging, and there is increasing interest in
safety and reliability as well as preservation of the environ-
ment. Moreover, raw materials prices are staying at high
levels due to economic development in emerging markets,
most notably the BRIC countries, and the inflow of specula-
tive money. Together, all of these factors are making the
consumer goods-related industr y increasingly challenging.
In this severe operating environment, competition is
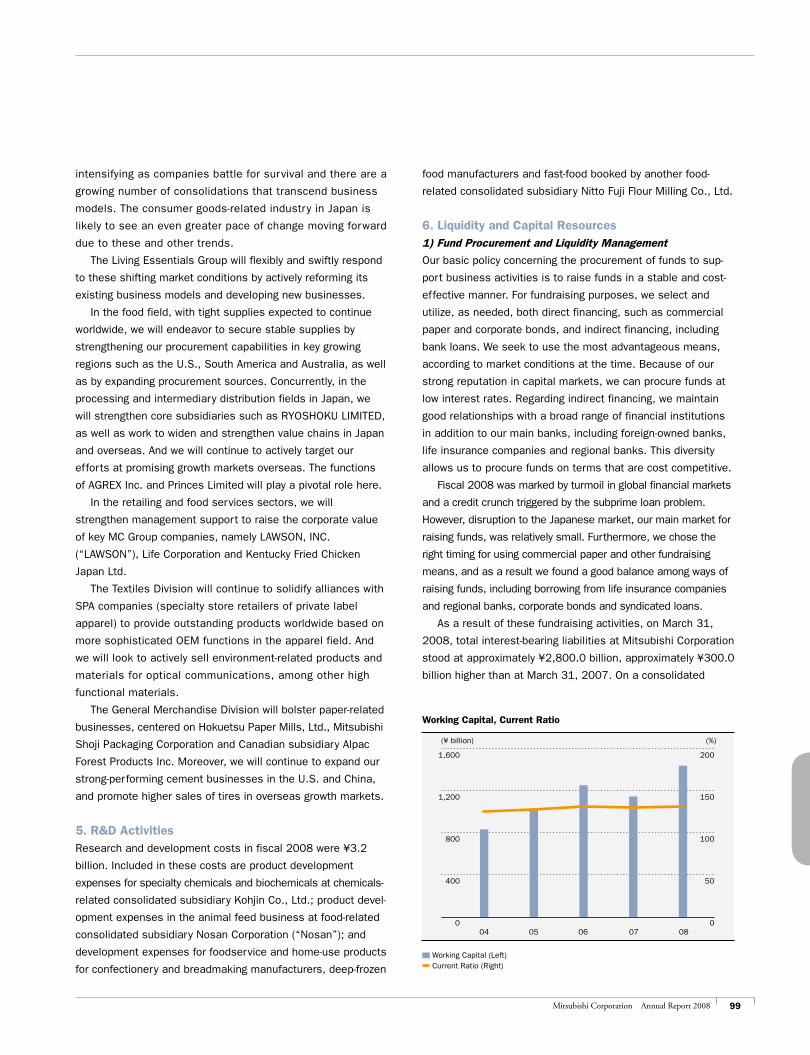
99Mitsubishi Corporation Annual Report 2008
intensifying as companies battle for survival and there are a
growing number of consolidations that transcend business
models. The consumer goods-related industry in Japan is
likely to see an even greater pace of change moving forward
due to these and other trends.
The Living Essentials Group will flexibly and swiftly respond
to these shifting market conditions by actively reforming its
existing business models and developing new businesses.
In the food field, with tight supplies expected to continue
worldwide, we will endeavor to secure stable supplies by
strengthening our procurement capabilities in key growing
regions such as the U.S., South America and Australia, as well
as by expanding procurement sources. Concurrently, in the
processing and intermediary distribution fields in Japan, we
will strengthen core subsidiaries such as RYOSHOKU LIMITED,
as well as work to widen and strengthen value chains in Japan
and overseas. And we will continue to actively target our
efforts at promising growth markets overseas. The functions
of AGREX Inc. and Princes Limited will play a pivotal role here.
In the retailing and food services sectors, we will
strengthen management support to raise the corporate value
of key MC Group companies, namely LAWSON, INC.
(“LAWSON”), Life Corporation and Kentucky Fried Chicken
Japan Ltd.
The Textiles Division will continue to solidify alliances with
SPA companies (specialty store retailers of private label
apparel) to provide outstanding products worldwide based on
more sophisticated OEM functions in the apparel field. And
we will look to actively sell environment-related products and
materials for optical communications, among other high
functional materials.
The General Merchandise Division will bolster paper-related
businesses, centered on Hokuetsu Paper Mills, Ltd., Mitsubishi
Shoji Packaging Corporation and Canadian subsidiary Alpac
Forest Products Inc. Moreover, we will continue to expand our
strong-performing cement businesses in the U.S. and China,
and promote higher sales of tires in overseas growth markets.
5. R&D ActivitiesResearch and development costs in fiscal 2008 were ¥3.2
billion. Included in these costs are product development
expenses for specialty chemicals and biochemicals at chemicals-
related consolidated subsidiary Kohjin Co., Ltd.; product devel-
opment expenses in the animal feed business at food-related
consolidated subsidiary Nosan Corporation (“Nosan”); and
development expenses for foodservice and home-use products
for confectionery and breadmaking manufacturers, deep-frozen
food manufacturers and fast-food booked by another food-
related consolidated subsidiary Nitto Fuji Flour Milling Co., Ltd.
6. Liquidity and Capital Resources1) Fund Procurement and Liquidity Management
Our basic policy concerning the procurement of funds to sup-
port business activities is to raise funds in a stable and cost-
effective manner. For fundraising purposes, we select and
utilize, as needed, both direct financing, such as commercial
paper and corporate bonds, and indirect financing, including
bank loans. We seek to use the most advantageous means,
according to market conditions at the time. Because of our
strong reputation in capital markets, we can procure funds at
low interest rates. Regarding indirect financing, we maintain
good relationships with a broad range of financial institutions
in addition to our main banks, including foreign-owned banks,
life insurance companies and regional banks. This diversity
allows us to procure funds on terms that are cost competitive.
Fiscal 2008 was marked by turmoil in global financial markets
and a credit crunch triggered by the subprime loan problem.
However, disruption to the Japanese market, our main market for
raising funds, was relatively small. Furthermore, we chose the
right timing for using commercial paper and other fundraising
means, and as a result we found a good balance among ways of
raising funds, including borrowing from life insurance companies
and regional banks, corporate bonds and syndicated loans.
As a result of these fundraising activities, on March 31,
2008, total interest-bearing liabilities at Mitsubishi Corporation
stood at approximately ¥2,800.0 billion, approximately ¥300.0
billion higher than at March 31, 2007. On a consolidated
1,600
1,200
800
400
0
200
150
100
50
0060504 07 08
Working Capital (Left) Current Ratio (Right)
Working Capital, Current Ratio
(¥ billion) (%)
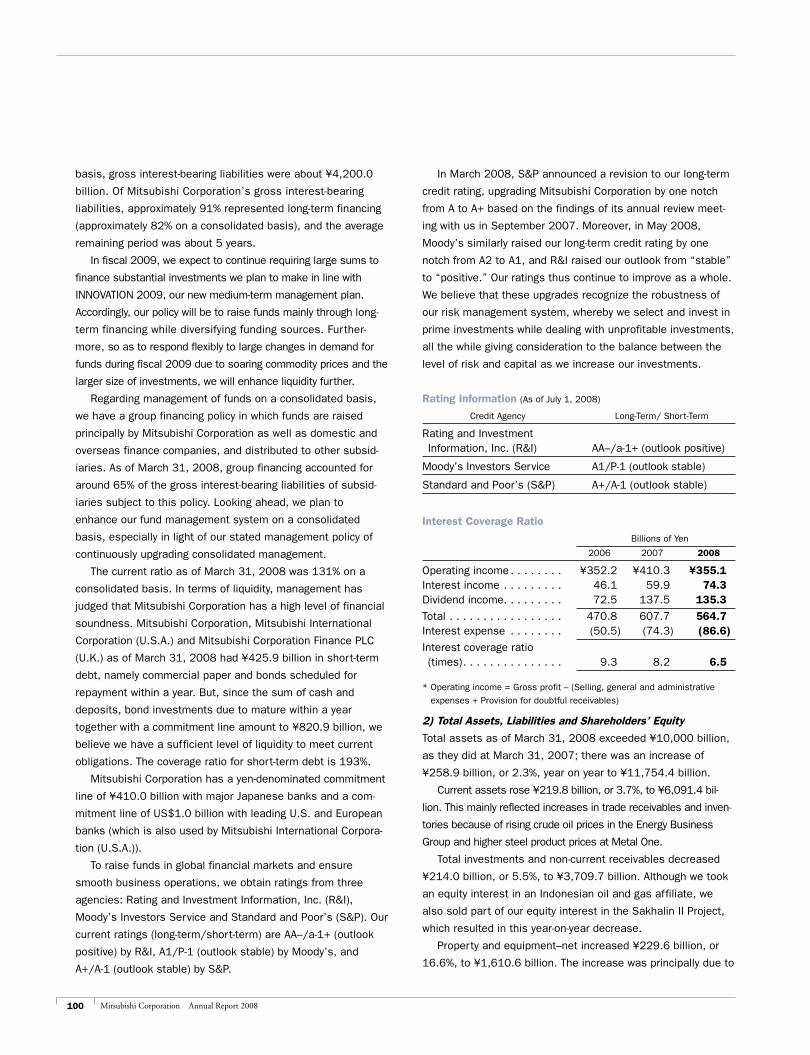
100 Mitsubishi Corporation Annual Report 2008
basis, gross interest-bearing liabilities were about ¥4,200.0
billion. Of Mitsubishi Corporation’s gross interest-bearing
liabilities, approximately 91% represented long-term financing
(approximately 82% on a consolidated basis), and the average
remaining period was about 5 years.
In fiscal 2009, we expect to continue requiring large sums to
finance substantial investments we plan to make in line with
INNOVATION 2009, our new medium-term management plan.
Accordingly, our policy will be to raise funds mainly through long-
term financing while diversifying funding sources. Further-
more, so as to respond flexibly to large changes in demand for
funds during fiscal 2009 due to soaring commodity prices and the
larger size of investments, we will enhance liquidity further.
Regarding management of funds on a consolidated basis,
we have a group financing policy in which funds are raised
principally by Mitsubishi Corporation as well as domestic and
overseas finance companies, and distributed to other subsid-
iaries. As of March 31, 2008, group financing accounted for
around 65% of the gross interest-bearing liabilities of subsid-
iaries subject to this policy. Looking ahead, we plan to
enhance our fund management system on a consolidated
basis, especially in light of our stated management policy of
continuously upgrading consolidated management.
The current ratio as of March 31, 2008 was 131% on a
consolidated basis. In terms of liquidity, management has
judged that Mitsubishi Corporation has a high level of financial
soundness. Mitsubishi Corporation, Mitsubishi International
Corporation (U.S.A.) and Mitsubishi Corporation Finance PLC
(U.K.) as of March 31, 2008 had ¥425.9 billion in short-term
debt, namely commercial paper and bonds scheduled for
repayment within a year. But, since the sum of cash and
deposits, bond investments due to mature within a year
together with a commitment line amount to ¥820.9 billion, we
believe we have a sufficient level of liquidity to meet current
obligations. The coverage ratio for short-term debt is 193%.
Mitsubishi Corporation has a yen-denominated commitment
line of ¥410.0 billion with major Japanese banks and a com-
mitment line of US$1.0 billion with leading U.S. and European
banks (which is also used by Mitsubishi International Corpora-
tion (U.S.A.)).
To raise funds in global financial markets and ensure
smooth business operations, we obtain ratings from three
agencies: Rating and Investment Information, Inc. (R&I),
Moody’s Investors Service and Standard and Poor’s (S&P). Our
current ratings (long-term/short-term) are AA–/a-1+ (outlook
positive) by R&I, A1/P-1 (outlook stable) by Moody’s, and
A+/A-1 (outlook stable) by S&P.
In March 2008, S&P announced a revision to our long-term
credit rating, upgrading Mitsubishi Corporation by one notch
from A to A+ based on the findings of its annual review meet-
ing with us in September 2007. Moreover, in May 2008,
Moody’s similarly raised our long-term credit rating by one
notch from A2 to A1, and R&I raised our outlook from “stable”
to “positive.” Our ratings thus continue to improve as a whole.
We believe that these upgrades recognize the robustness of
our risk management system, whereby we select and invest in
prime investments while dealing with unprofitable investments,
all the while giving consideration to the balance between the
level of risk and capital as we increase our investments.
Rating Information (As of July 1, 2008)
Credit Agency Long-Term/ Short-Term
Rating and Investment Information, Inc. (R&I) AA–/a-1+ (outlook positive)
Moody’s Investors Service A1/P-1 (outlook stable)
Standard and Poor’s (S&P) A+/A-1 (outlook stable)
Interest Coverage Ratio
Billions of Yen
2006 2007 2008
Operating income . . . . . . . . ¥352.2 ¥410.3 ¥355.1Interest income . . . . . . . . . 46.1 59.9 74.3Dividend income. . . . . . . . . 72.5 137.5 135.3
Total . . . . . . . . . . . . . . . . . 470.8 607.7 564.7Interest expense . . . . . . . . (50.5) (74.3) (86.6)
Interest coverage ratio (times) . . . . . . . . . . . . . . . 9.3 8.2 6.5
* Operating income = Gross profit – (Selling, general and administrative
expenses + Provision for doubtful receivables)
2) Total Assets, Liabilities and Shareholders’ Equity
Total assets as of March 31, 2008 exceeded ¥10,000 billion,
as they did at March 31, 2007; there was an increase of
¥258.9 billion, or 2.3%, year on year to ¥11,754.4 billion.
Current assets rose ¥219.8 billion, or 3.7%, to ¥6,091.4 bil-
lion. This mainly reflected increases in trade receivables and inven-
tories because of rising crude oil prices in the Energy Business
Group and higher steel product prices at Metal One.
Total investments and non-current receivables decreased
¥214.0 billion, or 5.5%, to ¥3,709.7 billion. Although we took
an equity interest in an Indonesian oil and gas affiliate, we
also sold part of our equity interest in the Sakhalin II Project,
which resulted in this year-on-year decrease.
Property and equipment–net increased ¥229.6 billion, or
16.6%, to ¥1,610.6 billion. The increase was principally due to
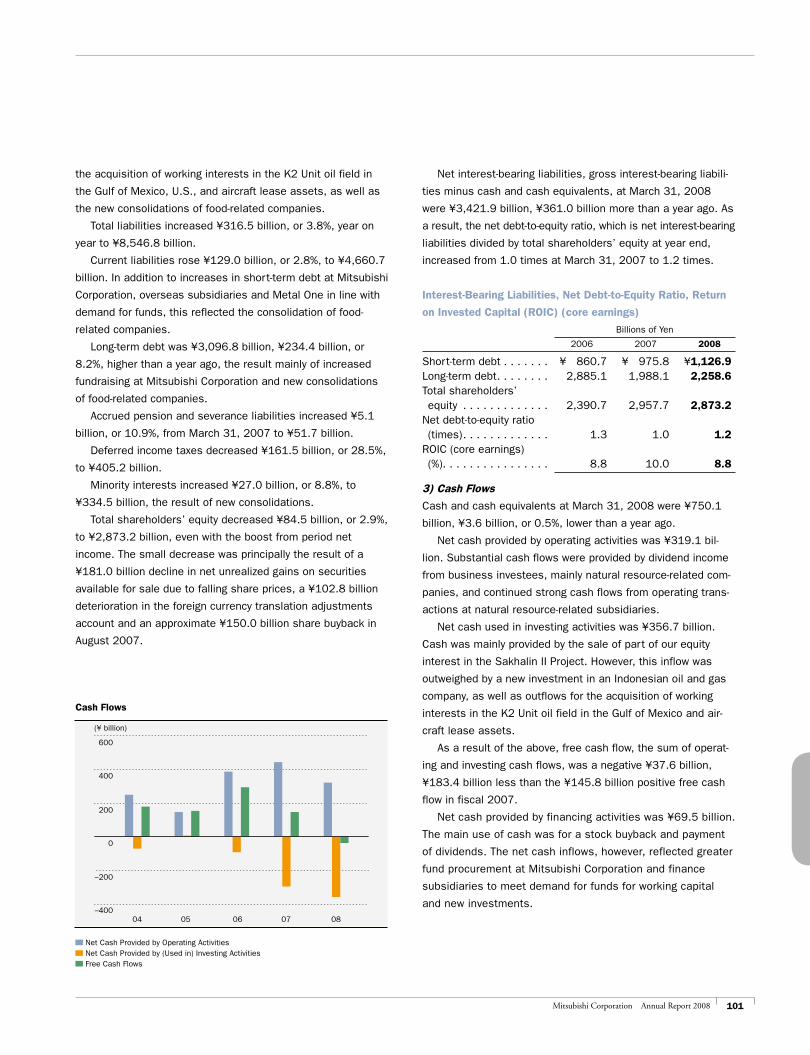
101Mitsubishi Corporation Annual Report 2008
the acquisition of working interests in the K2 Unit oil field in
the Gulf of Mexico, U.S., and aircraft lease assets, as well as
the new consolidations of food-related companies.
Total liabilities increased ¥316.5 billion, or 3.8%, year on
year to ¥8,546.8 billion.
Current liabilities rose ¥129.0 billion, or 2.8%, to ¥4,660.7
billion. In addition to increases in short-term debt at Mitsubishi
Corporation, overseas subsidiaries and Metal One in line with
demand for funds, this reflected the consolidation of food-
related companies.
Long-term debt was ¥3,096.8 billion, ¥234.4 billion, or
8.2%, higher than a year ago, the result mainly of increased
fundraising at Mitsubishi Corporation and new consolidations
of food-related companies.
Accrued pension and severance liabilities increased ¥5.1
billion, or 10.9%, from March 31, 2007 to ¥51.7 billion.
Deferred income taxes decreased ¥161.5 billion, or 28.5%,
to ¥405.2 billion.
Minority interests increased ¥27.0 billion, or 8.8%, to
¥334.5 billion, the result of new consolidations.
Total shareholders’ equity decreased ¥84.5 billion, or 2.9%,
to ¥2,873.2 billion, even with the boost from period net
income. The small decrease was principally the result of a
¥181.0 billion decline in net unrealized gains on securities
available for sale due to falling share prices, a ¥102.8 billion
deterioration in the foreign currency translation adjustments
account and an approximate ¥150.0 billion share buyback in
August 2007.
Net interest-bearing liabilities, gross interest-bearing liabili-
ties minus cash and cash equivalents, at March 31, 2008
were ¥3,421.9 billion, ¥361.0 billion more than a year ago. As
a result, the net debt-to-equity ratio, which is net interest-bearing
liabilities divided by total shareholders’ equity at year end,
increased from 1.0 times at March 31, 2007 to 1.2 times.
Interest-Bearing Liabilities, Net Debt-to-Equity Ratio, Return
on Invested Capital (ROIC) (core earnings)
Billions of Yen
2006 2007 2008
Short-term debt . . . . . . . ¥ 860.7 ¥ 975.8 ¥1,126.9Long-term debt . . . . . . . . 2,885.1 1,988.1 2,258.6Total shareholders’ equity . . . . . . . . . . . . . 2,390.7 2,957.7 2,873.2Net debt-to-equity ratio (times) . . . . . . . . . . . . . 1.3 1.0 1.2ROIC (core earnings) (%). . . . . . . . . . . . . . . . 8.8 10.0 8.8
3) Cash Flows
Cash and cash equivalents at March 31, 2008 were ¥750.1
billion, ¥3.6 billion, or 0.5%, lower than a year ago.
Net cash provided by operating activities was ¥319.1 bil-
lion. Substantial cash flows were provided by dividend income
from business investees, mainly natural resource-related com-
panies, and continued strong cash flows from operating trans-
actions at natural resource-related subsidiaries.
Net cash used in investing activities was ¥356.7 billion.
Cash was mainly provided by the sale of part of our equity
interest in the Sakhalin II Project. However, this inflow was
outweighed by a new investment in an Indonesian oil and gas
company, as well as outflows for the acquisition of working
interests in the K2 Unit oil field in the Gulf of Mexico and air-
craft lease assets.
As a result of the above, free cash flow, the sum of operat-
ing and investing cash flows, was a negative ¥37.6 billion,
¥183.4 billion less than the ¥145.8 billion positive free cash
flow in fiscal 2007.
Net cash provided by financing activities was ¥69.5 billion.
The main use of cash was for a stock buyback and payment
of dividends. The net cash inflows, however, reflected greater
fund procurement at Mitsubishi Corporation and finance
subsidiaries to meet demand for funds for working capital
and new investments.
600
400
200
0
–200
–40006 0704 05 08
Net Cash Provided by Operating Activities Net Cash Provided by (Used in) Investing Activities Free Cash Flows
Cash Flows
(¥ billion)
102 Mitsubishi Corporation Annual Report 2008
7. Strategic Issues1) Management Issues and Plans
1. Overview of Previous Medium-term Management Plan—
INNOVATION 2007
Recap of 4-Year INNOVATION 2007 Plan
Mitsubishi Corporation (MC) recently completed INNOVATION
2007, a four-year medium-term management plan launched in
fiscal 2005, which envisioned MC as “a new industry innova-
tor.” Under this plan, we took steps to strengthen core busi-
nesses centered on what we call our Strategic Fields, and in
fields that we see as strategically important for the future. As
a result of these actions, MC has managed to post record
consolidated net income for five straight years. In fiscal 2008,
net income reached a new record of ¥462.8 billion and total
shareholders’ equity at March 31, 2008 stood at approxi-
mately ¥2.9 trillion. Mitsubishi Corporation’s credit ratings
have also improved. We have thus not only seen our earnings
increase substantially, but we are now also much stronger
operationally and financially. Leveraging our substantially
higher shareholders’ equity, we invested nearly ¥2 trillion
during INNOVATION 2007’s 4-year period as we redoubled
initiatives geared toward achieving sustained growth. At the
same time, we worked to develop new businesses that will
drive growth over the medium term. Actions included establish-
ing two new business groups: Business Innovation Group, and
Industrial Finance, Logistics & Development Group. And MC
has also focused on developing and utilizing its people through
such initiatives as establishing the Center for Human
Resources Development, which is developing human resources
across the Group in an integrated manner. Besides these
actions, MC has strengthened its internal control systems,
enhanced its system infrastructure and taken other actions to
continuously strengthen its management system.
Overview of Investments Under 4-Year INNOVATION 2007 Plan
During the 4 years of INNOVATION 2007, MC invested a total
of approximately ¥1,900.0 billion: approximately ¥700.0 bil-
lion in the “hop” period covering fiscal 2005 and fiscal 2006,
and approximately ¥1,200.0 billion in the latter “step” period
covering fiscal 2007 and fiscal 2008.
In terms of the main investments during the “step” period,
MC invested ¥188.0 billion in its so-called Next-Generation Core
Businesses, mainly Finance businesses. In Strategic Fields, MC
made investments totaling ¥460.0 billion in the energy and
metal resources fields. This included acquiring working interests
in oil and gas fields in Indonesia and the Gulf of Mexico, U.S.A.,
and investing in coking coal operations in Australia. In addition,
MC invested in and consolidated publicly listed companies in
the food area, purchased shares in Hokuetsu Paper Mills, Ltd.
and SPDC Ltd., and made investments to strengthen the steel
products business, among other investments.
The net increase in investment assets, such as fixed
assets and investment securities, after deducting the effect of
asset sales and other divestitures, during the 4 years of
INNOVATION 2007 was approximately ¥1,150.0 billion.
2. New Medium-Term Management Plan—INNOVATION 2009
In April this year, we launched a new two-year medium-term
management plan ending in March 2010. Called INNOVATION
2009, this new plan carries on the same basic stance as its
four-year predecessor. In short, under INNOVATION 2009, MC
aims to contribute to the continuous advancement of society
while sustaining its growth and raising consolidated corporate
value as a global business enterprise.
The Vision
INNOVATION 2009 has the same vision as INNOVATION
2007—to make MC “a new industry innovator.” This vision
called on MC to continue growing along with society with the
lofty ambition of opening up a new era. MC plans to continue
doing so by capitalizing upon global change to create new-era
trends. INNOVATION 2009 thus reaffirms our vision of develop-
ing along with society.
Positioning of Two-year Period
In an era high in uncertainty, MC regards the next two years as
a period for both building on its achievements thus far and
consolidating on its position for the future. In line with this
thinking, it will create future growth drivers while enhancing the
quality of its business portfolio by prioritizing resources more
than ever before. We will also make further efforts to
strengthen Group management, internal control systems and
other aspects of our management system.
Numerical Targets
We have set specific numerical targets for the new plan so as
to continue delivering at least 15% ROE on average over the
medium and long terms. For fiscal 2009, ending March 31,
2009, our target is consolidated net income of ¥580.0 billion.
And, provided there is no major change in the present eco-
nomic environment, such as in resource prices, we aim to
grow consolidated net income to between ¥600.0 billion and
¥700.0 billion in fiscal 2010.
Basic Concepts
We continue to see each of the three basic concepts (on the
following pages) of INNOVATION 2007 as important themes and
will execute management initiatives to realize each of them.
103Mitsubishi Corporation Annual Report 2008
(1) Grasp Change and Open Up A New Era for MC
(Develop Growth Strategy)
a. Execute Global Growth Initiatives:
MC will strengthen its Company-wide framework by appointing
a Corporate Functional Officer (Global Strategy), whose job will
be to comprehensively identify constant change around the
world and propose strategies based on this information, and
Regional CROs, who will assist with those efforts from a
management standpoint. MC will also appoint Regional
CROs, who will reflect information provided by front-line
operations in a timely manner in business strategy.
b. Promote Innovation in New Fields, etc.:
To create future earnings drivers, MC is currently developing
businesses centered on the three Next-Generation Core
Businesses: Medical Health Care, New Energy & the Envi-
ronment, and Finance. We will continue to enhance our
systems and structures to further promote coordinated,
Company-wide actions in new fields.
c. Establish Systems and Structures to Support Growth:
We will strengthen Company-wide management functions
and expedite decision-making by revamping our manage-
ment structures and internal systems. On April 1, 2008 for
example, we further separated management and execution
roles to further strengthen Company-wide management
functions and the ability of business groups to execute
strategy. This was done by revamping the Executive Commit-
tee, Board of Directors and other management meetings;
appointing senior executive vice presidents who will be
responsible for dealing with important management issues
as assistants to the president from an operational perspec-
tive; and handing more discretional authority to GCEOs.
Moreover, business divisions, as the key unit for executing
growth strategies, will work to effectively utilize finite busi-
ness resources and enhance the quality of our business
portfolio to drive growth over the medium and long terms. In
this endeavor, we will clarify the positioning of each busi-
ness division and reallocate business resources
accordingly.
(2) Develop Human Assets
(Utilize and Develop Human Assets)
MC will continue to create systems and an environment glob-
ally across the Group to enable our diverse workforce to realize
their potential. These systems and environment will aid us in
retaining and nurturing employees who can support our growth
and in motivating our people. Moreover, to effectively utilize
our finite workforce, MC will dynamically deploy and reassign
people with the necessary skills to areas and regions expected
to grow going forward. MC hopes that this will stimulate the
organization and people’s career aspirations.
(3) Reinforce Internal Systems
(Continuously Strengthen the Management System)
At the same time as fostering a greater sense of unity as a
group of companies, MC is committed to creating a corporate
group linked by trust and responsibility while strengthening the
management base of each company. To this end, MC will
enhance the functions of its offices worldwide and further
refine compliance, internal controls, process reform and
system infrastructure on a Group-wide basis. The goal is to
increase the overall corporate value of MC on a consolidated
basis and sustain growth and in this way contribute to the
advancement of society.
2) Basic Policy Regarding the Appropriation of Profits
Investment Plans
Mitsubishi Corporation plans to invest up to around ¥1.5 tril-
lion during the two-year INNOVATION 2009 medium-term man-
agement plan with the aim of sustaining growth. Our plan is to
invest heavily in the metal resources and energy fields, which
we expect to remain key earnings drivers, as well as what we
call our Next-Generation Core Businesses (New Energy & the
Environment, Medical Health Care and Finance), which we see
as future sources of earnings. Substantial investments are
also earmarked for the machinery, chemicals, living essentials
and other fields, where growth is anticipated going forward.
Capital Structure Policy and Dividend Policy
Our policy is to sustain growth and maximize corporate value
through global growth initiatives that balance earnings growth,
capital efficiency and financial soundness. For this, we will
continue to utilize retained earnings for investments to drive
growth, with the aim of achieving average ROE of at least 15%
over the medium and long terms.
In terms of our dividend policy, we aim to increase the
annual dividend per share through earnings growth, with a
targeted consolidated payout ratio of 20%, and thereby
increase shareholder returns. In this vein, we will also pur-
chase treasury stocks flexibly depending on earnings growth,
progress with our investment plans and other factors.
We paid a fiscal 2008 dividend per common share of ¥56,
higher than the ¥52 initially forecast, in light of net income of
¥462.8 billion exceeding our October 2007 earnings projection.
Mitsubishi Corporation plans to pay a dividend of ¥72 per
share for fiscal 2009 in accordance with the above policy,
providing it achieves its current consolidated net income fore-
cast of ¥580.0 billion.
104 Mitsubishi Corporation Annual Report 2008
[For Reference: Annual Ordinary Dividends]
Fiscal 2003=¥8 per common share
Fiscal 2004=¥12 per common share
Fiscal 2005=¥18 per common share
Fiscal 2006=¥35 per common share
Fiscal 2007=¥46 per common share
Fiscal 2008=¥56 per common share
Acquisition of Treasury Stock
In August 2007, Mitsubishi Corporation acquired approximately
51.8 million of its own shares, equivalent to roughly 3% of
total issued shares, for ¥150.1 billion. The acquisition was
conducted from the standpoint of implementing a flexible capi-
tal structure policy according to changes in the business envi-
ronment. For the time being, Mitsubishi Corporation has no
plans to extinguish the shares but will hold them as treasury
stock with the view to using them for M&As and in other ways
to support its growth strategy.
3) Main Investment Activities
In May 2007, through our U.S. subsidiary MCX Gulf of Mexico,
LLC (MCX), we teamed up with Nippon Oil Exploration Limited’s
subsidiary, Nippon Oil Exploration U.S.A. Limited (NOEX USA), to
acquire, through a joint bid, 23.2% (11.6% each) of the 65%
working interest owned by U.S. company Anadarko Petroleum
Corporation (Anadarko) in the K2 Unit oil field in the Gulf of
Mexico. The K2 Unit is located approximately 200 kilometers
offshore of the State of Louisiana in a deep sea area with a water
depth of 1,300 meters. Large oil and gas fields have been discov-
ered and are being developed in the area surrounding the K2
Unit, raising hopes that further exploration and development
programs will lead to discovery of new oil and gas reserves. The
U.S. Gulf of Mexico is home to many producing oil and gas fields,
but still harbors considerable potential for future exploration and
development. We have continued business activities in this area
for a long time, regarding it as a key region in our oil and natural
gas development program. Besides seeking to expand business
further in this reserve-rich area going forward, we intend to
actively develop our business in other strategically important
regions, including Southeast Asia, North and West Africa, and the
U.K. North Sea.
In June 2007, we purchased an additional equity interest
in Nosan through a tender offer bid (TOB), raising our share-
holding to 56.22%, which made this company a consolidated
subsidiary. Nosan has manufactured and consistently sup-
plied quality formulated animal feed in the animal feed and
livestock industry. MC has a longstanding, cordial business
relationship with Nosan as a partner in businesses producing,
processing and selling beef in Japan. MC and Nosan first
began their business relationship in the trade of animal feed
ingredients and formulated feed. Subsequently, MC worked
with Nosan to help it build a competitive production system.
By wedding Nosan’s animal feed production technology devel-
opment and production technology capabilities as well as
production infrastructure with our ability to procure raw materi-
als for animal feed, meat production and processing technol-
ogy capabilities and expertise in selling meat, we aim to
strengthen the integrated business structure from upstream
to downstream. We believe that such collaboration will help
strengthen Nosan’s earnings base and lead to higher corpo-
rate value. At the same time as making this TOB, we also
made TOBs for shares of Nihon Shokuhin Kako Co., Ltd. and
Nitto Fuji Flour Milling Co., Ltd., similarly making these
companies consolidated subsidiaries.
In September 2007, we raised our shareholding from
21.09% to 30.39% in SPDC Ltd. (“SPDC”) by purchasing addi-
tional shares from other shareholders, including Japan Bank
for International Cooperation. Since SPDC’s establishment, we
have contributed as a core company to the business manage-
ment and expansion of SHARQ, a Saudi Arabia petrochemical
operation 50%-owned by SPDC. We purchased an additional
12.4% stake in SPDC in 2004 and a further 9.3% in 2007,
making us the second-largest shareholder behind Japan Bank
for International Cooperation. SHARQ produces ethylene, ethyl-
ene glycol and polyethylene from competitively priced raw
materials in oil- and natural gas-rich Saudi Arabia. SHARQ is
currently in the midst of third-stage expansion work that will
double production capacity of these products in 2008. After
this new capacity comes on stream, we will look to expand
sales of SHARQ products to China and other countries around
the world as the trading company chosen as the agent for
SPDC. At the same time, we aim to strengthen our value chain,
including in respect of transactions of these products in the
mid- and downstream areas.
4) Outlook for Fiscal Year Ending March 31, 2009
We are forecasting consolidated operating transactions of
¥25,000.0 billion, ¥1,897.0 billion higher than fiscal 2008.
Gross profit is forecast to rise ¥477.8 billion to ¥1,650.0
billion due to higher coking coal prices and other factors.
Operating income is forecast to rise ¥329.9 billion to
¥685.0 billion. This forecast assumes that growth in gross
profit will exceed a projected ¥139.0 billion increase in selling,
general and administrative expenses accompanying new con-
solidations and business expansion.
Net income is projected to increase ¥117.2 billion to
¥580.0 billion.
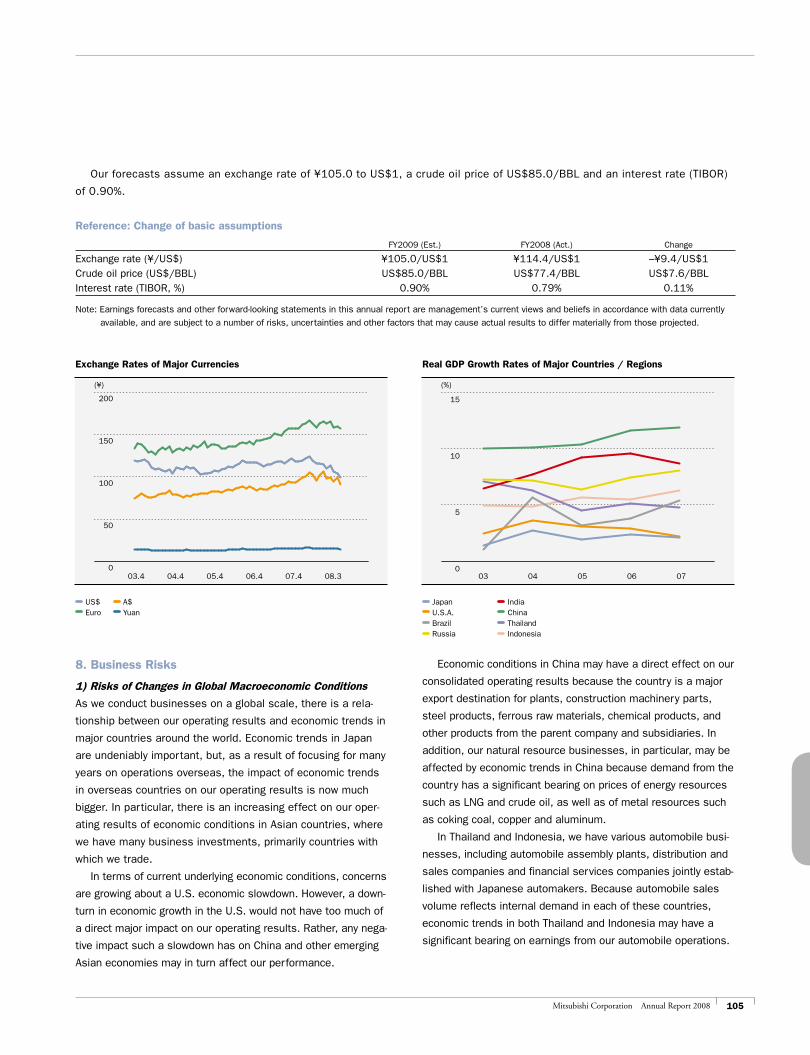
105Mitsubishi Corporation Annual Report 2008
Our forecasts assume an exchange rate of ¥105.0 to US$1, a crude oil price of US$85.0/BBL and an interest rate (TIBOR)
of 0.90%.
Reference: Change of basic assumptions
FY2009 (Est.) FY2008 (Act.) Change
Exchange rate (¥/US$) ¥105.0/US$1 ¥114.4/US$1 –¥9.4/US$1Crude oil price (US$/BBL) US$85.0/BBL US$77.4/BBL US$7.6/BBLInterest rate (TIBOR, %) 0.90% 0.79% 0.11%
Note: Earnings forecasts and other forward-looking statements in this annual report are management’s current views and beliefs in accordance with data currently
available, and are subject to a number of risks, uncertainties and other factors that may cause actual results to differ materially from those projected.
03.4 04.4 05.4 06.4 08.307.40
50
100
150
200
03 04 05 06 070
5
10
15
Real GDP Growth Rates of Major Countries / Regions
(%)
Exchange Rates of Major Currencies
(¥)
8. Business Risks
1) Risks of Changes in Global Macroeconomic Conditions
As we conduct businesses on a global scale, there is a rela-
tionship between our operating results and economic trends in
major countries around the world. Economic trends in Japan
are undeniably important, but, as a result of focusing for many
years on operations overseas, the impact of economic trends
in overseas countries on our operating results is now much
bigger. In particular, there is an increasing effect on our oper-
ating results of economic conditions in Asian countries, where
we have many business investments, primarily countries with
which we trade.
In terms of current underlying economic conditions, concerns
are growing about a U.S. economic slowdown. However, a down-
turn in economic growth in the U.S. would not have too much of
a direct major impact on our operating results. Rather, any nega-
tive impact such a slowdown has on China and other emerging
Asian economies may in turn affect our performance.
Economic conditions in China may have a direct effect on our
consolidated operating results because the country is a major
export destination for plants, construction machinery parts,
steel products, ferrous raw materials, chemical products, and
other products from the parent company and subsidiaries. In
addition, our natural resource businesses, in particular, may be
affected by economic trends in China because demand from the
country has a significant bearing on prices of energy resources
such as LNG and crude oil, as well as of metal resources such
as coking coal, copper and aluminum.
In Thailand and Indonesia, we have various automobile busi-
nesses, including automobile assembly plants, distribution and
sales companies and financial services companies jointly estab-
lished with Japanese automakers. Because automobile sales
volume reflects internal demand in each of these countries,
economic trends in both Thailand and Indonesia may have a
significant bearing on earnings from our automobile operations.
US$ A$ Euro Yuan
Japan U.S.A. Brazil Russia
India China Thailand Indonesia
106 Mitsubishi Corporation Annual Report 2008
2) Market Risks
(Unless otherwise stated, calculations of effects on future
financial statements are based on consolidated results for
fiscal 2008.)
(1) Commodity Market Risk
In the course of our business activities, we are exposed to
various risks relating to movements in prices of commodities
as a trader, an owner of rights to natural and energy
resources, and a producer and seller of industrial products of
our investees. Product categories that may have a large impact
on our operating results are as follows:
(Energy Resources)
We hold upstream rights to LNG and crude oil, and/or liquefac-
tion facilities in Western Australia, Malaysia, Brunei and other
regions. Movements in LNG and crude oil prices may have a
significant impact on operating results in these businesses.
Fundamentally, LNG prices are linked to crude oil prices. As
an estimate, a US$1/BBL fluctuation in the price of crude oil
would have an approximate ¥1 billion effect on net income for
LNG and crude oil combined, mainly through a change in
equity method earnings. However, fluctuations in the price of
LNG and crude oil might not be immediately reflected in our
operating results because of timing differences.
(Metal Resources)
Through wholly owned Australian subsidiary MDP, we produce
and sell more than 28 million tons of coal per year, mainly
coking coal, a steelmaking raw material. Fluctuations in the
price of coking coal may affect our consolidated operating
results through MDP’s earnings. The majority of the coking
coal is sold on the basis of annual contracts, and the price is
set once a year through negotiations with purchasers and
becomes the price that is used for shipments in the applicable
fiscal year. Therefore, movements in the price of coking coal
during fiscal 2009 are expected to have only a small impact on
our operating results because prices have already been set for
the majority of coal to be sold by MDP in fiscal 2009. However,
MDP’s operating results cannot be determined by the coal
price alone since MDP’s operating results are also significantly
affected by other factors besides coal prices, such as fluctua-
tions in exchange rates for the Australian dollar, U.S. dollar
and yen, production costs, and sales volumes.
In addition, as a producer, we are exposed to the risk of
price fluctuations in copper and aluminum. A US$100 fluctua-
tion in the price per MT of copper would have a ¥0.8 billion
effect on consolidated net income, while a US$100 fluctuation
in the price per MT of aluminum would have a ¥1.0 billion
effect on our consolidated net income.
(Petrochemical Products)
We are engaged in a broad range of trading activities for petro-
chemical products manufactured from raw materials such as naph-
tha and natural gas. The prices of petrochemical products are
largely determined for each product on an individual basis based
on the prices of the above raw materials, supply-demand dynamics
and other factors. Fluctuations in the prices of these raw materials
may affect earnings from these trading transactions.
We have made investments in manufacturing and sales
companies for petrochemicals such as ethylene glycol, paraxy-
lene and methanol in Saudi Arabia, Malaysia and Venezuela. Our
equity method earnings would be affected by changes in the
operating results of these companies due to price movements.
(2) Foreign Currency Risk
We bear some risk of fluctuations in foreign currency rates rela-
tive to the yen in the course of our trading activities. While we use
forward contracts and other hedging strategies, there is no assur-
ance that we can completely avoid foreign currency risk.
In addition, because dividends received from overseas
businesses and equity in earnings of overseas consolidated
subsidiaries and equity method affiliates are relatively high in
proportion to our net income, and because most of these
earnings are denominated in foreign currencies, which are
converted to yen solely for reporting purposes, an appreciation
in the yen relative to foreign currencies has a negative impact
on consolidated net income. In terms of sensitivity, a ¥1
change relative to the U.S. dollar would have an approximate
¥2.7 billion effect on consolidated net income.
Regarding our investments in overseas businesses, an
appreciation in the yen poses the risk of lowering sharehold-
ers’ equity through a negative effect on the foreign currency
translation adjustments account. Consequently, we imple-
ment various measures to prevent increased exposure to
foreign currency risk on investments, such as by hedging
foreign currency risks with respect to new large investments.
However, there is no assurance that we can completely avoid
these risks.
(3) Stock Price Risk
As of March 31, 2008, we owned approximately ¥1,650.0
billion (market value basis) of marketable equities, mostly
equity issues of customers, suppliers and MC Group compa-
nies. These investments expose us to the risk of fluctuations
in equity prices. As of the same date, we had net unrealized
gains of approximately ¥800.0 billion based on market
prices, a figure that could change depending on future trends
in equity prices.
107Mitsubishi Corporation Annual Report 2008
In Mitsubishi Corporation’s corporate pension fund, some
of the pension assets managed are marketable equities.
Accordingly, a fall in equity prices could cause an increase in
pension expenses by reducing pension assets.
(4) Interest Rate Risk
As of March 31, 2008, we had gross interest-bearing liabili-
ties of approximately ¥4,183.6 billion. Because almost all
of these liabilities bear floating interest rates, there is a
risk of an increase in interest expenses caused by a rise in
interest rates.
However, the vast majority of these interest-bearing liabilities
are offset by trade receivables, loans receivable and other oper-
ating assets that are positively affected by changes in interest
rates. Because a rise in interest rates produces an increase in
income from these assets, while there is a time lag, interest
rate risk is offset. For the remaining interest-bearing liabilities
exposed to interest rate risk without such offsets, commensu-
rate asset holdings such as investment securities, property and
equipment generate trading income as well as other income
streams such as dividends that are strongly correlated with
economic cycles. Accordingly, even if interest rates increase as
the economy improves, leading to higher interest expenses, we
believe that these expenses would be offset by an increase in
income from the corresponding asset holdings.
However, our operating results may be negatively affected
temporarily if there is a rapid rise in interest rates because
increased income from commensurate asset holdings would fail
to offset the effects of a preceding increase in interest expenses.
To monitor market movements in interest rates and respond
flexibly to market risks, we established the ALM (Asset Liability
Management) Committee. This committee establishes fund
procurement strategy and manages interest rate risk exposure.
3) Credit Risk
We extend credit to customers in the form of trade credit, includ-
ing accounts receivables and advance payments, advances,
guarantees and investments due to our various operating trans-
actions. We are therefore exposed to credit risk in the form of
losses arising from deterioration in the credit of or bankruptcy of
customers. Furthermore, we utilize derivative instruments, pri-
marily swaps, options and futures, for the purpose of hedging
risks. In this case, we are exposed to the credit risk of the coun-
terparties to these derivative instruments.
To manage this risk, we have established credit and trans-
action limits for each customer as well as introduced an inter-
nal rating system. Related BUs carry out necessary internal
approval procedures based on a system whereby authorization
limits are determined by these internal ratings and the amount
of credit. We also hedge risk by requiring collateral or a guaran-
tee depending on the credit profile of the counterparty.
However, there is no guarantee that we will be able to com-
pletely avoid credit risk with these risk hedging strategies.
Therefore, failure to collect trade receivables and other credit
due to the bankruptcy of a customer or other event would
affect our operating results.
4) Country Risk
We bear country risk in relation to transactions and investments
with overseas companies in the form of delays or inability to
collect money or conduct business activities due to socioeco-
nomic conditions in the countries where they are domiciled.
We take appropriate risk hedging measures that involve, in
principle, hedges via third parties through such means as
taking out insurance, depending on the nature of the project.
Furthermore, we have established a Country Risk Committee,
under which country risk is managed through a country risk
countermeasure system. The country risk countermeasure
system classifies countries with which we trade into six catego-
ries based on risk exposure in terms of total investments,
advances, guarantees and trade receivables, net of hedges, as
well as creditworthiness by country (country rating). Country
risk is controlled through the establishment of risk limits for
each category.
However, even with these risk hedging measures, it is dif-
ficult to completely avoid risks caused by deterioration in the
political, economic, or social conditions in the countries or
regions where our customers, portfolio companies or Mitsubishi
Corporation have ongoing projects. Such eventualities may
have a significant impact on our operating results.
5) Business Investment Risk
We participate in the management of various companies by
acquiring equity and other types of interests. These business
investment activities are carried out with the aim of expanding
our business and deriving capital gains. However, we bear vari-
ous risks related to business investments, such as the possible
inability to recover our investments and exit losses and being
unable to earn the planned return on investment. Regarding the
management of business investment risk, in the case of new
business investments, we quantitatively monitor the downside
risk of investments and evaluate whether the investment return
exceeds the minimum expected rate of return, which is deter-
mined internally according to the extent of the risk. After invest-
ing, we manage risk on an individual basis with respect to
business investments to achieve the investment goals set forth
in the business plan formulated every year.
108 Mitsubishi Corporation Annual Report 2008
Furthermore, we apply exit rules for the early sale of our
equity interest or the liquidation of the investee in order to
preserve the quality of our asset portfolio.
While we follow strict standards for the selection and man-
agement of investments, it is impossible to completely avoid
the risk of investments not delivering the expected profits.
Therefore, we may incur losses resulting from such actions as
the withdrawal from an investment.
6) Risks Related to Specific Investments
(1) Investment in and Operations with Mitsubishi Motors
Corporation
After evaluating Mitsubishi Motors Corporation’s (MMC)
Business Revitalization Plan announced in May 2004 and the
subsequent Mitsubishi Motors Revitalization Plan announced
in January 2005, following requests by MMC, Mitsubishi
Corporation injected equity totaling ¥140.0 billion in MMC
through January 2006 by subscribing to private placements of
MMC shares. As a result, our risk exposure to MMC was
roughly ¥205.0 billion as of March 31, 2008.
For fiscal 2008, ended March 31, 2008, the final year of
the aforementioned Mitsubishi Motors Revitalization Plan,
MMC posted consolidated sales of ¥2,682.1 billion, operating
profit of ¥108.6 billion and net income of ¥34.7 billion. In
February 2008, MMC announced a new mid-term management
plan and is now working to build the foundations of growth.
In addition to having direct business dealings with MMC, we
cooperate with this automaker in countries around the world to
conduct businesses centered on local sales companies and
downstream business fields. Some examples are automobile-
related distribution and sales companies in Asia and finance
businesses in Europe. Our risk exposure to operating assets in
connection with these dealings, investments in businesses,
advances and other related business was approximately
¥215.0 billion as of March 31, 2008.
Our total MMC-related risk exposure, including both the
aforementioned risk exposure to MMC proper and our risk
exposure to related business, was thus roughly ¥420.0 billion
as of March 31, 2008.
(2) Investment in Sakhalin II Project
Mitsubishi Corporation, together with OAO Gazprom (Gazprom),
Royal Dutch/Shell Group and Mitsui & Co., Ltd., is participat-
ing in the Sakhalin II Project, an LNG and crude oil develop-
ment project on Sakhalin, Russian Federation, through a joint
venture, Sakhalin Energy Investment Co., Ltd.
This project began first-stage development activities with
the commencement of oil production in July 1999 and a final
investment decision for stage-two development activities (year-
round production of crude oil (currently on half-year basis) and
LNG production) was made in May 2003. Stage-two develop-
ment activities, which were commenced thereafter, are now
more than 90% complete.
As of March 31, 2008, Mitsubishi Corporation held a 10%
stake in Sakhalin Energy Investment and had invested approxi-
mately ¥200.0 billion in this company. As a result of selling
part of its equity interest in Sakhalin Energy Investment to
Gazprom in 2007, Mitsubishi Corporation no longer applies the
equity method to its investment in Sakhalin Energy Investment.
7) Risks Related to Compliance
We are engaged in businesses in all industries through our many
offices around the world. These activities subject us to a wide
variety of laws and regulations. Specifically, we must comply with
the Corporate Law, tax laws, Financial Instruments and Exchange
Law, anti-monopoly laws, trade-related laws, environmental laws
and various business laws in Japan. In addition, in the course of
conducting business overseas, we must abide by the laws and
regulations in the countries and regions where we operate.
We have established a Compliance Committee, which is
headed by a Chief Compliance Officer, who is at the forefront
of our efforts to raise awareness of compliance. This officer
also directs and supervises compliance with laws and regula-
tions on a consolidated basis.
Notwithstanding these initiatives, compliance risks cannot
be completely avoided. Failure to fulfill our obligations under
related laws and regulations could affect our businesses and
operating results.
8) Risks From Natural Disasters
A natural disaster, such as an earthquake, heavy rain or flood,
that damages Mitsubishi Corporation’s offices, facilities or
systems and affects employees could hinder sales and produc-
tion activities.
Mitsubishi Corporation has established adequate counter-
measures, having prepared an employee safety check system;
disaster contingency manual for business contingency plan
(BCP) execution; earthquake-proof measures for buildings,
facilities or systems (including backup of data); and introduced a
program of disaster prevention drills. However, no amount of
preparation of this sort can completely avoid the risk of damage
caused by a natural disaster. Accordingly, damage from a natu-
ral disaster could affect the company’s operating results.
109Mitsubishi Corporation Annual Report 2008
9. Critical Accounting EstimatesThe preparation of these financial statements requires man-
agement to make estimates that may affect the reported
amounts of assets and liabilities, the disclosure of contingent
assets and liabilities at the date of the fiscal year end and the
reported amounts of revenues and expenses during the report-
ing period. On an ongoing basis, management reviews its
estimates and judgments, including the valuation of receiv-
ables, investments, long-lived assets, inventories, revenue
recognition, income taxes, financing activities, restructuring
costs, pension benefits, contingencies, litigation and others.
Management bases its estimates and judgments on historical
experience and on various other factors that are believed to be
reasonable under the circumstances, the results of which form
the basis for making judgments about the carrying values of
assets and liabilities that are not readily apparent from other
sources. Actual results may differ from these estimates under
different assumptions or conditions.
Management believes the following are our critical account-
ing policies and estimates. These policies and estimates were
considered “critical” because:
•theestimaterequiresustomakeassumptionsaboutmat-
ters that are highly uncertain at the time the estimate is
made, and
•differentassumptionsthatwereasonablycouldhaveusedin
the current period could have a material impact on the pre-
sentation of our financial condition, changes in financial
condition, or results of operations.
1) Valuation of Receivables
The valuation of receivables is a critical accounting estimate,
as the balance of our trade receivables, notes and loans is
significant. We perform ongoing credit valuations of our cus-
tomers and adjust credit limits based upon the customer’s
payment history and current credit worthiness, as determined
by our review of the customer’s current credit information. We
continuously monitor collections and payments from our cus-
tomers and we establish credit limits and an allowance for
doubtful accounts based upon factors surrounding specific
customer collection issues that we have identified, past credit
loss experience, historical trends, evaluation of potential
losses in the receivables outstanding, credit ratings from appli-
cable agencies and other information.
For each of our customers, we monitor financial condition,
credit level and collections on receivables as part of an effort
to reach an appropriate accounting estimate for the allowance
for doubtful accounts. Also, for the valuation of long-term
loans receivables, we use the discounted cash flow method,
which is based on assumptions such as an estimate of the
future repayment plan and discount rates.
For the year ended March 31, 2007, we decreased our total
allowance for doubtful accounts by ¥14.9 billion, or 15.4%, to
¥81.9 billion.
For the year ended March 31, 2008, we decreased our
total allowance for doubtful accounts by ¥11.4 billion, or
13.9%, to ¥70.5 billion. The allowance for doubtful
accounts represented approximately 2.0% and 1.6% of our
total receivables (current and non-current) as of March 31,
2007 and 2008, respectively.
Management believes that the evaluation of receivables is
reasonable, the balance of the allowance for doubtful accounts
is adequate and the receivables are presented at net realiz-
able value; however, these valuations include uncertainties
that may result in the need for the company to increase the
allowance for doubtful accounts in the future.
2) Valuation of Investments
The valuation of investments is a critical accounting estimate
because fair value is susceptible to change from period to
period, and also because the outstanding balance of our
investments is significant.
We assess impairment of investments by considering
whether a decline in value is other-than-temporary based on
the length of time and the extent to which the fair value has
been less than the carrying value and our intent and ability to
retain the investment for a period of time sufficient to allow for
any anticipated recovery in fair value. We assess impairment
of available-for-sale securities based on their market values,
while equity method investments and other investments are
assessed by considering their market values, financial condi-
tion, performance, business circumstance, near-term pros-
pects and future cash flows of the issuer.
If the decline in value is judged to be other-than-temporary, the
carrying value of the investment is written down to fair value.
In each of the last three years, we have tested investments
for impairment using similar methods and in each year we
determined that, based on our assumptions, certain invest-
ments should be recognized as impaired. For the years ended
March 31, 2006, 2007 and 2008, impairment losses of ¥8.1
billion, ¥4.3 billion, and ¥14.9 billion respectively, were recog-
nized in “Gain on marketable securities and investments-net”
in the consolidated statements of income to reflect the
declines in fair value of certain available-for-sale securities,
investments in affiliated companies and other investments
that were considered to be other-than-temporary.
110 Mitsubishi Corporation Annual Report 2008
Management believes that the carrying value of its invest-
ments and evaluation of its investments whether not to be
other-than-temporary impaired is reasonable; however, these
valuations are subject to a number of uncertainties which may
require further write-downs in the future.
3) Impairment of Long-Lived Assets
We review the carrying value of our long-lived assets, other
than goodwill and other intangible assets, to be held and used,
and to be disposed of, for impairment whenever events or
changes in circumstances indicate that the carrying amount of
an asset might not be recoverable.
Recoverability of assets to be held and used is measured
by a comparison of the carrying amount of the asset to esti-
mated undiscounted future net cash flows expected to be
generated by the asset. A long lived asset to be disposed of by
sale is reported at the lower of the carrying amount or fair
value less costs to sell, and is no longer depreciated. A long
lived asset to be disposed of other than by sale is considered
as held and used until disposed of.
If the carrying value of the asset is considered impaired, an
impairment loss is recorded for the amount by which the carry-
ing value of the asset exceeds its estimated fair value. An
asset to be disposed of by sale is reported at the lower of the
carrying amount or estimated fair value less costs to sell.
Estimated fair values of assets are primarily determined
based on independent appraisals and discounted cash flow
analysis. These evaluations use many estimates and assump-
tions such as future market growth, forecast revenue and
costs, expected periods of utilization of the assets, discount
rates and other factors.
In each of the last three years, we have determined that,
based on our estimates and assumptions, certain long-lived
assets should be recognized as impaired. These amounts are
included in “Loss on property and equipment-net“ in the con-
solidated statements of income. For the years ended March
31, 2006, 2007 and 2008, such impairment losses amounted
to ¥5.3 billion, ¥9.5 billion and ¥7.9 billion respectively.
During the year ended March 31, 2008, as a result of a
profitability decline caused by the deterioration of business
environment due to an increase in competition, and to change
in management policies of subsidiaries, we recognized impair-
ment losses for long-lived assets, including fuelling station and
land owned by a subsidiary.
Management believes that the estimates of discounted
cash flows and fair values are reasonable; however, these
valuations are subject to a number of uncertainties that may
change the valuation of the long-lived assets due to
unforeseen changes in business assumptions, and as a result,
may require us to recognize further impairment in the future.
4) Pension Benefit Costs and Obligations
Employee pension benefit costs and obligations are dependent
on assumptions used by actuaries in calculating such
amounts. The discount rate and the expected long-term rate of
return on plan assets are two critical assumptions in determin-
ing periodic pension benefit costs and pension liabilities. We
evaluate these assumptions annually or when events occur
that may have an impact on these critical assumptions.
The discount rate assumptions are determined on the rate
available on high-quality fixed-income investments with a dura-
tion that approximately matches our employees’ estimated
period of service and benefit payments at the respective mea-
surement dates of each plan. We increased the weighted aver-
age discount rate to 3.0%, an increase of 0.4 of a percentage
point for the year ended March 31, 2007. For the year ended
March 31, 2008, we set the weighted average discount rate at
3.1%, up 0.1 of a percentage point from the previous year, due
to the increase in long-term interest rates.
The assumption for the expected long-term return on plan
assets is determined after considering the investment policy,
long-term historical returns, asset allocation, and future
estimates of long-term investment returns. We estimated the
expected long-term rate of return as 4.2% for the year ended
March 31, 2007. As there was a downturn in investment
returns, due mainly to a slowdown of the uptrend in the
domestic equity market, we calculated pension benefit costs
for the year ended March 31, 2008 assuming a 3.7% rate of
return, a decrease of 0.5 of a percentage point from the
previous year.
In accordance with U.S. GAAP, the difference between
actual results and assumptions is accumulated and amortized
over future periods. Therefore, actual results generally affect
the expenses recognized in future periods. Management
believes that the actuarial assumptions and methods used are
appropriate in the circumstances; however, differences in
actual experience or changes in assumptions may affect the
pension obligations and future expenses.
5) Revenue Recognition
We are engaged in business activities such as buying and sell-
ing of various commodities worldwide, providing financing for
customers and suppliers relating to such activities, and organiz-
ing and coordinating industrial projects through our global busi-
ness networks. We conduct import, export, offshore and
domestic production, sales, marketing and distribution of a wide
variety of products, including steel resources and non-ferrous
111Mitsubishi Corporation Annual Report 2008
metals, oil and gas products, machinery, information technology
and electronics, chemicals, food products and general con-
sumer merchandise. We also perform various services such as
consulting, information technology services, technical support,
transportation and logistics. Revenue recognition policies
require difficult judgments on complex matters that are often
subject to multiple sources of authoritative guidance applied to
individually complex transactions. In general, we recognize
revenues when they are realized or realizable and earned.
Revenues are realized or realizable and earned when we have
persuasive evidence of an arrangement, the goods have been
delivered or the services have been rendered to the customer,
the sales price is fixed or determinable and collectibility is rea-
sonably assured. In addition to this general policy, the following
are specific revenue recognition policies.
• Revenues from trading, manufacturing and other activities—
We derive revenues from trading, manufacturing and other
activities. Manufacturing and other activities are typically
conducted through consolidated subsidiaries.
Trading activities
We derive revenues from margins related to various trading
transactions in which we act as a principal, carry commodity
inventory, and make a profit or loss on the spread between bid
and asked prices for commodities.
Manufacturing activities
Manufacturing activities include the manufacture of a wide
variety of products, such as electronics, metals, machinery,
chemicals and general consumer merchandise, and the devel-
opment of natural resources.
Revenues from trading and manufacturing activities are
recognized at the time the delivery conditions, as agreed to by
customers, are met. These conditions are usually considered
to have been met when the goods are received by the cus-
tomer, title to the warehouse receipts are transferred, or the
implementation testing is duly completed and any future obli-
gations are perfunctory and do not affect the customer’s final
acceptance of the arrangement.
For long term construction businesses, depending on the
nature of the contract, revenues from long term construction
projects are accounted for by the completed contract method,
unless costs to complete and extent of progress toward com-
pletion of long term contracts are reasonably dependable, in
which case we use the percentage of completion method.
Other activities
Other activities consist of services, and rental or leasing activi-
ties. Service-related activities include performance of various
services such as financial and logistics services, information
and communications, technical support and other service
related activities. We are also engaged in certain rental or
leasing properties, including office buildings, aircraft and other
industrial assets.
Revenues from service-related activities are recorded as
revenue when the contracted services are rendered to third
party customers pursuant to the agreements. Revenues from
rental or leasing activities are recognized over the terms of the
underlying leases on a straight line basis.
• Trading margins and commissions on trading transactions—
We derive revenues from margins and commissions related to
various trading transactions in which we act as a principal or
an agent. Through our trading activities, we facilitate our cus-
tomers’ purchases and sales of commodities and other prod-
ucts and charge a commission for this service. The trading
margins and commissions are recognized when we have met
the general policy conditions as stated above.
6) Derivatives
We utilize derivative instruments primarily to manage interest
rate risks, to reduce exposure to movements in foreign
exchange rates, and to hedge various inventory and trading
commitments. In accordance with Statement of Financial
Accounting Standards (“SFAS”) No. 133, “Accounting for
Derivative Instruments and Hedging Activities,” as amended by
SFAS No. 138, No. 149 and No. 155 (collectively “SFAS
No. 133”), all derivative instruments are reported on the bal-
ance sheet at fair value. SFAS No. 133 establishes criteria for
designation and effectiveness of hedging relationships.
With the adoption of SFAS No. 133, we are required to
make assumptions in order to estimate the fair value of deriva-
tive instruments for which quoted market prices are not avail-
able and related hedged items.
Generally, on the date on which the derivative contract is
executed, we designate such derivative as either a fair value
hedge or a cash flow hedge to the extent that hedging criteria
are met. Changes in fair values of derivatives that are desig-
nated as fair value hedges are recognized in earnings as off-
sets to the changes in fair value of related hedged assets,
liabilities and firm commitments. Derivative instruments desig-
nated as cash flow hedges include interest rate swaps to
convert floating liabilities to fixed rate liabilities and foreign
currency swaps to mitigate variability of the functional currency
equivalent cash flows of certain debt obligations. Changes in
fair values of derivatives that are designated as cash flow
hedges are deferred and recorded as a component of accumu-
lated other comprehensive income (loss) until the hedged
transactions occur and are recognized in earnings.
112 Mitsubishi Corporation Annual Report 2008
7) Recent Accounting Pronouncements
In September 2006, the FASB issued SFAS No. 157, “Fair
Value Measurements.” SFAS No. 157 defines fair value,
establishes a framework for measuring fair value, and expands
disclosures about fair value measurements. SFAS No. 157 is
effective for fiscal years beginning after November 15, 2007.
The companies will adopt SFAS No. 157 as of April 1, 2008.
The companies expect the adoption of SFAS No. 157 will not
have a material effect on the companies’ consolidated finan-
cial position and results of operations.
In February 2007, the FASB issued SFAS No. 159, “The
Fair Value Option for Financial Assets and Financial Liabilities
Including an amendment of FASB Statement No. 115.” SFAS
No. 159 provides companies with an option to report selected
financial assets and liabilities at fair value. Unrealized gains
and losses on items for which the fair value option has been
elected will be recognized in earnings. SFAS No. 159 is effec-
tive for fiscal years beginning after November 15, 2007. The
companies will adopt SFAS No. 159 as of April 1, 2008. The
companies expect the adoption of SFAS No. 159 will not have
a material effect on the companies’ consolidated financial
position and results of operations.
In December 2007, the FASB issued SFAS No. 141 (revised
2007), “Business Combinations,” (“SFAS No. 141R”). SFAS
No. 141R establishes principles and requirements for how an
acquirer recognizes and measures in its financial statements
the identifiable assets acquired, the liabilities assumed, any
noncontrolling interest in the acquiree and the goodwill
acquired. SFAS No. 141R also establishes disclosure require-
ments to enable the evaluation of the nature and financial
effects of the business combination. SFAS No. 141R is effec-
tive for fiscal years beginning after December 15, 2008. The
companies will adopt SFAS No. 141R as of April 1, 2009. The
companies are currently reviewing SFAS No. 141R to estimate
its impact on the companies’ consolidated financial position
and results of operations.
In December 2007, the FASB issued SFAS No. 160, “Non-
controlling Interests in Consolidated Financial Statements—an
amendment of ARB No. 51.” SFAS No. 160 establishes
accounting and reporting standards for ownership interests in
subsidiaries held by parties other than the parent, the amount
of consolidated net income attributable to the parent and to
the noncontrolling interest, changes in a parent’s ownership
interest, and the valuation of retained noncontrolling equity
investments when a subsidiary is deconsolidated. SFAS No.
160 also establishes disclosure requirements that clearly
identify and distinguish between the interests of the parent
and the interests of the noncontrolling owners. SFAS No. 160
is effective for fiscal years beginning after December 15,
2008. The companies will adopt SFAS No. 160 as of April 1,
2009. The companies are currently reviewing SFAS No. 160 to
estimate its impact on the companies’ consolidated financial
position and results of operations.

113Mitsubishi Corporation Annual Report 2008
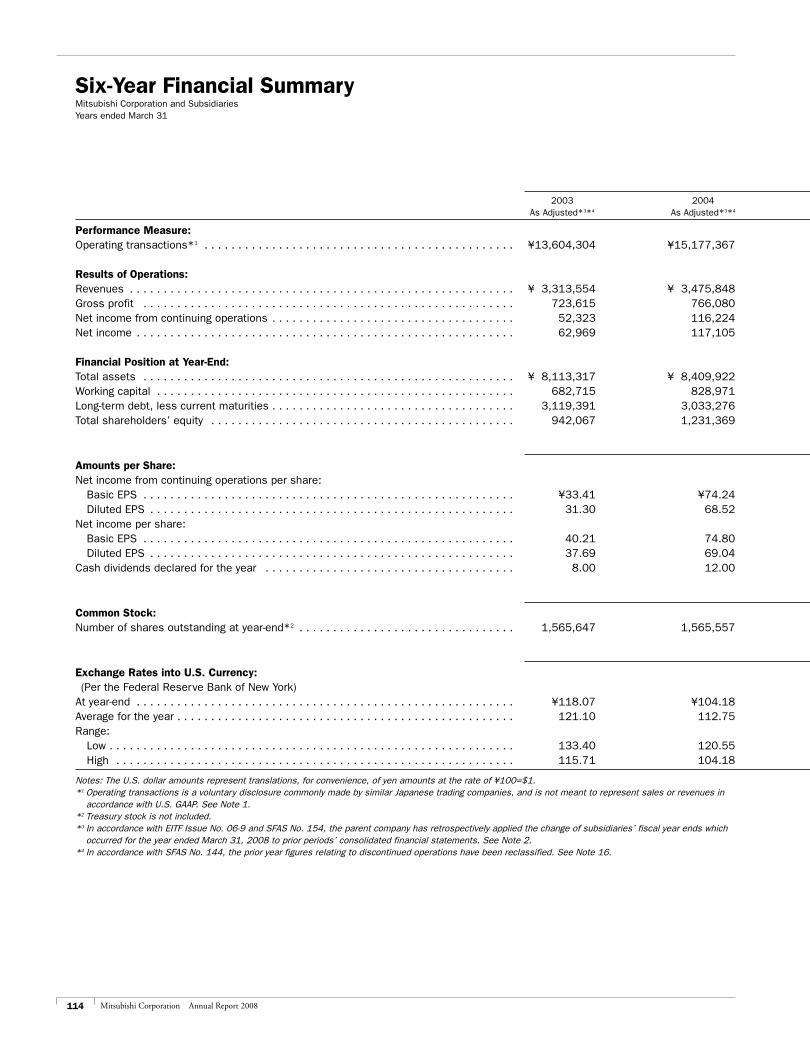
114 Mitsubishi Corporation Annual Report 2008
Millions of Millions of Yen U.S. Dollars
2003 2004 2005 2006 2007 2008 2008 As Adjusted*3*4 As Adjusted*3*4 As Adjusted*3*4 As Adjusted*3*4 As Adjusted*3*4
Performance Measure:Operating transactions*1 . . . . . . . . . . . . . . . . . . . . . . . . . . . . . . . . . . . . . . . . . . . . . . ¥13,604,304 ¥15,177,367 ¥17,122,034 ¥19,069,181 ¥20,526,570 ¥23,103,043 $231,030
Results of Operations:Revenues . . . . . . . . . . . . . . . . . . . . . . . . . . . . . . . . . . . . . . . . . . . . . . . . . . . . . . . . . ¥ 3,313,554 ¥ 3,475,848 ¥ 4,133,338 ¥ 4,812,087 ¥ 5,068,749 ¥ 6,030,806 $ 60,308Gross profit . . . . . . . . . . . . . . . . . . . . . . . . . . . . . . . . . . . . . . . . . . . . . . . . . . . . . . . 723,615 766,080 878,707 1,052,990 1,145,532 1,172,222 11,722Net income from continuing operations . . . . . . . . . . . . . . . . . . . . . . . . . . . . . . . . . . . . 52,323 116,224 185,671 356,949 420,745 466,392 4,664Net income . . . . . . . . . . . . . . . . . . . . . . . . . . . . . . . . . . . . . . . . . . . . . . . . . . . . . . . . 62,969 117,105 183,879 353,286 415,518 462,788 4,628
Financial Position at Year-End:Total assets . . . . . . . . . . . . . . . . . . . . . . . . . . . . . . . . . . . . . . . . . . . . . . . . . . . . . . . ¥ 8,113,317 ¥ 8,409,922 ¥ 9,086,031 ¥10,375,304 ¥11,495,527 ¥11,754,439 $117,544Working capital . . . . . . . . . . . . . . . . . . . . . . . . . . . . . . . . . . . . . . . . . . . . . . . . . . . . . 682,715 828,971 1,017,681 1,246,194 1,339,852 1,430,739 14,307Long-term debt, less current maturities . . . . . . . . . . . . . . . . . . . . . . . . . . . . . . . . . . . . 3,119,391 3,033,276 2,975,701 2,875,398 2,862,408 3,096,818 30,968Total shareholders’ equity . . . . . . . . . . . . . . . . . . . . . . . . . . . . . . . . . . . . . . . . . . . . . 942,067 1,231,369 1,513,900 2,390,687 2,957,728 2,873,210 28,732
Yen U.S. Dollars
Amounts per Share:Net income from continuing operations per share: Basic EPS . . . . . . . . . . . . . . . . . . . . . . . . . . . . . . . . . . . . . . . . . . . . . . . . . . . . . . . ¥33.41 ¥74.24 ¥118.59 ¥219.63 ¥249.39 ¥281.13 $2.81 Diluted EPS . . . . . . . . . . . . . . . . . . . . . . . . . . . . . . . . . . . . . . . . . . . . . . . . . . . . . . 31.30 68.52 109.53 209.69 248.04 279.87 2.80Net income per share: Basic EPS . . . . . . . . . . . . . . . . . . . . . . . . . . . . . . . . . . . . . . . . . . . . . . . . . . . . . . . 40.21 74.80 117.45 217.38 246.30 278.95 2.79 Diluted EPS . . . . . . . . . . . . . . . . . . . . . . . . . . . . . . . . . . . . . . . . . . . . . . . . . . . . . . 37.69 69.04 108.48 207.53 244.96 277.71 2.78Cash dividends declared for the year . . . . . . . . . . . . . . . . . . . . . . . . . . . . . . . . . . . . . 8.00 12.00 18.00 35.00 46.00 56.00 0.56
Thousands of Shares
Common Stock:Number of shares outstanding at year-end*2 . . . . . . . . . . . . . . . . . . . . . . . . . . . . . . . . 1,565,647 1,565,557 1,565,749 1,685,767 1,688,303 1,641,203
Yen per U.S. Dollar
Exchange Rates into U.S. Currency: (Per the Federal Reserve Bank of New York)At year-end . . . . . . . . . . . . . . . . . . . . . . . . . . . . . . . . . . . . . . . . . . . . . . . . . . . . . . . . ¥118.07 ¥104.18 ¥107.22 ¥117.48 ¥117.56 ¥ 99.85Average for the year . . . . . . . . . . . . . . . . . . . . . . . . . . . . . . . . . . . . . . . . . . . . . . . . . . 121.10 112.75 107.28 113.67 116.55 113.61Range: Low . . . . . . . . . . . . . . . . . . . . . . . . . . . . . . . . . . . . . . . . . . . . . . . . . . . . . . . . . . . . 133.40 120.55 114.30 120.93 121.81 124.09 High . . . . . . . . . . . . . . . . . . . . . . . . . . . . . . . . . . . . . . . . . . . . . . . . . . . . . . . . . . . 115.71 104.18 102.26 104.41 110.07 96.88
Six-Year Financial SummaryMitsubishi Corporation and SubsidiariesYears ended March 31
Notes: The U.S. dollar amounts represent translations, for convenience, of yen amounts at the rate of ¥100=$1.*1 Operating transactions is a voluntary disclosure commonly made by similar Japanese trading companies, and is not meant to represent sales or revenues in
accordance with U.S. GAAP. See Note 1.*2 Treasury stock is not included.*3 In accordance with EITF Issue No. 06-9 and SFAS No. 154, the parent company has retrospectively applied the change of subsidiaries’ fiscal year ends which
occurred for the year ended March 31, 2008 to prior periods’ consolidated financial statements. See Note 2.*4 In accordance with SFAS No. 144, the prior year figures relating to discontinued operations have been reclassified. See Note 16.
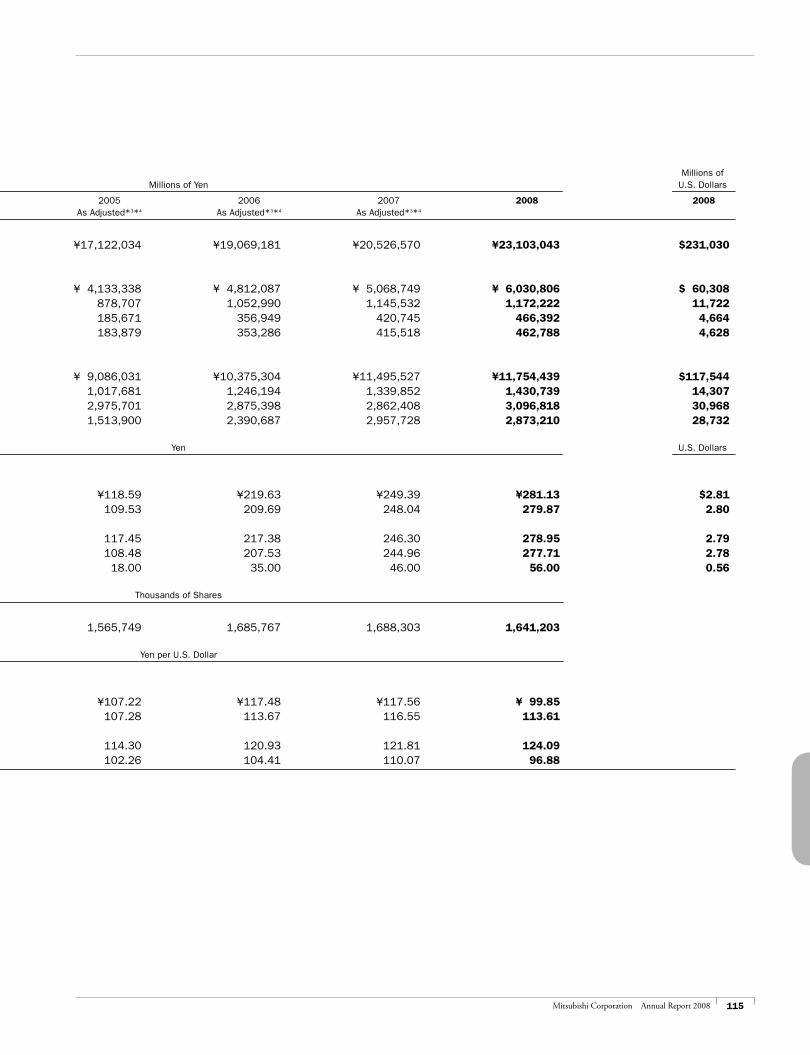
115Mitsubishi Corporation Annual Report 2008
Millions of Millions of Yen U.S. Dollars
2003 2004 2005 2006 2007 2008 2008 As Adjusted*3*4 As Adjusted*3*4 As Adjusted*3*4 As Adjusted*3*4 As Adjusted*3*4
Performance Measure:Operating transactions*1 . . . . . . . . . . . . . . . . . . . . . . . . . . . . . . . . . . . . . . . . . . . . . . ¥13,604,304 ¥15,177,367 ¥17,122,034 ¥19,069,181 ¥20,526,570 ¥23,103,043 $231,030
Results of Operations:Revenues . . . . . . . . . . . . . . . . . . . . . . . . . . . . . . . . . . . . . . . . . . . . . . . . . . . . . . . . . ¥ 3,313,554 ¥ 3,475,848 ¥ 4,133,338 ¥ 4,812,087 ¥ 5,068,749 ¥ 6,030,806 $ 60,308Gross profit . . . . . . . . . . . . . . . . . . . . . . . . . . . . . . . . . . . . . . . . . . . . . . . . . . . . . . . 723,615 766,080 878,707 1,052,990 1,145,532 1,172,222 11,722Net income from continuing operations . . . . . . . . . . . . . . . . . . . . . . . . . . . . . . . . . . . . 52,323 116,224 185,671 356,949 420,745 466,392 4,664Net income . . . . . . . . . . . . . . . . . . . . . . . . . . . . . . . . . . . . . . . . . . . . . . . . . . . . . . . . 62,969 117,105 183,879 353,286 415,518 462,788 4,628
Financial Position at Year-End:Total assets . . . . . . . . . . . . . . . . . . . . . . . . . . . . . . . . . . . . . . . . . . . . . . . . . . . . . . . ¥ 8,113,317 ¥ 8,409,922 ¥ 9,086,031 ¥10,375,304 ¥11,495,527 ¥11,754,439 $117,544Working capital . . . . . . . . . . . . . . . . . . . . . . . . . . . . . . . . . . . . . . . . . . . . . . . . . . . . . 682,715 828,971 1,017,681 1,246,194 1,339,852 1,430,739 14,307Long-term debt, less current maturities . . . . . . . . . . . . . . . . . . . . . . . . . . . . . . . . . . . . 3,119,391 3,033,276 2,975,701 2,875,398 2,862,408 3,096,818 30,968Total shareholders’ equity . . . . . . . . . . . . . . . . . . . . . . . . . . . . . . . . . . . . . . . . . . . . . 942,067 1,231,369 1,513,900 2,390,687 2,957,728 2,873,210 28,732
Yen U.S. Dollars
Amounts per Share:Net income from continuing operations per share: Basic EPS . . . . . . . . . . . . . . . . . . . . . . . . . . . . . . . . . . . . . . . . . . . . . . . . . . . . . . . ¥33.41 ¥74.24 ¥118.59 ¥219.63 ¥249.39 ¥281.13 $2.81 Diluted EPS . . . . . . . . . . . . . . . . . . . . . . . . . . . . . . . . . . . . . . . . . . . . . . . . . . . . . . 31.30 68.52 109.53 209.69 248.04 279.87 2.80Net income per share: Basic EPS . . . . . . . . . . . . . . . . . . . . . . . . . . . . . . . . . . . . . . . . . . . . . . . . . . . . . . . 40.21 74.80 117.45 217.38 246.30 278.95 2.79 Diluted EPS . . . . . . . . . . . . . . . . . . . . . . . . . . . . . . . . . . . . . . . . . . . . . . . . . . . . . . 37.69 69.04 108.48 207.53 244.96 277.71 2.78Cash dividends declared for the year . . . . . . . . . . . . . . . . . . . . . . . . . . . . . . . . . . . . . 8.00 12.00 18.00 35.00 46.00 56.00 0.56
Thousands of Shares
Common Stock:Number of shares outstanding at year-end*2 . . . . . . . . . . . . . . . . . . . . . . . . . . . . . . . . 1,565,647 1,565,557 1,565,749 1,685,767 1,688,303 1,641,203
Yen per U.S. Dollar
Exchange Rates into U.S. Currency: (Per the Federal Reserve Bank of New York)At year-end . . . . . . . . . . . . . . . . . . . . . . . . . . . . . . . . . . . . . . . . . . . . . . . . . . . . . . . . ¥118.07 ¥104.18 ¥107.22 ¥117.48 ¥117.56 ¥ 99.85Average for the year . . . . . . . . . . . . . . . . . . . . . . . . . . . . . . . . . . . . . . . . . . . . . . . . . . 121.10 112.75 107.28 113.67 116.55 113.61Range: Low . . . . . . . . . . . . . . . . . . . . . . . . . . . . . . . . . . . . . . . . . . . . . . . . . . . . . . . . . . . . 133.40 120.55 114.30 120.93 121.81 124.09 High . . . . . . . . . . . . . . . . . . . . . . . . . . . . . . . . . . . . . . . . . . . . . . . . . . . . . . . . . . . 115.71 104.18 102.26 104.41 110.07 96.88

116 Mitsubishi Corporation Annual Report 2008
Millions of U.S. Dollars Millions of Yen (Note 1)
ASSETS 2007 2008 2008
Current assets:Cash and cash equivalents (Note 4) . . . . . . . . . . . . . . . . . . . . . . . . . . . . . . . ¥ 753,690 ¥ 750,128 $ 7,501Time deposits . . . . . . . . . . . . . . . . . . . . . . . . . . . . . . . . . . . . . . . . . . . . . . . 13,136 11,540 115Short-term investments (Note 4) . . . . . . . . . . . . . . . . . . . . . . . . . . . . . . . . . 129,343 87,862 879Receivables—trade (Note 22): Notes and loans . . . . . . . . . . . . . . . . . . . . . . . . . . . . . . . . . . . . . . . . . . . 605,902 587,627 5,876 Accounts . . . . . . . . . . . . . . . . . . . . . . . . . . . . . . . . . . . . . . . . . . . . . . . . . 2,819,925 2,956,017 29,560 Affiliated companies . . . . . . . . . . . . . . . . . . . . . . . . . . . . . . . . . . . . . . . . 232,058 210,387 2,104 Allowance for doubtful receivables (Note 6) . . . . . . . . . . . . . . . . . . . . . . . . (35,773) (29,948) (299)Inventories . . . . . . . . . . . . . . . . . . . . . . . . . . . . . . . . . . . . . . . . . . . . . . . . . 918,635 1,075,563 10,756Advance payments to suppliers . . . . . . . . . . . . . . . . . . . . . . . . . . . . . . . . . . 164,552 129,469 1,295Deferred income taxes (Note 13) . . . . . . . . . . . . . . . . . . . . . . . . . . . . . . . . . 38,414 62,573 626Assets held for sale (Note 16) . . . . . . . . . . . . . . . . . . . . . . . . . . . . . . . . . . . 6,526 65Other current assets (Note 14) . . . . . . . . . . . . . . . . . . . . . . . . . . . . . . . . . . . 231,698 243,651 2,436
Total current assets . . . . . . . . . . . . . . . . . . . . . . . . . . . . . . . . . . . . . 5,871,580 6,091,395 60,914
Investments and non-current receivables:Investments in and advances to affiliated companies (Note 5) . . . . . . . . . . . . 1,304,949 1,084,393 10,844Other investments (Note 4) . . . . . . . . . . . . . . . . . . . . . . . . . . . . . . . . . . . . . 2,187,327 2,150,718 21,507Non-current notes, loans and accounts receivable—trade (Note 22) . . . . . . . . 477,603 515,202 5,152Allowance for doubtful receivables (Note 6) . . . . . . . . . . . . . . . . . . . . . . . . . . (46,173) (40,580) (406)
Total investments and non-current receivables . . . . . . . . . . . . . . . . . . 3,923,706 3,709,733 37,097
Property and equipment—net (Notes 7 and 22) . . . . . . . . . . . . . . . . . . . . . . 1,381,006 1,610,621 16,106
Goodwill (Note 9) . . . . . . . . . . . . . . . . . . . . . . . . . . . . . . . . . . . . . . . . . . . . 34,744 54,089 541
Other intangible assets—net (Note 9) . . . . . . . . . . . . . . . . . . . . . . . . . . . . . 65,336 73,532 735
Other assets (Notes 13 and 14) . . . . . . . . . . . . . . . . . . . . . . . . . . . . . . . . . 219,155 215,069 2,151
Total . . . . . . . . . . . . . . . . . . . . . . . . . . . . . . . . . . . . . . . . . . . . . . . . . . . . . ¥11,495,527 ¥11,754,439 $117,544
See notes to consolidated financial statements.
Consolidated Balance SheetsMitsubishi Corporation and SubsidiariesMarch 31, 2007 and 2008
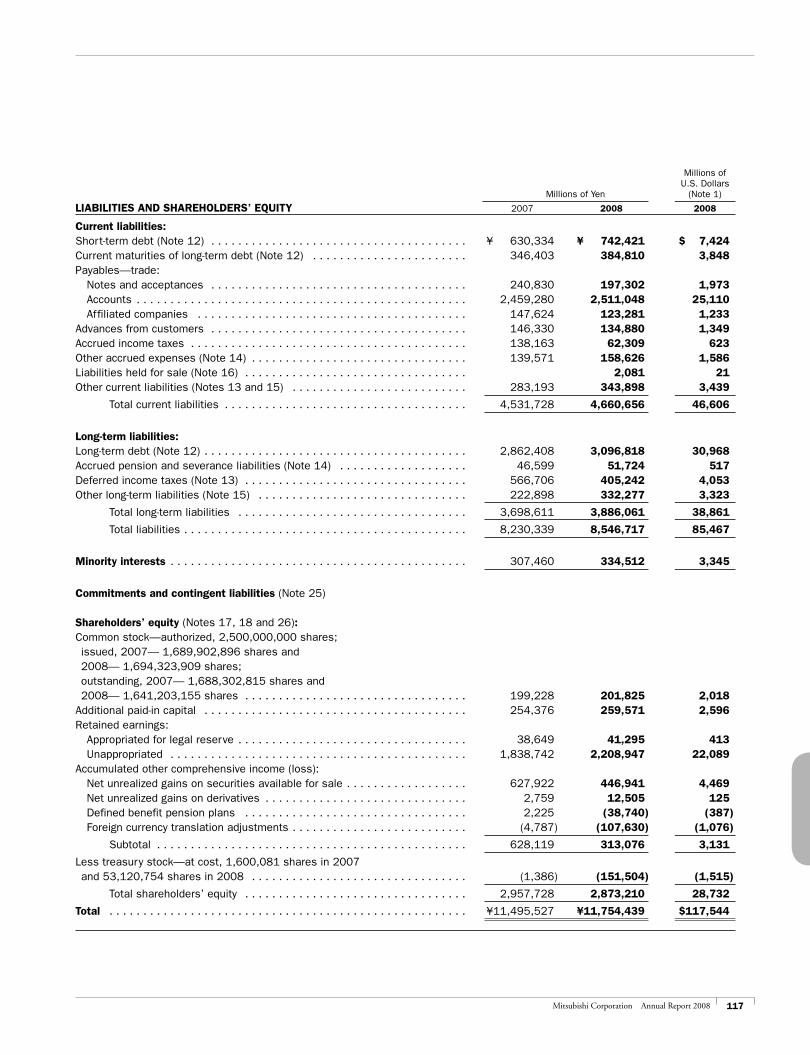
117Mitsubishi Corporation Annual Report 2008
Millions of U.S. Dollars Millions of Yen (Note 1)
LIABILITIES AND SHAREHOLDERS’ EQUITY 2007 2008 2008
Current liabilities:Short-term debt (Note 12) . . . . . . . . . . . . . . . . . . . . . . . . . . . . . . . . . . . . . . ¥ 630,334 ¥ 742,421 $ 7,424Current maturities of long-term debt (Note 12) . . . . . . . . . . . . . . . . . . . . . . . 346,403 384,810 3,848Payables—trade: Notes and acceptances . . . . . . . . . . . . . . . . . . . . . . . . . . . . . . . . . . . . . . 240,830 197,302 1,973 Accounts . . . . . . . . . . . . . . . . . . . . . . . . . . . . . . . . . . . . . . . . . . . . . . . . . 2,459,280 2,511,048 25,110 Affiliated companies . . . . . . . . . . . . . . . . . . . . . . . . . . . . . . . . . . . . . . . . 147,624 123,281 1,233Advances from customers . . . . . . . . . . . . . . . . . . . . . . . . . . . . . . . . . . . . . . 146,330 134,880 1,349Accrued income taxes . . . . . . . . . . . . . . . . . . . . . . . . . . . . . . . . . . . . . . . . . 138,163 62,309 623Other accrued expenses (Note 14) . . . . . . . . . . . . . . . . . . . . . . . . . . . . . . . . 139,571 158,626 1,586Liabilities held for sale (Note 16) . . . . . . . . . . . . . . . . . . . . . . . . . . . . . . . . . 2,081 21Other current liabilities (Notes 13 and 15) . . . . . . . . . . . . . . . . . . . . . . . . . . 283,193 343,898 3,439
Total current liabilities . . . . . . . . . . . . . . . . . . . . . . . . . . . . . . . . . . . . 4,531,728 4,660,656 46,606
Long-term liabilities:Long-term debt (Note 12) . . . . . . . . . . . . . . . . . . . . . . . . . . . . . . . . . . . . . . . 2,862,408 3,096,818 30,968Accrued pension and severance liabilities (Note 14) . . . . . . . . . . . . . . . . . . . 46,599 51,724 517Deferred income taxes (Note 13) . . . . . . . . . . . . . . . . . . . . . . . . . . . . . . . . . 566,706 405,242 4,053Other long-term liabilities (Note 15) . . . . . . . . . . . . . . . . . . . . . . . . . . . . . . . 222,898 332,277 3,323
Total long-term liabilities . . . . . . . . . . . . . . . . . . . . . . . . . . . . . . . . . . 3,698,611 3,886,061 38,861
Total liabilities . . . . . . . . . . . . . . . . . . . . . . . . . . . . . . . . . . . . . . . . . . 8,230,339 8,546,717 85,467
Minority interests . . . . . . . . . . . . . . . . . . . . . . . . . . . . . . . . . . . . . . . . . . . . 307,460 334,512 3,345
Commitments and contingent liabilities (Note 25)
Shareholders’ equity (Notes 17, 18 and 26):Common stock—authorized, 2,500,000,000 shares; issued, 2007— 1,689,902,896 shares and 2008— 1,694,323,909 shares; outstanding, 2007— 1,688,302,815 shares and 2008— 1,641,203,155 shares . . . . . . . . . . . . . . . . . . . . . . . . . . . . . . . . . 199,228 201,825 2,018Additional paid-in capital . . . . . . . . . . . . . . . . . . . . . . . . . . . . . . . . . . . . . . . 254,376 259,571 2,596Retained earnings: Appropriated for legal reserve . . . . . . . . . . . . . . . . . . . . . . . . . . . . . . . . . . 38,649 41,295 413 Unappropriated . . . . . . . . . . . . . . . . . . . . . . . . . . . . . . . . . . . . . . . . . . . . 1,838,742 2,208,947 22,089Accumulated other comprehensive income (loss): Net unrealized gains on securities available for sale . . . . . . . . . . . . . . . . . . 627,922 446,941 4,469 Net unrealized gains on derivatives . . . . . . . . . . . . . . . . . . . . . . . . . . . . . . 2,759 12,505 125 Defined benefit pension plans . . . . . . . . . . . . . . . . . . . . . . . . . . . . . . . . . 2,225 (38,740) (387) Foreign currency translation adjustments . . . . . . . . . . . . . . . . . . . . . . . . . . (4,787) (107,630) (1,076)
Subtotal . . . . . . . . . . . . . . . . . . . . . . . . . . . . . . . . . . . . . . . . . . . . . . 628,119 313,076 3,131
Less treasury stock—at cost, 1,600,081 shares in 2007 and 53,120,754 shares in 2008 . . . . . . . . . . . . . . . . . . . . . . . . . . . . . . . . (1,386) (151,504) (1,515)
Total shareholders’ equity . . . . . . . . . . . . . . . . . . . . . . . . . . . . . . . . . 2,957,728 2,873,210 28,732
Total . . . . . . . . . . . . . . . . . . . . . . . . . . . . . . . . . . . . . . . . . . . . . . . . . . . . . ¥11,495,527 ¥11,754,439 $117,544
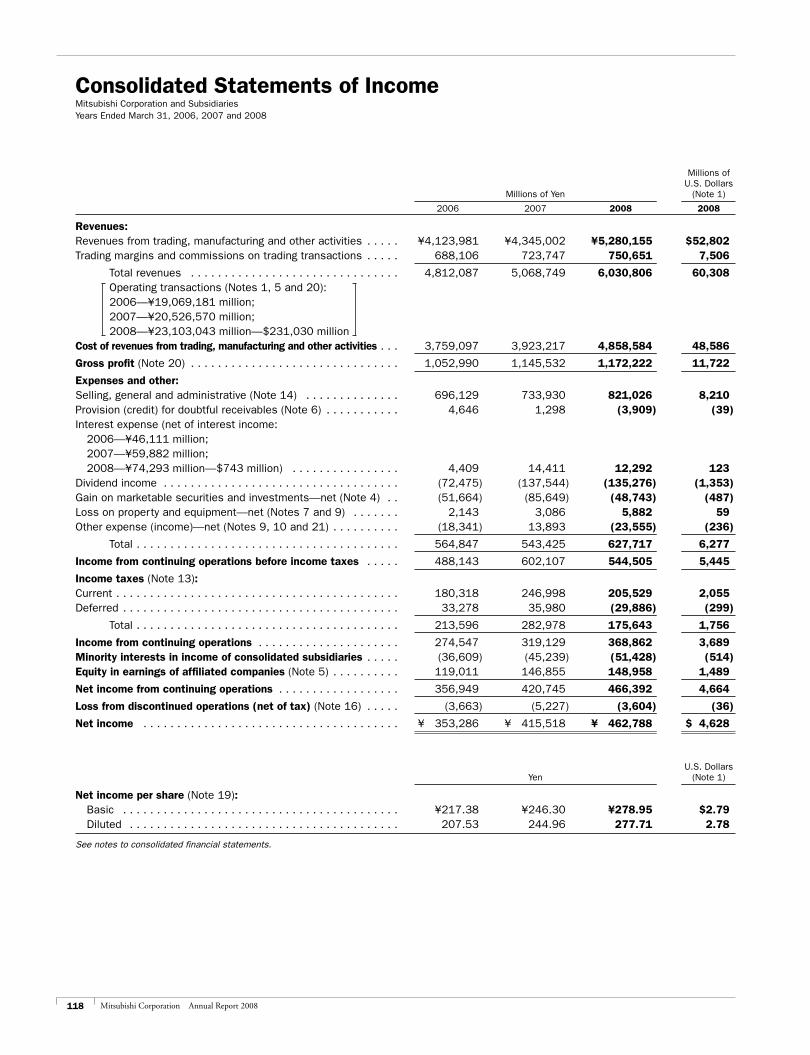
118 Mitsubishi Corporation Annual Report 2008
Millions of U.S. Dollars Millions of Yen (Note 1)
2006 2007 2008 2008
Revenues:Revenues from trading, manufacturing and other activities . . . . . ¥4,123,981 ¥4,345,002 ¥5,280,155 $52,802Trading margins and commissions on trading transactions . . . . . 688,106 723,747 750,651 7,506
Total revenues . . . . . . . . . . . . . . . . . . . . . . . . . . . . . . . 4,812,087 5,068,749 6,030,806 60,308 Operating transactions (Notes 1, 5 and 20): 2006—¥19,069,181 million; 2007—¥20,526,570 million; 2008—¥23,103,043 million—$231,030 millionCost of revenues from trading, manufacturing and other activities . . . 3,759,097 3,923,217 4,858,584 48,586
Gross profit (Note 20) . . . . . . . . . . . . . . . . . . . . . . . . . . . . . . . 1,052,990 1,145,532 1,172,222 11,722
Expenses and other:Selling, general and administrative (Note 14) . . . . . . . . . . . . . . 696,129 733,930 821,026 8,210Provision (credit) for doubtful receivables (Note 6) . . . . . . . . . . . 4,646 1,298 (3,909) (39)Interest expense (net of interest income: 2006—¥46,111 million; 2007—¥59,882 million; 2008—¥74,293 million—$743 million) . . . . . . . . . . . . . . . . 4,409 14,411 12,292 123Dividend income . . . . . . . . . . . . . . . . . . . . . . . . . . . . . . . . . . . (72,475) (137,544) (135,276) (1,353)Gain on marketable securities and investments—net (Note 4) . . (51,664) (85,649) (48,743) (487)Loss on property and equipment—net (Notes 7 and 9) . . . . . . . 2,143 3,086 5,882 59Other expense (income)—net (Notes 9, 10 and 21) . . . . . . . . . . (18,341) 13,893 (23,555) (236)
Total . . . . . . . . . . . . . . . . . . . . . . . . . . . . . . . . . . . . . . . 564,847 543,425 627,717 6,277
Income from continuing operations before income taxes . . . . . 488,143 602,107 544,505 5,445
Income taxes (Note 13):Current . . . . . . . . . . . . . . . . . . . . . . . . . . . . . . . . . . . . . . . . . . 180,318 246,998 205,529 2,055Deferred . . . . . . . . . . . . . . . . . . . . . . . . . . . . . . . . . . . . . . . . . 33,278 35,980 (29,886) (299)
Total . . . . . . . . . . . . . . . . . . . . . . . . . . . . . . . . . . . . . . . 213,596 282,978 175,643 1,756
Income from continuing operations . . . . . . . . . . . . . . . . . . . . . 274,547 319,129 368,862 3,689Minority interests in income of consolidated subsidiaries . . . . . (36,609) (45,239) (51,428) (514)Equity in earnings of affiliated companies (Note 5) . . . . . . . . . . 119,011 146,855 148,958 1,489
Net income from continuing operations . . . . . . . . . . . . . . . . . . 356,949 420,745 466,392 4,664
Loss from discontinued operations (net of tax) (Note 16) . . . . . (3,663) (5,227) (3,604) (36)
Net income . . . . . . . . . . . . . . . . . . . . . . . . . . . . . . . . . . . . . . ¥ 353,286 ¥ 415,518 ¥ 462,788 $ 4,628
U.S. Dollars Yen (Note 1)
Net income per share (Note 19): Basic . . . . . . . . . . . . . . . . . . . . . . . . . . . . . . . . . . . . . . . . . ¥217.38 ¥246.30 ¥278.95 $2.79 Diluted . . . . . . . . . . . . . . . . . . . . . . . . . . . . . . . . . . . . . . . . 207.53 244.96 277.71 2.78
See notes to consolidated financial statements.
Consolidated Statements of IncomeMitsubishi Corporation and SubsidiariesYears Ended March 31, 2006, 2007 and 2008
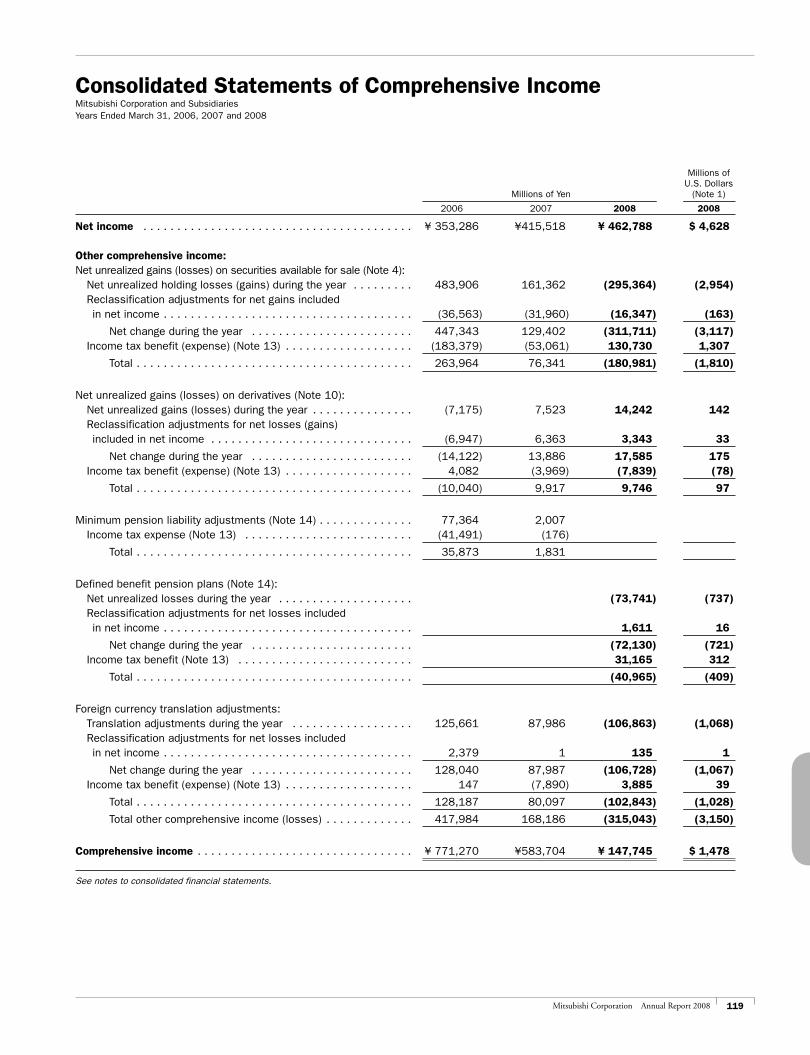
119Mitsubishi Corporation Annual Report 2008
Consolidated Statements of Comprehensive IncomeMitsubishi Corporation and SubsidiariesYears Ended March 31, 2006, 2007 and 2008
Millions of U.S. Dollars Millions of Yen (Note 1)
2006 2007 2008 2008
Net income . . . . . . . . . . . . . . . . . . . . . . . . . . . . . . . . . . . . . . . . ¥ 353,286 ¥415,518 ¥ 462,788 $ 4,628
Other comprehensive income:Net unrealized gains (losses) on securities available for sale (Note 4): Net unrealized holding losses (gains) during the year . . . . . . . . . 483,906 161,362 (295,364) (2,954) Reclassification adjustments for net gains included in net income . . . . . . . . . . . . . . . . . . . . . . . . . . . . . . . . . . . . . (36,563) (31,960) (16,347) (163)
Net change during the year . . . . . . . . . . . . . . . . . . . . . . . . 447,343 129,402 (311,711) (3,117) Income tax benefit (expense) (Note 13) . . . . . . . . . . . . . . . . . . . (183,379) (53,061) 130,730 1,307
Total . . . . . . . . . . . . . . . . . . . . . . . . . . . . . . . . . . . . . . . . . 263,964 76,341 (180,981) (1,810)
Net unrealized gains (losses) on derivatives (Note 10): Net unrealized gains (losses) during the year . . . . . . . . . . . . . . . (7,175) 7,523 14,242 142 Reclassification adjustments for net losses (gains) included in net income . . . . . . . . . . . . . . . . . . . . . . . . . . . . . . (6,947) 6,363 3,343 33
Net change during the year . . . . . . . . . . . . . . . . . . . . . . . . (14,122) 13,886 17,585 175 Income tax benefit (expense) (Note 13) . . . . . . . . . . . . . . . . . . . 4,082 (3,969) (7,839) (78)
Total . . . . . . . . . . . . . . . . . . . . . . . . . . . . . . . . . . . . . . . . . (10,040) 9,917 9,746 97
Minimum pension liability adjustments (Note 14) . . . . . . . . . . . . . . 77,364 2,007 Income tax expense (Note 13) . . . . . . . . . . . . . . . . . . . . . . . . . (41,491) (176)
Total . . . . . . . . . . . . . . . . . . . . . . . . . . . . . . . . . . . . . . . . . 35,873 1,831
Defined benefit pension plans (Note 14): Net unrealized losses during the year . . . . . . . . . . . . . . . . . . . . (73,741) (737) Reclassification adjustments for net losses included in net income . . . . . . . . . . . . . . . . . . . . . . . . . . . . . . . . . . . . . 1,611 16
Net change during the year . . . . . . . . . . . . . . . . . . . . . . . . (72,130) (721) Income tax benefit (Note 13) . . . . . . . . . . . . . . . . . . . . . . . . . . 31,165 312
Total . . . . . . . . . . . . . . . . . . . . . . . . . . . . . . . . . . . . . . . . . (40,965) (409)
Foreign currency translation adjustments: Translation adjustments during the year . . . . . . . . . . . . . . . . . . 125,661 87,986 (106,863) (1,068) Reclassification adjustments for net losses included in net income . . . . . . . . . . . . . . . . . . . . . . . . . . . . . . . . . . . . . 2,379 1 135 1
Net change during the year . . . . . . . . . . . . . . . . . . . . . . . . 128,040 87,987 (106,728) (1,067) Income tax benefit (expense) (Note 13) . . . . . . . . . . . . . . . . . . . 147 (7,890) 3,885 39
Total . . . . . . . . . . . . . . . . . . . . . . . . . . . . . . . . . . . . . . . . . 128,187 80,097 (102,843) (1,028)
Total other comprehensive income (losses) . . . . . . . . . . . . . 417,984 168,186 (315,043) (3,150)
Comprehensive income . . . . . . . . . . . . . . . . . . . . . . . . . . . . . . . . ¥ 771,270 ¥583,704 ¥ 147,745 $ 1,478
See notes to consolidated financial statements.
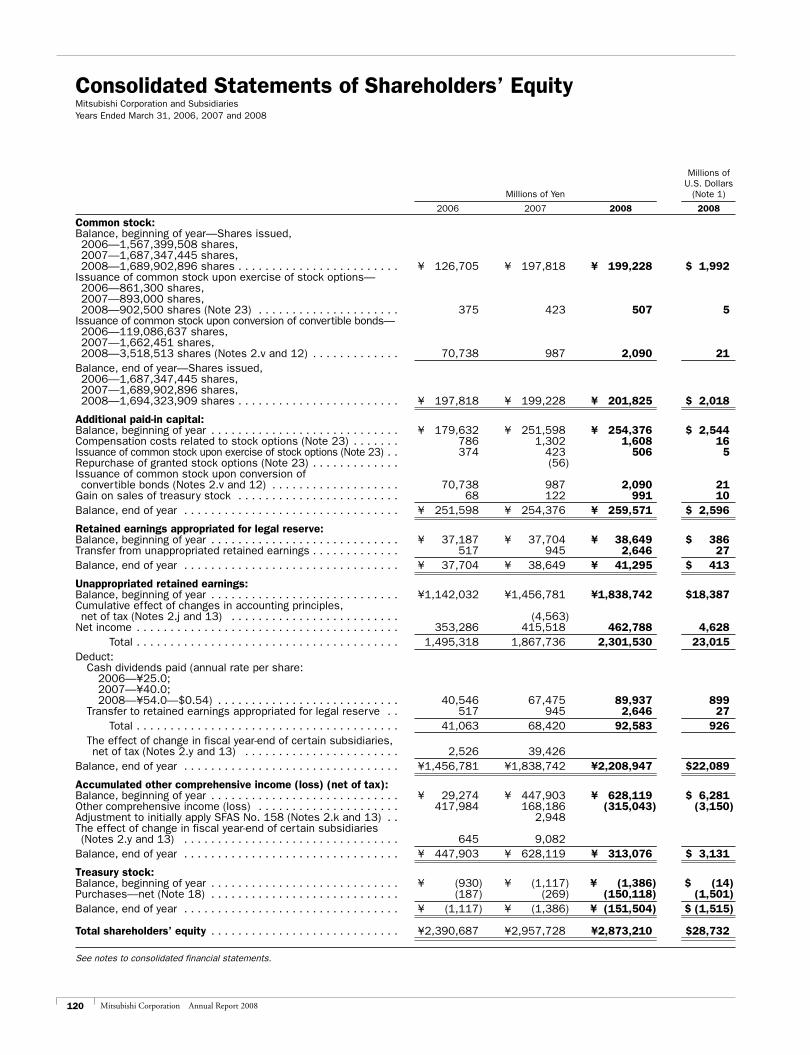
120 Mitsubishi Corporation Annual Report 2008
Consolidated Statements of Shareholders’ EquityMitsubishi Corporation and SubsidiariesYears Ended March 31, 2006, 2007 and 2008
Millions of U.S. Dollars Millions of Yen (Note 1)
2006 2007 2008 2008
Common stock:Balance, beginning of year—Shares issued, 2006—1,567,399,508 shares, 2007—1,687,347,445 shares, 2008—1,689,902,896 shares . . . . . . . . . . . . . . . . . . . . . . . . ¥ 126,705 ¥ 197,818 ¥ 199,228 $ 1,992Issuance of common stock upon exercise of stock options— 2006—861,300 shares, 2007—893,000 shares, 2008—902,500 shares (Note 23) . . . . . . . . . . . . . . . . . . . . . 375 423 507 5Issuance of common stock upon conversion of convertible bonds— 2006—119,086,637 shares, 2007—1,662,451 shares, 2008—3,518,513 shares (Notes 2.v and 12) . . . . . . . . . . . . . 70,738 987 2,090 21Balance, end of year—Shares issued, 2006—1,687,347,445 shares, 2007—1,689,902,896 shares, 2008—1,694,323,909 shares . . . . . . . . . . . . . . . . . . . . . . . . ¥ 197,818 ¥ 199,228 ¥ 201,825 $ 2,018
Additional paid-in capital:Balance, beginning of year . . . . . . . . . . . . . . . . . . . . . . . . . . . . ¥ 179,632 ¥ 251,598 ¥ 254,376 $ 2,544Compensation costs related to stock options (Note 23) . . . . . . . 786 1,302 1,608 16Issuance of common stock upon exercise of stock options (Note 23) . . 374 423 506 5Repurchase of granted stock options (Note 23) . . . . . . . . . . . . . (56)Issuance of common stock upon conversion of convertible bonds (Notes 2.v and 12) . . . . . . . . . . . . . . . . . . . 70,738 987 2,090 21Gain on sales of treasury stock . . . . . . . . . . . . . . . . . . . . . . . . 68 122 991 10Balance, end of year . . . . . . . . . . . . . . . . . . . . . . . . . . . . . . . . ¥ 251,598 ¥ 254,376 ¥ 259,571 $ 2,596
Retained earnings appropriated for legal reserve:Balance, beginning of year . . . . . . . . . . . . . . . . . . . . . . . . . . . . ¥ 37,187 ¥ 37,704 ¥ 38,649 $ 386Transfer from unappropriated retained earnings . . . . . . . . . . . . . 517 945 2,646 27Balance, end of year . . . . . . . . . . . . . . . . . . . . . . . . . . . . . . . . ¥ 37,704 ¥ 38,649 ¥ 41,295 $ 413
Unappropriated retained earnings:Balance, beginning of year . . . . . . . . . . . . . . . . . . . . . . . . . . . . ¥1,142,032 ¥1,456,781 ¥1,838,742 $18,387Cumulative effect of changes in accounting principles, net of tax (Notes 2.j and 13) . . . . . . . . . . . . . . . . . . . . . . . . . (4,563)Net income . . . . . . . . . . . . . . . . . . . . . . . . . . . . . . . . . . . . . . . 353,286 415,518 462,788 4,628 Total . . . . . . . . . . . . . . . . . . . . . . . . . . . . . . . . . . . . . . . 1,495,318 1,867,736 2,301,530 23,015Deduct: Cash dividends paid (annual rate per share: 2006—¥25.0; 2007—¥40.0; 2008—¥54.0—$0.54) . . . . . . . . . . . . . . . . . . . . . . . . . . . 40,546 67,475 89,937 899 Transfer to retained earnings appropriated for legal reserve . . 517 945 2,646 27 Total . . . . . . . . . . . . . . . . . . . . . . . . . . . . . . . . . . . . . . . 41,063 68,420 92,583 926 The effect of change in fiscal year-end of certain subsidiaries, net of tax (Notes 2.y and 13) . . . . . . . . . . . . . . . . . . . . . . . 2,526 39,426Balance, end of year . . . . . . . . . . . . . . . . . . . . . . . . . . . . . . . . ¥1,456,781 ¥1,838,742 ¥2,208,947 $22,089
Accumulated other comprehensive income (loss) (net of tax):Balance, beginning of year . . . . . . . . . . . . . . . . . . . . . . . . . . . . ¥ 29,274 ¥ 447,903 ¥ 628,119 $ 6,281Other comprehensive income (loss) . . . . . . . . . . . . . . . . . . . . . 417,984 168,186 (315,043) (3,150)Adjustment to initially apply SFAS No. 158 (Notes 2.k and 13) . . 2,948The effect of change in fiscal year-end of certain subsidiaries (Notes 2.y and 13) . . . . . . . . . . . . . . . . . . . . . . . . . . . . . . . . 645 9,082Balance, end of year . . . . . . . . . . . . . . . . . . . . . . . . . . . . . . . . ¥ 447,903 ¥ 628,119 ¥ 313,076 $ 3,131
Treasury stock:Balance, beginning of year . . . . . . . . . . . . . . . . . . . . . . . . . . . . ¥ (930) ¥ (1,117) ¥ (1,386) $ (14)Purchases—net (Note 18) . . . . . . . . . . . . . . . . . . . . . . . . . . . . (187) (269) (150,118) (1,501)Balance, end of year . . . . . . . . . . . . . . . . . . . . . . . . . . . . . . . . ¥ (1,117) ¥ (1,386) ¥ (151,504) $ (1,515)
Total shareholders’ equity . . . . . . . . . . . . . . . . . . . . . . . . . . . . ¥2,390,687 ¥2,957,728 ¥2,873,210 $28,732
See notes to consolidated financial statements.
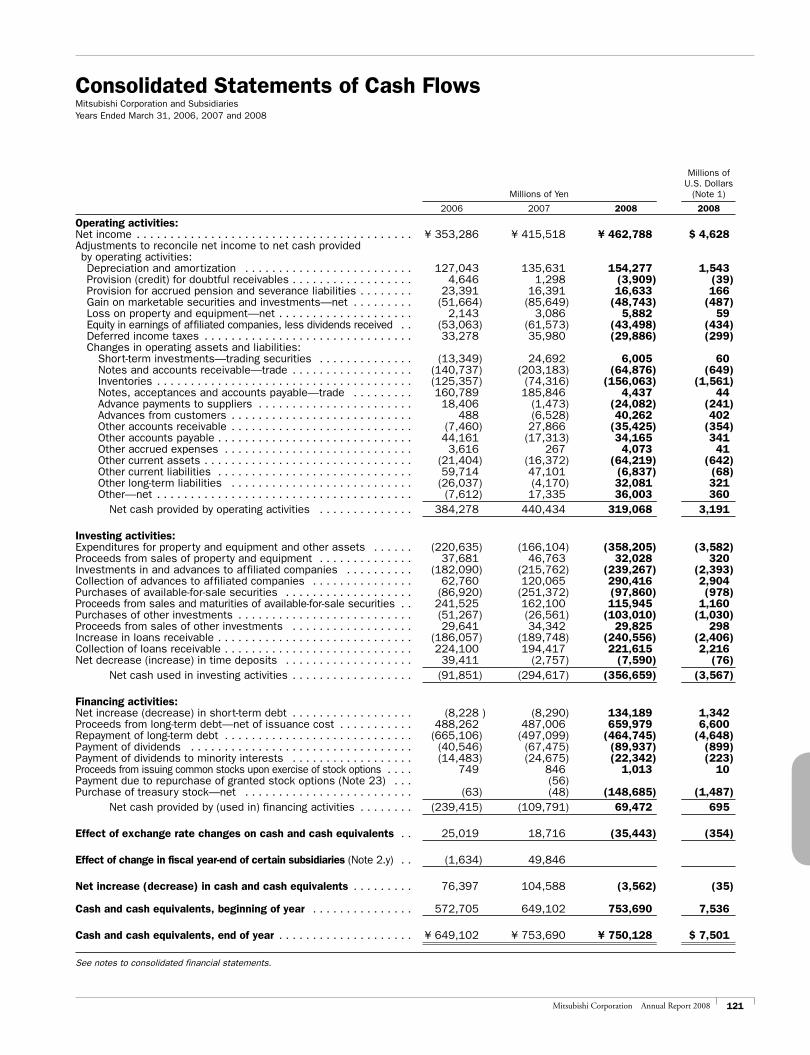
121Mitsubishi Corporation Annual Report 2008
Millions of U.S. Dollars Millions of Yen (Note 1)
2006 2007 2008 2008
Operating activities:Net income . . . . . . . . . . . . . . . . . . . . . . . . . . . . . . . . . . . . . . . . . ¥ 353,286 ¥ 415,518 ¥ 462,788 $ 4,628Adjustments to reconcile net income to net cash provided by operating activities: Depreciation and amortization . . . . . . . . . . . . . . . . . . . . . . . . . 127,043 135,631 154,277 1,543 Provision (credit) for doubtful receivables . . . . . . . . . . . . . . . . . . 4,646 1,298 (3,909) (39) Provision for accrued pension and severance liabilities . . . . . . . . 23,391 16,391 16,633 166 Gain on marketable securities and investments—net . . . . . . . . . (51,664) (85,649) (48,743) (487) Loss on property and equipment—net . . . . . . . . . . . . . . . . . . . . 2,143 3,086 5,882 59 Equity in earnings of affiliated companies, less dividends received . . (53,063) (61,573) (43,498) (434) Deferred income taxes . . . . . . . . . . . . . . . . . . . . . . . . . . . . . . . 33,278 35,980 (29,886) (299) Changes in operating assets and liabilities: Short-term investments—trading securities . . . . . . . . . . . . . . (13,349) 24,692 6,005 60 Notes and accounts receivable—trade . . . . . . . . . . . . . . . . . . (140,737) (203,183) (64,876) (649) Inventories . . . . . . . . . . . . . . . . . . . . . . . . . . . . . . . . . . . . . . (125,357) (74,316) (156,063) (1,561) Notes, acceptances and accounts payable—trade . . . . . . . . . 160,789 185,846 4,437 44 Advance payments to suppliers . . . . . . . . . . . . . . . . . . . . . . . 18,406 (1,473) (24,082) (241) Advances from customers . . . . . . . . . . . . . . . . . . . . . . . . . . . 488 (6,528) 40,262 402 Other accounts receivable . . . . . . . . . . . . . . . . . . . . . . . . . . . (7,460) 27,866 (35,425) (354) Other accounts payable . . . . . . . . . . . . . . . . . . . . . . . . . . . . . 44,161 (17,313) 34,165 341 Other accrued expenses . . . . . . . . . . . . . . . . . . . . . . . . . . . . 3,616 267 4,073 41 Other current assets . . . . . . . . . . . . . . . . . . . . . . . . . . . . . . . (21,404) (16,372) (64,219) (642) Other current liabilities . . . . . . . . . . . . . . . . . . . . . . . . . . . . . 59,714 47,101 (6,837) (68) Other long-term liabilities . . . . . . . . . . . . . . . . . . . . . . . . . . . (26,037) (4,170) 32,081 321 Other—net . . . . . . . . . . . . . . . . . . . . . . . . . . . . . . . . . . . . . . (7,612) 17,335 36,003 360 Net cash provided by operating activities . . . . . . . . . . . . . . 384,278 440,434 319,068 3,191
Investing activities:Expenditures for property and equipment and other assets . . . . . . (220,635) (166,104) (358,205) (3,582)Proceeds from sales of property and equipment . . . . . . . . . . . . . . 37,681 46,763 32,028 320Investments in and advances to affiliated companies . . . . . . . . . . (182,090) (215,762) (239,267) (2,393)Collection of advances to affiliated companies . . . . . . . . . . . . . . . 62,760 120,065 290,416 2,904Purchases of available-for-sale securities . . . . . . . . . . . . . . . . . . . (86,920) (251,372) (97,860) (978)Proceeds from sales and maturities of available-for-sale securities . . 241,525 162,100 115,945 1,160Purchases of other investments . . . . . . . . . . . . . . . . . . . . . . . . . . (51,267) (26,561) (103,010) (1,030)Proceeds from sales of other investments . . . . . . . . . . . . . . . . . . 29,641 34,342 29,825 298Increase in loans receivable . . . . . . . . . . . . . . . . . . . . . . . . . . . . . (186,057) (189,748) (240,556) (2,406)Collection of loans receivable . . . . . . . . . . . . . . . . . . . . . . . . . . . . 224,100 194,417 221,615 2,216Net decrease (increase) in time deposits . . . . . . . . . . . . . . . . . . . 39,411 (2,757) (7,590) (76) Net cash used in investing activities . . . . . . . . . . . . . . . . . . (91,851) (294,617) (356,659) (3,567)
Financing activities:Net increase (decrease) in short-term debt . . . . . . . . . . . . . . . . . . (8,228 ) (8,290) 134,189 1,342Proceeds from long-term debt—net of issuance cost . . . . . . . . . . . 488,262 487,006 659,979 6,600Repayment of long-term debt . . . . . . . . . . . . . . . . . . . . . . . . . . . . (665,106) (497,099) (464,745) (4,648)Payment of dividends . . . . . . . . . . . . . . . . . . . . . . . . . . . . . . . . . (40,546) (67,475) (89,937) (899)Payment of dividends to minority interests . . . . . . . . . . . . . . . . . . (14,483) (24,675) (22,342) (223)Proceeds from issuing common stocks upon exercise of stock options . . . . 749 846 1,013 10Payment due to repurchase of granted stock options (Note 23) . . . (56)Purchase of treasury stock—net . . . . . . . . . . . . . . . . . . . . . . . . . (63) (48) (148,685) (1,487) Net cash provided by (used in) financing activities . . . . . . . . (239,415) (109,791) 69,472 695
Effect of exchange rate changes on cash and cash equivalents . . 25,019 18,716 (35,443) (354)
Effect of change in fiscal year-end of certain subsidiaries (Note 2.y) . . (1,634) 49,846
Net increase (decrease) in cash and cash equivalents . . . . . . . . . 76,397 104,588 (3,562) (35)
Cash and cash equivalents, beginning of year . . . . . . . . . . . . . . . 572,705 649,102 753,690 7,536
Cash and cash equivalents, end of year . . . . . . . . . . . . . . . . . . . . ¥ 649,102 ¥ 753,690 ¥ 750,128 $ 7,501
See notes to consolidated financial statements.
Consolidated Statements of Cash FlowsMitsubishi Corporation and SubsidiariesYears Ended March 31, 2006, 2007 and 2008
122 Mitsubishi Corporation Annual Report 2008
Notes to Consolidated Financial StatementsMitsubishi Corporation and Subsidiaries
1. NATURE OF OPERATIONS AND BASIS OF FINANCIAL STATEMENTS
Nature of Operations—Mitsubishi Corporation (the “parent company”) and its consolidated domestic and foreign subsidiar-ies (together, the “companies”) are diverse organizations engaged in a wide variety of activities on a global scale. The companies engage in general trading, including the purchase, supply and distribution, and manufacturing of a wide range of products, including energy, metals, machinery, chemicals and living essentials through the companies’ domestic and overseas network. The companies are also involved in diverse business by actively investing in areas such as natural resources develop-ment and project development. The companies are also engaged in diversified businesses such as creating new business models in new energy and the environment, medical health care and new technology related businesses. Some of the companies’ basic functions enhance the above activities and enable the companies to provide various services to customers.
Basis of Financial Statements—The accompanying consoli-dated financial statements are stated in Japanese yen, the currency of the country in which the parent company is incorpo-rated and principally operates. The translation of Japanese yen amounts into United States dollar amounts with respect to the year ended March 31, 2008 is included solely for the conve- ended March 31, 2008 is included solely for the conve-ended March 31, 2008 is included solely for the conve-nience of readers outside Japan and has been made at the rate of ¥100=$1, the rate of exchange on March 31, 2008. Such translation should not be construed as a representation that the Japanese yen amounts could be converted into United States dollars at the above or any other rate.
The parent company and its subsidiaries in Japan maintain their records and prepare their financial statements in accordance with accounting principles generally accepted in Japan while its
foreign subsidiaries maintain their records and prepare their financial statements in conformity with accounting principles generally accepted in the countries of their respective domiciles. Certain adjustments and reclassifications have been incorporated in the accompanying consolidated financial statements in order to conform with accounting principles generally accepted in the United States of America (“U.S. GAAP”). These adjustments have not been recorded in the statutory books of account.
“Operating transactions,” as presented in the consolidated statements of income, is a voluntary disclosure commonly made by other Japanese trading companies and represents the gross transaction volume or the aggregate nominal value of the sales contracts in which the companies act as principal and transac-tions in which the companies serve as agent. Operating transac-tions exclude the contract value of transactions in which the companies’ role is limited to that of a broker. Operating transac-tions are not meant to represent sales or revenues in accor-dance with U.S. GAAP and should not be construed as equivalent to, or a substitute or proxy for, revenues. However, Emerging Issues Task Force (“EITF”), in its discussion of the conclusions reached in EITF Issue No. 99-19, “Reporting Rev-enue Gross as a Principal versus Net as an Agent,” stated: “Some Task Force members observed that the voluntary disclo-sure of operating transactions for those revenues reported net may be useful to users of financial statements.” Management believes operating transactions information is useful to users of the financial statements.
Certain reclassifications of prior years’ amounts have been made to conform to the presentation for 2008.
2. SUMMARY OF SIGNIFICANT ACCOUNTING POLICIES
Significant accounting policies applied in the preparation of the accompanying consolidated financial statements are summa-rized below:
a. Consolidation and Investments in Subsidiaries and Affiliated Companies—The consolidated financial statements include the accounts of the parent company and its majority-owned domestic and foreign subsidiaries. In addition, the companies consolidate variable interest entities (“VIEs”) where the companies are the primary beneficiary, which will absorb a majority of the VIE’s expected losses or residual returns if they occur, under the Financial Accounting Standards Board (“FASB”) Interpretation (“FIN”) No. 46, “Consolidation of Variable Interest Entities,” as revised in December 2003 (“FIN No. 46R”). See Note 24 for additional information of the companies’ involvement in VIEs. Unincorpo-rated joint ventures, where the companies hold an undivided interest in the assets and are proportionately liable for the liabil-ities, are proportionately consolidated by the companies. Affili-ated companies consist of companies owned 20% to 50%,
certain companies owned less than 20% over which the compa-nies exert significant influence, and corporate joint ventures. Investments in affiliated companies are accounted for by the equity method. All significant intercompany accounts and trans-actions have been eliminated.
The accounts of certain subsidiaries with a fiscal year end on or after December 31, but prior to the parent company’s fiscal year end of March 31, are consolidated on the basis of the subsidiaries’ respective fiscal year end. There were no signifi-cant events that occurred during the intervening period that would require adjustment to or disclosure in the accompanying consolidated financial statements.
A subsidiary or affiliated company may issue its shares to third parties at amounts per share in excess of or less than the companies’ average per share carrying value. With respect to such transactions, the resulting gains or losses arising from the change in ownership are recorded in income in the year in which such shares are issued.
123Mitsubishi Corporation Annual Report 2008
b. Foreign Currency Translation—Foreign currency financial statements have been translated in accordance with Statement of Financial Accounting Standards (“SFAS”) No. 52, “Foreign Currency Translation.” Pursuant to this statement, the assets and liabilities of foreign subsidiaries and affiliated companies are translated into Japanese yen at the respective year end exchange rates. All income and expense accounts are translated at average rates of exchange. The resulting translation adjustments, net of tax, are included in accumulated other comprehensive income (loss) (“AOCI”). Foreign currency receivables and payables are translated into Japanese yen at year end exchange rates and resulting exchange gains or losses are recognized in earnings, which are included in “Other expense (income) —net” in the consolidated statements of income.
c. Short-term Investments and Other Investments—All debt securities and marketable equity securities are classi-fied under the provisions of SFAS No. 115, “Accounting for Certain Investments in Debt and Equity Securities” as: trading securities, which are accounted for at fair value with unrealized gains and losses included in earnings, or available-for-sale secu-rities, which are accounted for at fair value with unrealized gains and losses excluded from earnings and reported, net of tax, in AOCI until realized. The appropriateness of the classification is reassessed at each balance sheet date in accordance with SFAS No. 115.
The cost of securities sold is determined based on the average cost of the shares of each such security held at the time of sale.
The companies review the fair value of available-for-sale investments on a regular basis to determine if the fair value of any individual investment has declined below its cost and if such decline is other-than-temporary. If the decline in value is judged to be other-than-temporary, the cost basis of the invest-ment is written down to fair value. Other-than-temporary declines in value are evaluated based on various factors such as the length of the time and the extent to which the market value has been less than cost, the financial condition and near-term pros-pects of the issuer, and the intent and ability to retain the investment for a period of time sufficient to allow for any antici-pated recovery in market value. The resulting realized loss is included in the consolidated statements of income in the period in which the decline was deemed to be other-than-temporary.
d. Allowance for Doubtful Receivables—An allowance for doubtful receivables is established in amounts considered to be appropriate based primarily upon the compa-nies’ past credit loss experience and an evaluation of potential losses in the receivables outstanding.
For loans receivables, an allowance for doubtful receivables is recognized when it is probable that the companies will be unable to collect all amounts due according to the contractual terms of the agreement. The impairment is measured based on the present value of expected future cash flows discounted at the loan’s effective interest rate (or, alternatively, at the observ-able market price of the receivable or the fair value of the under-lying collateral).
e. Inventories—Inventories, which mainly consist of commodities and materials, are stated at the lower of cost (principally on a moving-average basis or a specific-identification basis) or market (based on current replacement cost).
f. Property and Equipment—Property and equipment are stated at cost. Depreciation of property and equipment other than mineral rights is computed principally under the declining-balance method for assets held by the parent company and domestic subsidiaries and under the straight-line method for assets held by foreign subsidiaries, based on the estimated useful lives of the assets ranging princi-pally from 10 to 50 years for buildings, from 5 to 20 years for machinery and equipment and from 12 to 24 years for aircrafts and vessels. Mineral rights are amortized using the unit-of- production method based on the estimated proven or probable reserves. Leasehold improvements are amortized over the lesser of the useful life of the improvement or the term of the underlying lease. Significant renewals and additions are capital-ized at cost. Maintenance and repairs, and minor renewals and betterments are charged to income as incurred.
g. Impairment of Long-lived Assets—In accordance with SFAS No. 144, “Accounting for the Impair-ment or Disposal of Long-Lived Assets,” the companies review long-lived assets for impairment whenever events or changes in circumstances indicate that the carrying amount of an asset may not be recoverable. Recoverability of assets to be held and used is measured by a comparison of the carrying amount of an asset to the estimated undiscounted future net cash flows expected to be generated by the asset. If the carrying amount of an asset exceeds its estimated future cash flows, an impair-ment loss is recognized in the amount by which the carrying amount of the assets exceeds the fair value of the assets. A long-lived asset to be disposed of by sale is reported at the lower of the carrying amount or fair value less costs to sell, and is no longer depreciated. A long-lived asset to be disposed of other than by sale is considered as held and used until dis-posed of.
h. Goodwill and Other Intangible Assets—In accordance with SFAS No. 141, “Business Combinations,” all business combinations are accounted for by the purchase method. Under SFAS No. 142, “Goodwill and Other Intangible Assets,” goodwill (including equity method goodwill) and intan-gible assets with indefinite useful lives are not amortized, but are tested for impairment at least annually. Other intangible assets with finite useful lives are amortized over their respective estimated useful lives and reviewed for impairment in accor-dance with SFAS No. 144.
i. Oil and Gas Exploration and Development—Oil and gas exploration and development costs are accounted for by the successful efforts method of accounting. The costs of acquiring properties, drilling and equipping exploratory wells, and development wells and related plants and equipment are capital-ized and amortized using the unit-of-production method. Should the efforts to produce commercial reserves be determined unsuc-cessful, the exploratory well costs are charged to expense. Other exploration costs such as geological and geophysical costs are expensed as incurred. Proved properties are reviewed for impair-ment whenever events or changes in circumstances indicate that the carrying value may not be recoverable in accordance with SFAS No. 144. If the proved properties are determined to be impaired, an impairment loss is recognized based on the fair value. Unproved properties are assessed at least annually for impairment in accordance with the guidance in SFAS No. 19, “Financial Accounting and Reporting by Oil and Gas Producing Companies,” with any impairment charged to expense.
124 Mitsubishi Corporation Annual Report 2008
j. Mining Operations—Mining exploration costs are expensed as incurred until the mining project has been established as commercially viable by a final feasibility study. Once established as commercially viable, costs are capitalized as development costs and are amortized using the unit-of-production method based on the proven and probable reserves.
In accordance with EITF Issue No. 04-6, “Accounting for Strip-ping Costs Incurred During Production in the Mining Industry,” the stripping costs incurred during production phase of the mine is accounted for as variable production costs that should be included in the costs of the inventory produced during the period that the stripping costs are incurred. In accordance with EITF Issue No. 04-6, the cumulative effect of initially adopting this consensus was accounted for as an adjustment to the opening balance of unappropriated retained earnings in the year ended March 31, 2007. As a result, “Unappropriated retained earn-ings” decreased by ¥4,563 million.
k. Employees’ Benefit Plans—The companies have defined benefit pension plans, defined contri-bution pension plans and/or unfunded severance indemnity plans. The costs of defined benefit pension plans are accrued based on amounts determined using actuarial methods. The costs of sever-ance indemnity plans are principally accrued based on the vested benefit obligation, which is the amount required to be paid if all employees covered by the severance indemnity plans voluntarily terminated their employment at each balance sheet date.
Effective March 31, 2007, the companies adopted SFAS No. 158, “Employers’ Accounting for Defined Benefit Pension and Other Postretirement Plans—an amendment of FASB State-ments No. 87, 88, 106, and 132(R),” the companies recognized the funded status of the benefit plans, which is the difference between the fair value of plan assets and benefit obligations. By adopting SFAS No. 158, the companies recognized previously unrecognized gains (losses) and prior service costs (credits) as a component of AOCI, net of tax, on March 31, 2007. As a result, “Accumulated other comprehensive income (loss) (net of tax)” increased by ¥2,948 million.
l. Asset Retirement Obligation—In accordance with SFAS No. 143, “Accounting for Asset Retire-ment Obligations,” the companies record the fair value of a liabil-ity for an asset retirement obligation in the period in which it is incurred and a corresponding increase in the related long-lived asset. Over the time, the liability is accreted to its present value each period and the asset is depreciated over its useful life.
m. Costs Associated with Exit or Disposal Activities—Costs associated with an exit or disposal activity are accounted for in accordance with SFAS No. 146, “Accounting for Costs Associated with Exit or Disposal Activities.” Under the State-ment, a liability for a cost associated with an exit or disposal activity is recognized when the liability is incurred rather than the date of an entity’s commitment to an exit plan.
n. Stock-based Compensation— The companies recognize compensation cost in accordance with SFAS No. 123 (revised 2004), “Share-Based Payment” (“SFAS No. 123R”) in the financial statements over the period that an employee provides service in exchange for the award. The amount of compensation cost is measured based on the grant-date fair value of the equity instrument issued. Upon application of SFAS No. 123R, the companies used the modified- prospective application method. See Note 23.
o. Revenue Recognition—The companies recognize revenues when they are realized or realiz-able and earned. Revenues are realized or realizable and earned when the companies have persuasive evidence of an arrangement, the goods have been delivered or the services have been rendered to the customer, the sales price is fixed or determinable and col-lectibility is reasonably assured. In addition to this general policy, the following are specific revenue recognition policies.
Revenues from trading, manufacturing and other activities— The companies derive revenues from trading, manufacturing and other activities. Manufacturing and other activities are typically conducted through consolidated subsidiaries.
Trading Activities—The companies derive revenues from margins related to various trading transactions in which they act as a principal, carry commodity inventory, and make a profit or loss on the spread between bid and asked prices for commodities.
Manufacturing Activities—Manufacturing activities include the manufacture of a wide variety of products, such as elec-tronics, metals, machinery, chemicals and general consumer merchandise, and the development of natural resources.
Revenues from trading and manufacturing activities are recognized at the time the delivery conditions as agreed to by customers are met. These conditions are usually considered to have been met when the goods are received by the customer, title to the warehouse receipts are transferred, or the implementation testing is duly completed and any future obligations are per-functory and do not affect the customer’s final accep-tance of the arrangement.
For long-term construction businesses, depending on the nature of the contract, revenues from long-term construction projects are accounted for by the com-pleted contract method, unless costs to complete and extent of progress toward completion of long-term con-tracts are reasonably dependable, in which case the companies use the percentage-of-completion method.
Other Activities—Other activities consist of services, and rental or leasing activities. Service-related activities include performance of various services such as financial and logistics services, information and communications, technical support and other service-related activities.
The companies are also engaged in certain rental or leasing properties, including office buildings, aircrafts and other industrial assets.
Revenues from service-related activities are recorded as revenue when the contracted services are rendered to third-party customers pursuant to the agreement. Revenues from rental or leasing activities are recognized over the terms of the underlying leases on a straight-line basis.
Trading margins and commissions on trading transactions— The companies derive revenues from margins and commissions related to various trading transactions in which they act as a principal or an agent. Through the companies’ trading activities, they facilitate their customers’ purchases and sales of com-modities and other products and charge a commission for this service. The trading margins and commissions are recognized when the companies have met the general policy conditions as stated above.

125Mitsubishi Corporation Annual Report 2008
p. Advertising Costs—Advertising costs are expensed when incurred. Advertising costs for the years ended March 31, 2006, 2007 and 2008 were ¥6,440 million, ¥9,504 million and ¥17,070 million ($171 million), respectively.
q. Research and Development Costs—Research and development costs are charged to expense when incurred. Research and development costs for the years ended March 31, 2006, 2007 and 2008 were ¥2,274 million, ¥2,734 million and ¥3,213 million ($32 million), respectively.
r. Income Taxes—The provision for income taxes is computed based on “Income from continuing operations before income taxes” in the accompanying consolidated statements of income. The tax effects of temporary differences between the financial state-ments and income tax basis of assets and liabilities as well as operating loss carryforwards are recognized as deferred income taxes, using enacted tax rates applicable to the periods in which the differences are expected to affect taxable income. A valua-tion allowance is provided for any portion of the deferred tax assets where it is considered more-likely-than-not that they will not be realized.
Effective April 1, 2007, the companies adopted FIN No. 48, “Accounting for Uncertainty in Income Taxes—an interpretation of FASB Statement No. 109,” and recognized the financial state-ment effects of tax positions when they are more-likely-than-not, based on the technical merits, that the tax positions will be sustained upon examination by the tax authorities. Benefits from tax positions that meet the more-likely-than-not recognition threshold are measured at the largest amount of benefit that is greater than 50 percent likely of being realized upon settlement. Interest and penalties accrued related to unrecognized tax ben-efits are included in income taxes in the consolidated state-ments of income.
s. Derivatives—The companies utilize derivative instruments primarily to manage interest rate risks, reduce exposure to movements in foreign exchange rates, and to hedge various inventory and trading commitments. In accordance with SFAS No. 133, “Accounting for Derivative Instruments and Hedging Activities,” as amended by SFAS No. 138, No. 149 and No. 155 (collectively, “SFAS No.
133”), all derivative instruments are reported on the balance sheet at fair value. SFAS No. 133 establishes criteria for desig-nation and effectiveness of hedging relationships.
Generally, on the date on which the derivative contract is executed, the companies designate such derivative as either a fair value hedge or a cash flow hedge to the extent that hedging criteria are met. Changes in the fair values of derivatives that are designated as fair value hedges are recognized in earnings as offsets to the changes in fair value of related hedged assets, liabilities and firm commitments. Changes in the fair values of derivatives that are designated as cash flow hedges are deferred and recorded as a component of AOCI until the hedged transactions occur and are recognized in earnings. Changes in fair value of derivatives not designated as hedging instruments and those held or issued for trading purposes are recorded currently in earnings. See Note 10.
t. Use of Estimates in the Preparation of the Financial Statements—The preparation of consolidated financial statements in confor-mity with generally accepted accounting principles requires management to make estimates and assumptions that affect amounts reported therein. Due to the inherent uncertainty involved in making estimates, actual results could differ from those estimates. Significant estimates underlying the accompa-nying consolidated financial statements include the allowance for doubtful accounts, valuation of investments, valuation of long-lived assets, pension, asset retirement obligations and uncertain tax positions.
u. Earnings per Share (“EPS”)—Basic EPS is computed by dividing net income by the weighted average number of common shares outstanding during each year. Diluted EPS is computed by using the weighted average number of common shares outstanding adjusted to include the potentially dilutive effect of stock options and convertible bonds that were outstanding during the year. See Note 19.
v. Consolidated Statements of Cash Flows—For purposes of the consolidated statements of cash flows, cash equivalents are defined as highly liquid investments, including short-term time deposits, which are readily convertible into cash and have no significant risk of changes in value.
Additional cash flow information was as follows:
Millions of Millions of Yen U.S. Dollars
2006 2007 2008 2008
Cash paid during the year for: Interest (net of amounts capitalized) . . . . . . . . . . . . . . . . . . . . . ¥ 50,953 ¥ 73,536 ¥ 83,010 $ 830 Income taxes . . . . . . . . . . . . . . . . . . . . . . . . . . . . . . . . . . . . . . 133,095 195,661 283,242 2,832
Non-cash investing and financing activities: Exchange of shares in connection with business combinations and reorganizations involving investees: Fair market value of shares received . . . . . . . . . . . . . . . . . . . 719 4,060 896 9 Cost of shares surrendered . . . . . . . . . . . . . . . . . . . . . . . . . . 189 888 105 1 Acquisition of subsidiaries: Fair value of assets acquired (including goodwill) . . . . . . . . . . 138,080 143,541 243,647 2,436 Fair value of liabilities assumed . . . . . . . . . . . . . . . . . . . . . . . 106,657 102,069 165,866 1,659 Minority interests assumed . . . . . . . . . . . . . . . . . . . . . . . . . . 4,921 11,162 43,648 436
Cash paid-net . . . . . . . . . . . . . . . . . . . . . . . . . . . . . . . . . . . . 26,502 30,310 34,133 341
Acquisition of investment by business split-off: Transferred assets . . . . . . . . . . . . . . . . . . . . . . . . . . . . . . . . 77,296 Transferred liabilities . . . . . . . . . . . . . . . . . . . . . . . . . . . . . . 68,609 Acquired investment . . . . . . . . . . . . . . . . . . . . . . . . . . . . . . . 8,687 Issuance of common stock upon conversion of convertible bonds 141,476 1,974 4,180 42
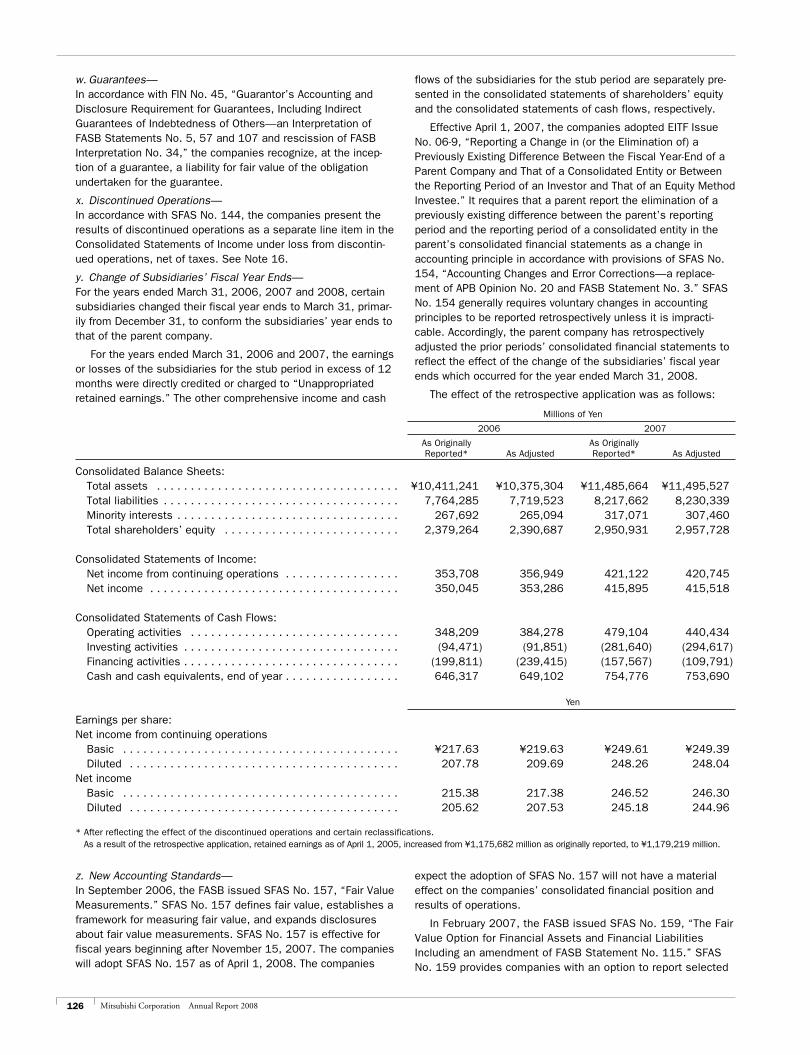
126 Mitsubishi Corporation Annual Report 2008
w. Guarantees—In accordance with FIN No. 45, “Guarantor’s Accounting and Disclosure Requirement for Guarantees, Including Indirect Guarantees of Indebtedness of Others—an Interpretation of FASB Statements No. 5, 57 and 107 and rescission of FASB Interpretation No. 34,” the companies recognize, at the incep-tion of a guarantee, a liability for fair value of the obligation undertaken for the guarantee.
x. Discontinued Operations—In accordance with SFAS No. 144, the companies present the results of discontinued operations as a separate line item in the Consolidated Statements of Income under loss from discontin-ued operations, net of taxes. See Note 16.
y. Change of Subsidiaries’ Fiscal Year Ends—For the years ended March 31, 2006, 2007 and 2008, certain subsidiaries changed their fiscal year ends to March 31, primar-ily from December 31, to conform the subsidiaries’ year ends to that of the parent company.
For the years ended March 31, 2006 and 2007, the earnings or losses of the subsidiaries for the stub period in excess of 12 months were directly credited or charged to “Unappropriated retained earnings.” The other comprehensive income and cash
flows of the subsidiaries for the stub period are separately pre-sented in the consolidated statements of shareholders’ equity and the consolidated statements of cash flows, respectively.
Effective April 1, 2007, the companies adopted EITF Issue No. 06-9, “Reporting a Change in (or the Elimination of) a Previously Existing Difference Between the Fiscal Year-End of a Parent Company and That of a Consolidated Entity or Between the Reporting Period of an Investor and That of an Equity Method Investee.” It requires that a parent report the elimination of a previously existing difference between the parent’s reporting period and the reporting period of a consolidated entity in the parent’s consolidated financial statements as a change in accounting principle in accordance with provisions of SFAS No. 154, “Accounting Changes and Error Corrections—a replace-ment of APB Opinion No. 20 and FASB Statement No. 3.” SFAS No. 154 generally requires voluntary changes in accounting principles to be reported retrospectively unless it is impracti-cable. Accordingly, the parent company has retrospectively adjusted the prior periods’ consolidated financial statements to reflect the effect of the change of the subsidiaries’ fiscal year ends which occurred for the year ended March 31, 2008.
The effect of the retrospective application was as follows:
Millions of Yen
2006 2007
As Originally As Originally Reported* As Adjusted Reported* As Adjusted
Consolidated Balance Sheets: Total assets . . . . . . . . . . . . . . . . . . . . . . . . . . . . . . . . . . . . ¥10,411,241 ¥10,375,304 ¥11,485,664 ¥11,495,527 Total liabilities . . . . . . . . . . . . . . . . . . . . . . . . . . . . . . . . . . . 7,764,285 7,719,523 8,217,662 8,230,339 Minority interests . . . . . . . . . . . . . . . . . . . . . . . . . . . . . . . . . 267,692 265,094 317,071 307,460 Total shareholders’ equity . . . . . . . . . . . . . . . . . . . . . . . . . . 2,379,264 2,390,687 2,950,931 2,957,728
Consolidated Statements of Income: Net income from continuing operations . . . . . . . . . . . . . . . . . 353,708 356,949 421,122 420,745 Net income . . . . . . . . . . . . . . . . . . . . . . . . . . . . . . . . . . . . . 350,045 353,286 415,895 415,518
Consolidated Statements of Cash Flows: Operating activities . . . . . . . . . . . . . . . . . . . . . . . . . . . . . . . 348,209 384,278 479,104 440,434 Investing activities . . . . . . . . . . . . . . . . . . . . . . . . . . . . . . . . (94,471) (91,851) (281,640) (294,617) Financing activities . . . . . . . . . . . . . . . . . . . . . . . . . . . . . . . . (199,811) (239,415) (157,567) (109,791) Cash and cash equivalents, end of year . . . . . . . . . . . . . . . . . 646,317 649,102 754,776 753,690
Yen
Earnings per share:Net income from continuing operations Basic . . . . . . . . . . . . . . . . . . . . . . . . . . . . . . . . . . . . . . . . . ¥217.63 ¥219.63 ¥249.61 ¥249.39 Diluted . . . . . . . . . . . . . . . . . . . . . . . . . . . . . . . . . . . . . . . . 207.78 209.69 248.26 248.04Net income Basic . . . . . . . . . . . . . . . . . . . . . . . . . . . . . . . . . . . . . . . . . 215.38 217.38 246.52 246.30 Diluted . . . . . . . . . . . . . . . . . . . . . . . . . . . . . . . . . . . . . . . . 205.62 207.53 245.18 244.96
* After reflecting the effect of the discontinued operations and certain reclassifications. As a result of the retrospective application, retained earnings as of April 1, 2005, increased from ¥1,175,682 million as originally reported, to ¥1,179,219 million.
z. New Accounting Standards— In September 2006, the FASB issued SFAS No. 157, “Fair Value Measurements.” SFAS No. 157 defines fair value, establishes a framework for measuring fair value, and expands disclosures about fair value measurements. SFAS No. 157 is effective for fiscal years beginning after November 15, 2007. The companies will adopt SFAS No. 157 as of April 1, 2008. The companies
expect the adoption of SFAS No. 157 will not have a material effect on the companies’ consolidated financial position and results of operations.
In February 2007, the FASB issued SFAS No. 159, “The Fair Value Option for Financial Assets and Financial Liabilities Including an amendment of FASB Statement No. 115.” SFAS No. 159 provides companies with an option to report selected
127Mitsubishi Corporation Annual Report 2008
financial assets and liabilities at fair value. Unrealized gains and losses on items for which the fair value option has been elected will be recognized in earnings. SFAS No. 159 is effec-tive for fiscal years beginning after November 15, 2007. The companies will adopt SFAS No. 159 as of April 1, 2008. The companies expect the adoption of SFAS No. 159 will not have a material effect on the companies’ consolidated financial position and results of operations.
In December 2007, the FASB issued SFAS No. 141 (revised 2007), “Business Combinations” (“SFAS No. 141R”). SFAS No. 141R establishes principles and requirements for how an acquirer recognizes and measures in its financial statements the identifi-able assets acquired, the liabilities assumed, any noncontrolling interest in the acquiree and the goodwill acquired. SFAS No. 141R also establishes disclosure requirements to enable the evaluation of the nature and financial effects of the business combination. SFAS No. 141R is effective for fiscal years beginning after December 15, 2008. The companies will adopt SFAS No. 141R as of April 1, 2009. The companies are currently reviewing
SFAS No. 141R to estimate its impact on the companies’ consoli-dated financial position and results of operations.
In December 2007, the FASB issued SFAS No. 160, “Noncon-trolling Interests in Consolidated Financial Statements—an amendment of ARB No. 51.” SFAS No. 160 establishes account-ing and reporting standards for ownership interests in subsidiar-ies held by parties other than the parent, the amount of consolidated net income attributable to the parent and to the noncontrolling interest, changes in a parent’s ownership interest, and the valuation of retained noncontrolling equity investments when a subsidiary is deconsolidated. SFAS No. 160 also estab-lishes disclosure requirements that clearly identify and distinguish between the interests of the parent and the interests of the non-controlling owners. SFAS No. 160 is effective for fiscal years beginning after December 15, 2008. The companies will adopt SFAS No. 160 as of April 1, 2009. The companies are currently reviewing SFAS No. 160 to estimate its impact on the companies’ consolidated financial position and results of operations.
3. ACQUISITIONS
Private Equity Portfolio Companies in North America—One of the U.S. subsidiaries, which is in the business of acquiring private equity portfolio companies, acquired the following two companies during the year ended March 31, 2007: (1) Avon Automotive Holdings, Inc., a company involved in the manufac-ture of rubber and polymer products primarily for the automotive industry, and (2) P&O Packaging, Ltd., a company involved in the manufacture and marketing of polyethylene film for sale to the packaging and film converting industries.
The aggregate fair value of the acquired net assets was ¥12,974 million and the aggregate purchase price was ¥16,873 million. The value assigned to the acquired intangible assets was ¥1,362 million which consisted primarily of customer rela-tionships of ¥1,199 million, and is being amortized on straight-line basis ranging between 13 and 15 years. Goodwill of ¥3,899 million was recognized at the date of acquisition. The goodwill has been assigned to the Other segment.
Nosan Corporation—In June 2007, the parent company acquired a 34.05% equity interest in Nosan Corporation, a com-pany mainly involved in manufacturing assorted feed for live-stock, through its tender offer. Prior to the acquisition, the companies owned a 22.17% interest of Nosan Corporation which was accounted for by the equity method. As a result of the tender offer, the companies’ controlling interest of Nosan Corpo-ration increased to 56.22% making it a consolidated subsidiary. The acquisition will enable the companies to further strengthen the integrated business structure from upstream to downstream by leveraging the advantages of Nosan Corporation’s expertise in animal feed technology development and production technol-ogy as well as production infrastructure, together with the com-panies’ expertise in procuring raw materials for animal feed, meat production and processing technology as well as expertise in selling meat.
For the year ended March 31, 2008, the acquisition was accounted for in accordance with SFAS No. 141, and accord-ingly, the acquisition cost of ¥15,793 million ($158 million) has been allocated to the assets acquired and the liabilities assumed based on their respective fair values at the date of
acquisition. Total amounts assigned to the acquired assets and the assumed liabilities at the date of acquisition were ¥74,406 million ($744 million) and ¥42,412 million ($424 million), respectively. The companies also recognized goodwill of ¥8,028 million ($80 million) at the date of acquisition. The goodwill has been assigned to the Living Essentials segment. The acquisition cost was determined based on the overall assessment, includ-ing evaluation report by the financial advisor, using the dis-counted cash flow method and others, and the results of due diligence on Nosan Corporation. The results of operations of Nosan Corporation have been included in the companies’ con-solidated statement of income since the acquisition date.
Kentucky Fried Chicken Japan—In December 2007, the parent company acquired a 33.15% equity interest in Kentucky Fried Chicken Japan, a company involved in distribution of fried chicken, processed chicken and pizza, through its tender offer. Prior to the acquisition, the companies owned a 31.11% inter-est of Kentucky Fried Chicken Japan which was accounted for by the equity method. As a result of the tender offer, the com-panies’ controlling interest of Kentucky Fried Chicken Japan increased to 64.26% making it a consolidated subsidiary. The acquisition will enable the companies to further expand profits and improve corporate value of Kentucky Fried Chicken Japan by enhancing human resource, supporting raw material pro-curement, logistics, product development, marketing and pur-suing synergies with the companies.
For the year ended March 31, 2008, the acquisition was accounted for in accordance with SFAS No. 141, and accord-ingly, the acquisition cost of ¥14,971 million ($150 million) has been allocated to the assets acquired and the liabilities assumed based on their respective fair values at the date of acquisition. Total amounts assigned to the acquired assets and the assumed liabilities at the date of acquisition were ¥48,386 million ($484 million) and ¥17,594 million ($176 million), respectively. In connection with the acquisition, the companies recognized intangible assets subject to amortization which are franchise agreements of ¥7,274 million ($73 million). The fran-chise agreements will continue to be amortized on a straight-line

128 Mitsubishi Corporation Annual Report 2008
basis over their estimated useful lives of 17 years. The compa-nies also recognized goodwill of ¥3,315 million ($33 million) at the date of acquisition. The goodwill has been assigned to the Living Essentials segment. The acquisition cost was determined based on the evaluation report on Kentucky Fried Chicken Japan by the financial advisor, using the market price analysis and others. The results of operations of Kentucky Fried Chicken Japan have been included in the companies’ consolidated state-ment of income since the acquisition date.
Automotive brake hose business—In January 2008, the parent company acquired the three companies, Flexitech Europe SAS (France), Flexitech RO S.R.L. (Romania) and Flexitech, Inc.
(USA), which are involved in the automotive brake hose busi-ness, through the newly established holding company in Japan. These acquisitions will enable the companies to play a leading role in the movement toward worldwide reorganization of the automotive brake hose business.
The aggregate fair value of the acquired net assets was ¥2,119 million ($21 million), excluding the minority interest of ¥711 million ($7 million), and the aggregate purchase price was ¥7,301 million ($73 million). Goodwill of ¥5,182 million ($52 million) was recognized at the date of acquisition. The goodwill has been assigned to the Industrial Finance, Logistics & Devel-opment segment.
4. SHORT-TERM INVESTMENTS AND OTHER INVESTMENTS
Debt and Marketable Equity Securities—Pursuant to SFAS No. 115, substantially all of the companies’ debt securities, princi-pally corporate bonds and commercial paper, and marketable equity securities, were classified as available-for-sale except for
certain items categorized as trading securities. Information regarding each category of securities classified as trading and available-for-sale at March 31, 2007 and 2008 was as follows:
Millions of Yen
Gross Gross Unrealized Unrealized Fair March 31, 2007 Cost Gains Losses Value
Securities classified as: Trading . . . . . . . . . . . . . . . . . . . . . . . . . . . . . . . . . . . . . . . . . . ¥ 86,772 Available-for-sale: Equity securities . . . . . . . . . . . . . . . . . . . . . . . . . . . . . . . . . . ¥538,924 ¥1,116,677 ¥(759) 1,654,842 Debt securities . . . . . . . . . . . . . . . . . . . . . . . . . . . . . . . . . . . 446,329 5,704 (300) 451,733
Millions of Yen
Gross Gross Unrealized Unrealized Fair March 31, 2008 Cost Gains Losses Value
Securities classified as: Trading . . . . . . . . . . . . . . . . . . . . . . . . . . . . . . . . . . . . . . . . . . ¥ 63,135 Available-for-sale: Equity securities . . . . . . . . . . . . . . . . . . . . . . . . . . . . . . . . . . ¥596,572 ¥837,234 ¥(24,187) 1,409,619 Debt securities . . . . . . . . . . . . . . . . . . . . . . . . . . . . . . . . . . . 316,453 765 (7,824) 309,394
Millions of U.S. Dollars
Gross Gross Unrealized Unrealized Fair March 31, 2008 Cost Gains Losses Value
Securities classified as: Trading . . . . . . . . . . . . . . . . . . . . . . . . . . . . . . . . . . . . . . . . . . $ 631 Available-for-sale: Equity securities . . . . . . . . . . . . . . . . . . . . . . . . . . . . . . . . . . $5,966 $8,372 $(242) 14,096 Debt securities . . . . . . . . . . . . . . . . . . . . . . . . . . . . . . . . . . . 3,165 7 (78) 3,094
The carrying amounts of available-for-sale securities included in cash and cash equivalents in the consolidated balance sheets were ¥212,566 million and ¥127,620 million ($1,276 million) for the years ended March 31, 2007 and 2008, respectively.
The carrying values of debt securities classified as available-for-sale at March 31, 2008, by contractual maturity, were as follows:
Millions of Millions of Yen U.S. Dollars
Due in one year or less . . . . . . . . . . . . . . . . . . . . . . . . . . . . . . . . . . . . . . . . . . . . . . . . . . . . . . . . . . ¥151,814 $1,518Due after one year through five years . . . . . . . . . . . . . . . . . . . . . . . . . . . . . . . . . . . . . . . . . . . . . . . . 91,042 910Due after five years through ten years . . . . . . . . . . . . . . . . . . . . . . . . . . . . . . . . . . . . . . . . . . . . . . . . 63,284 633Due after ten years . . . . . . . . . . . . . . . . . . . . . . . . . . . . . . . . . . . . . . . . . . . . . . . . . . . . . . . . . . . . . 3,254 33
Total . . . . . . . . . . . . . . . . . . . . . . . . . . . . . . . . . . . . . . . . . . . . . . . . . . . . . . . . . . . . . . . . . . ¥309,394 $3,094
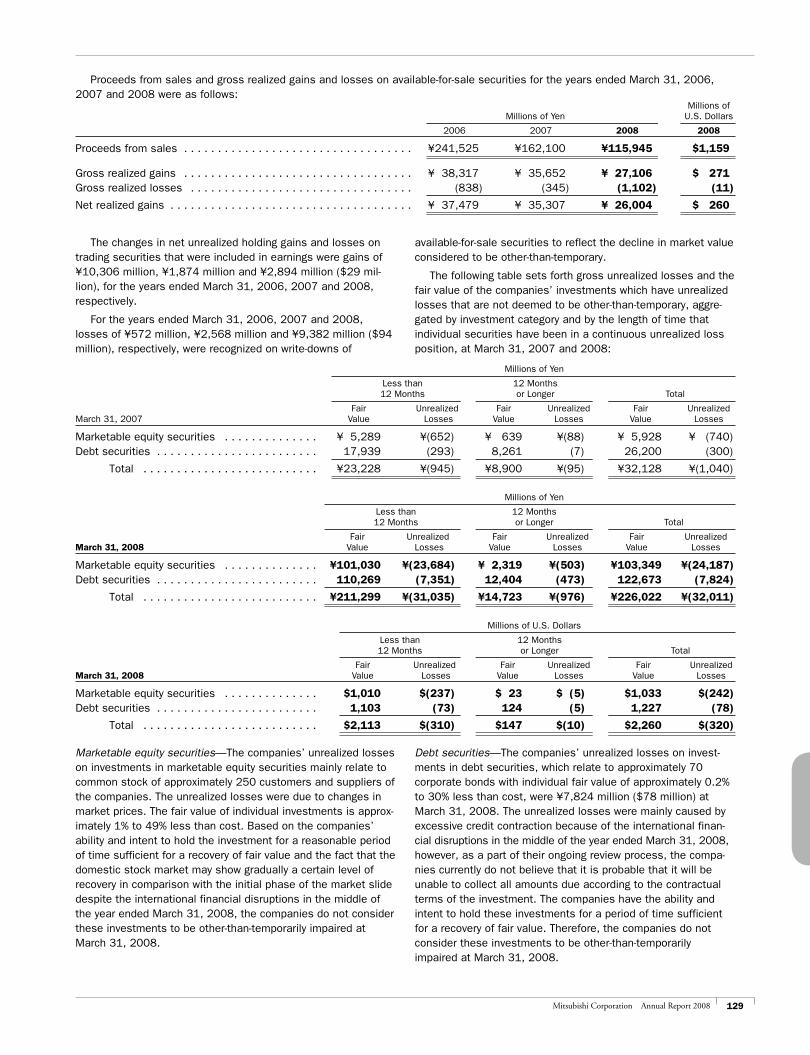
129Mitsubishi Corporation Annual Report 2008
Proceeds from sales and gross realized gains and losses on available-for-sale securities for the years ended March 31, 2006, 2007 and 2008 were as follows: Millions of Millions of Yen U.S. Dollars
2006 2007 2008 2008
Proceeds from sales . . . . . . . . . . . . . . . . . . . . . . . . . . . . . . . . . . ¥241,525 ¥162,100 ¥115,945 $1,159
Gross realized gains . . . . . . . . . . . . . . . . . . . . . . . . . . . . . . . . . . ¥ 38,317 ¥ 35,652 ¥ 27,106 $ 271Gross realized losses . . . . . . . . . . . . . . . . . . . . . . . . . . . . . . . . . (838) (345) (1,102) (11)
Net realized gains . . . . . . . . . . . . . . . . . . . . . . . . . . . . . . . . . . . . ¥ 37,479 ¥ 35,307 ¥ 26,004 $ 260
The changes in net unrealized holding gains and losses on trading securities that were included in earnings were gains of ¥10,306 million, ¥1,874 million and ¥2,894 million ($29 mil-lion), for the years ended March 31, 2006, 2007 and 2008, respectively.
For the years ended March 31, 2006, 2007 and 2008, losses of ¥572 million, ¥2,568 million and ¥9,382 million ($94 million), respectively, were recognized on write-downs of
available-for-sale securities to reflect the decline in market value considered to be other-than-temporary.
The following table sets forth gross unrealized losses and the fair value of the companies’ investments which have unrealized losses that are not deemed to be other-than-temporary, aggre-gated by investment category and by the length of time that individual securities have been in a continuous unrealized loss position, at March 31, 2007 and 2008:
Millions of Yen
Less than 12 Months 12 Months or Longer Total
Fair Unrealized Fair Unrealized Fair Unrealized March 31, 2007 Value Losses Value Losses Value Losses
Marketable equity securities . . . . . . . . . . . . . . ¥ 5,289 ¥(652) ¥ 639 ¥(88) ¥ 5,928 ¥ (740)Debt securities . . . . . . . . . . . . . . . . . . . . . . . . 17,939 (293) 8,261 (7) 26,200 (300)
Total . . . . . . . . . . . . . . . . . . . . . . . . . . ¥23,228 ¥(945) ¥8,900 ¥(95) ¥32,128 ¥(1,040)
Millions of Yen
Less than 12 Months 12 Months or Longer Total
Fair Unrealized Fair Unrealized Fair Unrealized March 31, 2008 Value Losses Value Losses Value Losses
Marketable equity securities . . . . . . . . . . . . . . ¥101,030 ¥(23,684) ¥ 2,319 ¥(503) ¥103,349 ¥(24,187)Debt securities . . . . . . . . . . . . . . . . . . . . . . . . 110,269 (7,351) 12,404 (473) 122,673 (7,824)
Total . . . . . . . . . . . . . . . . . . . . . . . . . . ¥211,299 ¥(31,035) ¥14,723 ¥(976) ¥226,022 ¥(32,011)
Millions of U.S. Dollars
Less than 12 Months 12 Months or Longer Total
Fair Unrealized Fair Unrealized Fair Unrealized March 31, 2008 Value Losses Value Losses Value Losses
Marketable equity securities . . . . . . . . . . . . . . $1,010 $(237) $ 23 $ (5) $1,033 $(242)Debt securities . . . . . . . . . . . . . . . . . . . . . . . . 1,103 (73) 124 (5) 1,227 (78)
Total . . . . . . . . . . . . . . . . . . . . . . . . . . $2,113 $(310) $147 $(10) $2,260 $(320)
Marketable equity securities—The companies’ unrealized losses on investments in marketable equity securities mainly relate to common stock of approximately 250 customers and suppliers of the companies. The unrealized losses were due to changes in market prices. The fair value of individual investments is approx-imately 1% to 49% less than cost. Based on the companies’ ability and intent to hold the investment for a reasonable period of time sufficient for a recovery of fair value and the fact that the domestic stock market may show gradually a certain level of recovery in comparison with the initial phase of the market slide despite the international financial disruptions in the middle of the year ended March 31, 2008, the companies do not consider these investments to be other-than-temporarily impaired at March 31, 2008.
Debt securities—The companies’ unrealized losses on invest-ments in debt securities, which relate to approximately 70 corporate bonds with individual fair value of approximately 0.2% to 30% less than cost, were ¥7,824 million ($78 million) at March 31, 2008. The unrealized losses were mainly caused by excessive credit contraction because of the international finan-cial disruptions in the middle of the year ended March 31, 2008, however, as a part of their ongoing review process, the compa-nies currently do not believe that it is probable that it will be unable to collect all amounts due according to the contractual terms of the investment. The companies have the ability and intent to hold these investments for a period of time sufficient for a recovery of fair value. Therefore, the companies do not consider these investments to be other-than-temporarily impaired at March 31, 2008.
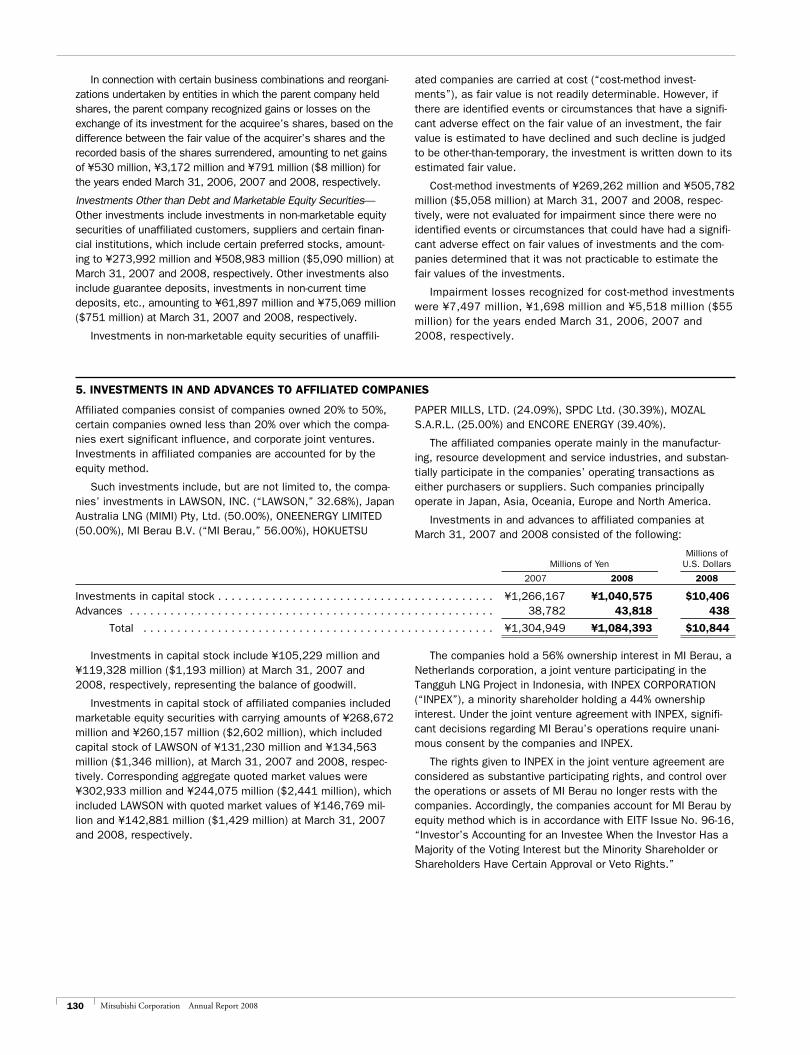
130 Mitsubishi Corporation Annual Report 2008
In connection with certain business combinations and reorgani-zations undertaken by entities in which the parent company held shares, the parent company recognized gains or losses on the exchange of its investment for the acquiree’s shares, based on the difference between the fair value of the acquirer’s shares and the recorded basis of the shares surrendered, amounting to net gains of ¥530 million, ¥3,172 million and ¥791 million ($8 million) for the years ended March 31, 2006, 2007 and 2008, respectively.
Investments Other than Debt and Marketable Equity Securities—Other investments include investments in non-marketable equity securities of unaffiliated customers, suppliers and certain finan-cial institutions, which include certain preferred stocks, amount-ing to ¥273,992 million and ¥508,983 million ($5,090 million) at March 31, 2007 and 2008, respectively. Other investments also include guarantee deposits, investments in non-current time deposits, etc., amounting to ¥61,897 million and ¥75,069 million ($751 million) at March 31, 2007 and 2008, respectively.
Investments in non-marketable equity securities of unaffili-
ated companies are carried at cost (“cost-method invest-ments”), as fair value is not readily determinable. However, if there are identified events or circumstances that have a signifi-cant adverse effect on the fair value of an investment, the fair value is estimated to have declined and such decline is judged to be other-than-temporary, the investment is written down to its estimated fair value.
Cost-method investments of ¥269,262 million and ¥505,782 million ($5,058 million) at March 31, 2007 and 2008, respec-tively, were not evaluated for impairment since there were no identified events or circumstances that could have had a signifi-cant adverse effect on fair values of investments and the com-panies determined that it was not practicable to estimate the fair values of the investments.
Impairment losses recognized for cost-method investments were ¥7,497 million, ¥1,698 million and ¥5,518 million ($55 million) for the years ended March 31, 2006, 2007 and 2008, respectively.
5. INVESTMENTS IN AND ADVANCES TO AFFILIATED COMPANIES
Affiliated companies consist of companies owned 20% to 50%, certain companies owned less than 20% over which the compa-nies exert significant influence, and corporate joint ventures. Investments in affiliated companies are accounted for by the equity method.
Such investments include, but are not limited to, the compa-nies’ investments in LAWSON, INC. (“LAWSON,” 32.68%), Japan Australia LNG (MIMI) Pty, Ltd. (50.00%), ONEENERGY LIMITED (50.00%), MI Berau B.V. (“MI Berau,” 56.00%), HOKUETSU
PAPER MILLS, LTD. (24.09%), SPDC Ltd. (30.39%), MOZAL S.A.R.L. (25.00%) and ENCORE ENERGY (39.40%).
The affiliated companies operate mainly in the manufactur-ing, resource development and service industries, and substan-tially participate in the companies’ operating transactions as either purchasers or suppliers. Such companies principally operate in Japan, Asia, Oceania, Europe and North America.
Investments in and advances to affiliated companies at March 31, 2007 and 2008 consisted of the following:
Millions of Millions of Yen U.S. Dollars
2007 2008 2008
Investments in capital stock . . . . . . . . . . . . . . . . . . . . . . . . . . . . . . . . . . . . . . . . . ¥1,266,167 ¥1,040,575 $10,406Advances . . . . . . . . . . . . . . . . . . . . . . . . . . . . . . . . . . . . . . . . . . . . . . . . . . . . . . 38,782 43,818 438
Total . . . . . . . . . . . . . . . . . . . . . . . . . . . . . . . . . . . . . . . . . . . . . . . . . . . . ¥1,304,949 ¥1,084,393 $10,844
Investments in capital stock include ¥105,229 million and ¥119,328 million ($1,193 million) at March 31, 2007 and 2008, respectively, representing the balance of goodwill.
Investments in capital stock of affiliated companies included marketable equity securities with carrying amounts of ¥268,672 million and ¥260,157 million ($2,602 million), which included capital stock of LAWSON of ¥131,230 million and ¥134,563 million ($1,346 million), at March 31, 2007 and 2008, respec-tively. Corresponding aggregate quoted market values were ¥302,933 million and ¥244,075 million ($2,441 million), which included LAWSON with quoted market values of ¥146,769 mil-lion and ¥142,881 million ($1,429 million) at March 31, 2007 and 2008, respectively.
The companies hold a 56% ownership interest in MI Berau, a Netherlands corporation, a joint venture participating in the Tangguh LNG Project in Indonesia, with INPEX CORPORATION (“INPEX”), a minority shareholder holding a 44% ownership interest. Under the joint venture agreement with INPEX, signifi-cant decisions regarding MI Berau’s operations require unani-mous consent by the companies and INPEX.
The rights given to INPEX in the joint venture agreement are considered as substantive participating rights, and control over the operations or assets of MI Berau no longer rests with the companies. Accordingly, the companies account for MI Berau by equity method which is in accordance with EITF Issue No. 96-16, “Investor’s Accounting for an Investee When the Investor Has a Majority of the Voting Interest but the Minority Shareholder or Shareholders Have Certain Approval or Veto Rights.”
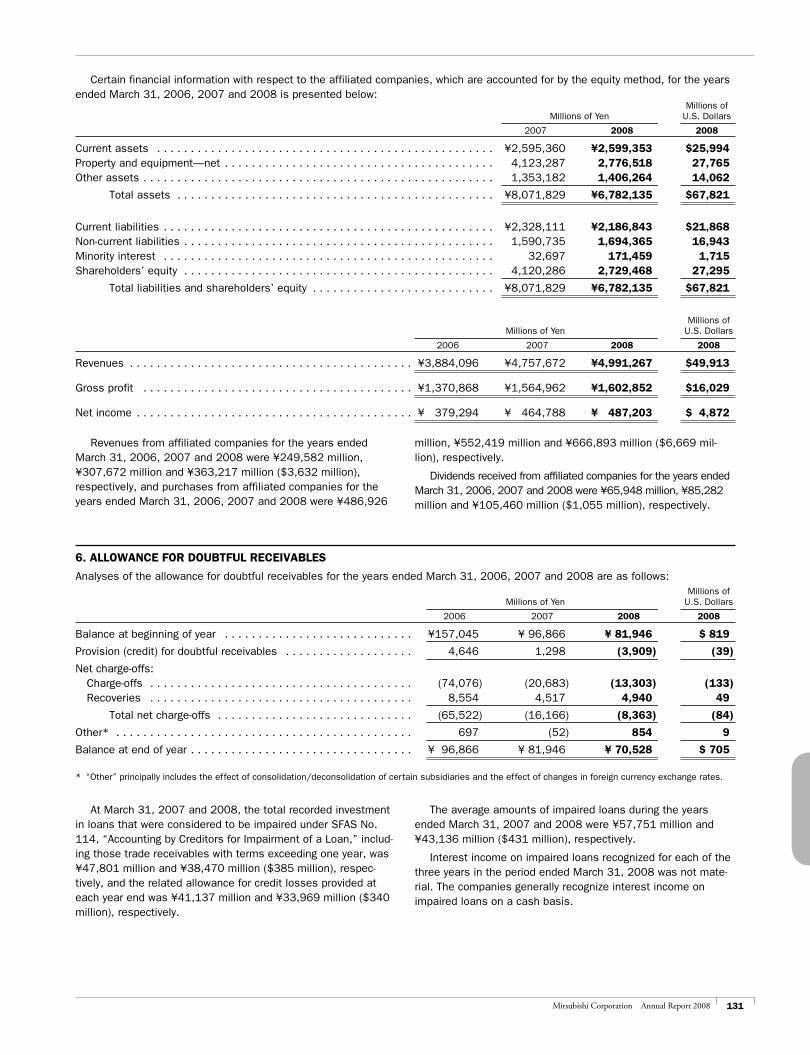
131Mitsubishi Corporation Annual Report 2008
Certain financial information with respect to the affiliated companies, which are accounted for by the equity method, for the years ended March 31, 2006, 2007 and 2008 is presented below: Millions of Millions of Yen U.S. Dollars
2007 2008 2008
Current assets . . . . . . . . . . . . . . . . . . . . . . . . . . . . . . . . . . . . . . . . . . . . . . . . . . ¥2,595,360 ¥2,599,353 $25,994Property and equipment—net . . . . . . . . . . . . . . . . . . . . . . . . . . . . . . . . . . . . . . . . 4,123,287 2,776,518 27,765Other assets . . . . . . . . . . . . . . . . . . . . . . . . . . . . . . . . . . . . . . . . . . . . . . . . . . . . 1,353,182 1,406,264 14,062
Total assets . . . . . . . . . . . . . . . . . . . . . . . . . . . . . . . . . . . . . . . . . . . . . . . ¥8,071,829 ¥6,782,135 $67,821
Current liabilities . . . . . . . . . . . . . . . . . . . . . . . . . . . . . . . . . . . . . . . . . . . . . . . . . ¥2,328,111 ¥2,186,843 $21,868Non-current liabilities . . . . . . . . . . . . . . . . . . . . . . . . . . . . . . . . . . . . . . . . . . . . . . 1,590,735 1,694,365 16,943Minority interest . . . . . . . . . . . . . . . . . . . . . . . . . . . . . . . . . . . . . . . . . . . . . . . . . 32,697 171,459 1,715Shareholders’ equity . . . . . . . . . . . . . . . . . . . . . . . . . . . . . . . . . . . . . . . . . . . . . . 4,120,286 2,729,468 27,295
Total liabilities and shareholders’ equity . . . . . . . . . . . . . . . . . . . . . . . . . . . ¥8,071,829 ¥6,782,135 $67,821
Millions of Millions of Yen U.S. Dollars
2006 2007 2008 2008
Revenues . . . . . . . . . . . . . . . . . . . . . . . . . . . . . . . . . . . . . . . . . . ¥3,884,096 ¥4,757,672 ¥4,991,267 $49,913
Gross profit . . . . . . . . . . . . . . . . . . . . . . . . . . . . . . . . . . . . . . . . ¥1,370,868 ¥1,564,962 ¥1,602,852 $16,029
Net income . . . . . . . . . . . . . . . . . . . . . . . . . . . . . . . . . . . . . . . . . ¥ 379,294 ¥ 464,788 ¥ 487,203 $ 4,872
Revenues from affiliated companies for the years ended March 31, 2006, 2007 and 2008 were ¥249,582 million, ¥307,672 million and ¥363,217 million ($3,632 million), respectively, and purchases from affiliated companies for the years ended March 31, 2006, 2007 and 2008 were ¥486,926
million, ¥552,419 million and ¥666,893 million ($6,669 mil-lion), respectively.
Dividends received from affiliated companies for the years ended March 31, 2006, 2007 and 2008 were ¥65,948 million, ¥85,282 million and ¥105,460 million ($1,055 million), respectively.
6. ALLOWANCE FOR DOUBTFUL RECEIVABLES
Analyses of the allowance for doubtful receivables for the years ended March 31, 2006, 2007 and 2008 are as follows: Millions of Millions of Yen U.S. Dollars
2006 2007 2008 2008
Balance at beginning of year . . . . . . . . . . . . . . . . . . . . . . . . . . . . ¥157,045 ¥ 96,866 ¥ 81,946 $ 819
Provision (credit) for doubtful receivables . . . . . . . . . . . . . . . . . . . 4,646 1,298 (3,909) (39)
Net charge-offs: Charge-offs . . . . . . . . . . . . . . . . . . . . . . . . . . . . . . . . . . . . . . . (74,076) (20,683) (13,303) (133) Recoveries . . . . . . . . . . . . . . . . . . . . . . . . . . . . . . . . . . . . . . . 8,554 4,517 4,940 49
Total net charge-offs . . . . . . . . . . . . . . . . . . . . . . . . . . . . . (65,522) (16,166) (8,363) (84)
Other* . . . . . . . . . . . . . . . . . . . . . . . . . . . . . . . . . . . . . . . . . . . . 697 (52) 854 9
Balance at end of year . . . . . . . . . . . . . . . . . . . . . . . . . . . . . . . . . ¥ 96,866 ¥ 81,946 ¥ 70,528 $ 705
* “Other” principally includes the effect of consolidation/deconsolidation of certain subsidiaries and the effect of changes in foreign currency exchange rates.
At March 31, 2007 and 2008, the total recorded investment in loans that were considered to be impaired under SFAS No. 114, “Accounting by Creditors for Impairment of a Loan,” includ-ing those trade receivables with terms exceeding one year, was ¥47,801 million and ¥38,470 million ($385 million), respec-tively, and the related allowance for credit losses provided at each year end was ¥41,137 million and ¥33,969 million ($340 million), respectively.
The average amounts of impaired loans during the years ended March 31, 2007 and 2008 were ¥57,751 million and ¥43,136 million ($431 million), respectively.
Interest income on impaired loans recognized for each of the three years in the period ended March 31, 2008 was not mate-rial. The companies generally recognize interest income on impaired loans on a cash basis.
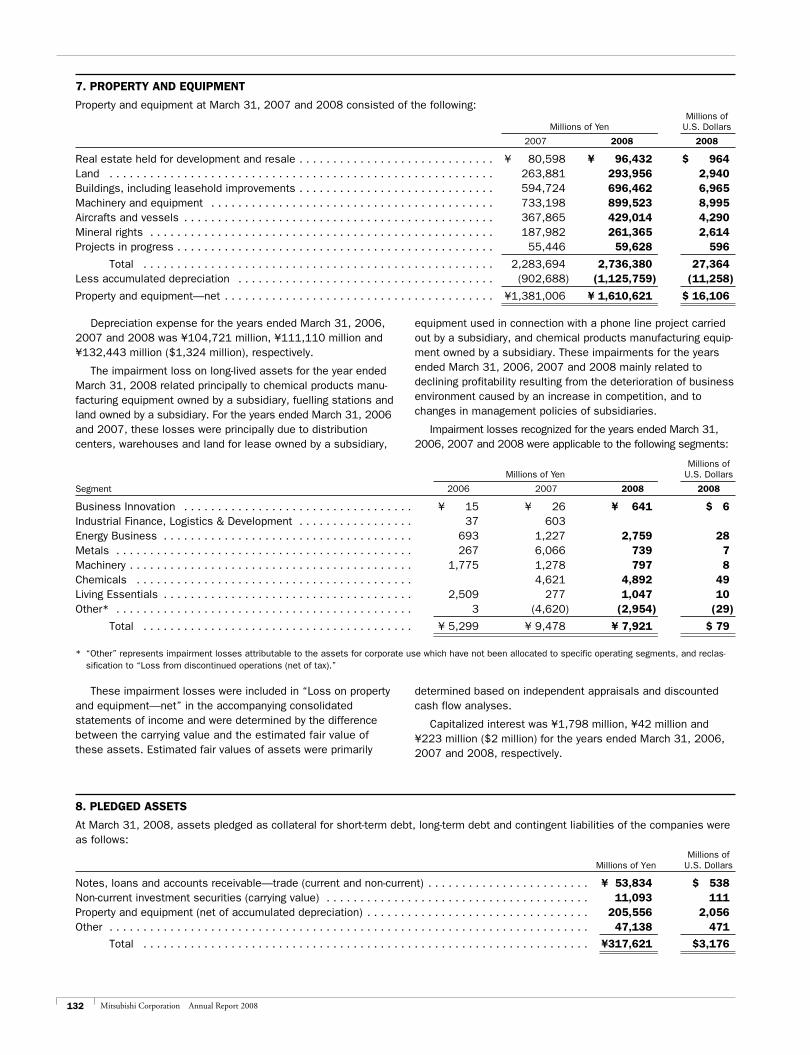
132 Mitsubishi Corporation Annual Report 2008
7. PROPERTY AND EQUIPMENT
Property and equipment at March 31, 2007 and 2008 consisted of the following: Millions of Millions of Yen U.S. Dollars
2007 2008 2008
Real estate held for development and resale . . . . . . . . . . . . . . . . . . . . . . . . . . . . . ¥ 80,598 ¥ 96,432 $ 964Land . . . . . . . . . . . . . . . . . . . . . . . . . . . . . . . . . . . . . . . . . . . . . . . . . . . . . . . . . 263,881 293,956 2,940Buildings, including leasehold improvements . . . . . . . . . . . . . . . . . . . . . . . . . . . . . 594,724 696,462 6,965Machinery and equipment . . . . . . . . . . . . . . . . . . . . . . . . . . . . . . . . . . . . . . . . . . 733,198 899,523 8,995Aircrafts and vessels . . . . . . . . . . . . . . . . . . . . . . . . . . . . . . . . . . . . . . . . . . . . . . 367,865 429,014 4,290Mineral rights . . . . . . . . . . . . . . . . . . . . . . . . . . . . . . . . . . . . . . . . . . . . . . . . . . . 187,982 261,365 2,614Projects in progress . . . . . . . . . . . . . . . . . . . . . . . . . . . . . . . . . . . . . . . . . . . . . . . 55,446 59,628 596
Total . . . . . . . . . . . . . . . . . . . . . . . . . . . . . . . . . . . . . . . . . . . . . . . . . . . . 2,283,694 2,736,380 27,364Less accumulated depreciation . . . . . . . . . . . . . . . . . . . . . . . . . . . . . . . . . . . . . . (902,688) (1,125,759) (11,258)
Property and equipment—net . . . . . . . . . . . . . . . . . . . . . . . . . . . . . . . . . . . . . . . . ¥1,381,006 ¥ 1,610,621 $ 16,106
Depreciation expense for the years ended March 31, 2006, 2007 and 2008 was ¥104,721 million, ¥111,110 million and ¥132,443 million ($1,324 million), respectively.
The impairment loss on long-lived assets for the year ended March 31, 2008 related principally to chemical products manu-facturing equipment owned by a subsidiary, fuelling stations and land owned by a subsidiary. For the years ended March 31, 2006 and 2007, these losses were principally due to distribution centers, warehouses and land for lease owned by a subsidiary,
equipment used in connection with a phone line project carried out by a subsidiary, and chemical products manufacturing equip-ment owned by a subsidiary. These impairments for the years ended March 31, 2006, 2007 and 2008 mainly related to declining profitability resulting from the deterioration of business environment caused by an increase in competition, and to changes in management policies of subsidiaries.
Impairment losses recognized for the years ended March 31, 2006, 2007 and 2008 were applicable to the following segments:
Millions of Millions of Yen U.S. Dollars
Segment 2006 2007 2008 2008
Business Innovation . . . . . . . . . . . . . . . . . . . . . . . . . . . . . . . . . . ¥ 15 ¥ 26 ¥ 641 $ 6Industrial Finance, Logistics & Development . . . . . . . . . . . . . . . . . 37 603Energy Business . . . . . . . . . . . . . . . . . . . . . . . . . . . . . . . . . . . . . 693 1,227 2,759 28Metals . . . . . . . . . . . . . . . . . . . . . . . . . . . . . . . . . . . . . . . . . . . . 267 6,066 739 7Machinery . . . . . . . . . . . . . . . . . . . . . . . . . . . . . . . . . . . . . . . . . . 1,775 1,278 797 8Chemicals . . . . . . . . . . . . . . . . . . . . . . . . . . . . . . . . . . . . . . . . . 4,621 4,892 49Living Essentials . . . . . . . . . . . . . . . . . . . . . . . . . . . . . . . . . . . . . 2,509 277 1,047 10Other* . . . . . . . . . . . . . . . . . . . . . . . . . . . . . . . . . . . . . . . . . . . . 3 (4,620) (2,954) (29)
Total . . . . . . . . . . . . . . . . . . . . . . . . . . . . . . . . . . . . . . . . ¥ 5,299 ¥ 9,478 ¥ 7,921 $ 79
* “Other” represents impairment losses attributable to the assets for corporate use which have not been allocated to specific operating segments, and reclas-sification to “Loss from discontinued operations (net of tax).”
These impairment losses were included in “Loss on property and equipment—net” in the accompanying consolidated statements of income and were determined by the difference between the carrying value and the estimated fair value of these assets. Estimated fair values of assets were primarily
determined based on independent appraisals and discounted cash flow analyses.
Capitalized interest was ¥1,798 million, ¥42 million and ¥223 million ($2 million) for the years ended March 31, 2006, 2007 and 2008, respectively.
8. PLEDGED ASSETS
At March 31, 2008, assets pledged as collateral for short-term debt, long-term debt and contingent liabilities of the companies were as follows: Millions of Millions of Yen U.S. Dollars
Notes, loans and accounts receivable—trade (current and non-current) . . . . . . . . . . . . . . . . . . . . . . . . ¥ 53,834 $ 538Non-current investment securities (carrying value) . . . . . . . . . . . . . . . . . . . . . . . . . . . . . . . . . . . . . . . 11,093 111Property and equipment (net of accumulated depreciation) . . . . . . . . . . . . . . . . . . . . . . . . . . . . . . . . . 205,556 2,056Other . . . . . . . . . . . . . . . . . . . . . . . . . . . . . . . . . . . . . . . . . . . . . . . . . . . . . . . . . . . . . . . . . . . . . . . 47,138 471
Total . . . . . . . . . . . . . . . . . . . . . . . . . . . . . . . . . . . . . . . . . . . . . . . . . . . . . . . . . . . . . . . . . . ¥317,621 $3,176
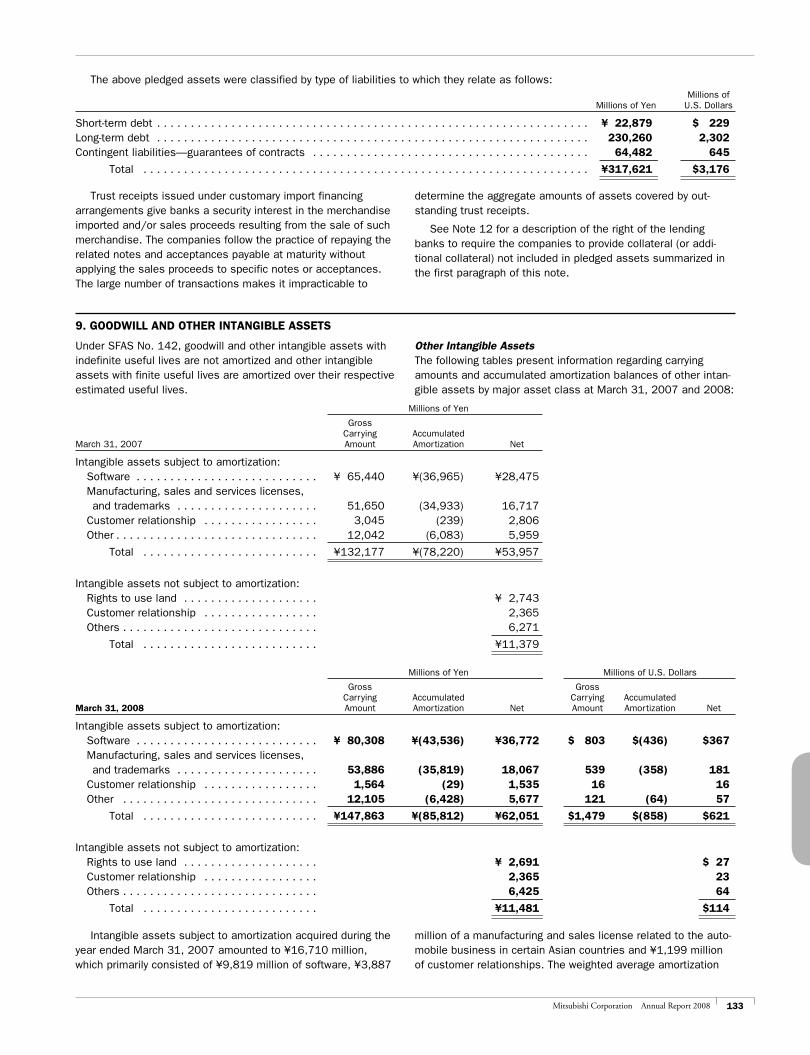
133Mitsubishi Corporation Annual Report 2008
The above pledged assets were classified by type of liabilities to which they relate as follows: Millions of Millions of Yen U.S. Dollars
Short-term debt . . . . . . . . . . . . . . . . . . . . . . . . . . . . . . . . . . . . . . . . . . . . . . . . . . . . . . . . . . . . . . . . ¥ 22,879 $ 229Long-term debt . . . . . . . . . . . . . . . . . . . . . . . . . . . . . . . . . . . . . . . . . . . . . . . . . . . . . . . . . . . . . . . . 230,260 2,302Contingent liabilities—guarantees of contracts . . . . . . . . . . . . . . . . . . . . . . . . . . . . . . . . . . . . . . . . . 64,482 645
Total . . . . . . . . . . . . . . . . . . . . . . . . . . . . . . . . . . . . . . . . . . . . . . . . . . . . . . . . . . . . . . . . . . ¥317,621 $3,176
Trust receipts issued under customary import financing arrangements give banks a security interest in the merchandise imported and/or sales proceeds resulting from the sale of such merchandise. The companies follow the practice of repaying the related notes and acceptances payable at maturity without applying the sales proceeds to specific notes or acceptances. The large number of transactions makes it impracticable to
determine the aggregate amounts of assets covered by out-standing trust receipts.
See Note 12 for a description of the right of the lending banks to require the companies to provide collateral (or addi-tional collateral) not included in pledged assets summarized in the first paragraph of this note.
9. GOODWILL AND OTHER INTANGIBLE ASSETS
Under SFAS No. 142, goodwill and other intangible assets with indefinite useful lives are not amortized and other intangible assets with finite useful lives are amortized over their respective estimated useful lives.
Other Intangible AssetsThe following tables present information regarding carrying amounts and accumulated amortization balances of other intan-gible assets by major asset class at March 31, 2007 and 2008:
Millions of Yen
Gross Carrying Accumulated March 31, 2007 Amount Amortization Net
Intangible assets subject to amortization: Software . . . . . . . . . . . . . . . . . . . . . . . . . . . ¥ 65,440 ¥(36,965) ¥28,475 Manufacturing, sales and services licenses, and trademarks . . . . . . . . . . . . . . . . . . . . . 51,650 (34,933) 16,717 Customer relationship . . . . . . . . . . . . . . . . . 3,045 (239) 2,806 Other . . . . . . . . . . . . . . . . . . . . . . . . . . . . . . 12,042 (6,083) 5,959
Total . . . . . . . . . . . . . . . . . . . . . . . . . . ¥132,177 ¥(78,220) ¥53,957
Intangible assets not subject to amortization: Rights to use land . . . . . . . . . . . . . . . . . . . . ¥ 2,743 Customer relationship . . . . . . . . . . . . . . . . . 2,365 Others . . . . . . . . . . . . . . . . . . . . . . . . . . . . . 6,271
Total . . . . . . . . . . . . . . . . . . . . . . . . . . ¥11,379
Millions of Yen Millions of U.S. Dollars
Gross Gross Carrying Accumulated Carrying Accumulated March 31, 2008 Amount Amortization Net Amount Amortization Net
Intangible assets subject to amortization: Software . . . . . . . . . . . . . . . . . . . . . . . . . . . ¥ 80,308 ¥(43,536) ¥36,772 $ 803 $(436) $367 Manufacturing, sales and services licenses, and trademarks . . . . . . . . . . . . . . . . . . . . . 53,886 (35,819) 18,067 539 (358) 181 Customer relationship . . . . . . . . . . . . . . . . . 1,564 (29) 1,535 16 16 Other . . . . . . . . . . . . . . . . . . . . . . . . . . . . . 12,105 (6,428) 5,677 121 (64) 57
Total . . . . . . . . . . . . . . . . . . . . . . . . . . ¥147,863 ¥(85,812) ¥62,051 $1,479 $(858) $621
Intangible assets not subject to amortization: Rights to use land . . . . . . . . . . . . . . . . . . . . ¥ 2,691 $ 27 Customer relationship . . . . . . . . . . . . . . . . . 2,365 23 Others . . . . . . . . . . . . . . . . . . . . . . . . . . . . . 6,425 64
Total . . . . . . . . . . . . . . . . . . . . . . . . . . ¥11,481 $114
Intangible assets subject to amortization acquired during the year ended March 31, 2007 amounted to ¥16,710 million, which primarily consisted of ¥9,819 million of software, ¥3,887
million of a manufacturing and sales license related to the auto-mobile business in certain Asian countries and ¥1,199 million of customer relationships. The weighted average amortization
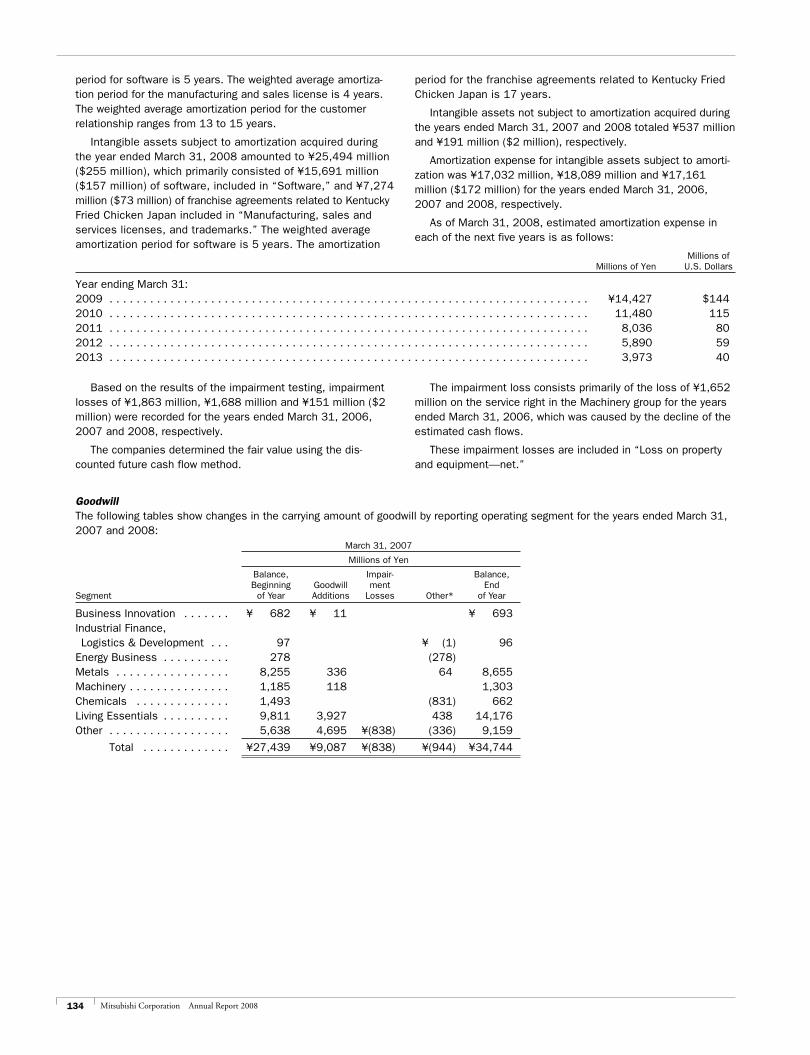
134 Mitsubishi Corporation Annual Report 2008
period for software is 5 years. The weighted average amortiza-tion period for the manufacturing and sales license is 4 years. The weighted average amortization period for the customer relationship ranges from 13 to 15 years.
Intangible assets subject to amortization acquired during the year ended March 31, 2008 amounted to ¥25,494 million ($255 million), which primarily consisted of ¥15,691 million ($157 million) of software, included in “Software,” and ¥7,274 million ($73 million) of franchise agreements related to Kentucky Fried Chicken Japan included in “Manufacturing, sales and services licenses, and trademarks.” The weighted average amortization period for software is 5 years. The amortization
period for the franchise agreements related to Kentucky Fried Chicken Japan is 17 years.
Intangible assets not subject to amortization acquired during the years ended March 31, 2007 and 2008 totaled ¥537 million and ¥191 million ($2 million), respectively.
Amortization expense for intangible assets subject to amorti-zation was ¥17,032 million, ¥18,089 million and ¥17,161 million ($172 million) for the years ended March 31, 2006, 2007 and 2008, respectively.
As of March 31, 2008, estimated amortization expense in each of the next five years is as follows:
Millions of Millions of Yen U.S. Dollars
Year ending March 31:2009 . . . . . . . . . . . . . . . . . . . . . . . . . . . . . . . . . . . . . . . . . . . . . . . . . . . . . . . . . . . . . . . . . . . . . . . ¥14,427 $1442010 . . . . . . . . . . . . . . . . . . . . . . . . . . . . . . . . . . . . . . . . . . . . . . . . . . . . . . . . . . . . . . . . . . . . . . . 11,480 1152011 . . . . . . . . . . . . . . . . . . . . . . . . . . . . . . . . . . . . . . . . . . . . . . . . . . . . . . . . . . . . . . . . . . . . . . . 8,036 802012 . . . . . . . . . . . . . . . . . . . . . . . . . . . . . . . . . . . . . . . . . . . . . . . . . . . . . . . . . . . . . . . . . . . . . . . 5,890 592013 . . . . . . . . . . . . . . . . . . . . . . . . . . . . . . . . . . . . . . . . . . . . . . . . . . . . . . . . . . . . . . . . . . . . . . . 3,973 40
Based on the results of the impairment testing, impairment losses of ¥1,863 million, ¥1,688 million and ¥151 million ($2 million) were recorded for the years ended March 31, 2006, 2007 and 2008, respectively.
The companies determined the fair value using the dis-counted future cash flow method.
The impairment loss consists primarily of the loss of ¥1,652 million on the service right in the Machinery group for the years ended March 31, 2006, which was caused by the decline of the estimated cash flows.
These impairment losses are included in “Loss on property and equipment—net.”
GoodwillThe following tables show changes in the carrying amount of goodwill by reporting operating segment for the years ended March 31, 2007 and 2008: March 31, 2007
Millions of Yen
Balance, Impair- Balance, Beginning Goodwill ment End Segment of Year Additions Losses Other* of Year
Business Innovation . . . . . . . ¥ 682 ¥ 11 ¥ 693Industrial Finance, Logistics & Development . . . 97 ¥ (1) 96Energy Business . . . . . . . . . . 278 (278)Metals . . . . . . . . . . . . . . . . . 8,255 336 64 8,655Machinery . . . . . . . . . . . . . . . 1,185 118 1,303Chemicals . . . . . . . . . . . . . . 1,493 (831) 662Living Essentials . . . . . . . . . . 9,811 3,927 438 14,176Other . . . . . . . . . . . . . . . . . . 5,638 4,695 ¥(838) (336) 9,159
Total . . . . . . . . . . . . . ¥27,439 ¥9,087 ¥(838) ¥(944) ¥34,744
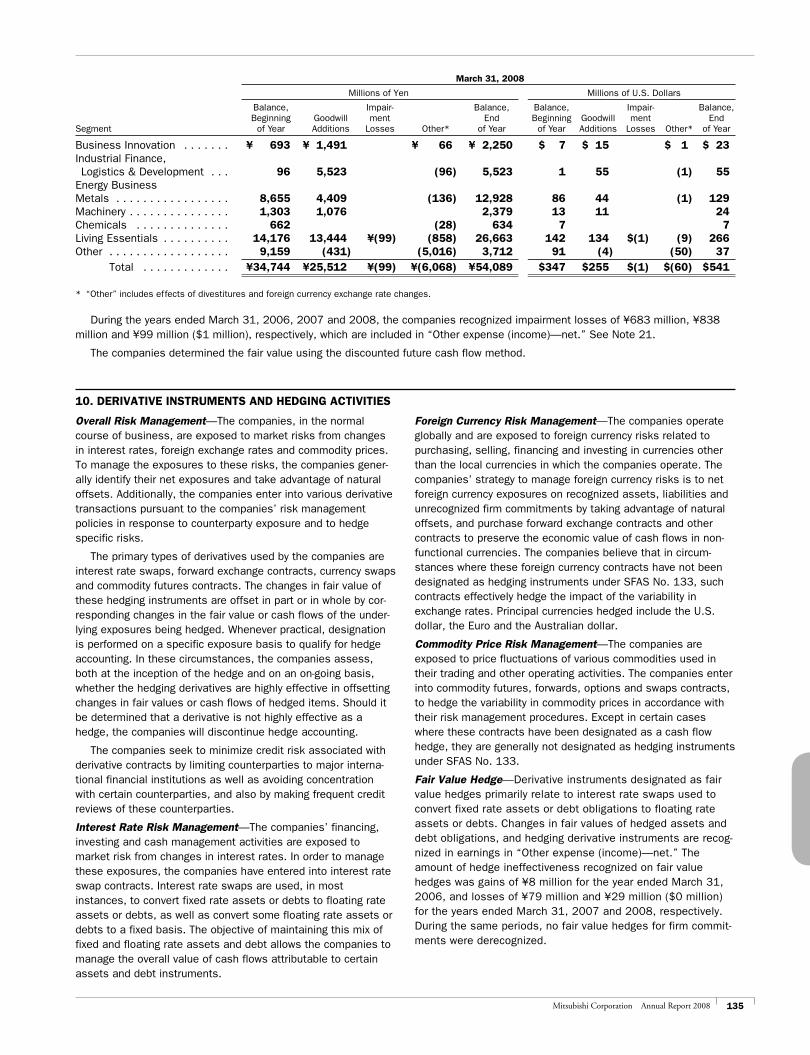
135Mitsubishi Corporation Annual Report 2008
March 31, 2008
Millions of Yen Millions of U.S. Dollars
Balance, Impair- Balance, Balance, Impair- Balance, Beginning Goodwill ment End Beginning Goodwill ment End Segment of Year Additions Losses Other* of Year of Year Additions Losses Other* of Year
Business Innovation . . . . . . . ¥ 693 ¥ 1,491 ¥ 66 ¥ 2,250 $ 7 $ 15 .51 $ 1 $ 23Industrial Finance, Logistics & Development . . . 96 5,523 (96) 5,523 1 55 .5162(1) 55Energy BusinessMetals . . . . . . . . . . . . . . . . . 8,655 4,409 (136) 12,928 86 44 .5162(1) 129Machinery . . . . . . . . . . . . . . . 1,303 1,076 2,379 13 11 .5162.5 24Chemicals . . . . . . . . . . . . . . 662 (28) 634 7 .5162.5 7Living Essentials . . . . . . . . . . 14,176 13,444 ¥(99) (858) 26,663 142 134 $(1) 162(9) 266Other . . . . . . . . . . . . . . . . . . 9,159 (431) (5,016) 3,712 91 (4) .516(50) 37 Total . . . . . . . . . . . . . ¥34,744 ¥25,512 ¥(99) ¥(6,068) ¥54,089 $347 $255 $(1) 1$(60) $541
* “Other” includes effects of divestitures and foreign currency exchange rate changes.
During the years ended March 31, 2006, 2007 and 2008, the companies recognized impairment losses of ¥683 million, ¥838 million and ¥99 million ($1 million), respectively, which are included in “Other expense (income)—net.” See Note 21.
The companies determined the fair value using the discounted future cash flow method.
10. DERIVATIVE INSTRUMENTS AND HEDGING ACTIVITIES
Overall Risk Management—The companies, in the normal course of business, are exposed to market risks from changes in interest rates, foreign exchange rates and commodity prices. To manage the exposures to these risks, the companies gener-ally identify their net exposures and take advantage of natural offsets. Additionally, the companies enter into various derivative transactions pursuant to the companies’ risk management policies in response to counterparty exposure and to hedge specific risks.
The primary types of derivatives used by the companies are interest rate swaps, forward exchange contracts, currency swaps and commodity futures contracts. The changes in fair value of these hedging instruments are offset in part or in whole by cor-responding changes in the fair value or cash flows of the under-lying exposures being hedged. Whenever practical, designation is performed on a specific exposure basis to qualify for hedge accounting. In these circumstances, the companies assess, both at the inception of the hedge and on an on-going basis, whether the hedging derivatives are highly effective in offsetting changes in fair values or cash flows of hedged items. Should it be determined that a derivative is not highly effective as a hedge, the companies will discontinue hedge accounting.
The companies seek to minimize credit risk associated with derivative contracts by limiting counterparties to major interna-tional financial institutions as well as avoiding concentration with certain counterparties, and also by making frequent credit reviews of these counterparties.
Interest Rate Risk Management—The companies’ financing, investing and cash management activities are exposed to market risk from changes in interest rates. In order to manage these exposures, the companies have entered into interest rate swap contracts. Interest rate swaps are used, in most instances, to convert fixed rate assets or debts to floating rate assets or debts, as well as convert some floating rate assets or debts to a fixed basis. The objective of maintaining this mix of fixed and floating rate assets and debt allows the companies to manage the overall value of cash flows attributable to certain assets and debt instruments.
Foreign Currency Risk Management—The companies operate globally and are exposed to foreign currency risks related to purchasing, selling, financing and investing in currencies other than the local currencies in which the companies operate. The companies’ strategy to manage foreign currency risks is to net foreign currency exposures on recognized assets, liabilities and unrecognized firm commitments by taking advantage of natural offsets, and purchase forward exchange contracts and other contracts to preserve the economic value of cash flows in non-functional currencies. The companies believe that in circum-stances where these foreign currency contracts have not been designated as hedging instruments under SFAS No. 133, such contracts effectively hedge the impact of the variability in exchange rates. Principal currencies hedged include the U.S. dollar, the Euro and the Australian dollar.
Commodity Price Risk Management—The companies are exposed to price fluctuations of various commodities used in their trading and other operating activities. The companies enter into commodity futures, forwards, options and swaps contracts, to hedge the variability in commodity prices in accordance with their risk management procedures. Except in certain cases where these contracts have been designated as a cash flow hedge, they are generally not designated as hedging instruments under SFAS No. 133.
Fair Value Hedge—Derivative instruments designated as fair value hedges primarily relate to interest rate swaps used to convert fixed rate assets or debt obligations to floating rate assets or debts. Changes in fair values of hedged assets and debt obligations, and hedging derivative instruments are recog-nized in earnings in “Other expense (income)—net.” The amount of hedge ineffectiveness recognized on fair value hedges was gains of ¥8 million for the year ended March 31, 2006, and losses of ¥79 million and ¥29 million ($0 million) for the years ended March 31, 2007 and 2008, respectively. During the same periods, no fair value hedges for firm commit-ments were derecognized.
136 Mitsubishi Corporation Annual Report 2008
Cash Flow Hedge—Derivative instruments designated as cash flow hedges include interest rate swaps to convert floating rate liabilities to fixed rate liabilities and foreign currency swap con-tracts to eliminate variability in functional-currency-equivalent cash flows on certain debt obligations. Additionally, commodity swaps and futures contracts are utilized and qualify as cash flow hedges. Current open contracts hedge forecasted transactions until 2020. Derivative gains and losses included in AOCI are reclassified into earnings at the time that the associated hedged transactions impact the income statement. Approximately ¥3,200 million ($32 million) of these net derivative gains, net of tax, included in AOCI at March 31, 2008 will be reclassified into earnings within 12 months from that date. During the year ended March 31, 2008, no cash flow hedges for forecasted commit-ments were derecognized.
Hedge of the Net Investment in Foreign Operations—The parent company enters into foreign exchange forward contracts to hedge the foreign currency exposures of its net investments
in foreign operations. Changes in fair values of hedging instru-ments have been included in foreign currency translation adjust-ments within “Other comprehensive income.” The net amount of gains or losses included in the foreign currency translation adjustments was losses of ¥14,881 million and ¥20,508 mil-lion for the years ended March 31, 2006 and 2007, respectively and gains of ¥9,718 million ($97 million) for the year ended March 31, 2008.
Derivative Instruments Used for Other than Hedging Activities—The parent company and certain subsidiaries enter into deriva-tive financial instruments as a part of their trading activities. The companies clearly distinguish derivatives used in trading activi-ties from derivatives used for risk management purposes. As part of their internal control policies, the companies have set strict limits on the positions which can be taken in order to minimize potential losses for these derivative transactions and periodically monitor the open positions for compliance.
11. FAIR VALUE OF FINANCIAL INSTRUMENTS
The companies, in the normal course of their business, are par-ties to various financial instruments. The companies engage in operating transactions with a significant number of customers in a wide variety of industries all over the world, and their receiv-ables from and guarantees to such parties are broadly diversified. Consequently, in management’s opinion, no significant concentra-tion of credit risk exists for the companies. Credit risk exposure of these financial instruments in the event of counterparty nonperfor-mance is controlled through credit approvals, limits and monitor-ing procedures based on the credit policies. The companies require collateral to the extent considered necessary.
The estimated fair value of financial instruments has been determined using available market information or valuation methodologies. However, considerable judgment is required in interpreting market data to develop estimates of fair value; therefore, the estimates are not necessarily indicative of the amounts that could be realized or would be paid in a current market exchange. The effect of using different market assump-tions and/or estimation methodologies may be material to the estimated fair value amounts.
The following methods and assumptions were used to estimate the fair value of each class of financial instruments:
Current Financial Assets and Current Financial Liabilities—The estimated fair values of cash and cash equivalents, time deposits, trade receivables and payables and short-term debt approximate their carrying amounts due to the relatively short maturities of these instruments.
Short-term Investments and Other Investments—The fair values of marketable securities included in “Short-term investments” and “Other investments” are based on quoted market prices. The fair value information for each category of securities is set forth in Note 4. “Other invest-ments” also include investments in non-marketable equity securities of unaffiliated customers, suppliers and certain financial institutions, which include certain preferred stocks, guarantee deposits and non-current time deposits. It is not practicable to estimate fair values of the invest-ments in non-marketable equity securities of unaffiliated companies, which consist of approximately one thousand small investments in customers and suppliers, as such estimation was not readily determinable.
Non-current Notes, Loans, Accounts Receivable and Advances to Affiliated Companies—The fair values of these items are estimated by discounting estimated future cash flows using a rate which is commensurate with the risks involved.
Long-term Debt—The fair values of the companies’ debt are estimated based on the present value of estimated future cash flows computed using interest rates that are currently available to the companies for debt with similar terms and remaining maturities.
Derivative Financial Instruments—The fair values of the derivative financial instruments are estimated by obtaining quotes from brokers and other appropriate valuation tech-niques based on information available to the companies.
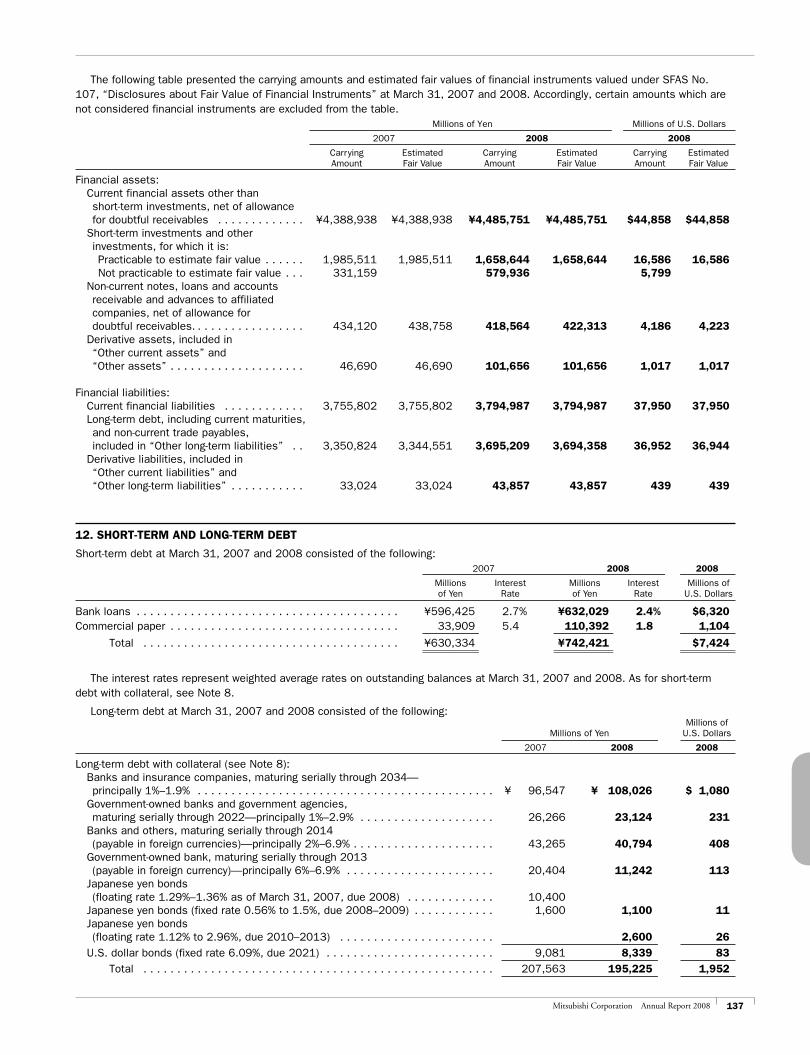
137Mitsubishi Corporation Annual Report 2008
The following table presented the carrying amounts and estimated fair values of financial instruments valued under SFAS No. 107, “Disclosures about Fair Value of Financial Instruments” at March 31, 2007 and 2008. Accordingly, certain amounts which are not considered financial instruments are excluded from the table. Millions of Yen Millions of U.S. Dollars
2007 2008 2008
Carrying Estimated Carrying Estimated Carrying Estimated Amount Fair Value Amount Fair Value Amount Fair Value
Financial assets: Current financial assets other than short-term investments, net of allowance for doubtful receivables . . . . . . . . . . . . . ¥4,388,938 ¥4,388,938 ¥4,485,751 ¥4,485,751 $44,858 $44,858 Short-term investments and other investments, for which it is: Practicable to estimate fair value . . . . . . 1,985,511 1,985,511 1,658,644 1,658,644 16,586 16,586 Not practicable to estimate fair value . . . 331,159 579,936 5,799 Non-current notes, loans and accounts receivable and advances to affiliated companies, net of allowance for doubtful receivables. . . . . . . . . . . . . . . . . 434,120 438,758 418,564 422,313 4,186 4,223 Derivative assets, included in “Other current assets” and “Other assets” . . . . . . . . . . . . . . . . . . . . 46,690 46,690 101,656 101,656 1,017 1,017
Financial liabilities: Current financial liabilities . . . . . . . . . . . . 3,755,802 3,755,802 3,794,987 3,794,987 37,950 37,950 Long-term debt, including current maturities, and non-current trade payables, included in “Other long-term liabilities” . . 3,350,824 3,344,551 3,695,209 3,694,358 36,952 36,944 Derivative liabilities, included in “Other current liabilities” and “Other long-term liabilities” . . . . . . . . . . . 33,024 33,024 43,857 43,857 439 439
12. SHORT-TERM AND LONG-TERM DEBT
Short-term debt at March 31, 2007 and 2008 consisted of the following: 2007 2008 2008
Millions Interest Millions Interest Millions of of Yen Rate of Yen Rate U.S. Dollars
Bank loans . . . . . . . . . . . . . . . . . . . . . . . . . . . . . . . . . . . . . . . ¥596,425 2.7% ¥632,029 2.4% $6,320Commercial paper . . . . . . . . . . . . . . . . . . . . . . . . . . . . . . . . . . 33,909 5.4 110,392 1.8 1,104
Total . . . . . . . . . . . . . . . . . . . . . . . . . . . . . . . . . . . . . . ¥630,334 ¥742,421 $7,424
The interest rates represent weighted average rates on outstanding balances at March 31, 2007 and 2008. As for short-term debt with collateral, see Note 8.
Long-term debt at March 31, 2007 and 2008 consisted of the following: Millions of Millions of Yen U.S. Dollars
2007 2008 2008
Long-term debt with collateral (see Note 8): Banks and insurance companies, maturing serially through 2034— principally 1%–1.9% . . . . . . . . . . . . . . . . . . . . . . . . . . . . . . . . . . . . . . . . . . . . ¥ 96,547 ¥ 108,026 $ 1,080 Government-owned banks and government agencies, maturing serially through 2022—principally 1%–2.9% . . . . . . . . . . . . . . . . . . . . 26,266 23,124 231 Banks and others, maturing serially through 2014 (payable in foreign currencies)—principally 2%–6.9% . . . . . . . . . . . . . . . . . . . . . 43,265 40,794 408 Government-owned bank, maturing serially through 2013 (payable in foreign currency)—principally 6%–6.9% . . . . . . . . . . . . . . . . . . . . . . 20,404 11,242 113 Japanese yen bonds (floating rate 1.29%–1.36% as of March 31, 2007, due 2008) . . . . . . . . . . . . . 10,400 Japanese yen bonds (fixed rate 0.56% to 1.5%, due 2008–2009) . . . . . . . . . . . . 1,600 1,100 11 Japanese yen bonds (floating rate 1.12% to 2.96%, due 2010–2013) . . . . . . . . . . . . . . . . . . . . . . . 2,600 26
U.S. dollar bonds (fixed rate 6.09%, due 2021) . . . . . . . . . . . . . . . . . . . . . . . . . 9,081 8,339 83
Total . . . . . . . . . . . . . . . . . . . . . . . . . . . . . . . . . . . . . . . . . . . . . . . . . . . . 207,563 195,225 1,952
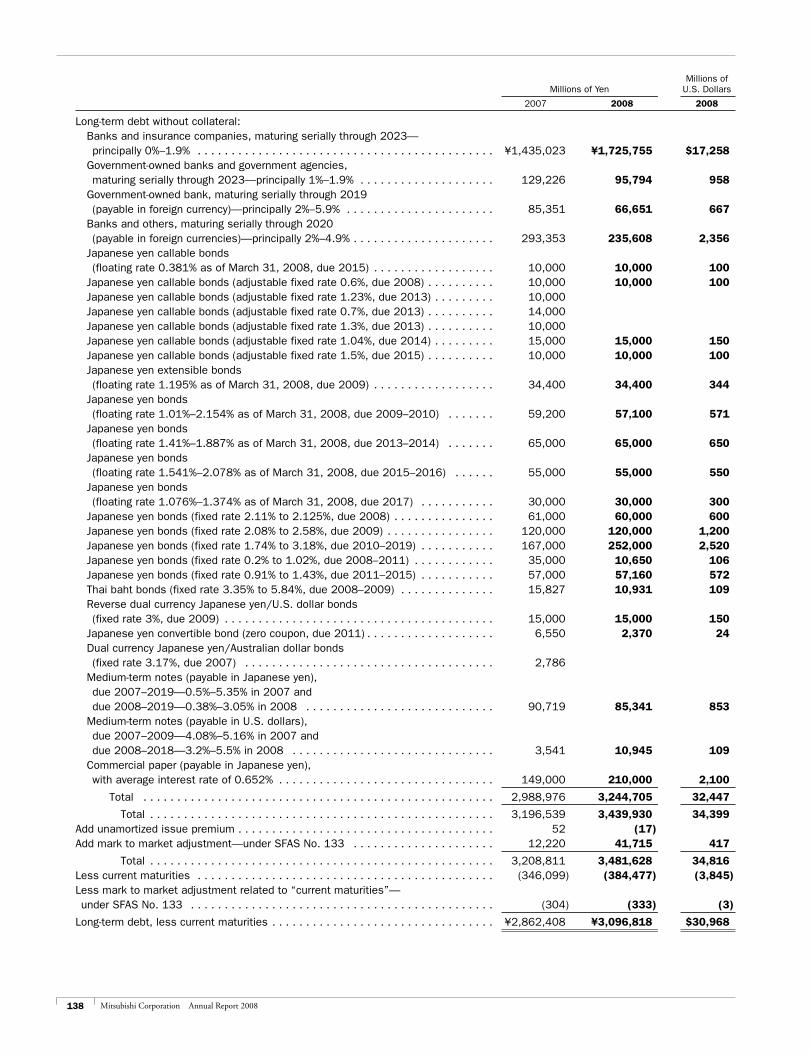
138 Mitsubishi Corporation Annual Report 2008
Millions of Millions of Yen U.S. Dollars
2007 2008 2008
Long-term debt without collateral: Banks and insurance companies, maturing serially through 2023— principally 0%–1.9% . . . . . . . . . . . . . . . . . . . . . . . . . . . . . . . . . . . . . . . . . . . . ¥1,435,023 ¥1,725,755 $17,258 Government-owned banks and government agencies, maturing serially through 2023—principally 1%–1.9% . . . . . . . . . . . . . . . . . . . . 129,226 95,794 958 Government-owned bank, maturing serially through 2019 (payable in foreign currency)—principally 2%–5.9% . . . . . . . . . . . . . . . . . . . . . . 85,351 66,651 667 Banks and others, maturing serially through 2020 (payable in foreign currencies)—principally 2%–4.9% . . . . . . . . . . . . . . . . . . . . . 293,353 235,608 2,356 Japanese yen callable bonds (floating rate 0.381% as of March 31, 2008, due 2015) . . . . . . . . . . . . . . . . . . 10,000 10,000 100 Japanese yen callable bonds (adjustable fixed rate 0.6%, due 2008) . . . . . . . . . . 10,000 10,000 100 Japanese yen callable bonds (adjustable fixed rate 1.23%, due 2013) . . . . . . . . . 10,000 Japanese yen callable bonds (adjustable fixed rate 0.7%, due 2013) . . . . . . . . . . 14,000 Japanese yen callable bonds (adjustable fixed rate 1.3%, due 2013) . . . . . . . . . . 10,000 Japanese yen callable bonds (adjustable fixed rate 1.04%, due 2014) . . . . . . . . . 15,000 15,000 150 Japanese yen callable bonds (adjustable fixed rate 1.5%, due 2015) . . . . . . . . . . 10,000 10,000 100 Japanese yen extensible bonds (floating rate 1.195% as of March 31, 2008, due 2009) . . . . . . . . . . . . . . . . . . 34,400 34,400 344 Japanese yen bonds (floating rate 1.01%–2.154% as of March 31, 2008, due 2009–2010) . . . . . . . 59,200 57,100 571 Japanese yen bonds (floating rate 1.41%–1.887% as of March 31, 2008, due 2013–2014) . . . . . . . 65,000 65,000 650 Japanese yen bonds (floating rate 1.541%–2.078% as of March 31, 2008, due 2015–2016) . . . . . . 55,000 55,000 550 Japanese yen bonds (floating rate 1.076%–1.374% as of March 31, 2008, due 2017) . . . . . . . . . . . 30,000 30,000 300 Japanese yen bonds (fixed rate 2.11% to 2.125%, due 2008) . . . . . . . . . . . . . . . 61,000 60,000 600 Japanese yen bonds (fixed rate 2.08% to 2.58%, due 2009) . . . . . . . . . . . . . . . . 120,000 120,000 1,200 Japanese yen bonds (fixed rate 1.74% to 3.18%, due 2010–2019) . . . . . . . . . . . 167,000 252,000 2,520 Japanese yen bonds (fixed rate 0.2% to 1.02%, due 2008–2011) . . . . . . . . . . . . 35,000 10,650 106 Japanese yen bonds (fixed rate 0.91% to 1.43%, due 2011–2015) . . . . . . . . . . . 57,000 57,160 572 Thai baht bonds (fixed rate 3.35% to 5.84%, due 2008–2009) . . . . . . . . . . . . . . 15,827 10,931 109 Reverse dual currency Japanese yen/U.S. dollar bonds (fixed rate 3%, due 2009) . . . . . . . . . . . . . . . . . . . . . . . . . . . . . . . . . . . . . . . . 15,000 15,000 150 Japanese yen convertible bond (zero coupon, due 2011) . . . . . . . . . . . . . . . . . . . 6,550 2,370 24 Dual currency Japanese yen/Australian dollar bonds (fixed rate 3.17%, due 2007) . . . . . . . . . . . . . . . . . . . . . . . . . . . . . . . . . . . . . 2,786 Medium-term notes (payable in Japanese yen), due 2007–2019—0.5%–5.35% in 2007 and due 2008–2019—0.38%–3.05% in 2008 . . . . . . . . . . . . . . . . . . . . . . . . . . . . 90,719 85,341 853 Medium-term notes (payable in U.S. dollars), due 2007–2009—4.08%–5.16% in 2007 and due 2008–2018—3.2%–5.5% in 2008 . . . . . . . . . . . . . . . . . . . . . . . . . . . . . . 3,541 10,945 109 Commercial paper (payable in Japanese yen), with average interest rate of 0.652% . . . . . . . . . . . . . . . . . . . . . . . . . . . . . . . . 149,000 210,000 2,100
Total . . . . . . . . . . . . . . . . . . . . . . . . . . . . . . . . . . . . . . . . . . . . . . . . . . . . 2,988,976 3,244,705 32,447
Total . . . . . . . . . . . . . . . . . . . . . . . . . . . . . . . . . . . . . . . . . . . . . . . . . . . 3,196,539 3,439,930 34,399Add unamortized issue premium . . . . . . . . . . . . . . . . . . . . . . . . . . . . . . . . . . . . . . 52 (17)Add mark to market adjustment—under SFAS No. 133 . . . . . . . . . . . . . . . . . . . . . 12,220 41,715 417
Total . . . . . . . . . . . . . . . . . . . . . . . . . . . . . . . . . . . . . . . . . . . . . . . . . . . 3,208,811 3,481,628 34,816Less current maturities . . . . . . . . . . . . . . . . . . . . . . . . . . . . . . . . . . . . . . . . . . . . (346,099) (384,477) (3,845)Less mark to market adjustment related to “current maturities”— under SFAS No. 133 . . . . . . . . . . . . . . . . . . . . . . . . . . . . . . . . . . . . . . . . . . . . . (304) (333) (3)
Long-term debt, less current maturities . . . . . . . . . . . . . . . . . . . . . . . . . . . . . . . . . ¥2,862,408 ¥3,096,818 $30,968
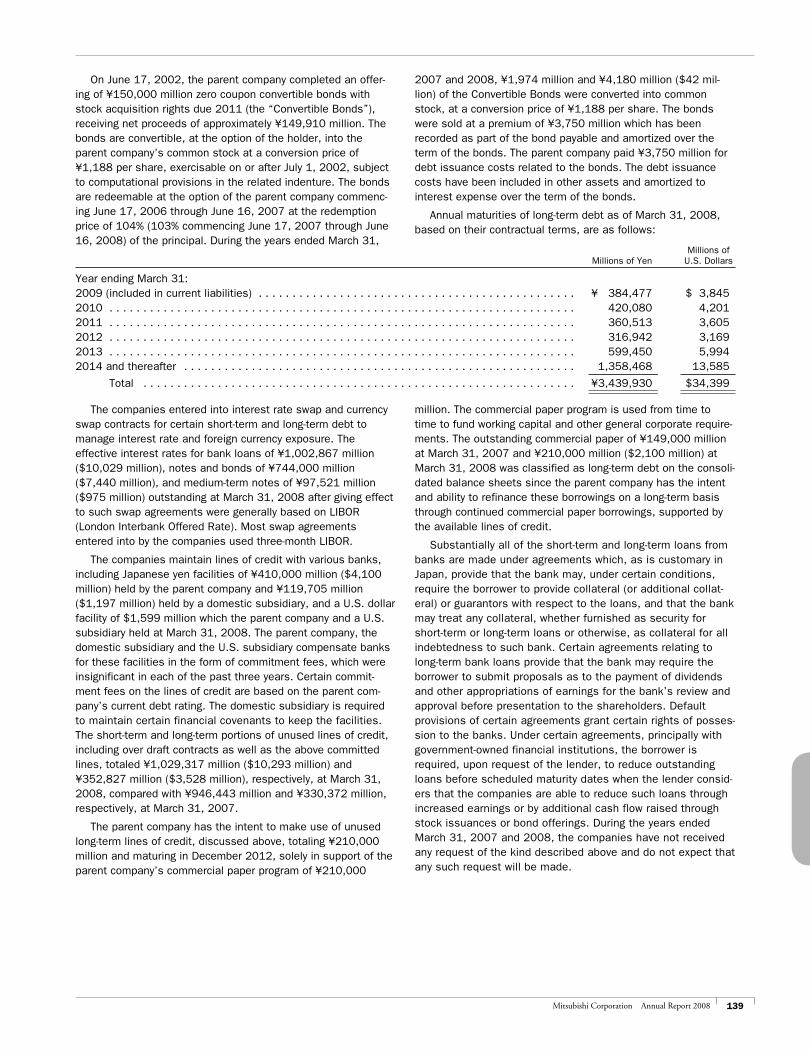
139Mitsubishi Corporation Annual Report 2008
On June 17, 2002, the parent company completed an offer-ing of ¥150,000 million zero coupon convertible bonds with stock acquisition rights due 2011 (the “Convertible Bonds”), receiving net proceeds of approximately ¥149,910 million. The bonds are convertible, at the option of the holder, into the parent company’s common stock at a conversion price of ¥1,188 per share, exercisable on or after July 1, 2002, subject to computational provisions in the related indenture. The bonds are redeemable at the option of the parent company commenc-ing June 17, 2006 through June 16, 2007 at the redemption price of 104% (103% commencing June 17, 2007 through June 16, 2008) of the principal. During the years ended March 31,
2007 and 2008, ¥1,974 million and ¥4,180 million ($42 mil-lion) of the Convertible Bonds were converted into common stock, at a conversion price of ¥1,188 per share. The bonds were sold at a premium of ¥3,750 million which has been recorded as part of the bond payable and amortized over the term of the bonds. The parent company paid ¥3,750 million for debt issuance costs related to the bonds. The debt issuance costs have been included in other assets and amortized to interest expense over the term of the bonds.
Annual maturities of long-term debt as of March 31, 2008, based on their contractual terms, are as follows:
Millions of Millions of Yen U.S. Dollars
Year ending March 31:2009 (included in current liabilities) . . . . . . . . . . . . . . . . . . . . . . . . . . . . . . . . . . . . . . . . . . . . . . . ¥ 384,477 $ 3,8452010 . . . . . . . . . . . . . . . . . . . . . . . . . . . . . . . . . . . . . . . . . . . . . . . . . . . . . . . . . . . . . . . . . . . . . 420,080 4,2012011 . . . . . . . . . . . . . . . . . . . . . . . . . . . . . . . . . . . . . . . . . . . . . . . . . . . . . . . . . . . . . . . . . . . . . 360,513 3,6052012 . . . . . . . . . . . . . . . . . . . . . . . . . . . . . . . . . . . . . . . . . . . . . . . . . . . . . . . . . . . . . . . . . . . . . 316,942 3,1692013 . . . . . . . . . . . . . . . . . . . . . . . . . . . . . . . . . . . . . . . . . . . . . . . . . . . . . . . . . . . . . . . . . . . . . 599,450 5,9942014 and thereafter . . . . . . . . . . . . . . . . . . . . . . . . . . . . . . . . . . . . . . . . . . . . . . . . . . . . . . . . . . 1,358,468 13,585
Total . . . . . . . . . . . . . . . . . . . . . . . . . . . . . . . . . . . . . . . . . . . . . . . . . . . . . . . . . . . . . . . . ¥3,439,930 $34,399
The companies entered into interest rate swap and currency swap contracts for certain short-term and long-term debt to manage interest rate and foreign currency exposure. The effective interest rates for bank loans of ¥1,002,867 million ($10,029 million), notes and bonds of ¥744,000 million ($7,440 million), and medium-term notes of ¥97,521 million ($975 million) outstanding at March 31, 2008 after giving effect to such swap agreements were generally based on LIBOR (London Interbank Offered Rate). Most swap agreements entered into by the companies used three-month LIBOR.
The companies maintain lines of credit with various banks, including Japanese yen facilities of ¥410,000 million ($4,100 million) held by the parent company and ¥119,705 million ($1,197 million) held by a domestic subsidiary, and a U.S. dollar facility of $1,599 million which the parent company and a U.S. subsidiary held at March 31, 2008. The parent company, the domestic subsidiary and the U.S. subsidiary compensate banks for these facilities in the form of commitment fees, which were insignificant in each of the past three years. Certain commit-ment fees on the lines of credit are based on the parent com-pany’s current debt rating. The domestic subsidiary is required to maintain certain financial covenants to keep the facilities. The short-term and long-term portions of unused lines of credit, including over draft contracts as well as the above committed lines, totaled ¥1,029,317 million ($10,293 million) and ¥352,827 million ($3,528 million), respectively, at March 31, 2008, compared with ¥946,443 million and ¥330,372 million, respectively, at March 31, 2007.
The parent company has the intent to make use of unused long-term lines of credit, discussed above, totaling ¥210,000 million and maturing in December 2012, solely in support of the parent company’s commercial paper program of ¥210,000
million. The commercial paper program is used from time to time to fund working capital and other general corporate require-ments. The outstanding commercial paper of ¥149,000 million at March 31, 2007 and ¥210,000 million ($2,100 million) at March 31, 2008 was classified as long-term debt on the consoli-dated balance sheets since the parent company has the intent and ability to refinance these borrowings on a long-term basis through continued commercial paper borrowings, supported by the available lines of credit.
Substantially all of the short-term and long-term loans from banks are made under agreements which, as is customary in Japan, provide that the bank may, under certain conditions, require the borrower to provide collateral (or additional collat-eral) or guarantors with respect to the loans, and that the bank may treat any collateral, whether furnished as security for short-term or long-term loans or otherwise, as collateral for all indebtedness to such bank. Certain agreements relating to long-term bank loans provide that the bank may require the borrower to submit proposals as to the payment of dividends and other appropriations of earnings for the bank’s review and approval before presentation to the shareholders. Default provisions of certain agreements grant certain rights of posses-sion to the banks. Under certain agreements, principally with government-owned financial institutions, the borrower is required, upon request of the lender, to reduce outstanding loans before scheduled maturity dates when the lender consid-ers that the companies are able to reduce such loans through increased earnings or by additional cash flow raised through stock issuances or bond offerings. During the years ended March 31, 2007 and 2008, the companies have not received any request of the kind described above and do not expect that any such request will be made.
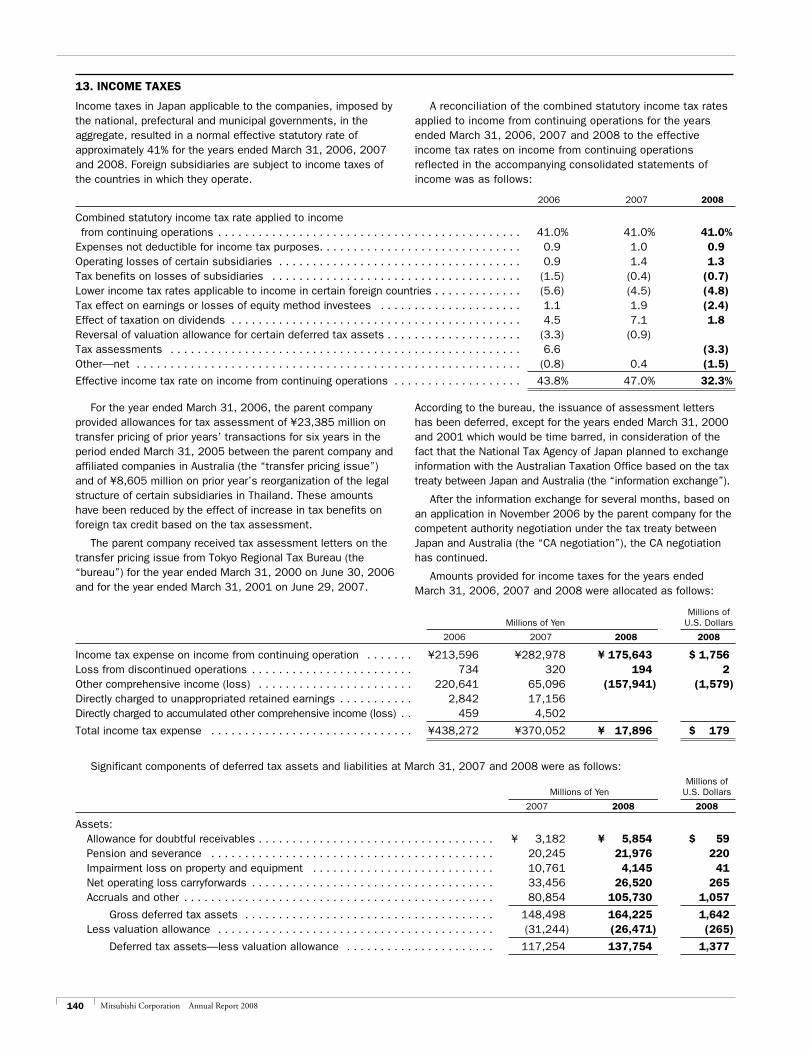
140 Mitsubishi Corporation Annual Report 2008
13. INCOME TAXES
Income taxes in Japan applicable to the companies, imposed by the national, prefectural and municipal governments, in the aggregate, resulted in a normal effective statutory rate of approximately 41% for the years ended March 31, 2006, 2007 and 2008. Foreign subsidiaries are subject to income taxes of the countries in which they operate.
A reconciliation of the combined statutory income tax rates applied to income from continuing operations for the years ended March 31, 2006, 2007 and 2008 to the effective income tax rates on income from continuing operations reflected in the accompanying consolidated statements of income was as follows:
2006 2007 2008
Combined statutory income tax rate applied to income from continuing operations . . . . . . . . . . . . . . . . . . . . . . . . . . . . . . . . . . . . . . . . . . . . . 41.0% 41.0% 41.0%Expenses not deductible for income tax purposes. . . . . . . . . . . . . . . . . . . . . . . . . . . . . . 0.9 1.0 0.9Operating losses of certain subsidiaries . . . . . . . . . . . . . . . . . . . . . . . . . . . . . . . . . . . . 0.9 1.4 1.3Tax benefits on losses of subsidiaries . . . . . . . . . . . . . . . . . . . . . . . . . . . . . . . . . . . . . (1.5) (0.4) (0.7)Lower income tax rates applicable to income in certain foreign countries . . . . . . . . . . . . . (5.6) (4.5) (4.8)Tax effect on earnings or losses of equity method investees . . . . . . . . . . . . . . . . . . . . . 1.1 1.9 (2.4)Effect of taxation on dividends . . . . . . . . . . . . . . . . . . . . . . . . . . . . . . . . . . . . . . . . . . . 4.5 7.1 1.8Reversal of valuation allowance for certain deferred tax assets . . . . . . . . . . . . . . . . . . . . (3.3) (0.9)Tax assessments . . . . . . . . . . . . . . . . . . . . . . . . . . . . . . . . . . . . . . . . . . . . . . . . . . . . 6.6 (3.3)Other—net . . . . . . . . . . . . . . . . . . . . . . . . . . . . . . . . . . . . . . . . . . . . . . . . . . . . . . . . . (0.8) 0.4 (1.5)
Effective income tax rate on income from continuing operations . . . . . . . . . . . . . . . . . . . 43.8% 47.0% 32.3%
For the year ended March 31, 2006, the parent company provided allowances for tax assessment of ¥23,385 million on transfer pricing of prior years’ transactions for six years in the period ended March 31, 2005 between the parent company and affiliated companies in Australia (the “transfer pricing issue”) and of ¥8,605 million on prior year’s reorganization of the legal structure of certain subsidiaries in Thailand. These amounts have been reduced by the effect of increase in tax benefits on foreign tax credit based on the tax assessment.
The parent company received tax assessment letters on the transfer pricing issue from Tokyo Regional Tax Bureau (the “bureau”) for the year ended March 31, 2000 on June 30, 2006 and for the year ended March 31, 2001 on June 29, 2007.
According to the bureau, the issuance of assessment letters has been deferred, except for the years ended March 31, 2000 and 2001 which would be time barred, in consideration of the fact that the National Tax Agency of Japan planned to exchange information with the Australian Taxation Office based on the tax treaty between Japan and Australia (the “information exchange”).
After the information exchange for several months, based on an application in November 2006 by the parent company for the competent authority negotiation under the tax treaty between Japan and Australia (the “CA negotiation”), the CA negotiation has continued.
Amounts provided for income taxes for the years ended March 31, 2006, 2007 and 2008 were allocated as follows:
Millions of Millions of Yen U.S. Dollars
2006 2007 2008 2008
Income tax expense on income from continuing operation . . . . . . . ¥213,596 ¥282,978 ¥ 175,643 $ 1,756Loss from discontinued operations . . . . . . . . . . . . . . . . . . . . . . . . 734 320 194 2Other comprehensive income (loss) . . . . . . . . . . . . . . . . . . . . . . . 220,641 65,096 (157,941) (1,579)Directly charged to unappropriated retained earnings . . . . . . . . . . . 2,842 17,156Directly charged to accumulated other comprehensive income (loss) . . 459 4,502
Total income tax expense . . . . . . . . . . . . . . . . . . . . . . . . . . . . . . ¥438,272 ¥370,052 ¥ 17,896 $ 179
Significant components of deferred tax assets and liabilities at March 31, 2007 and 2008 were as follows: Millions of Millions of Yen U.S. Dollars
2007 2008 2008
Assets: Allowance for doubtful receivables . . . . . . . . . . . . . . . . . . . . . . . . . . . . . . . . . . . ¥ 3,182 ¥ 5,854 $ 59 Pension and severance . . . . . . . . . . . . . . . . . . . . . . . . . . . . . . . . . . . . . . . . . . 20,245 21,976 220 Impairment loss on property and equipment . . . . . . . . . . . . . . . . . . . . . . . . . . . 10,761 4,145 41 Net operating loss carryforwards . . . . . . . . . . . . . . . . . . . . . . . . . . . . . . . . . . . . 33,456 26,520 265 Accruals and other . . . . . . . . . . . . . . . . . . . . . . . . . . . . . . . . . . . . . . . . . . . . . . 80,854 105,730 1,057
Gross deferred tax assets . . . . . . . . . . . . . . . . . . . . . . . . . . . . . . . . . . . . . 148,498 164,225 1,642 Less valuation allowance . . . . . . . . . . . . . . . . . . . . . . . . . . . . . . . . . . . . . . . . . (31,244) (26,471) (265)
Deferred tax assets—less valuation allowance . . . . . . . . . . . . . . . . . . . . . . 117,254 137,754 1,377
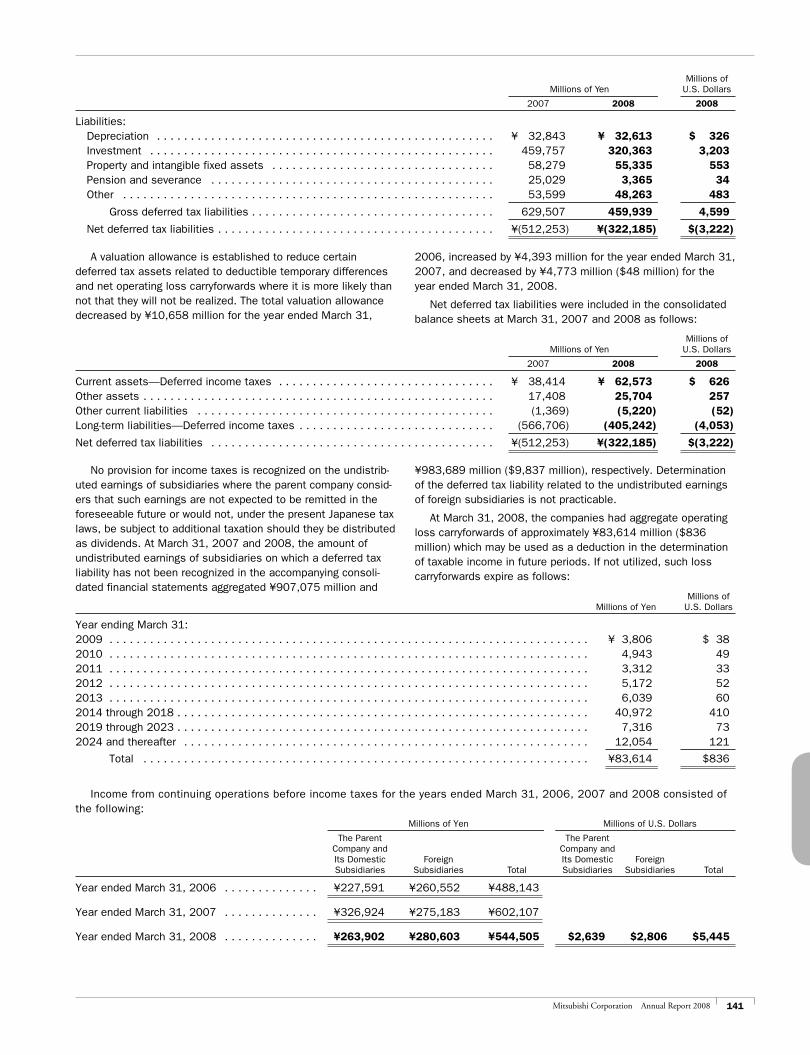
141Mitsubishi Corporation Annual Report 2008
Millions of Millions of Yen U.S. Dollars
2007 2008 2008
Liabilities: Depreciation . . . . . . . . . . . . . . . . . . . . . . . . . . . . . . . . . . . . . . . . . . . . . . . . . . ¥ 32,843 ¥ 32,613 $ 326 Investment . . . . . . . . . . . . . . . . . . . . . . . . . . . . . . . . . . . . . . . . . . . . . . . . . . . 459,757 320,363 3,203 Property and intangible fixed assets . . . . . . . . . . . . . . . . . . . . . . . . . . . . . . . . . 58,279 55,335 553 Pension and severance . . . . . . . . . . . . . . . . . . . . . . . . . . . . . . . . . . . . . . . . . . 25,029 3,365 34 Other . . . . . . . . . . . . . . . . . . . . . . . . . . . . . . . . . . . . . . . . . . . . . . . . . . . . . . . 53,599 48,263 483
Gross deferred tax liabilities . . . . . . . . . . . . . . . . . . . . . . . . . . . . . . . . . . . . 629,507 459,939 4,599
Net deferred tax liabilities . . . . . . . . . . . . . . . . . . . . . . . . . . . . . . . . . . . . . . . . . ¥(512,253) ¥(322,185) $(3,222)
A valuation allowance is established to reduce certain deferred tax assets related to deductible temporary differences and net operating loss carryforwards where it is more likely than not that they will not be realized. The total valuation allowance decreased by ¥10,658 million for the year ended March 31,
2006, increased by ¥4,393 million for the year ended March 31, 2007, and decreased by ¥4,773 million ($48 million) for the year ended March 31, 2008.
Net deferred tax liabilities were included in the consolidated balance sheets at March 31, 2007 and 2008 as follows:
Millions of Millions of Yen U.S. Dollars
2007 2008 2008
Current assets—Deferred income taxes . . . . . . . . . . . . . . . . . . . . . . . . . . . . . . . . ¥ 38,414 ¥ 62,573 $ 626Other assets . . . . . . . . . . . . . . . . . . . . . . . . . . . . . . . . . . . . . . . . . . . . . . . . . . . . 17,408 25,704 257Other current liabilities . . . . . . . . . . . . . . . . . . . . . . . . . . . . . . . . . . . . . . . . . . . . (1,369) (5,220) (52)Long-term liabilities—Deferred income taxes . . . . . . . . . . . . . . . . . . . . . . . . . . . . . (566,706) (405,242) (4,053)
Net deferred tax liabilities . . . . . . . . . . . . . . . . . . . . . . . . . . . . . . . . . . . . . . . . . . ¥(512,253) ¥(322,185) $(3,222)
No provision for income taxes is recognized on the undistrib-uted earnings of subsidiaries where the parent company consid-ers that such earnings are not expected to be remitted in the foreseeable future or would not, under the present Japanese tax laws, be subject to additional taxation should they be distributed as dividends. At March 31, 2007 and 2008, the amount of undistributed earnings of subsidiaries on which a deferred tax liability has not been recognized in the accompanying consoli-dated financial statements aggregated ¥907,075 million and
¥983,689 million ($9,837 million), respectively. Determination of the deferred tax liability related to the undistributed earnings of foreign subsidiaries is not practicable.
At March 31, 2008, the companies had aggregate operating loss carryforwards of approximately ¥83,614 million ($836 million) which may be used as a deduction in the determination of taxable income in future periods. If not utilized, such loss carryforwards expire as follows:
Millions of Millions of Yen U.S. Dollars
Year ending March 31:2009 . . . . . . . . . . . . . . . . . . . . . . . . . . . . . . . . . . . . . . . . . . . . . . . . . . . . . . . . . . . . . . . . . . . . . . . ¥ 3,806 $ 382010 . . . . . . . . . . . . . . . . . . . . . . . . . . . . . . . . . . . . . . . . . . . . . . . . . . . . . . . . . . . . . . . . . . . . . . . 4,943 492011 . . . . . . . . . . . . . . . . . . . . . . . . . . . . . . . . . . . . . . . . . . . . . . . . . . . . . . . . . . . . . . . . . . . . . . . 3,312 332012 . . . . . . . . . . . . . . . . . . . . . . . . . . . . . . . . . . . . . . . . . . . . . . . . . . . . . . . . . . . . . . . . . . . . . . . 5,172 522013 . . . . . . . . . . . . . . . . . . . . . . . . . . . . . . . . . . . . . . . . . . . . . . . . . . . . . . . . . . . . . . . . . . . . . . . 6,039 602014 through 2018 . . . . . . . . . . . . . . . . . . . . . . . . . . . . . . . . . . . . . . . . . . . . . . . . . . . . . . . . . . . . . 40,972 4102019 through 2023 . . . . . . . . . . . . . . . . . . . . . . . . . . . . . . . . . . . . . . . . . . . . . . . . . . . . . . . . . . . . . 7,316 732024 and thereafter . . . . . . . . . . . . . . . . . . . . . . . . . . . . . . . . . . . . . . . . . . . . . . . . . . . . . . . . . . . . 12,054 121
Total . . . . . . . . . . . . . . . . . . . . . . . . . . . . . . . . . . . . . . . . . . . . . . . . . . . . . . . . . . . . . . . . . . ¥83,614 $836
Income from continuing operations before income taxes for the years ended March 31, 2006, 2007 and 2008 consisted of the following: Millions of Yen Millions of U.S. Dollars
The Parent The Parent Company and Company and Its Domestic Foreign Its Domestic Foreign Subsidiaries Subsidiaries Total Subsidiaries Subsidiaries Total
Year ended March 31, 2006 . . . . . . . . . . . . . . ¥227,591 ¥260,552 ¥488,143
Year ended March 31, 2007 . . . . . . . . . . . . . . ¥326,924 ¥275,183 ¥602,107
Year ended March 31, 2008 . . . . . . . . . . . . . . ¥263,902 ¥280,603 ¥544,505 $2,639 $2,806 $5,445
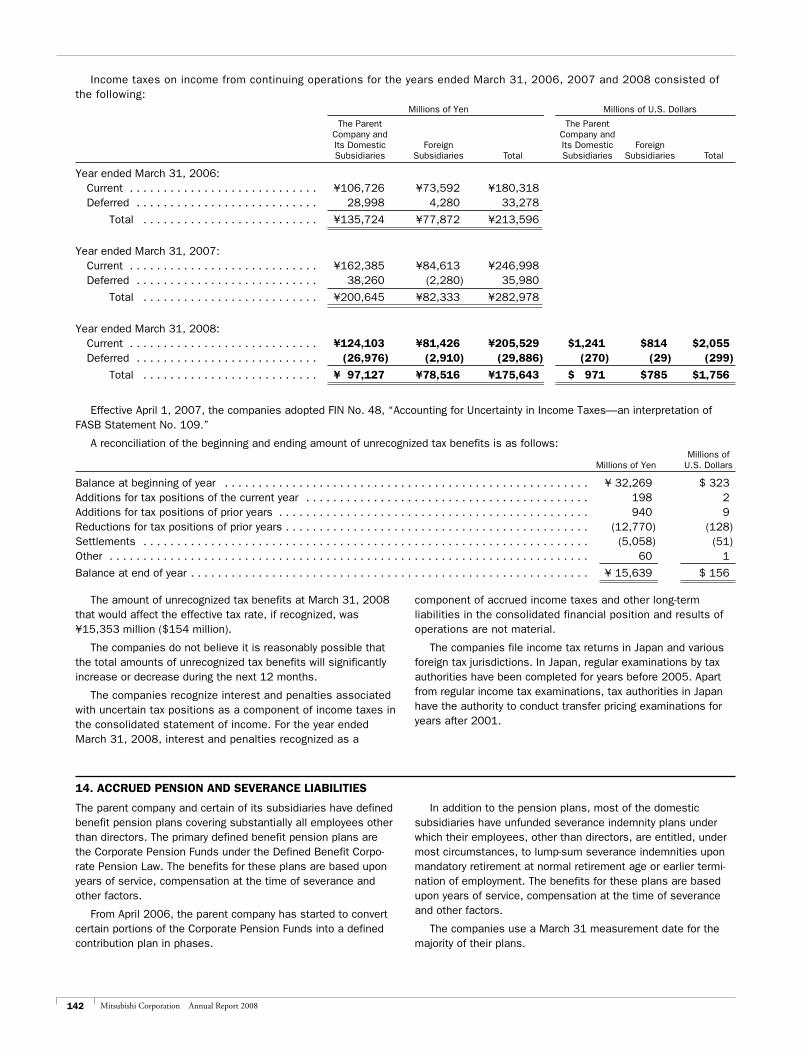
142 Mitsubishi Corporation Annual Report 2008
Income taxes on income from continuing operations for the years ended March 31, 2006, 2007 and 2008 consisted of the following: Millions of Yen Millions of U.S. Dollars
The Parent The Parent Company and Company and Its Domestic Foreign Its Domestic Foreign Subsidiaries Subsidiaries Total Subsidiaries Subsidiaries Total
Year ended March 31, 2006: Current . . . . . . . . . . . . . . . . . . . . . . . . . . . . ¥106,726 ¥73,592 ¥180,318 Deferred . . . . . . . . . . . . . . . . . . . . . . . . . . . 28,998 4,280 33,278
Total . . . . . . . . . . . . . . . . . . . . . . . . . . ¥135,724 ¥77,872 ¥213,596
Year ended March 31, 2007: Current . . . . . . . . . . . . . . . . . . . . . . . . . . . . ¥162,385 ¥84,613 ¥246,998 Deferred . . . . . . . . . . . . . . . . . . . . . . . . . . . 38,260 (2,280) 35,980
Total . . . . . . . . . . . . . . . . . . . . . . . . . . ¥200,645 ¥82,333 ¥282,978
Year ended March 31, 2008: Current . . . . . . . . . . . . . . . . . . . . . . . . . . . . ¥124,103 ¥81,426 ¥205,529 $1,241 $814 $2,055 Deferred . . . . . . . . . . . . . . . . . . . . . . . . . . . (26,976) (2,910) (29,886) (270) (29) (299)
Total . . . . . . . . . . . . . . . . . . . . . . . . . . ¥ 97,127 ¥78,516 ¥175,643 $ 971 $785 $1,756
Effective April 1, 2007, the companies adopted FIN No. 48, “Accounting for Uncertainty in Income Taxes—an interpretation of FASB Statement No. 109.”
A reconciliation of the beginning and ending amount of unrecognized tax benefits is as follows: Millions of Millions of Yen U.S. Dollars
Balance at beginning of year . . . . . . . . . . . . . . . . . . . . . . . . . . . . . . . . . . . . . . . . . . . . . . . . . . . . . . ¥ 32,269 $ 323Additions for tax positions of the current year . . . . . . . . . . . . . . . . . . . . . . . . . . . . . . . . . . . . . . . . . . 198 2Additions for tax positions of prior years . . . . . . . . . . . . . . . . . . . . . . . . . . . . . . . . . . . . . . . . . . . . . . 940 9Reductions for tax positions of prior years . . . . . . . . . . . . . . . . . . . . . . . . . . . . . . . . . . . . . . . . . . . . . (12,770) (128)Settlements . . . . . . . . . . . . . . . . . . . . . . . . . . . . . . . . . . . . . . . . . . . . . . . . . . . . . . . . . . . . . . . . . . (5,058) (51)Other . . . . . . . . . . . . . . . . . . . . . . . . . . . . . . . . . . . . . . . . . . . . . . . . . . . . . . . . . . . . . . . . . . . . . . . 60 1
Balance at end of year . . . . . . . . . . . . . . . . . . . . . . . . . . . . . . . . . . . . . . . . . . . . . . . . . . . . . . . . . . . ¥ 15,639 $ 156
The amount of unrecognized tax benefits at March 31, 2008 that would affect the effective tax rate, if recognized, was ¥15,353 million ($154 million).
The companies do not believe it is reasonably possible that the total amounts of unrecognized tax benefits will significantly increase or decrease during the next 12 months.
The companies recognize interest and penalties associated with uncertain tax positions as a component of income taxes in the consolidated statement of income. For the year ended March 31, 2008, interest and penalties recognized as a
component of accrued income taxes and other long-term liabilities in the consolidated financial position and results of operations are not material.
The companies file income tax returns in Japan and various foreign tax jurisdictions. In Japan, regular examinations by tax authorities have been completed for years before 2005. Apart from regular income tax examinations, tax authorities in Japan have the authority to conduct transfer pricing examinations for years after 2001.
14. ACCRUED PENSION AND SEVERANCE LIABILITIES
The parent company and certain of its subsidiaries have defined benefit pension plans covering substantially all employees other than directors. The primary defined benefit pension plans are the Corporate Pension Funds under the Defined Benefit Corpo-rate Pension Law. The benefits for these plans are based upon years of service, compensation at the time of severance and other factors.
From April 2006, the parent company has started to convert certain portions of the Corporate Pension Funds into a defined contribution plan in phases.
In addition to the pension plans, most of the domestic subsidiaries have unfunded severance indemnity plans under which their employees, other than directors, are entitled, under most circumstances, to lump-sum severance indemnities upon mandatory retirement at normal retirement age or earlier termi-nation of employment. The benefits for these plans are based upon years of service, compensation at the time of severance and other factors.
The companies use a March 31 measurement date for the majority of their plans.
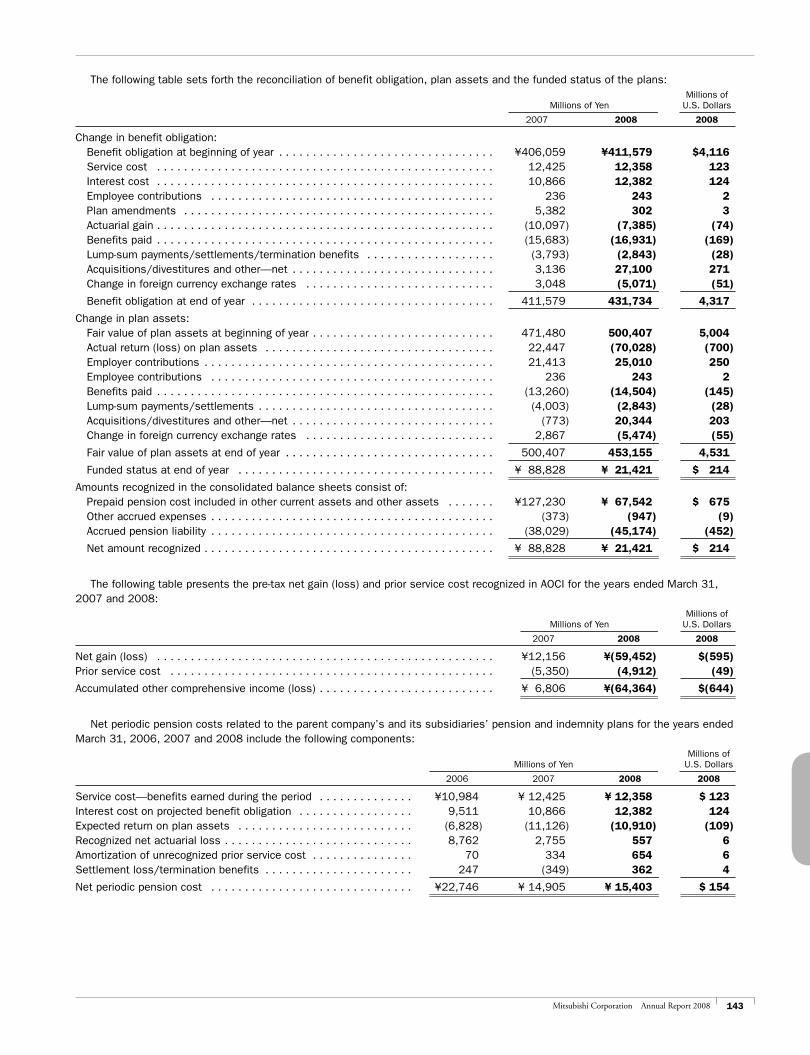
143Mitsubishi Corporation Annual Report 2008
The following table sets forth the reconciliation of benefit obligation, plan assets and the funded status of the plans: Millions of Millions of Yen U.S. Dollars
2007 2008 2008
Change in benefit obligation: Benefit obligation at beginning of year . . . . . . . . . . . . . . . . . . . . . . . . . . . . . . . . ¥406,059 ¥411,579 $4,116 Service cost . . . . . . . . . . . . . . . . . . . . . . . . . . . . . . . . . . . . . . . . . . . . . . . . . . 12,425 12,358 123 Interest cost . . . . . . . . . . . . . . . . . . . . . . . . . . . . . . . . . . . . . . . . . . . . . . . . . . 10,866 12,382 124 Employee contributions . . . . . . . . . . . . . . . . . . . . . . . . . . . . . . . . . . . . . . . . . . 236 243 2 Plan amendments . . . . . . . . . . . . . . . . . . . . . . . . . . . . . . . . . . . . . . . . . . . . . . 5,382 302 3 Actuarial gain . . . . . . . . . . . . . . . . . . . . . . . . . . . . . . . . . . . . . . . . . . . . . . . . . . (10,097) (7,385) (74) Benefits paid . . . . . . . . . . . . . . . . . . . . . . . . . . . . . . . . . . . . . . . . . . . . . . . . . . (15,683) (16,931) (169) Lump-sum payments/settlements/termination benefits . . . . . . . . . . . . . . . . . . . (3,793) (2,843) (28) Acquisitions/divestitures and other—net . . . . . . . . . . . . . . . . . . . . . . . . . . . . . . 3,136 27,100 271 Change in foreign currency exchange rates . . . . . . . . . . . . . . . . . . . . . . . . . . . . 3,048 (5,071) (51)
Benefit obligation at end of year . . . . . . . . . . . . . . . . . . . . . . . . . . . . . . . . . . . . 411,579 431,734 4,317
Change in plan assets: Fair value of plan assets at beginning of year . . . . . . . . . . . . . . . . . . . . . . . . . . . 471,480 500,407 5,004 Actual return (loss) on plan assets . . . . . . . . . . . . . . . . . . . . . . . . . . . . . . . . . . 22,447 (70,028) (700) Employer contributions . . . . . . . . . . . . . . . . . . . . . . . . . . . . . . . . . . . . . . . . . . . 21,413 25,010 250 Employee contributions . . . . . . . . . . . . . . . . . . . . . . . . . . . . . . . . . . . . . . . . . . 236 243 2 Benefits paid . . . . . . . . . . . . . . . . . . . . . . . . . . . . . . . . . . . . . . . . . . . . . . . . . . (13,260) (14,504) (145) Lump-sum payments/settlements . . . . . . . . . . . . . . . . . . . . . . . . . . . . . . . . . . . (4,003) (2,843) (28) Acquisitions/divestitures and other—net . . . . . . . . . . . . . . . . . . . . . . . . . . . . . . (773) 20,344 203 Change in foreign currency exchange rates . . . . . . . . . . . . . . . . . . . . . . . . . . . . 2,867 (5,474) (55)
Fair value of plan assets at end of year . . . . . . . . . . . . . . . . . . . . . . . . . . . . . . . 500,407 453,155 4,531
Funded status at end of year . . . . . . . . . . . . . . . . . . . . . . . . . . . . . . . . . . . . . . ¥ 88,828 ¥ 21,421 $ 214
Amounts recognized in the consolidated balance sheets consist of: Prepaid pension cost included in other current assets and other assets . . . . . . . ¥127,230 ¥ 67,542 $ 675 Other accrued expenses . . . . . . . . . . . . . . . . . . . . . . . . . . . . . . . . . . . . . . . . . . (373) (947) (9) Accrued pension liability . . . . . . . . . . . . . . . . . . . . . . . . . . . . . . . . . . . . . . . . . . (38,029) (45,174) (452)
Net amount recognized . . . . . . . . . . . . . . . . . . . . . . . . . . . . . . . . . . . . . . . . . . . ¥ 88,828 ¥ 21,421 $ 214
The following table presents the pre-tax net gain (loss) and prior service cost recognized in AOCI for the years ended March 31, 2007 and 2008: Millions of Millions of Yen U.S. Dollars
2007 2008 2008
Net gain (loss) . . . . . . . . . . . . . . . . . . . . . . . . . . . . . . . . . . . . . . . . . . . . . . . . . . ¥12,156 ¥(59,452) $(595)Prior service cost . . . . . . . . . . . . . . . . . . . . . . . . . . . . . . . . . . . . . . . . . . . . . . . . (5,350) (4,912) (49)
Accumulated other comprehensive income (loss) . . . . . . . . . . . . . . . . . . . . . . . . . . ¥ 6,806 ¥(64,364) $(644)
Net periodic pension costs related to the parent company’s and its subsidiaries’ pension and indemnity plans for the years ended March 31, 2006, 2007 and 2008 include the following components: Millions of Millions of Yen U.S. Dollars
2006 2007 2008 2008
Service cost—benefits earned during the period . . . . . . . . . . . . . . ¥10,984 ¥ 12,425 ¥ 12,358 $ 123Interest cost on projected benefit obligation . . . . . . . . . . . . . . . . . 9,511 10,866 12,382 124Expected return on plan assets . . . . . . . . . . . . . . . . . . . . . . . . . . (6,828) (11,126) (10,910) (109)Recognized net actuarial loss . . . . . . . . . . . . . . . . . . . . . . . . . . . . 8,762 2,755 557 6Amortization of unrecognized prior service cost . . . . . . . . . . . . . . . 70 334 654 6Settlement loss/termination benefits . . . . . . . . . . . . . . . . . . . . . . 247 (349) 362 4
Net periodic pension cost . . . . . . . . . . . . . . . . . . . . . . . . . . . . . . ¥22,746 ¥ 14,905 ¥ 15,403 $ 154
144 Mitsubishi Corporation Annual Report 2008
Other changes in plan assets and benefit obligation recognized in other comprehensive income for the year ended March 31, 2008 were as follows: Millions of Millions of Yen U.S. Dollars
2008 2008
Current year actuarial loss . . . . . . . . . . . . . . . . . . . . . . . . . . . . . . . . . . . . . . . . . . . . . . . . . . . . . . . . ¥72,527 $726 Recognized net actuarial loss . . . . . . . . . . . . . . . . . . . . . . . . . . . . . . . . . . . . . . . . . . . . . . . . . . . . . . (557) (6)Settlement loss/termination benefits . . . . . . . . . . . . . . . . . . . . . . . . . . . . . . . . . . . . . . . . . . . . . . . . (362) (4)Prior service cost due to amendments . . . . . . . . . . . . . . . . . . . . . . . . . . . . . . . . . . . . . . . . . . . . . . . 216 2Amortization of unrecognized prior service cost . . . . . . . . . . . . . . . . . . . . . . . . . . . . . . . . . . . . . . . . . (654) (6)
Total recognized in other comprehensive income . . . . . . . . . . . . . . . . . . . . . . . . . . . . . . . . . . . ¥71,170 $712
The following table presents the estimated net loss and prior service cost that will be amortized from AOCI into net periodic cost for the year ending March 31, 2009 : Millions of Millions of Yen U.S. Dollars
2009 2009
Net loss . . . . . . . . . . . . . . . . . . . . . . . . . . . . . . . . . . . . . . . . . . . . . . . . . . . . . . . . . . . . . . . . . . . . . ¥1,879 $19Prior service cost . . . . . . . . . . . . . . . . . . . . . . . . . . . . . . . . . . . . . . . . . . . . . . . . . . . . . . . . . . . . . . 379 4
Total . . . . . . . . . . . . . . . . . . . . . . . . . . . . . . . . . . . . . . . . . . . . . . . . . . . . . . . . . . . . . . . . . . ¥2,258 $23
The total accumulated benefit obligation for the companies’ defined benefit pension plans was ¥388,306 million and ¥403,484 million ($4,035 million) as of March 31, 2007 and 2008, respectively.
The aggregate projected benefit obligation, aggregate accu-mulated benefit obligation and aggregate fair value of plan assets where accumulated benefit obligations exceeded plan assets as of March 31, 2007 and 2008 were as follows:
Millions of Millions of Yen U.S. Dollars
2007 2008 2008
Projected benefit obligation . . . . . . . . . . . . . . . . . . . . . . . . . . . . . . . . . . . . . . . . . ¥70,570 ¥89,760 $898Accumulated benefit obligation . . . . . . . . . . . . . . . . . . . . . . . . . . . . . . . . . . . . . . . 69,931 82,795 828Fair value of plan assets . . . . . . . . . . . . . . . . . . . . . . . . . . . . . . . . . . . . . . . . . . . 35,733 47,832 478
Plan AssetsThe companies’ weighted average asset allocation for its defined benefit pension plans for the years ended March 31, 2007 and 2008 was as follows: Asset Allocation
2007 2008
Asset category: Equity securities . . . . . . . . . . . . . . . . . . . . . . . . . . . . . . . . . . . . . . . . . . . . . . . . . . . . . . . . . . . . . . . . . 63% 55% Debt securities . . . . . . . . . . . . . . . . . . . . . . . . . . . . . . . . . . . . . . . . . . . . . . . . . . . . . . . . . . . . . . . . . . 15 17 Alternative investments . . . . . . . . . . . . . . . . . . . . . . . . . . . . . . . . . . . . . . . . . . . . . . . . . . . . . . . . . . . . 15 17 Cash and cash equivalent . . . . . . . . . . . . . . . . . . . . . . . . . . . . . . . . . . . . . . . . . . . . . . . . . . . . . . . . . . . 5 10 Other . . . . . . . . . . . . . . . . . . . . . . . . . . . . . . . . . . . . . . . . . . . . . . . . . . . . . . . . . . . . . . . . . . . . . . . . . 2 1
Total . . . . . . . . . . . . . . . . . . . . . . . . . . . . . . . . . . . . . . . . . . . . . . . . . . . . . . . . . . . . . . . . . . . . . . 100% 100%
Investment PoliciesThe companies’ investment policy for the defined benefit pen-sion plan is to procure an adequate return to provide future payments of pension benefits over the long term by optimizing the risk tolerance and formulating a well-diversified portfolio such as equity securities, debt securities and alternative assets.
Considering the funded status of the pension plans and surrounding economic environments of investments, the
companies’ investment policy would be revised as needed. Moreover, the companies continuously monitor and pay extra attention to the diversification of strategies and investment managers for the purpose of risk controlling and thereby pursuing the efficiency of management.
AssumptionsThe weighted average assumptions used to determine benefit obligations at March 31, 2007 and 2008 were as follows:
2007 2008
Weighted average discount rate . . . . . . . . . . . . . . . . . . . . . . . . . . . . . . . . . . . . . . . . . . . . . . . . . . . . . . . . 3.0% 3.1%Average rate of increase in future compensation levels . . . . . . . . . . . . . . . . . . . . . . . . . . . . . . . . . . . . . . . 2.6 2.6
145Mitsubishi Corporation Annual Report 2008
The weighted average assumptions used to determine net periodic benefit cost for the years ended March 31, 2006, 2007 and 2008 were as follows: 2006 2007 2008
Weighted average discount rate . . . . . . . . . . . . . . . . . . . . . . . . . . . . . . . . . . . . . . . . . . 2.4% 2.6% 3.0%Average rate of increase in future compensation levels . . . . . . . . . . . . . . . . . . . . . . . . . 2.4 2.4 2.6Expected long-term rate of return on plan assets . . . . . . . . . . . . . . . . . . . . . . . . . . . . . . 3.3 4.2 3.7
The companies determine assumptions for the expected long-term return on plan assets considering the investment policy, the historical returns, asset allocation and future estimates of long-term investment returns.
ContributionThe companies’ funding policy is mainly to contribute an amount deductible for income tax purposes. Contributions are intended
to provide not only for benefits attributable to service to date but also for those expected to be earned in the future.
The companies expect to contribute approximately ¥24,000 million ($240 million) to their defined benefit pension plans during the year ending March 31, 2009.
Estimated Future Benefit PaymentsEstimated future benefit payments are as follows:
Millions of Millions of Yen U.S. Dollars
Year ending March 31:2009 . . . . . . . . . . . . . . . . . . . . . . . . . . . . . . . . . . . . . . . . . . . . . . . . . . . . . . . . . . . . . . . . . . . . . . . ¥ 26,666 $ 2672010 . . . . . . . . . . . . . . . . . . . . . . . . . . . . . . . . . . . . . . . . . . . . . . . . . . . . . . . . . . . . . . . . . . . . . . . 21,268 2132011 . . . . . . . . . . . . . . . . . . . . . . . . . . . . . . . . . . . . . . . . . . . . . . . . . . . . . . . . . . . . . . . . . . . . . . . 22,925 2292012 . . . . . . . . . . . . . . . . . . . . . . . . . . . . . . . . . . . . . . . . . . . . . . . . . . . . . . . . . . . . . . . . . . . . . . . 24,115 2412013 . . . . . . . . . . . . . . . . . . . . . . . . . . . . . . . . . . . . . . . . . . . . . . . . . . . . . . . . . . . . . . . . . . . . . . . 23,102 2312014 through 2018 . . . . . . . . . . . . . . . . . . . . . . . . . . . . . . . . . . . . . . . . . . . . . . . . . . . . . . . . . . . . . 118,827 1,188
Expense For Defined Contribution PlansThe parent company and certain of its subsidiaries have defined contribution plans. The expense for these defined contribution plans was ¥2,029 million and ¥1,717 million ($17 million) for the years ended March 31, 2007 and 2008, respectively.
Early Retirement ProgramThe parent company has offered an early retirement program to its employees. At March 31, 2007 and 2008, the liability for applicants to the program, discounted to reflect the present value of the expected cash flows, was ¥12,582 million and
¥9,758 million ($98 million), respectively. Such liability is allo-cated between “Other accrued expenses” and “Accrued pension and severance liabilities” in the accompanying consolidated balance sheets, depending on when the additional benefit pay-ment is expected to be made. Related expenses recognized by the parent company for the years ended March 31, 2006, 2007 and 2008, included in “Selling, general and administrative” expenses in the accompanying consolidated statements of income, were ¥645 million, ¥1,486 million and ¥1,230 million ($12 million), respectively.
15. ASSET RETIREMENT OBLIGATIONS
The companies account for asset retirement obligations (“AROs”), consisting primarily of costs associated with mine reclamation, landfills and dismantlement of facilities, under SFAS No. 143, “Accounting for Asset Retirement Obligations.” These costs reflect the legal obligations associated with the normal operation of the companies’ coal mining and oil and gas facilities. These liabilities are included in “Other current liabilities”
and “Other long-term liabilities” in the consolidated balance sheets. Additionally, the companies capitalized asset retirement costs by increasing the carrying amount of related long-lived assets, and recorded associated accumulated depreciation from the time the original assets are placed into service.
The changes in the carrying amount of AROs for the years ended March 31, 2007 and 2008 were as follows:
Millions of Millions of Yen U.S. Dollars
2007 2008 2008
Balance at beginning of year . . . . . . . . . . . . . . . . . . . . . . . . . . . . . . . . . . . . . . . . ¥17,940 ¥25,815 $258Accretion expense . . . . . . . . . . . . . . . . . . . . . . . . . . . . . . . . . . . . . . . . . . . . . . . . 1,222 1,809 18Payments . . . . . . . . . . . . . . . . . . . . . . . . . . . . . . . . . . . . . . . . . . . . . . . . . . . . . . (968) (665) (7)Liabilities incurred . . . . . . . . . . . . . . . . . . . . . . . . . . . . . . . . . . . . . . . . . . . . . . . . 300 4,879 49Revisions in estimated cash flow . . . . . . . . . . . . . . . . . . . . . . . . . . . . . . . . . . . . . 1,399The effect of change in fiscal year end of certain subsidiaries . . . . . . . . . . . . . . . . . 3,780Other* . . . . . . . . . . . . . . . . . . . . . . . . . . . . . . . . . . . . . . . . . . . . . . . . . . . . . . . . 2,142 (1,557) (15)
Balance at end of year . . . . . . . . . . . . . . . . . . . . . . . . . . . . . . . . . . . . . . . . . . . . . ¥25,815 ¥30,281 $303
* “Other” principally includes the effect of changes in foreign currency exchange rates and the effect of consolidation of certain subsidiaries.
146 Mitsubishi Corporation Annual Report 2008
16. DISCONTINUED OPERATIONS
In accordance with SFAS No. 144, the companies present the results of discontinued operations as a separate line item in the consolidated statements of income under loss from discontin-ued operations (net of tax).
In March 2008, the companies decided to sell a U.S. chemi-cal products manufacturing operation in the Chemicals segment, and the operation has been classified as discontinued opera-tions. The figures of the consolidated statements of income
and the related notes for the prior years related to the discontin-ued operations have been reclassified to conform to the current year presentation.
Summarized selected financial information for the years ended March 31, 2006, 2007 and 2008 for the discontinued operations reclassified during the year ended March 31, 2008, and descriptions of assets and liabilities classified as held for sale at March 31, 2008, were as follows:
Millions of Millions of Yen U.S. Dollars
Loss from discontinued operation 2006 2007 2008 2008
Revenues . . . . . . . . . . . . . . . . . . . . . . . . . . . . . . . . . . . . . . . . . . ¥17,688 ¥18,196 ¥16,332 $163Loss from discontinued operations before income taxes . . . . . . . . (2,926) (5,452) (3,410) (34)Income taxes . . . . . . . . . . . . . . . . . . . . . . . . . . . . . . . . . . . . . . . (734) (320) (194) (2)Minority interests in loss from discontinued operations . . . . . . . . . (3) 545 Loss from discontinued operations (net of tax) . . . . . . . . . . . . . . . (3,663) (5,227) (3,604) (36)
Millions of Millions of Yen U.S. Dollars
Description of assets and liabilities classified as held for sale 2008 2008
Receivables-trade . . . . . . . . . . . . . . . . . . . . . . . . . . . . . . . . . . . . . . . . . . . . . . . . . . . . . . . . . . . . . . ¥2,050 $20Inventories . . . . . . . . . . . . . . . . . . . . . . . . . . . . . . . . . . . . . . . . . . . . . . . . . . . . . . . . . . . . . . . . . . . 3,082 31Property and equipment-net . . . . . . . . . . . . . . . . . . . . . . . . . . . . . . . . . . . . . . . . . . . . . . . . . . . . . . . 1,338 13Other . . . . . . . . . . . . . . . . . . . . . . . . . . . . . . . . . . . . . . . . . . . . . . . . . . . . . . . . . . . . . . . . . . . . . . . 56 1
Total assets held for sale . . . . . . . . . . . . . . . . . . . . . . . . . . . . . . . . . . . . . . . . . . . . . . . . . . . . . . . . ¥6,526 $65
Payables-trade . . . . . . . . . . . . . . . . . . . . . . . . . . . . . . . . . . . . . . . . . . . . . . . . . . . . . . . . . . . . . . . . ¥ 937 $ 9Other . . . . . . . . . . . . . . . . . . . . . . . . . . . . . . . . . . . . . . . . . . . . . . . . . . . . . . . . . . . . . . . . . . . . . . . 1,144 12
Total liabilities held for sale . . . . . . . . . . . . . . . . . . . . . . . . . . . . . . . . . . . . . . . . . . . . . . . . . . . . . . . ¥2,081 $21
17. COMMON STOCK AND ADDITIONAL PAID-IN CAPITAL
The Companies Act of Japan requires in principle that the amount of payment for shares and assets delivered shall be the amount of common stock. However, the Companies Act permits, as an exception that an amount not exceeding 50% of such amount of payment and assets is able to be incorporated into the additional paid-in capital.
Under the Companies Act, Japanese companies are able to purchase and dispose of their treasury stock by resolution of the
Board of Directors. However, the disbursement amount for acquiring treasury stock cannot exceed the amount available for dividends to the shareholders, which is calculated by a specific formula in accordance with the Companies Act.
The Companies Act provides that subject to certain condi-tions, such as a resolution of the shareholders’ meeting, common stock, reserves and surplus can be transferred among each other.
18. RETAINED EARNINGS AND DIVIDENDS
Retained Earnings Appropriated for Legal Reserve—The Com-panies Act requires that an amount equal to 10% of dividends from the retained earnings to be paid shall be appropriated and set aside as legal reserve until the total of additional paid-in capital and legal reserve amounts to 25% of the common stock account.
Dividends—Under the Companies Act, the total amount for dividends and acquisition or purchase of treasury stock may not exceed the distributable amount of the parent company, which is calculated based on the amount of the retained earnings
recorded in the parent company’s general books of accounts maintained in accordance with generally accepted Japanese accounting practices. The adjustments to the consolidated finan-cial statements to conform with U.S. GAAP have no effect on the determination of the distributable amount under the Companies Act. The distributable amount was ¥701,616 million ($7,016 million) as of March 31, 2008. The distributable amount under the Companies Act may fluctuate until the effective date for the distribution of dividends.
147Mitsubishi Corporation Annual Report 2008
The Companies Act permits to pay dividends at any time during the fiscal year upon resolution at the shareholders’ meeting. Furthermore, the parent company is also able to distribute a semiannual interim dividend by resolution of the Board of Directors.
In the accompanying consolidated statements of sharehold-ers’ equity, dividends and appropriations to the legal reserve shown for each year represent dividends paid out during the year and the appropriation to the legal reserve made in relation to the respective dividends.
Purchase of Treasury Stock—Under the Companies Act, the parent company is allowed to purchase treasury stock through market transactions by resolution of the Board of Directors.
In August 2007, the Board of Directors of the parent company decided to purchase treasury stock to implement a flexible capital structure policy according to changes in the business environ-ment. As a result, the parent company purchased 51,759,000 shares of treasury stock through market transactions.
19. EARNINGS PER SHARE
The following table presents the reconciliation of the numerators and the denominators of the basic and diluted EPS computations: Millions of Millions of Yen U.S. Dollars
2006 2007 2008 2008
Numerator: Net income from continuing operations . . . . . . . . . . . . . . . . . . . ¥356,949 ¥420,745 ¥466,392 $4,664 Effect of dilutive securities—Japanese yen convertible bonds . . . (1,446) (29) (32)
Diluted income from continuing operations . . . . . . . . . . . . . . . . ¥355,503 ¥420,716 ¥466,360 $4,664
Loss from discontinued operations (net of tax) . . . . . . . . . . . . . . (3,663) (5,227) (3,604) (36)
Net income . . . . . . . . . . . . . . . . . . . . . . . . . . . . . . . . . . . . . . . ¥353,286 ¥415,518 ¥462,788 $4,628 Effect of dilutive securities—Japanese yen convertible bonds . . . (1,446) (29) (32)
Diluted income . . . . . . . . . . . . . . . . . . . . . . . . . . . . . . . . . . . . ¥351,840 ¥415,489 ¥462,756 $4,628
Thousands of Shares
2006 2007 2008
Denominator: Basic weighted average common shares outstanding . . . . . . . . . 1,625,211 1,687,066 1,659,008 Effect of dilutive securities: Stock options . . . . . . . . . . . . . . . . . . . . . . . . . . . . . . . . . . . . 2,691 2,933 3,456 Japanese yen convertible bonds . . . . . . . . . . . . . . . . . . . . . . 67,485 6,184 3,873
Diluted outstanding shares . . . . . . . . . . . . . . . . . . . . . . . . . . . . 1,695,387 1,696,183 1,666,337
Yen U.S. Dollars
2006 2007 2008 2008
Per share amount: Net income from continuing operations Basic . . . . . . . . . . . . . . . . . . . . . . . . . . . . . . . . . . . . . . . . . . ¥219.63 ¥249.39 ¥281.13 $ 2.81 Diluted . . . . . . . . . . . . . . . . . . . . . . . . . . . . . . . . . . . . . . . . . 209.69 248.04 279.87 2.80
Loss from discontinued operations (net of tax) Basic . . . . . . . . . . . . . . . . . . . . . . . . . . . . . . . . . . . . . . . . . . (2.25) (3.09) (2.18) (0.02) Diluted . . . . . . . . . . . . . . . . . . . . . . . . . . . . . . . . . . . . . . . . . (2.16) (3.08) (2.16) (0.02)
Net income Basic . . . . . . . . . . . . . . . . . . . . . . . . . . . . . . . . . . . . . . . . . . ¥217.38 ¥246.30 ¥278.95 $ 2.79 Diluted . . . . . . . . . . . . . . . . . . . . . . . . . . . . . . . . . . . . . . . . . 207.53 244.96 277.71 2.78
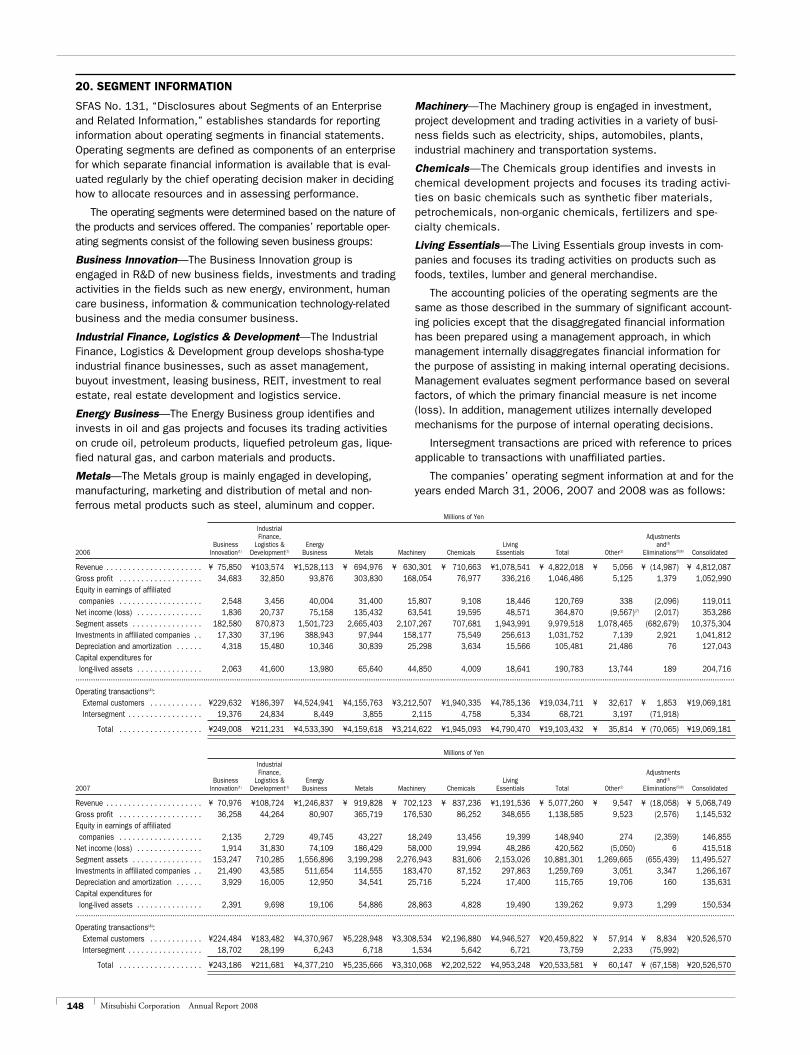
148 Mitsubishi Corporation Annual Report 2008
20. SEGMENT INFORMATION
SFAS No. 131, “Disclosures about Segments of an Enterprise and Related Information,” establishes standards for reporting information about operating segments in financial statements. Operating segments are defined as components of an enterprise for which separate financial information is available that is eval-uated regularly by the chief operating decision maker in deciding how to allocate resources and in assessing performance.
The operating segments were determined based on the nature of the products and services offered. The companies’ reportable oper-ating segments consist of the following seven business groups:
Business Innovation—The Business Innovation group is engaged in R&D of new business fields, investments and trading activities in the fields such as new energy, environment, human care business, information & communication technology-related business and the media consumer business.
Industrial Finance, Logistics & Development—The Industrial Finance, Logistics & Development group develops shosha-type industrial finance businesses, such as asset management, buyout investment, leasing business, REIT, investment to real estate, real estate development and logistics service.
Energy Business—The Energy Business group identifies and invests in oil and gas projects and focuses its trading activities on crude oil, petroleum products, liquefied petroleum gas, lique-fied natural gas, and carbon materials and products.
Metals—The Metals group is mainly engaged in developing, manufacturing, marketing and distribution of metal and non-ferrous metal products such as steel, aluminum and copper.
Machinery—The Machinery group is engaged in investment, project development and trading activities in a variety of busi-ness fields such as electricity, ships, automobiles, plants, industrial machinery and transportation systems.
Chemicals—The Chemicals group identifies and invests in chemical development projects and focuses its trading activi-ties on basic chemicals such as synthetic fiber materials, petrochemicals, non-organic chemicals, fertilizers and spe-cialty chemicals.
Living Essentials—The Living Essentials group invests in com-panies and focuses its trading activities on products such as foods, textiles, lumber and general merchandise.
The accounting policies of the operating segments are the same as those described in the summary of significant account-ing policies except that the disaggregated financial information has been prepared using a management approach, in which management internally disaggregates financial information for the purpose of assisting in making internal operating decisions. Management evaluates segment performance based on several factors, of which the primary financial measure is net income (loss). In addition, management utilizes internally developed mechanisms for the purpose of internal operating decisions.
Intersegment transactions are priced with reference to prices applicable to transactions with unaffiliated parties.
The companies’ operating segment information at and for the years ended March 31, 2006, 2007 and 2008 was as follows:
Millions of Yen
Industrial Finance, Adjustments Business Logistics & Energy Living and(3) 2006 Innovation(1) Development(1) Business Metals Machinery Chemicals Essentials Total Other(2) Eliminations(5)(6) Consolidated
Revenue . . . . . . . . . . . . . . . . . . . . . . ¥ 75,850 ¥103,574 ¥1,528,113 ¥ 694,976 ¥ 630,301 ¥ 710,663 ¥1,078,541 ¥ 4,822,018 ¥ 5,056 ¥ (14,987) ¥ 4,812,087Gross profit . . . . . . . . . . . . . . . . . . . 34,683 32,850 93,876 303,830 168,054 76,977 336,216 1,046,486 5,125 1,379 1,052,990Equity in earnings of affiliated companies . . . . . . . . . . . . . . . . . . . 2,548 3,456 40,004 31,400 15,807 9,108 18,446 120,769 338 (2,096) 119,011Net income (loss) . . . . . . . . . . . . . . . 1,836 20,737 75,158 135,432 63,541 19,595 48,571 364,870 (9,567)(7) (2,017) 353,286Segment assets . . . . . . . . . . . . . . . . 182,580 870,873 1,501,723 2,665,403 2,107,267 707,681 1,943,991 9,979,518 1,078,465 (682,679) 10,375,304Investments in affiliated companies . . 17,330 37,196 388,943 97,944 158,177 75,549 256,613 1,031,752 7,139 2,921 1,041,812Depreciation and amortization . . . . . . 4,318 15,480 10,346 30,839 25,298 3,634 15,566 105,481 21,486 76 127,043Capital expenditures for long-lived assets . . . . . . . . . . . . . . . 2,063 41,600 13,980 65,640 44,850 4,009 18,641 190,783 13,744 189 204,716...........................................................................................................................................................................................................................................................................................................
Operating transactions(4): External customers . . . . . . . . . . . . ¥229,632 ¥186,397 ¥4,524,941 ¥4,155,763 ¥3,212,507 ¥1,940,335 ¥4,785,136 ¥19,034,711 ¥ 32,617 ¥ 1,853 ¥19,069,181 Intersegment . . . . . . . . . . . . . . . . . 19,376 24,834 8,449 3,855 2,115 4,758 5,334 68,721 3,197 (71,918)
Total . . . . . . . . . . . . . . . . . . . ¥249,008 ¥211,231 ¥4,533,390 ¥4,159,618 ¥3,214,622 ¥1,945,093 ¥4,790,470 ¥19,103,432 ¥ 35,814 ¥ (70,065) ¥19,069,181
Millions of Yen
Industrial Finance, Adjustments Business Logistics & Energy Living and(3) 2007 Innovation(1) Development(1) Business Metals Machinery Chemicals Essentials Total Other(2) Eliminations(5)(6) Consolidated
Revenue . . . . . . . . . . . . . . . . . . . . . . ¥ 70,976 ¥108,724 ¥1,246,837 ¥ 919,828 ¥ 702,123 ¥ 837,236 ¥1,191,536 ¥ 5,077,260 ¥ 9,547 ¥ (18,058) ¥ 5,068,749Gross profit . . . . . . . . . . . . . . . . . . . 36,258 44,264 80,907 365,719 176,530 86,252 348,655 1,138,585 9,523 (2,576) 1,145,532Equity in earnings of affiliated companies . . . . . . . . . . . . . . . . . . . 2,135 2,729 49,745 43,227 18,249 13,456 19,399 148,940 274 (2,359) 146,855Net income (loss) . . . . . . . . . . . . . . . 1,914 31,830 74,109 186,429 58,000 19,994 48,286 420,562 (5,050) 6 415,518Segment assets . . . . . . . . . . . . . . . . 153,247 710,285 1,556,896 3,199,298 2,276,943 831,606 2,153,026 10,881,301 1,269,665 (655,439) 11,495,527Investments in affiliated companies . . 21,490 43,585 511,654 114,555 183,470 87,152 297,863 1,259,769 3,051 3,347 1,266,167Depreciation and amortization . . . . . . 3,929 16,005 12,950 34,541 25,716 5,224 17,400 115,765 19,706 160 135,631Capital expenditures for long-lived assets . . . . . . . . . . . . . . . 2,391 9,698 19,106 54,886 28,863 4,828 19,490 139,262 9,973 1,299 150,534...........................................................................................................................................................................................................................................................................................................
Operating transactions(4): External customers . . . . . . . . . . . . ¥224,484 ¥183,482 ¥4,370,967 ¥5,228,948 ¥3,308,534 ¥2,196,880 ¥4,946,527 ¥20,459,822 ¥ 57,914 ¥ 8,834 ¥20,526,570 Intersegment . . . . . . . . . . . . . . . . . 18,702 28,199 6,243 6,718 1,534 5,642 6,721 73,759 2,233 (75,992)
Total . . . . . . . . . . . . . . . . . . . ¥243,186 ¥211,681 ¥4,377,210 ¥5,235,666 ¥3,310,068 ¥2,202,522 ¥4,953,248 ¥20,533,581 ¥ 60,147 ¥ (67,158) ¥20,526,570
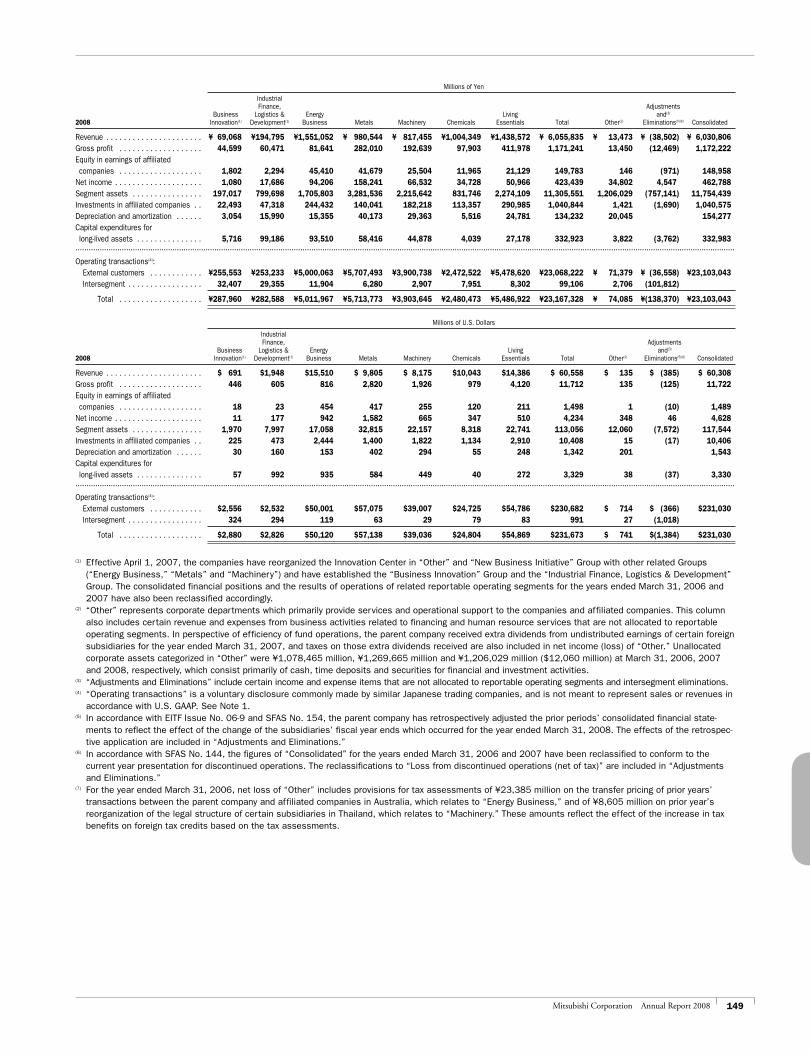
149Mitsubishi Corporation Annual Report 2008
Millions of Yen
Industrial Finance, Adjustments Business Logistics & Energy Living and(3) 2008 Innovation(1) Development(1) Business Metals Machinery Chemicals Essentials Total Other(2) Eliminations(5)(6) Consolidated
Revenue . . . . . . . . . . . . . . . . . . . . . . ¥ 69,068 ¥194,795 ¥1,551,052 ¥ 980,544 ¥ 817,455 ¥1,004,349 ¥1,438,572 ¥ 6,055,835 ¥ 13,473 ¥ (38,502) ¥ 6,030,806Gross profit . . . . . . . . . . . . . . . . . . . 44,599 60,471 81,641 282,010 192,639 97,903 411,978 1,171,241 13,450 (12,469) 1,172,222Equity in earnings of affiliated companies . . . . . . . . . . . . . . . . . . . 1,802 2,294 45,410 41,679 25,504 11,965 21,129 149,783 146 (971) 148,958Net income . . . . . . . . . . . . . . . . . . . . 1,080 17,686 94,206 158,241 66,532 34,728 50,966 423,439 34,802 4,547 462,788Segment assets . . . . . . . . . . . . . . . . 197,017 799,698 1,705,803 3,281,536 2,215,642 831,746 2,274,109 11,305,551 1,206,029 (757,141) 11,754,439Investments in affiliated companies . . 22,493 47,318 244,432 140,041 182,218 113,357 290,985 1,040,844 1,421 (1,690) 1,040,575Depreciation and amortization . . . . . . 3,054 15,990 15,355 40,173 29,363 5,516 24,781 134,232 20,045 154,277Capital expenditures for long-lived assets . . . . . . . . . . . . . . . 5,716 99,186 93,510 58,416 44,878 4,039 27,178 332,923 3,822 (3,762) 332,983...........................................................................................................................................................................................................................................................................................................
Operating transactions(4): External customers . . . . . . . . . . . . ¥255,553 ¥253,233 ¥5,000,063 ¥5,707,493 ¥3,900,738 ¥2,472,522 ¥5,478,620 ¥23,068,222 ¥ 71,379 ¥ (36,558) ¥23,103,043 Intersegment . . . . . . . . . . . . . . . . . 32,407 29,355 11,904 6,280 2,907 7,951 8,302 99,106 2,706 (101,812)
Total . . . . . . . . . . . . . . . . . . . ¥287,960 ¥282,588 ¥5,011,967 ¥5,713,773 ¥3,903,645 ¥2,480,473 ¥5,486,922 ¥23,167,328 ¥ 74,085 ¥(138,370) ¥23,103,043
Millions of U.S. Dollars
Industrial Finance, Adjustments Business Logistics & Energy Living and(3) 2008 Innovation(1) Development(1) Business Metals Machinery Chemicals Essentials Total Other(2) Eliminations(5)(6) Consolidated
Revenue . . . . . . . . . . . . . . . . . . . . . . $ 691 $1,948 $15,510 $ 9,805 $ 8,175 $10,043 $14,386 $ 60,558 $ 135 $ (385) $ 60,308Gross profit . . . . . . . . . . . . . . . . . . . 446 605 816 2,820 1,926 979 4,120 11,712 135 (125) 11,722Equity in earnings of affiliated companies . . . . . . . . . . . . . . . . . . . 18 23 454 417 255 120 211 1,498 1 (10) 1,489Net income . . . . . . . . . . . . . . . . . . . . 11 177 942 1,582 665 347 510 4,234 348 46 4,628Segment assets . . . . . . . . . . . . . . . . 1,970 7,997 17,058 32,815 22,157 8,318 22,741 113,056 12,060 (7,572) 117,544Investments in affiliated companies . . 225 473 2,444 1,400 1,822 1,134 2,910 10,408 15 (17) 10,406Depreciation and amortization . . . . . . 30 160 153 402 294 55 248 1,342 201 1,543 Capital expenditures for long-lived assets . . . . . . . . . . . . . . . 57 992 935 584 449 40 272 3,329 38 (37) 3,330...........................................................................................................................................................................................................................................................................................................
Operating transactions(4): External customers . . . . . . . . . . . . $2,556 $2,532 $50,001 $57,075 $39,007 $24,725 $54,786 $230,682 $ 714 $ (366) $231,030 Intersegment . . . . . . . . . . . . . . . . . 324 294 119 63 29 79 83 991 27 (1,018)
Total . . . . . . . . . . . . . . . . . . . $2,880 $2,826 $50,120 $57,138 $39,036 $24,804 $54,869 $231,673 $ 741 $(1,384) $231,030
(1) Effective April 1, 2007, the companies have reorganized the Innovation Center in “Other” and “New Business Initiative” Group with other related Groups (“Energy Business,” “Metals” and “Machinery”) and have established the “Business Innovation” Group and the “Industrial Finance, Logistics & Development” Group. The consolidated financial positions and the results of operations of related reportable operating segments for the years ended March 31, 2006 and 2007 have also been reclassified accordingly.
(2) “Other” represents corporate departments which primarily provide services and operational support to the companies and affiliated companies. This column also includes certain revenue and expenses from business activities related to financing and human resource services that are not allocated to reportable operating segments. In perspective of efficiency of fund operations, the parent company received extra dividends from undistributed earnings of certain foreign subsidiaries for the year ended March 31, 2007, and taxes on those extra dividends received are also included in net income (loss) of “Other.” Unallocated corporate assets categorized in “Other” were ¥1,078,465 million, ¥1,269,665 million and ¥1,206,029 million ($12,060 million) at March 31, 2006, 2007 and 2008, respectively, which consist primarily of cash, time deposits and securities for financial and investment activities.
(3) “Adjustments and Eliminations” include certain income and expense items that are not allocated to reportable operating segments and intersegment eliminations.(4) “Operating transactions” is a voluntary disclosure commonly made by similar Japanese trading companies, and is not meant to represent sales or revenues in
accordance with U.S. GAAP. See Note 1.(5) In accordance with EITF Issue No. 06-9 and SFAS No. 154, the parent company has retrospectively adjusted the prior periods’ consolidated financial state-
ments to reflect the effect of the change of the subsidiaries’ fiscal year ends which occurred for the year ended March 31, 2008. The effects of the retrospec-tive application are included in “Adjustments and Eliminations.”
(6) In accordance with SFAS No. 144, the figures of “Consolidated” for the years ended March 31, 2006 and 2007 have been reclassified to conform to the current year presentation for discontinued operations. The reclassifications to “Loss from discontinued operations (net of tax)” are included in “Adjustments and Eliminations.”
(7) For the year ended March 31, 2006, net loss of “Other” includes provisions for tax assessments of ¥23,385 million on the transfer pricing of prior years’ transactions between the parent company and affiliated companies in Australia, which relates to “Energy Business,” and of ¥8,605 million on prior year’s reorganization of the legal structure of certain subsidiaries in Thailand, which relates to “Machinery.” These amounts reflect the effect of the increase in tax benefits on foreign tax credits based on the tax assessments.
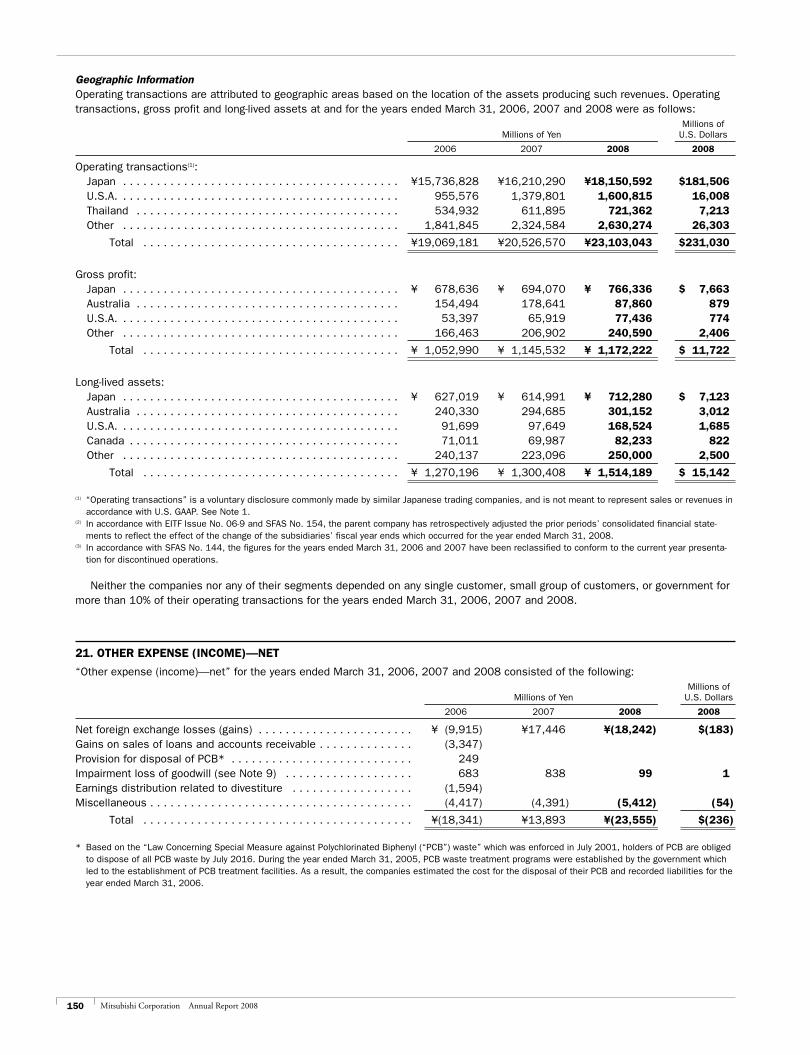
150 Mitsubishi Corporation Annual Report 2008
Geographic InformationOperating transactions are attributed to geographic areas based on the location of the assets producing such revenues. Operating transactions, gross profit and long-lived assets at and for the years ended March 31, 2006, 2007 and 2008 were as follows: Millions of Millions of Yen U.S. Dollars
2006 2007 2008 2008
Operating transactions(1): Japan . . . . . . . . . . . . . . . . . . . . . . . . . . . . . . . . . . . . . . . . . ¥15,736,828 ¥16,210,290 ¥18,150,592 $181,506 U.S.A. . . . . . . . . . . . . . . . . . . . . . . . . . . . . . . . . . . . . . . . . . 955,576 1,379,801 1,600,815 16,008 Thailand . . . . . . . . . . . . . . . . . . . . . . . . . . . . . . . . . . . . . . . 534,932 611,895 721,362 7,213 Other . . . . . . . . . . . . . . . . . . . . . . . . . . . . . . . . . . . . . . . . . 1,841,845 2,324,584 2,630,274 26,303
Total . . . . . . . . . . . . . . . . . . . . . . . . . . . . . . . . . . . . . . ¥19,069,181 ¥20,526,570 ¥23,103,043 $231,030
Gross profit: Japan . . . . . . . . . . . . . . . . . . . . . . . . . . . . . . . . . . . . . . . . . ¥ 678,636 ¥ 694,070 ¥ 766,336 $ 7,663 Australia . . . . . . . . . . . . . . . . . . . . . . . . . . . . . . . . . . . . . . . 154,494 178,641 87,860 879 U.S.A. . . . . . . . . . . . . . . . . . . . . . . . . . . . . . . . . . . . . . . . . . 53,397 65,919 77,436 774 Other . . . . . . . . . . . . . . . . . . . . . . . . . . . . . . . . . . . . . . . . . 166,463 206,902 240,590 2,406
Total . . . . . . . . . . . . . . . . . . . . . . . . . . . . . . . . . . . . . . ¥ 1,052,990 ¥ 1,145,532 ¥ 1,172,222 $ 11,722
Long-lived assets: Japan . . . . . . . . . . . . . . . . . . . . . . . . . . . . . . . . . . . . . . . . . ¥ 627,019 ¥ 614,991 ¥ 712,280 $ 7,123 Australia . . . . . . . . . . . . . . . . . . . . . . . . . . . . . . . . . . . . . . . 240,330 294,685 301,152 3,012 U.S.A. . . . . . . . . . . . . . . . . . . . . . . . . . . . . . . . . . . . . . . . . . 91,699 97,649 168,524 1,685 Canada . . . . . . . . . . . . . . . . . . . . . . . . . . . . . . . . . . . . . . . . 71,011 69,987 82,233 822 Other . . . . . . . . . . . . . . . . . . . . . . . . . . . . . . . . . . . . . . . . . 240,137 223,096 250,000 2,500
Total . . . . . . . . . . . . . . . . . . . . . . . . . . . . . . . . . . . . . . ¥ 1,270,196 ¥ 1,300,408 ¥ 1,514,189 $ 15,142
(1) “Operating transactions” is a voluntary disclosure commonly made by similar Japanese trading companies, and is not meant to represent sales or revenues in accordance with U.S. GAAP. See Note 1.
(2) In accordance with EITF Issue No. 06-9 and SFAS No. 154, the parent company has retrospectively adjusted the prior periods’ consolidated financial state-ments to reflect the effect of the change of the subsidiaries’ fiscal year ends which occurred for the year ended March 31, 2008.
(3) In accordance with SFAS No. 144, the figures for the years ended March 31, 2006 and 2007 have been reclassified to conform to the current year presenta-tion for discontinued operations.
Neither the companies nor any of their segments depended on any single customer, small group of customers, or government for more than 10% of their operating transactions for the years ended March 31, 2006, 2007 and 2008.
21. OTHER EXPENSE (INCOME)—NET
“Other expense (income)—net” for the years ended March 31, 2006, 2007 and 2008 consisted of the following: Millions of Millions of Yen U.S. Dollars
2006 2007 2008 2008
Net foreign exchange losses (gains) . . . . . . . . . . . . . . . . . . . . . . . ¥ (9,915) ¥17,446 ¥(18,242) $(183)Gains on sales of loans and accounts receivable . . . . . . . . . . . . . . (3,347)Provision for disposal of PCB* . . . . . . . . . . . . . . . . . . . . . . . . . . . 249Impairment loss of goodwill (see Note 9) . . . . . . . . . . . . . . . . . . . 683 838 99 1Earnings distribution related to divestiture . . . . . . . . . . . . . . . . . . (1,594) Miscellaneous . . . . . . . . . . . . . . . . . . . . . . . . . . . . . . . . . . . . . . . (4,417) (4,391) (5,412) (54)
Total . . . . . . . . . . . . . . . . . . . . . . . . . . . . . . . . . . . . . . . . ¥(18,341) ¥13,893 ¥(23,555) $(236)
* Based on the “Law Concerning Special Measure against Polychlorinated Biphenyl (“PCB”) waste” which was enforced in July 2001, holders of PCB are obliged to dispose of all PCB waste by July 2016. During the year ended March 31, 2005, PCB waste treatment programs were established by the government which led to the establishment of PCB treatment facilities. As a result, the companies estimated the cost for the disposal of their PCB and recorded liabilities for the year ended March 31, 2006.
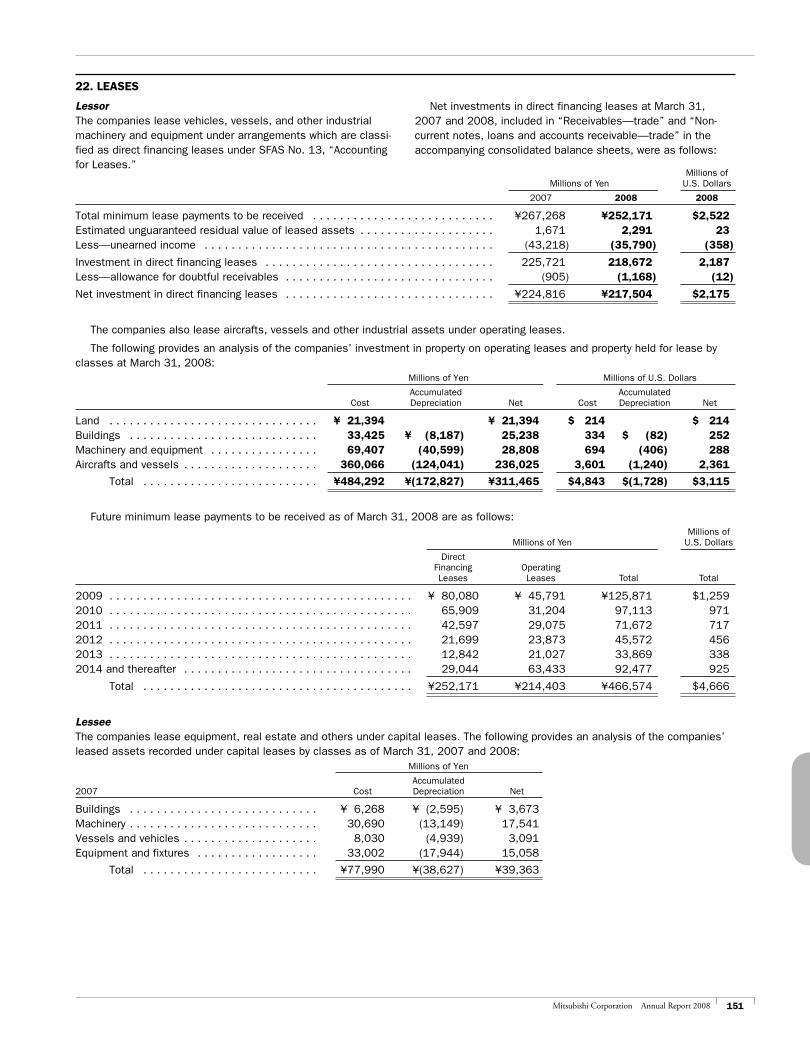
151Mitsubishi Corporation Annual Report 2008
22. LEASES
LessorThe companies lease vehicles, vessels, and other industrial machinery and equipment under arrangements which are classi-fied as direct financing leases under SFAS No. 13, “Accounting for Leases.”
Net investments in direct financing leases at March 31, 2007 and 2008, included in “Receivables—trade” and “Non-current notes, loans and accounts receivable—trade” in the accompanying consolidated balance sheets, were as follows:
Millions of Millions of Yen U.S. Dollars
2007 2008 2008
Total minimum lease payments to be received . . . . . . . . . . . . . . . . . . . . . . . . . . . ¥267,268 ¥252,171 $2,522 Estimated unguaranteed residual value of leased assets . . . . . . . . . . . . . . . . . . . . 1,671 2,291 23Less—unearned income . . . . . . . . . . . . . . . . . . . . . . . . . . . . . . . . . . . . . . . . . . . (43,218) (35,790) (358)
Investment in direct financing leases . . . . . . . . . . . . . . . . . . . . . . . . . . . . . . . . . . 225,721 218,672 2,187Less—allowance for doubtful receivables . . . . . . . . . . . . . . . . . . . . . . . . . . . . . . . (905) (1,168) (12)
Net investment in direct financing leases . . . . . . . . . . . . . . . . . . . . . . . . . . . . . . . ¥224,816 ¥217,504 $2,175
The companies also lease aircrafts, vessels and other industrial assets under operating leases.
The following provides an analysis of the companies’ investment in property on operating leases and property held for lease by classes at March 31, 2008: Millions of Yen Millions of U.S. Dollars
Accumulated Accumulated Cost Depreciation Net Cost Depreciation Net
Land . . . . . . . . . . . . . . . . . . . . . . . . . . . . . . . ¥ 21,394 ¥ 21,394 $ 214 $ 214Buildings . . . . . . . . . . . . . . . . . . . . . . . . . . . . 33,425 ¥ (8,187) 25,238 334 $ (82) 252Machinery and equipment . . . . . . . . . . . . . . . . 69,407 (40,599) 28,808 694 (406) 288Aircrafts and vessels . . . . . . . . . . . . . . . . . . . . 360,066 (124,041) 236,025 3,601 (1,240) 2,361
Total . . . . . . . . . . . . . . . . . . . . . . . . . . ¥484,292 ¥(172,827) ¥311,465 $4,843 $(1,728) $3,115
Future minimum lease payments to be received as of March 31, 2008 are as follows: Millions of Millions of Yen U.S. Dollars
Direct Financing Operating Leases Leases Total Total
2009 . . . . . . . . . . . . . . . . . . . . . . . . . . . . . . . . . . . . . . . . . . . . . ¥ 80,080 ¥ 45,791 ¥125,871 $1,2592010 . . . . . . . . . . . . . . . . . . . . . . . . . . . . . . . . . . . . . . . . . . . . . 65,909 31,204 97,113 9712011 . . . . . . . . . . . . . . . . . . . . . . . . . . . . . . . . . . . . . . . . . . . . . 42,597 29,075 71,672 7172012 . . . . . . . . . . . . . . . . . . . . . . . . . . . . . . . . . . . . . . . . . . . . . 21,699 23,873 45,572 4562013 . . . . . . . . . . . . . . . . . . . . . . . . . . . . . . . . . . . . . . . . . . . . . 12,842 21,027 33,869 3382014 and thereafter . . . . . . . . . . . . . . . . . . . . . . . . . . . . . . . . . . 29,044 63,433 92,477 925
Total . . . . . . . . . . . . . . . . . . . . . . . . . . . . . . . . . . . . . . . . ¥252,171 ¥214,403 ¥466,574 $4,666
LesseeThe companies lease equipment, real estate and others under capital leases. The following provides an analysis of the companies’ leased assets recorded under capital leases by classes as of March 31, 2007 and 2008: Millions of Yen
Accumulated 2007 Cost Depreciation Net
Buildings . . . . . . . . . . . . . . . . . . . . . . . . . . . . ¥ 6,268 ¥ (2,595) ¥ 3,673Machinery . . . . . . . . . . . . . . . . . . . . . . . . . . . . 30,690 (13,149) 17,541Vessels and vehicles . . . . . . . . . . . . . . . . . . . . 8,030 (4,939) 3,091Equipment and fixtures . . . . . . . . . . . . . . . . . . 33,002 (17,944) 15,058
Total . . . . . . . . . . . . . . . . . . . . . . . . . . ¥77,990 ¥(38,627) ¥39,363
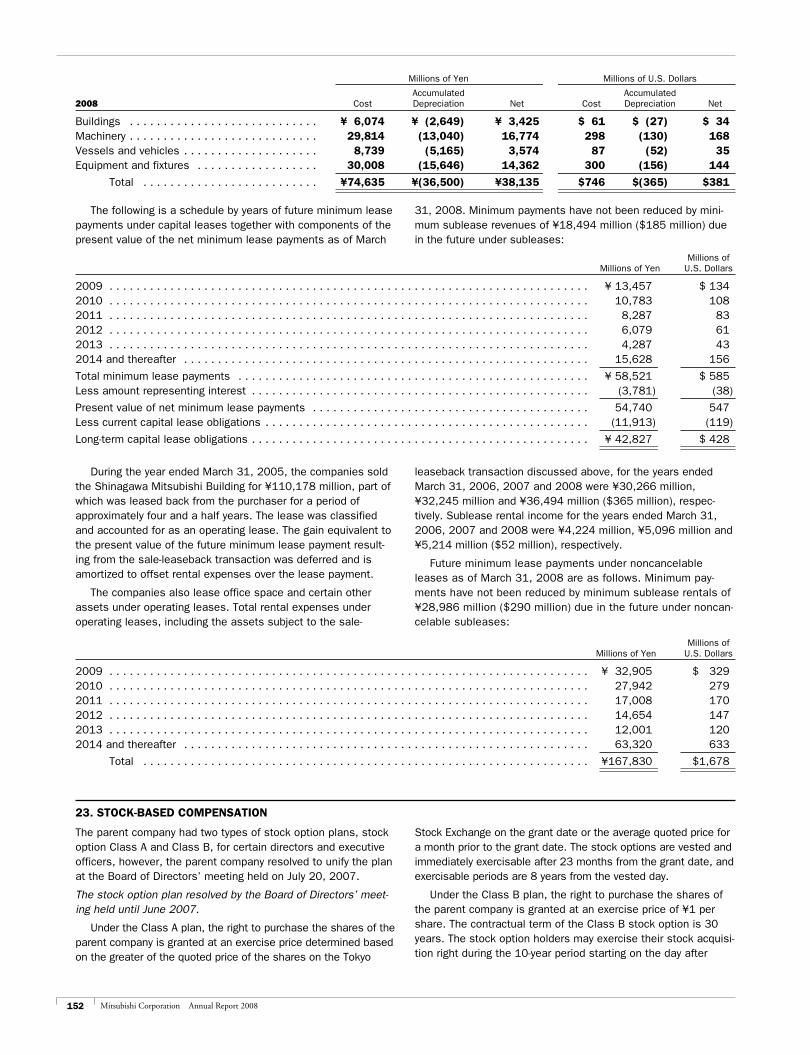
152 Mitsubishi Corporation Annual Report 2008
Millions of Yen Millions of U.S. Dollars
Accumulated Accumulated 2008 Cost Depreciation Net Cost Depreciation Net
Buildings . . . . . . . . . . . . . . . . . . . . . . . . . . . . ¥ 6,074 ¥ (2,649) ¥ 3,425 $ 61 $ (27) $ 34Machinery . . . . . . . . . . . . . . . . . . . . . . . . . . . . 29,814 (13,040) 16,774 298 (130) 168Vessels and vehicles . . . . . . . . . . . . . . . . . . . . 8,739 (5,165) 3,574 87 (52) 35Equipment and fixtures . . . . . . . . . . . . . . . . . . 30,008 (15,646) 14,362 300 (156) 144
Total . . . . . . . . . . . . . . . . . . . . . . . . . . ¥74,635 ¥(36,500) ¥38,135 $746 $(365) $381
The following is a schedule by years of future minimum lease payments under capital leases together with components of the present value of the net minimum lease payments as of March
31, 2008. Minimum payments have not been reduced by mini-mum sublease revenues of ¥18,494 million ($185 million) due in the future under subleases:
Millions of Millions of Yen U.S. Dollars
2009 . . . . . . . . . . . . . . . . . . . . . . . . . . . . . . . . . . . . . . . . . . . . . . . . . . . . . . . . . . . . . . . . . . . . . . . ¥ 13,457 $ 1342010 . . . . . . . . . . . . . . . . . . . . . . . . . . . . . . . . . . . . . . . . . . . . . . . . . . . . . . . . . . . . . . . . . . . . . . . 10,783 1082011 . . . . . . . . . . . . . . . . . . . . . . . . . . . . . . . . . . . . . . . . . . . . . . . . . . . . . . . . . . . . . . . . . . . . . . . 8,287 832012 . . . . . . . . . . . . . . . . . . . . . . . . . . . . . . . . . . . . . . . . . . . . . . . . . . . . . . . . . . . . . . . . . . . . . . . 6,079 612013 . . . . . . . . . . . . . . . . . . . . . . . . . . . . . . . . . . . . . . . . . . . . . . . . . . . . . . . . . . . . . . . . . . . . . . . 4,287 432014 and thereafter . . . . . . . . . . . . . . . . . . . . . . . . . . . . . . . . . . . . . . . . . . . . . . . . . . . . . . . . . . . . 15,628 156
Total minimum lease payments . . . . . . . . . . . . . . . . . . . . . . . . . . . . . . . . . . . . . . . . . . . . . . . . . . . . ¥ 58,521 $ 585Less amount representing interest . . . . . . . . . . . . . . . . . . . . . . . . . . . . . . . . . . . . . . . . . . . . . . . . . . (3,781) (38)
Present value of net minimum lease payments . . . . . . . . . . . . . . . . . . . . . . . . . . . . . . . . . . . . . . . . . 54,740 547Less current capital lease obligations . . . . . . . . . . . . . . . . . . . . . . . . . . . . . . . . . . . . . . . . . . . . . . . . (11,913) (119)
Long-term capital lease obligations . . . . . . . . . . . . . . . . . . . . . . . . . . . . . . . . . . . . . . . . . . . . . . . . . . ¥ 42,827 $ 428
During the year ended March 31, 2005, the companies sold the Shinagawa Mitsubishi Building for ¥110,178 million, part of which was leased back from the purchaser for a period of approximately four and a half years. The lease was classified and accounted for as an operating lease. The gain equivalent to the present value of the future minimum lease payment result-ing from the sale-leaseback transaction was deferred and is amortized to offset rental expenses over the lease payment.
The companies also lease office space and certain other assets under operating leases. Total rental expenses under operating leases, including the assets subject to the sale-
leaseback transaction discussed above, for the years ended March 31, 2006, 2007 and 2008 were ¥30,266 million, ¥32,245 million and ¥36,494 million ($365 million), respec-tively. Sublease rental income for the years ended March 31, 2006, 2007 and 2008 were ¥4,224 million, ¥5,096 million and ¥5,214 million ($52 million), respectively.
Future minimum lease payments under noncancelable leases as of March 31, 2008 are as follows. Minimum pay-ments have not been reduced by minimum sublease rentals of ¥28,986 million ($290 million) due in the future under noncan-celable subleases:
Millions of Millions of Yen U.S. Dollars
2009 . . . . . . . . . . . . . . . . . . . . . . . . . . . . . . . . . . . . . . . . . . . . . . . . . . . . . . . . . . . . . . . . . . . . . . . ¥ 32,905 $ 3292010 . . . . . . . . . . . . . . . . . . . . . . . . . . . . . . . . . . . . . . . . . . . . . . . . . . . . . . . . . . . . . . . . . . . . . . . 27,942 2792011 . . . . . . . . . . . . . . . . . . . . . . . . . . . . . . . . . . . . . . . . . . . . . . . . . . . . . . . . . . . . . . . . . . . . . . . 17,008 1702012 . . . . . . . . . . . . . . . . . . . . . . . . . . . . . . . . . . . . . . . . . . . . . . . . . . . . . . . . . . . . . . . . . . . . . . . 14,654 1472013 . . . . . . . . . . . . . . . . . . . . . . . . . . . . . . . . . . . . . . . . . . . . . . . . . . . . . . . . . . . . . . . . . . . . . . . 12,001 1202014 and thereafter . . . . . . . . . . . . . . . . . . . . . . . . . . . . . . . . . . . . . . . . . . . . . . . . . . . . . . . . . . . . 63,320 633
Total . . . . . . . . . . . . . . . . . . . . . . . . . . . . . . . . . . . . . . . . . . . . . . . . . . . . . . . . . . . . . . . . . . ¥167,830 $1,678
23. STOCK-BASED COMPENSATION
The parent company had two types of stock option plans, stock option Class A and Class B, for certain directors and executive officers, however, the parent company resolved to unify the plan at the Board of Directors’ meeting held on July 20, 2007.
The stock option plan resolved by the Board of Directors’ meet-ing held until June 2007.
Under the Class A plan, the right to purchase the shares of the parent company is granted at an exercise price determined based on the greater of the quoted price of the shares on the Tokyo
Stock Exchange on the grant date or the average quoted price for a month prior to the grant date. The stock options are vested and immediately exercisable after 23 months from the grant date, and exercisable periods are 8 years from the vested day.
Under the Class B plan, the right to purchase the shares of the parent company is granted at an exercise price of ¥1 per share. The contractual term of the Class B stock option is 30 years. The stock option holders may exercise their stock acquisi-tion right during the 10-year period starting on the day after
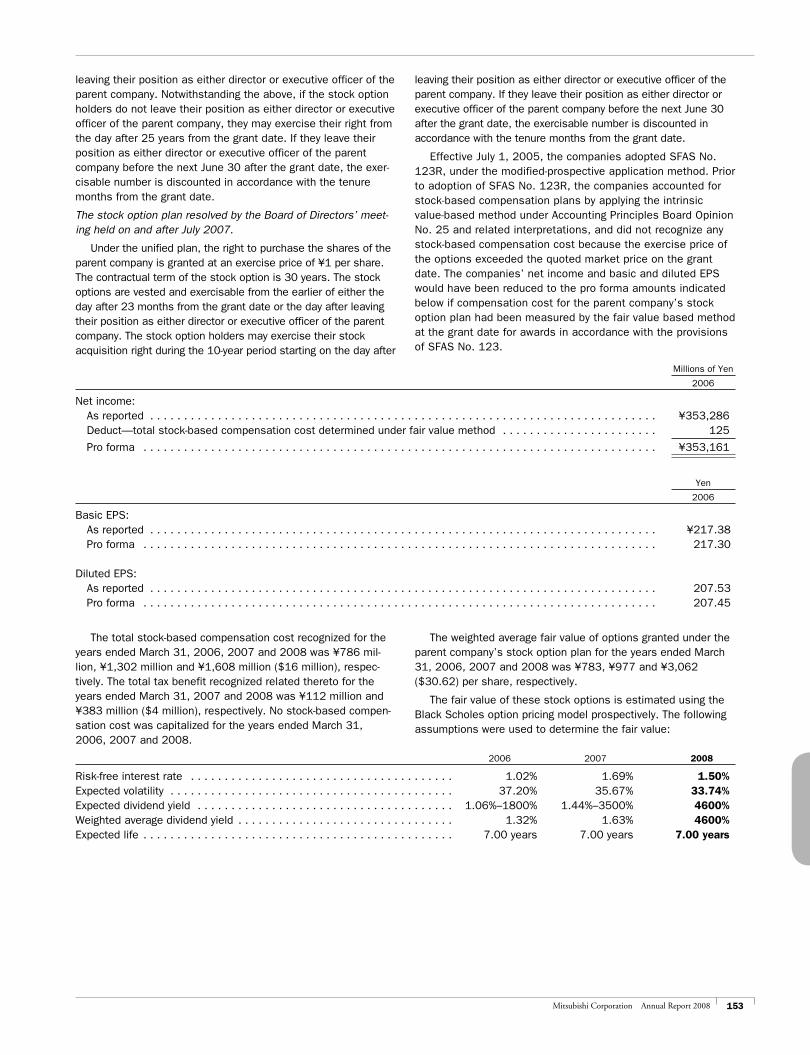
153Mitsubishi Corporation Annual Report 2008
leaving their position as either director or executive officer of the parent company. Notwithstanding the above, if the stock option holders do not leave their position as either director or executive officer of the parent company, they may exercise their right from the day after 25 years from the grant date. If they leave their position as either director or executive officer of the parent company before the next June 30 after the grant date, the exer-cisable number is discounted in accordance with the tenure months from the grant date.
The stock option plan resolved by the Board of Directors’ meet-ing held on and after July 2007.
Under the unified plan, the right to purchase the shares of the parent company is granted at an exercise price of ¥1 per share. The contractual term of the stock option is 30 years. The stock options are vested and exercisable from the earlier of either the day after 23 months from the grant date or the day after leaving their position as either director or executive officer of the parent company. The stock option holders may exercise their stock acquisition right during the 10-year period starting on the day after
leaving their position as either director or executive officer of the parent company. If they leave their position as either director or executive officer of the parent company before the next June 30 after the grant date, the exercisable number is discounted in accordance with the tenure months from the grant date.
Effective July 1, 2005, the companies adopted SFAS No. 123R, under the modified-prospective application method. Prior to adoption of SFAS No. 123R, the companies accounted for stock-based compensation plans by applying the intrinsic value-based method under Accounting Principles Board Opinion No. 25 and related interpretations, and did not recognize any stock-based compensation cost because the exercise price of the options exceeded the quoted market price on the grant date. The companies’ net income and basic and diluted EPS would have been reduced to the pro forma amounts indicated below if compensation cost for the parent company’s stock option plan had been measured by the fair value based method at the grant date for awards in accordance with the provisions of SFAS No. 123.
Millions of Yen
2006
Net income: As reported . . . . . . . . . . . . . . . . . . . . . . . . . . . . . . . . . . . . . . . . . . . . . . . . . . . . . . . . . . . . . . . . . . . . . . . . . . . ¥353,286 Deduct—total stock-based compensation cost determined under fair value method . . . . . . . . . . . . . . . . . . . . . . . 125
Pro forma . . . . . . . . . . . . . . . . . . . . . . . . . . . . . . . . . . . . . . . . . . . . . . . . . . . . . . . . . . . . . . . . . . . . . . . . . . . . ¥353,161
Yen
2006
Basic EPS: As reported . . . . . . . . . . . . . . . . . . . . . . . . . . . . . . . . . . . . . . . . . . . . . . . . . . . . . . . . . . . . . . . . . . . . . . . . . . . ¥217.38 Pro forma . . . . . . . . . . . . . . . . . . . . . . . . . . . . . . . . . . . . . . . . . . . . . . . . . . . . . . . . . . . . . . . . . . . . . . . . . . . . 217.30
Diluted EPS: As reported . . . . . . . . . . . . . . . . . . . . . . . . . . . . . . . . . . . . . . . . . . . . . . . . . . . . . . . . . . . . . . . . . . . . . . . . . . . 207.53 Pro forma . . . . . . . . . . . . . . . . . . . . . . . . . . . . . . . . . . . . . . . . . . . . . . . . . . . . . . . . . . . . . . . . . . . . . . . . . . . . 207.45
The total stock-based compensation cost recognized for the years ended March 31, 2006, 2007 and 2008 was ¥786 mil-lion, ¥1,302 million and ¥1,608 million ($16 million), respec-tively. The total tax benefit recognized related thereto for the years ended March 31, 2007 and 2008 was ¥112 million and ¥383 million ($4 million), respectively. No stock-based compen-sation cost was capitalized for the years ended March 31, 2006, 2007 and 2008.
The weighted average fair value of options granted under the parent company’s stock option plan for the years ended March 31, 2006, 2007 and 2008 was ¥783, ¥977 and ¥3,062 ($30.62) per share, respectively.
The fair value of these stock options is estimated using the Black Scholes option pricing model prospectively. The following assumptions were used to determine the fair value:
2006 2007 2008
Risk-free interest rate . . . . . . . . . . . . . . . . . . . . . . . . . . . . . . . . . . . . . . . 1.02% 1.69% 1.50%Expected volatility . . . . . . . . . . . . . . . . . . . . . . . . . . . . . . . . . . . . . . . . . . 37.20% 35.67% 33.74%Expected dividend yield . . . . . . . . . . . . . . . . . . . . . . . . . . . . . . . . . . . . . . 1.06%–1800% 1.44%–3500% 4600%Weighted average dividend yield . . . . . . . . . . . . . . . . . . . . . . . . . . . . . . . . 1.32% 1.63% 4600%Expected life . . . . . . . . . . . . . . . . . . . . . . . . . . . . . . . . . . . . . . . . . . . . . . 7.00 years 7.00 years 7.00 years
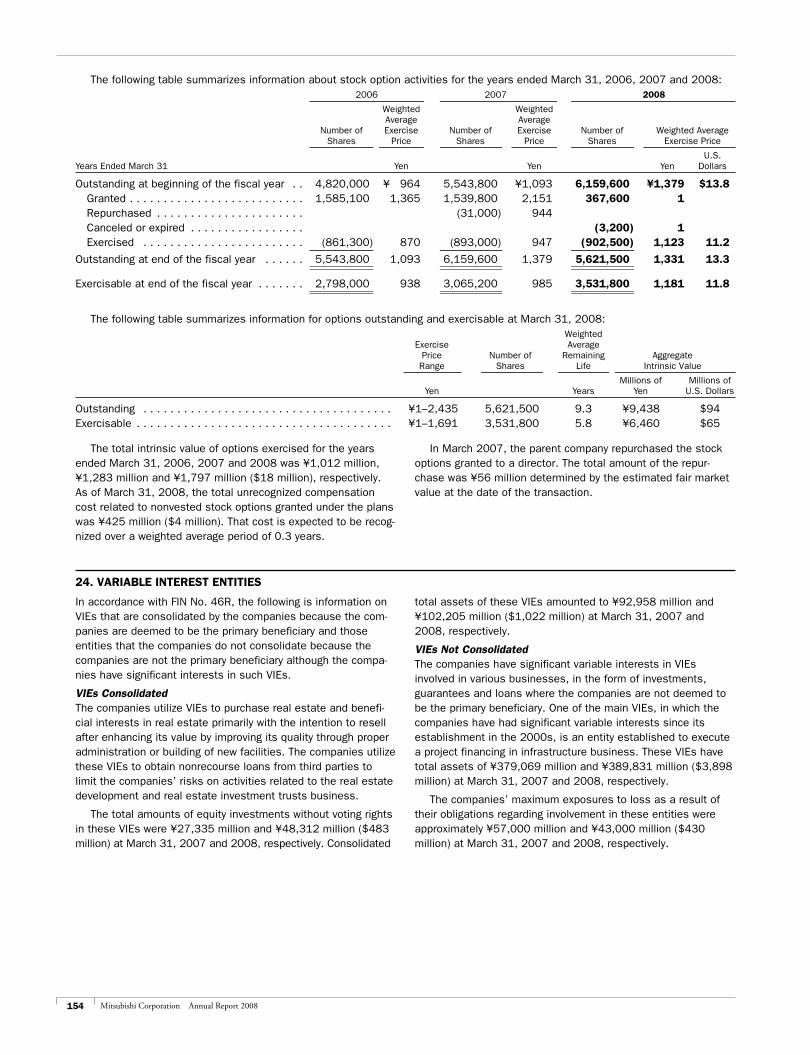
154 Mitsubishi Corporation Annual Report 2008
The following table summarizes information about stock option activities for the years ended March 31, 2006, 2007 and 2008: 2006 2007 2008
Weighted Weighted Average Average Number of Exercise Number of Exercise Number of Weighted Average Shares Price Shares Price Shares Exercise Price
U.S. Years Ended March 31 Yen Yen Yen Dollars
Outstanding at beginning of the fiscal year . . 4,820,000 ¥ 964 5,543,800 ¥1,093 6,159,600 ¥1,379 $13.8 Granted . . . . . . . . . . . . . . . . . . . . . . . . . . 1,585,100 1,365 1,539,800 2,151 367,600 1 Repurchased . . . . . . . . . . . . . . . . . . . . . . (31,000) 944 Canceled or expired . . . . . . . . . . . . . . . . . (3,200) 1 Exercised . . . . . . . . . . . . . . . . . . . . . . . . (861,300) 870 (893,000) 947 (902,500) 1,123 11.2
Outstanding at end of the fiscal year . . . . . . 5,543,800 1,093 6,159,600 1,379 5,621,500 1,331 13.3
Exercisable at end of the fiscal year . . . . . . . 2,798,000 938 3,065,200 985 3,531,800 1,181 11.8
The following table summarizes information for options outstanding and exercisable at March 31, 2008: Weighted Exercise Average Price Number of Remaining Aggregate Range Shares Life Intrinsic Value
Millions of Millions of Yen Years Yen U.S. Dollars
Outstanding . . . . . . . . . . . . . . . . . . . . . . . . . . . . . . . . . . . . . ¥1–2,435 5,621,500 9.3 ¥9,438 $94Exercisable . . . . . . . . . . . . . . . . . . . . . . . . . . . . . . . . . . . . . . ¥1–1,691 3,531,800 5.8 ¥6,460 $65
The total intrinsic value of options exercised for the years ended March 31, 2006, 2007 and 2008 was ¥1,012 million, ¥1,283 million and ¥1,797 million ($18 million), respectively. As of March 31, 2008, the total unrecognized compensation cost related to nonvested stock options granted under the plans was ¥425 million ($4 million). That cost is expected to be recog-nized over a weighted average period of 0.3 years.
In March 2007, the parent company repurchased the stock options granted to a director. The total amount of the repur-chase was ¥56 million determined by the estimated fair market value at the date of the transaction.
24. VARIABLE INTEREST ENTITIES
In accordance with FIN No. 46R, the following is information on VIEs that are consolidated by the companies because the com-panies are deemed to be the primary beneficiary and those entities that the companies do not consolidate because the companies are not the primary beneficiary although the compa-nies have significant interests in such VIEs.
VIEs ConsolidatedThe companies utilize VIEs to purchase real estate and benefi-cial interests in real estate primarily with the intention to resell after enhancing its value by improving its quality through proper administration or building of new facilities. The companies utilize these VIEs to obtain nonrecourse loans from third parties to limit the companies’ risks on activities related to the real estate development and real estate investment trusts business.
The total amounts of equity investments without voting rights in these VIEs were ¥27,335 million and ¥48,312 million ($483 million) at March 31, 2007 and 2008, respectively. Consolidated
total assets of these VIEs amounted to ¥92,958 million and ¥102,205 million ($1,022 million) at March 31, 2007 and 2008, respectively.
VIEs Not ConsolidatedThe companies have significant variable interests in VIEs involved in various businesses, in the form of investments, guarantees and loans where the companies are not deemed to be the primary beneficiary. One of the main VIEs, in which the companies have had significant variable interests since its establishment in the 2000s, is an entity established to execute a project financing in infrastructure business. These VIEs have total assets of ¥379,069 million and ¥389,831 million ($3,898 million) at March 31, 2007 and 2008, respectively.
The companies’ maximum exposures to loss as a result of their obligations regarding involvement in these entities were approximately ¥57,000 million and ¥43,000 million ($430 million) at March 31, 2007 and 2008, respectively.
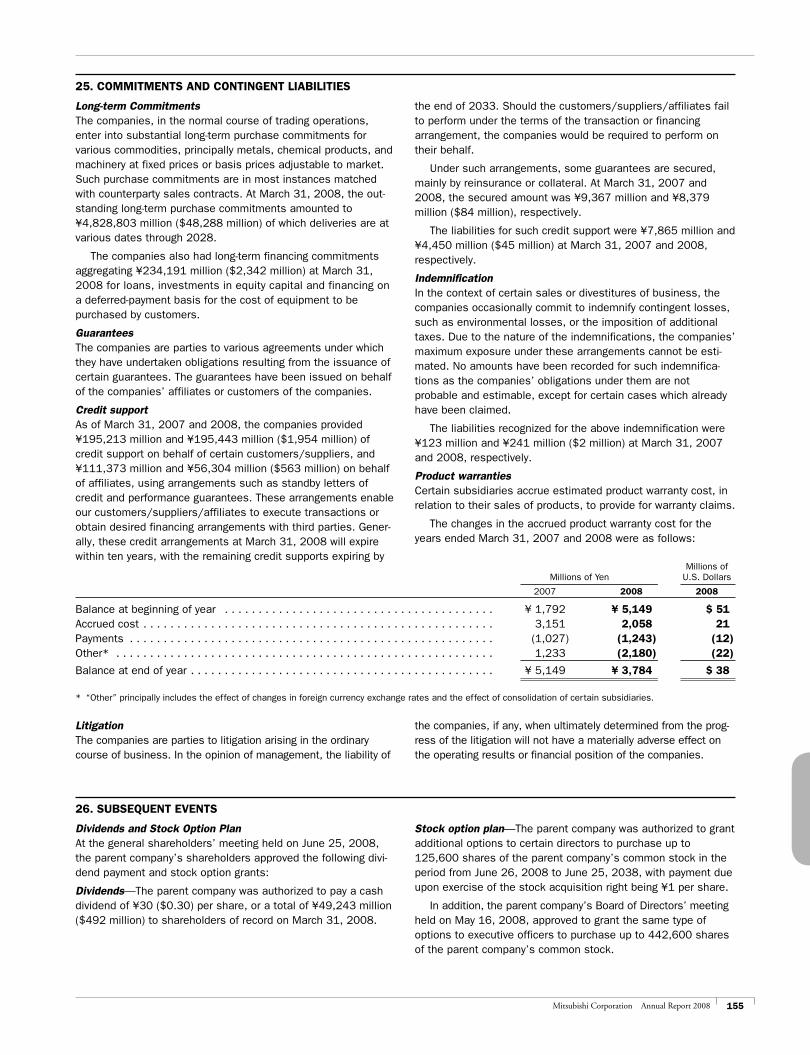
155Mitsubishi Corporation Annual Report 2008
25. COMMITMENTS AND CONTINGENT LIABILITIES
Long-term CommitmentsThe companies, in the normal course of trading operations, enter into substantial long-term purchase commitments for various commodities, principally metals, chemical products, and machinery at fixed prices or basis prices adjustable to market. Such purchase commitments are in most instances matched with counterparty sales contracts. At March 31, 2008, the out-standing long-term purchase commitments amounted to ¥4,828,803 million ($48,288 million) of which deliveries are at various dates through 2028.
The companies also had long-term financing commitments aggregating ¥234,191 million ($2,342 million) at March 31, 2008 for loans, investments in equity capital and financing on a deferred-payment basis for the cost of equipment to be purchased by customers.
GuaranteesThe companies are parties to various agreements under which they have undertaken obligations resulting from the issuance of certain guarantees. The guarantees have been issued on behalf of the companies’ affiliates or customers of the companies.
Credit supportAs of March 31, 2007 and 2008, the companies provided ¥195,213 million and ¥195,443 million ($1,954 million) of credit support on behalf of certain customers/suppliers, and ¥111,373 million and ¥56,304 million ($563 million) on behalf of affiliates, using arrangements such as standby letters of credit and performance guarantees. These arrangements enable our customers/suppliers/affiliates to execute transactions or obtain desired financing arrangements with third parties. Gener-ally, these credit arrangements at March 31, 2008 will expire within ten years, with the remaining credit supports expiring by
the end of 2033. Should the customers/suppliers/affiliates fail to perform under the terms of the transaction or financing arrangement, the companies would be required to perform on their behalf.
Under such arrangements, some guarantees are secured, mainly by reinsurance or collateral. At March 31, 2007 and 2008, the secured amount was ¥9,367 million and ¥8,379 million ($84 million), respectively.
The liabilities for such credit support were ¥7,865 million and ¥4,450 million ($45 million) at March 31, 2007 and 2008, respectively.
IndemnificationIn the context of certain sales or divestitures of business, the companies occasionally commit to indemnify contingent losses, such as environmental losses, or the imposition of additional taxes. Due to the nature of the indemnifications, the companies’ maximum exposure under these arrangements cannot be esti-mated. No amounts have been recorded for such indemnifica-tions as the companies’ obligations under them are not probable and estimable, except for certain cases which already have been claimed.
The liabilities recognized for the above indemnification were ¥123 million and ¥241 million ($2 million) at March 31, 2007 and 2008, respectively.
Product warrantiesCertain subsidiaries accrue estimated product warranty cost, in relation to their sales of products, to provide for warranty claims.
The changes in the accrued product warranty cost for the years ended March 31, 2007 and 2008 were as follows:
Millions of Millions of Yen U.S. Dollars
2007 2008 2008
Balance at beginning of year . . . . . . . . . . . . . . . . . . . . . . . . . . . . . . . . . . . . . . . . ¥ 1,792 ¥ 5,149 $ 51Accrued cost . . . . . . . . . . . . . . . . . . . . . . . . . . . . . . . . . . . . . . . . . . . . . . . . . . . . 3,151 2,058 21Payments . . . . . . . . . . . . . . . . . . . . . . . . . . . . . . . . . . . . . . . . . . . . . . . . . . . . . . (1,027) (1,243) (12)Other* . . . . . . . . . . . . . . . . . . . . . . . . . . . . . . . . . . . . . . . . . . . . . . . . . . . . . . . . 1,233 (2,180) (22)
Balance at end of year . . . . . . . . . . . . . . . . . . . . . . . . . . . . . . . . . . . . . . . . . . . . . ¥ 5,149 ¥ 3,784 $ 38
* “Other” principally includes the effect of changes in foreign currency exchange rates and the effect of consolidation of certain subsidiaries.
Litigation The companies are parties to litigation arising in the ordinary course of business. In the opinion of management, the liability of
the companies, if any, when ultimately determined from the prog-ress of the litigation will not have a materially adverse effect on the operating results or financial position of the companies.
26. SUBSEQUENT EVENTS
Dividends and Stock Option PlanAt the general shareholders’ meeting held on June 25, 2008, the parent company’s shareholders approved the following divi-dend payment and stock option grants:
Dividends—The parent company was authorized to pay a cash dividend of ¥30 ($0.30) per share, or a total of ¥49,243 million ($492 million) to shareholders of record on March 31, 2008.
Stock option plan—The parent company was authorized to grant additional options to certain directors to purchase up to 125,600 shares of the parent company’s common stock in the period from June 26, 2008 to June 25, 2038, with payment due upon exercise of the stock acquisition right being ¥1 per share.
In addition, the parent company’s Board of Directors’ meeting held on May 16, 2008, approved to grant the same type of options to executive officers to purchase up to 442,600 shares of the parent company’s common stock.
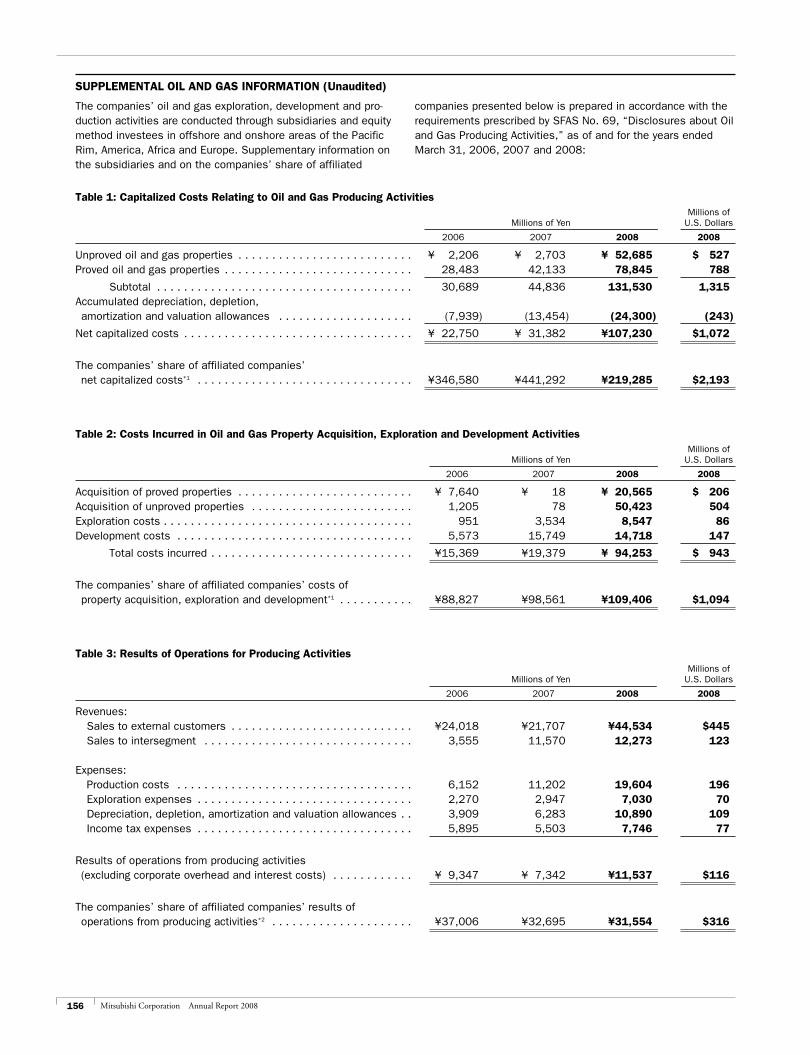
156 Mitsubishi Corporation Annual Report 2008
SUPPLEMENTAL OIL AND GAS INFORMATION (Unaudited)
The companies’ oil and gas exploration, development and pro-duction activities are conducted through subsidiaries and equity method investees in offshore and onshore areas of the Pacific Rim, America, Africa and Europe. Supplementary information on the subsidiaries and on the companies’ share of affiliated
companies presented below is prepared in accordance with the requirements prescribed by SFAS No. 69, “Disclosures about Oil and Gas Producing Activities,” as of and for the years ended March 31, 2006, 2007 and 2008:
Table 1: Capitalized Costs Relating to Oil and Gas Producing Activities Millions of Millions of Yen U.S. Dollars
2006 2007 2008 2008
Unproved oil and gas properties . . . . . . . . . . . . . . . . . . . . . . . . . . ¥ 2,206 ¥ 2,703 ¥ 52,685 $ 527Proved oil and gas properties . . . . . . . . . . . . . . . . . . . . . . . . . . . . 28,483 42,133 78,845 788
Subtotal . . . . . . . . . . . . . . . . . . . . . . . . . . . . . . . . . . . . . . 30,689 44,836 131,530 1,315Accumulated depreciation, depletion, amortization and valuation allowances . . . . . . . . . . . . . . . . . . . . (7,939) (13,454) (24,300) (243)
Net capitalized costs . . . . . . . . . . . . . . . . . . . . . . . . . . . . . . . . . . ¥ 22,750 ¥ 31,382 ¥107,230 $1,072
The companies’ share of affiliated companies’ net capitalized costs*1 . . . . . . . . . . . . . . . . . . . . . . . . . . . . . . . . ¥346,580 ¥441,292 ¥219,285 $2,193
Table 2: Costs Incurred in Oil and Gas Property Acquisition, Exploration and Development Activities Millions of Millions of Yen U.S. Dollars
2006 2007 2008 2008
Acquisition of proved properties . . . . . . . . . . . . . . . . . . . . . . . . . . ¥ 7,640 ¥ 18 ¥ 20,565 $ 206Acquisition of unproved properties . . . . . . . . . . . . . . . . . . . . . . . . 1,205 78 50,423 504Exploration costs . . . . . . . . . . . . . . . . . . . . . . . . . . . . . . . . . . . . . 951 3,534 8,547 86Development costs . . . . . . . . . . . . . . . . . . . . . . . . . . . . . . . . . . . 5,573 15,749 14,718 147
Total costs incurred . . . . . . . . . . . . . . . . . . . . . . . . . . . . . . ¥15,369 ¥19,379 ¥ 94,253 $ 943
The companies’ share of affiliated companies’ costs of property acquisition, exploration and development*1 . . . . . . . . . . . ¥88,827 ¥98,561 ¥109,406 $1,094
Table 3: Results of Operations for Producing Activities Millions of Millions of Yen U.S. Dollars
2006 2007 2008 2008
Revenues: Sales to external customers . . . . . . . . . . . . . . . . . . . . . . . . . . . ¥24,018 ¥21,707 ¥44,534 $445 Sales to intersegment . . . . . . . . . . . . . . . . . . . . . . . . . . . . . . . 3,555 11,570 12,273 123
Expenses: Production costs . . . . . . . . . . . . . . . . . . . . . . . . . . . . . . . . . . . 6,152 11,202 19,604 196 Exploration expenses . . . . . . . . . . . . . . . . . . . . . . . . . . . . . . . . 2,270 2,947 7,030 70 Depreciation, depletion, amortization and valuation allowances . . 3,909 6,283 10,890 109 Income tax expenses . . . . . . . . . . . . . . . . . . . . . . . . . . . . . . . . 5,895 5,503 7,746 77
Results of operations from producing activities (excluding corporate overhead and interest costs) . . . . . . . . . . . . ¥ 9,347 ¥ 7,342 ¥11,537 $116
The companies’ share of affiliated companies’ results of operations from producing activities*2 . . . . . . . . . . . . . . . . . . . . . ¥37,006 ¥32,695 ¥31,554 $316
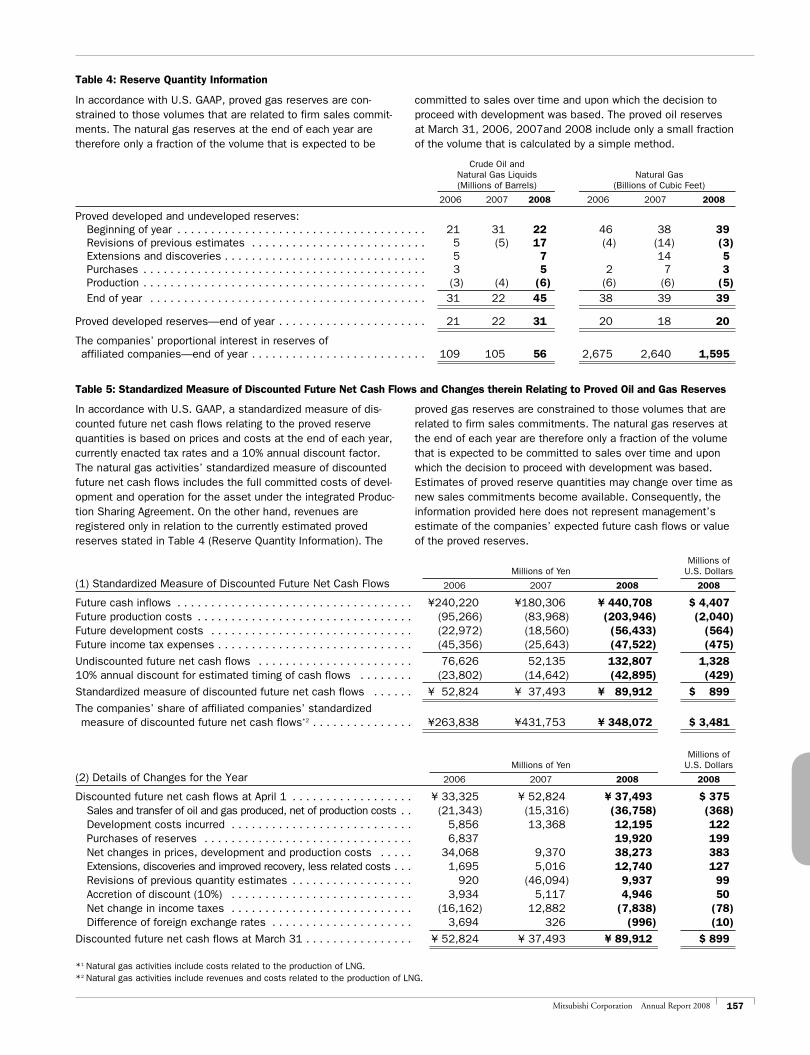
157Mitsubishi Corporation Annual Report 2008
Crude Oil and Natural Gas Liquids Natural Gas (Millions of Barrels) (Billions of Cubic Feet)
2006 2007 2008 2006 2007 2008
Proved developed and undeveloped reserves: Beginning of year . . . . . . . . . . . . . . . . . . . . . . . . . . . . . . . . . . . . . 21 31 22 46 38 39 Revisions of previous estimates . . . . . . . . . . . . . . . . . . . . . . . . . . 5 (5) 17 (4) (14) (3) Extensions and discoveries . . . . . . . . . . . . . . . . . . . . . . . . . . . . . . 5 7 14 5 Purchases . . . . . . . . . . . . . . . . . . . . . . . . . . . . . . . . . . . . . . . . . . 3 5 2 7 3 Production . . . . . . . . . . . . . . . . . . . . . . . . . . . . . . . . . . . . . . . . . . (3) (4) (6) (6) (6) (5) End of year . . . . . . . . . . . . . . . . . . . . . . . . . . . . . . . . . . . . . . . . . 31 22 45 38 39 39
Proved developed reserves—end of year . . . . . . . . . . . . . . . . . . . . . . 21 22 31 20 18 20
The companies’ proportional interest in reserves of affiliated companies—end of year . . . . . . . . . . . . . . . . . . . . . . . . . . 109 105 56 2,675 2,640 1,595
Table 5: Standardized Measure of Discounted Future Net Cash Flows and Changes therein Relating to Proved Oil and Gas Reserves
Table 4: Reserve Quantity Information
In accordance with U.S. GAAP, proved gas reserves are con-strained to those volumes that are related to firm sales commit-ments. The natural gas reserves at the end of each year are therefore only a fraction of the volume that is expected to be
committed to sales over time and upon which the decision to proceed with development was based. The proved oil reserves at March 31, 2006, 2007and 2008 include only a small fraction of the volume that is calculated by a simple method.
In accordance with U.S. GAAP, a standardized measure of dis-counted future net cash flows relating to the proved reserve quantities is based on prices and costs at the end of each year, currently enacted tax rates and a 10% annual discount factor. The natural gas activities’ standardized measure of discounted future net cash flows includes the full committed costs of devel-opment and operation for the asset under the integrated Produc-tion Sharing Agreement. On the other hand, revenues are registered only in relation to the currently estimated proved reserves stated in Table 4 (Reserve Quantity Information). The
proved gas reserves are constrained to those volumes that are related to firm sales commitments. The natural gas reserves at the end of each year are therefore only a fraction of the volume that is expected to be committed to sales over time and upon which the decision to proceed with development was based. Estimates of proved reserve quantities may change over time as new sales commitments become available. Consequently, the information provided here does not represent management’s estimate of the companies’ expected future cash flows or value of the proved reserves.
Millions of Millions of Yen U.S. Dollars
(1) Standardized Measure of Discounted Future Net Cash Flows 2006 2007 2008 2008
Future cash inflows . . . . . . . . . . . . . . . . . . . . . . . . . . . . . . . . . . . ¥240,220 ¥180,306 ¥ 440,708 $ 4,407Future production costs . . . . . . . . . . . . . . . . . . . . . . . . . . . . . . . . (95,266) (83,968) (203,946) (2,040)Future development costs . . . . . . . . . . . . . . . . . . . . . . . . . . . . . . (22,972) (18,560) (56,433) (564)Future income tax expenses . . . . . . . . . . . . . . . . . . . . . . . . . . . . . (45,356) (25,643) (47,522) (475)
Undiscounted future net cash flows . . . . . . . . . . . . . . . . . . . . . . . 76,626 52,135 132,807 1,32810% annual discount for estimated timing of cash flows . . . . . . . . (23,802) (14,642) (42,895) (429)
Standardized measure of discounted future net cash flows . . . . . . ¥ 52,824 ¥ 37,493 ¥ 89,912 $ 899
The companies’ share of affiliated companies’ standardized measure of discounted future net cash flows*2 . . . . . . . . . . . . . . . ¥263,838 ¥431,753 ¥ 348,072 $ 3,481
Millions of Millions of Yen U.S. Dollars
(2) Details of Changes for the Year 2006 2007 2008 2008
Discounted future net cash flows at April 1 . . . . . . . . . . . . . . . . . . ¥ 33,325 ¥ 52,824 ¥ 37,493 $ 375 Sales and transfer of oil and gas produced, net of production costs . . (21,343) (15,316) (36,758) (368) Development costs incurred . . . . . . . . . . . . . . . . . . . . . . . . . . . 5,856 13,368 12,195 122 Purchases of reserves . . . . . . . . . . . . . . . . . . . . . . . . . . . . . . . 6,837 19,920 199 Net changes in prices, development and production costs . . . . . 34,068 9,370 38,273 383 Extensions, discoveries and improved recovery, less related costs . . . 1,695 5,016 12,740 127 Revisions of previous quantity estimates . . . . . . . . . . . . . . . . . . 920 (46,094) 9,937 99 Accretion of discount (10%) . . . . . . . . . . . . . . . . . . . . . . . . . . . 3,934 5,117 4,946 50 Net change in income taxes . . . . . . . . . . . . . . . . . . . . . . . . . . . (16,162) 12,882 (7,838) (78) Difference of foreign exchange rates . . . . . . . . . . . . . . . . . . . . . 3,694 326 (996) (10)
Discounted future net cash flows at March 31 . . . . . . . . . . . . . . . . ¥ 52,824 ¥ 37,493 ¥ 89,912 $ 899
*1 Natural gas activities include costs related to the production of LNG.*2 Natural gas activities include revenues and costs related to the production of LNG.
158 Mitsubishi Corporation Annual Report 2008
Independent Auditors’ Report
MS Shibaura Building4-13-23, ShibauraMinato-ku, Tokyo 108-8530Japan
Tel: +81 (3) 3457 7321Fax: +81 (3) 3457 1694www.deloitte.com/jp
To the Board of Directors and Shareholders of Mitsubishi Corporation (Mitsubishi Shoji Kabushiki Kaisha):
We have audited the accompanying consolidated balance sheets of Mitsubishi Corporation (Mitsubishi Shoji Kabushiki Kaisha) and subsidiaries as of March 31, 2007 and 2008, and the related consolidated statements of income, compre-hensive income, shareholders’ equity, and cash flows for each of the three years in the period ended March 31, 2008 (all expressed in Japanese yen). These consolidated financial statements are the responsibility of the Company’s man-agement. Our responsibility is to express an opinion on these consolidated financial statements based on our audits.
We conducted our audits in accordance with auditing standards generally accepted in the United States of America. Those standards require that we plan and perform the audit to obtain reasonable assurance about whether the finan-cial statements are free of material misstatement. An audit includes consideration of internal control over financial reporting as a basis for designing audit procedures that are appropriate in the circumstances, but not for the purpose of expressing an opinion on the effectiveness of the Company’s internal control over financial reporting. Accordingly, we express no such opinion. An audit includes examining, on a test basis, evidence supporting the amounts and disclosures in the financial statements, assessing the accounting principles used and significant estimates made by management, as well as evaluating the overall financial statement presentation. We believe that our audits provide a reasonable basis for our opinion.
In our opinion, such consolidated financial statements present fairly, in all material respects, the consolidated financial position of Mitsubishi Corporation and subsidiaries as of March 31, 2007 and 2008, and the consolidated results of their operations and their cash flows for each of the three years in the period ended March 31, 2008, in conformity with accounting principles generally accepted in the United States of America.
Our audits also comprehended the translation of Japanese yen amounts into United States dollar amounts included in the consolidated financial statements with respect to the year ended March 31, 2008 and, in our opinion, such transla-tion has been made in conformity with the basis stated in Note 1. Such United States dollar amounts are presented solely for the convenience of readers outside Japan.
June 20, 2008 (June 25, 2008 as to the matters discussed in Note 26)
159Mitsubishi Corporation Annual Report 2008
June 25, 2008
Responsibility Statement
The following responsibility statement is made solely to comply with the requirements of
DTR 4.1.12 of the Disclosure Rules and the Transparency Rules of the United Kingdom
Financial Services Authority in its capacity as the United Kingdom Listing Authority, which
apply to Mitsubishi Corporation as an issuer whose financial instruments are admitted to
trading on the London Stock Exchange:
Yorihiko Kojima, President and CEO, confirms that, to the best of his knowledge, the
financial statements were prepared fairly in all material respects in accordance with
accounting principles generally accepted in the United States of America and that, to the
best of his knowledge, the management report was prepared fairly in all material respects
including the information about the development and performance of the business and
the position of Mitsubishi Corporation and the undertakings included in the consolidation
taken as a whole, together with the principal risks and uncertainties that they face.
Responsibility Statement

160 Mitsubishi Corporation Annual Report 2008
2 Mitsubishi Corporation Annual Report 2008 3Mitsubishi Corporation Annual Report 2008 161Mitsubishi Corporation Annual Report 2008
Corporate Philosophy—Three Corporate Principles
The Three Corporate Principles were formulated in 1934, as the action guidelines of Mitsubishi Trading Company (Mitsubishi Shoji Kaisha), based on the teachings of Koyata Iwasaki, the fourth president of Mitsubishi. Although Mitsubishi Trading Company ceased to exist as of 1947, the principles were adopted as MC’s corporate philosophy, and this spirit lives on in the actions of today’s management and employees. The Three Corporate Principles also serve as the cornerstone of the manage-ment ethos of the so-called Mitsubishi group of companies. Active in many business fields and united by a common history and philosophy, the Mitsubishi group companies continue to grow through a strong spirit of friendly competition with one another.
Corporate Profile
Mitsubishi Corporation (MC) is Japan’s largest general trading company (sogo shosha) with over 200 bases of operations in approximately 80 countries around the world, including Japan. With seven Business Groups and more than 500 sub sidiaries and affiliates, we serve customers around the world in virtually every industry. Moving forward, we remain determined to grow even stronger while contributing to the enrichment of society through business activities firmly rooted in the principles of fairness and integrity.
Organizational Structure(As of July 1, 2008)
Corporate Data(As of March 31, 2008)
Mitsubishi Corporation
Date Established: April 1, 1950
Capital: ¥201,825,117,909
Shares of Common Stock Issued: 1,694,323,909
Head Office: Marunouchi Office 3-1, Marunouchi 2-chome, Chiyoda-ku, Tokyo 100-8086, Japan Telephone: +81-3-3210-2121
Shinagawa Office 16-3, Kounan 2-chome, Minato-ku, Tokyo 108-8228, Japan
Number of Employees: Parent company: 5,454 Consolidated: 60,664
Independent Auditors: Deloitte Touche Tohmatsu / Tohmatsu & Co.
Number of Shareholders: 161,590
Stock Listings: Tokyo, Osaka, Nagoya, London
Transfer Agent for the Shares: Mitsubishi UFJ Trust and Banking Corporation Stock Transfer Agency Department 10-11, Higashisuna 7-chome, Koto-ku, Tokyo 137-8081, Japan Telephone: 0120-232-711-696 (within Japan)
American Depositary Receipts: Ratio (ADR:ORD): 1:2 Exchange: OTC (Over-the-Counter) Symbol: MSBHY CUSIP: 606769305
Depositary: The Bank of New York Mellon 101 Barclay Street, New York, NY 10286, U.S.A. Telephone: (201) 680-6825 U.S. toll free: 888-269-2377 (888-BNY-ADRS) URL: http://www.adrbnymellon.com
Contact: Investor Relations Office, Mitsubishi Corporation 3-1, Marunouchi 2-chome, Chiyoda-ku, Tokyo 100-8086, Japan Telephone: +81-3-3210-8683 Facsimile: +81-3-3210-8583
Internet Mitsubishi Corporation’s latest annual reports, financial reports and news releases are available on the Investor Relations homepage.
URL: http://www.mitsubishicorp.com/en/ir/
Industrial Finance, Logistics & Development Group
Energy Business Group
Metals Group
Machinery Group
Chemicals Group
Living Essentials Group
General Meeting of Shareholders
Corporate Auditors
Board of Corporate Auditors
Corporate Auditors’ Office
Board of Directors
President
Executive Committee
Governance Committee
International Advisory Committee
Industrial Finance, Logistics & Development Group CEO Office
Industrial Finance, Logistics & Development Group Controller Office
Merchant Banking, M&A Div.
Asset Finance & Business Development Div.
Development & Construction Project Div.
Logistics Services Div.
Living Essentials Group CEO Office
Living Essentials Group Controller Office
Living Essentials Group Internal Audit Office
Retail Business Unit
Foods (Commodity) Div.
Foods (Products) Div.
Textiles Div.
General Merchandise Div.
Energy Business Group CEO Office
Energy Business Group Controller Office
Exploration & Production Unit
Energy Business Development Unit
Natural Gas Business Div. A
Natural Gas Business Div. B
Petroleum Business Div.
Carbon & LPG Business Div.
Metals Group CEO Office
Metals Group Controller Office
Steel Business Div.
Ferrous Raw Materials Div.
Non-Ferrous Metals Div.
Machinery Group CEO Office
Machinery Group Controller Office
Power & Electrical Systems Div.
Plant & Industrial Machinery Business Div.
Ship, Aerospace & Transportation Systems Div.
Motor Vehicle Business Div.
Isuzu Business Div.
Chemicals Group CEO Office
Chemicals Group Controller Office
Aristech Unit
Phoenix Unit
Commodity Chemicals Div.
Functional Chemicals Div.
Advanced Sciences & Technologies Div.
Corporate Staff Section
Corporate Communications Dept.
Corporate Administration Dept.
Legal Dept.
Compliance Dept.
Personnel Dept.
Center for Human Resources Development
Center for Professional Career Counseling
Corporate Strategy & Research Dept.
Global Strategy & Coordination Dept.
Controller Office
Risk Management Dept.
Secretariat to the Portfolio Management Committee
Treasurer Office
Investor Relations Office
IT Planning Dept.
BPI and Internal Control Dept.
Internal Audit Dept.Corporate Planning Dept.
Business Innovation Group
Business Innovation Group CEO Office
Business Innovation Group Controller Office
ITS Business Unit
Automotive-Related Business Unit
Innovation Center
New Energy & Environment Business Div.
Information & Communication Technology Business Div.
Human Care Business Div.
Media Consumer Business Div.
•CSR & Environmental Affairs Committee
•Compliance Committee
•Human Resources Development Committee
•Portfolio Management Committee
•Internal Control and Disclosure Committee
•Food & Agricultural Resources Committee
•Consumer Market Strategies Committee
•Energy and Natural Resources Committee
Corporate Responsibility to Society “Shoki Hoko”Strive to enrich society, both materially and spiritually, while contributing towards the preservation of the global environment.
(The modern day interpretation of the Three Corporate Principles, as agreed on at the Kinyokai meeting of the 28 companies that constitute the so-called Mitsubishi group in January 2001.)
Integrity and Fairness “Shoji Komei”Maintain principles of transparency and openness, conducting busi-ness with integrity and fairness.
International Under standing through Trade “Ritsugyo Boeki”Expand business, based on an all- encompassing global perspective.
l Into the New Millennium
In 2001, MC updated its management plan in response to an increasingly global economy. “MC2003” came with a new theme: “Driven to Create Value.” The new plan introduced an aggressive new blueprint for growth, involving an expansion of the company’s value chains, a strengthening of its profitability, and focused strategies to create new businesses. The same year, the Business Unit (BU) System was intro-duced to the Business Groups, which clarified the strategic mission of each of their BUs, the smallest units for organizational control and earnings management. Mean-while, a new standard, MCVA (Mitsubishi Corporation Value Added), was adopted to make performance evaluation more relevant, and the company’s business portfolio
Corporate Historyl Foundation to 1970s
In 1954 the new Mitsubishi Shoji was founded, and that same year was listed on both the Tokyo and Osaka stock exchanges. In 1967, the company announced its first management plan, and in 1968, in response to its expanding organizations and businesses, introduced its Business Division System. Also that year, the company committed to a large project in Brunei to develop LNG (liquefied natural gas). This was its first large-scale investment, and was undertaken to help secure a stable supply of energy to Japan. Not content with mere trade-based activities,
the company began expanding its development and investment-based businesses on a global scale, as evidenced by iron-ore and metallurgical coal projects in Australia and Canada, and salt field business in Mexico. In 1971, the company made “Mitsubishi Corporation” its official English name. Two years later, in 1973, MC established what was ultimately to become its CSR & Environmental Affairs Office, clarifying a firm commitment to CSR (Corporate Social Responsibility).
l The 1980s
The Japanese economy entered a recession due to the recent oil shock, meaning MC needed to construct new systems to generate profits. The company began streamlining its established businesses and developing more efficient operations. In 1986 the company firmly entrenched a new policy, shifting its focus from
operating transactions to profits. That same year a new management plan was drawn up. The “K-PLAN” placed emphasis on rebuilding commercial rights, select-ing key business domains, and developing high “value-added” functions. In 1989, MC was listed on the London Stock Exchange.
l The 1990s
With the 1990s came accelerated globalization, and in 1992 MC announced a new management policy: namely to reinvent the company as a “Sound, Global Enter-prise.” MC began placing greater focus on its consolidated operations and increas-ing the value of its assets. More efforts were made to globalize the company’s operations and its people. Amid uncertainty about Japan’s financial system, MC
established “MC2000” in 1998. The aim of this new management plan was “Self-reform for the 21st Century.” MC2000 introduced a “Select & Focus” approach to business, strengthened strategic fields, and emphasized customer-oriented policies. The new plan was instrumental in shoring up the company’s foundations and paving the way to a prosperous future.
was reshaped to allocate management resources more appropriately. In 2004, “INNOVATION 2007” was unveiled. This new management plan sought to establish MC as a “New Industry Innovator,” with an aim to open up a new era and grow hand in hand with society. In 2007, MC selected the three fields of New Energy & the Environ-ment, Medical Healthcare, and Finance, as “Next Generation Core Businesses,” and increased its Business Groups to seven by newly establishing the Business Innova-tion, and Industrial Finance, Logistics & Development Groups. The company continues to refine its systems to ensure active involvement in next-generation, growth fields. In April 2008, MC announced its latest management plan, “INNOVATION 2009.”
Mitsubishi Corporation Annual Report 2008
Forward-Looking StatementsThis annual report contains forward-looking statements about Mitsubishi Corporation’s future plans, strategies, beliefs and performance that are not historical facts. They are based on current expectations, estimates, forecasts and projections about the industries in which Mitsubishi Corporation operates and beliefs and assumptions made by management. As the expectations, estimates, forecasts and projections are subject to a number of risks, uncertainties and assumptions, they may cause actual results to differ materially from those projected. Mitsubishi Corporation, therefore, wishes to caution readers not to place undue reliance on forward-looking statements. Furthermore, the company undertakes no obligation to update any forward-looking statements as a result of new information, future events or other developments. Risks, uncertainties and assumptions mentioned above include, but are not limited to, commodity prices; exchange rates and economic conditions; the outcome of pending and future litigation; and the continued availability of financing, financial instruments and financial resources.
Contents
1 Feature Section:
Evaluating Mitsubishi Corporation’s Corporate Value
2 Corporate Profile
3 Organizational Structure
4 Network
15 Financial Highlights
17 To Our Stakeholders
30 Review of Operations
30 Business Groups at a Glance
34 Business Innovation Group
38 Industrial Finance, Logistics & Development Group
42 Energy Business Group
46 Metals Group
50 Machinery Group
54 Chemicals Group
58 Living Essentials Group
62 Global Strategies
64 Corporate Governance and Internal Control
77 Corporate Section
86 Financial Section
161 Corporate Data
What is MC’s Value ?