Embed Size (px)
Citation preview

What is Happening from Behind? —
Making the Impact of Internet Topology Visible ∗
Matthias Wahlisch1,2, Thomas C. Schmidt1 and Waldemar Spat1
{waehlisch, t.schmidt}@ieee.org, [email protected] Hamburg, Department Informatik, Berliner Tor 7, 20099 Hamburg, Germany
2link-lab, Honower Str. 35, 10318 Berlin, Germany
Abstract
The Internet topology has evolved over the past decades in an evolutionary process and continuesto grow. Recently, it has attracted much attention from the networking and physics communities,as it forms a unique operational instance of a planetary-scale network environment. Several mea-surement projects observing the Internet have been undertaken over the past years, out of whichSkitter, its successor Archipelago (Ark) and Dimes have established as continuous recordings of thevivid process of network formation.
In this paper we compare Internet measurement data obtained from Skitter, Ark and Dimesby analyzing the Internet node degree distributions and correlations at IP node and router level.This comparative analysis was enabled by a data conversion and processing tool-chain implementedas an extension to the BRITE topology generator which we introduce, as well. Our results showsignificant differences in higher nodal degrees. Correlation analysis indicates that DIMES scansdiscover Internet links to a fairly uniform degree, while parts remain invisible within Skitter andArk data. Mid-range, oscillating spatial autocorrelations are discovered as a signature of memoryeffects in Internet topology.
Further on we analyze implications of the Internet structure as attained in both, its core andedge vicinities. Mobile multicast routing performance is quantized by the number of states mini-mally required for servicing listener or sender mobility. Results show a surprisingly low mobilityoverhead as compared to general multicast forwarding state management. As continuous mobilityhandovers necessarily occur between access routers located in geographic vicinity, we finally investi-gate the hypothesis that geographically adjacent edge networks attain a reduced network distancesas compared to arbitrary Internet nodes. The evaluation of edge distance distributions in differentregions for IP ranges, clustered according to their geographic location, reveals a stable correlationof geographic and network proximity at Internet edges.
Keywords: Internet topology, measurement, correlation analysis, topology data management, mo-bility handover performance, inter-domain multicast routing
1 Introduction
The Internet forms a large, decentrally evolving network instance and as such has been subject tomany studies. Internet topology models have been developed and suggest that viewing the Internet atdifferent degrees of resolution will lead to scale-free characteristic properties. Empirical measurementsof the Internet have thus gained importance for verifying these structural models.
The use of real-world Internet topology data, though, is not limited to theoretical considerations,but is likewise important for protocol design, performance analysis and verifications through realisticsimulations. Many protocols such as mobility management or multicast routing on distribution trees,
∗This work is supported by the German Bundesministerium fur Bildung und Forschung within the project Moviecast— http://moviecast.realmv6.org.
1
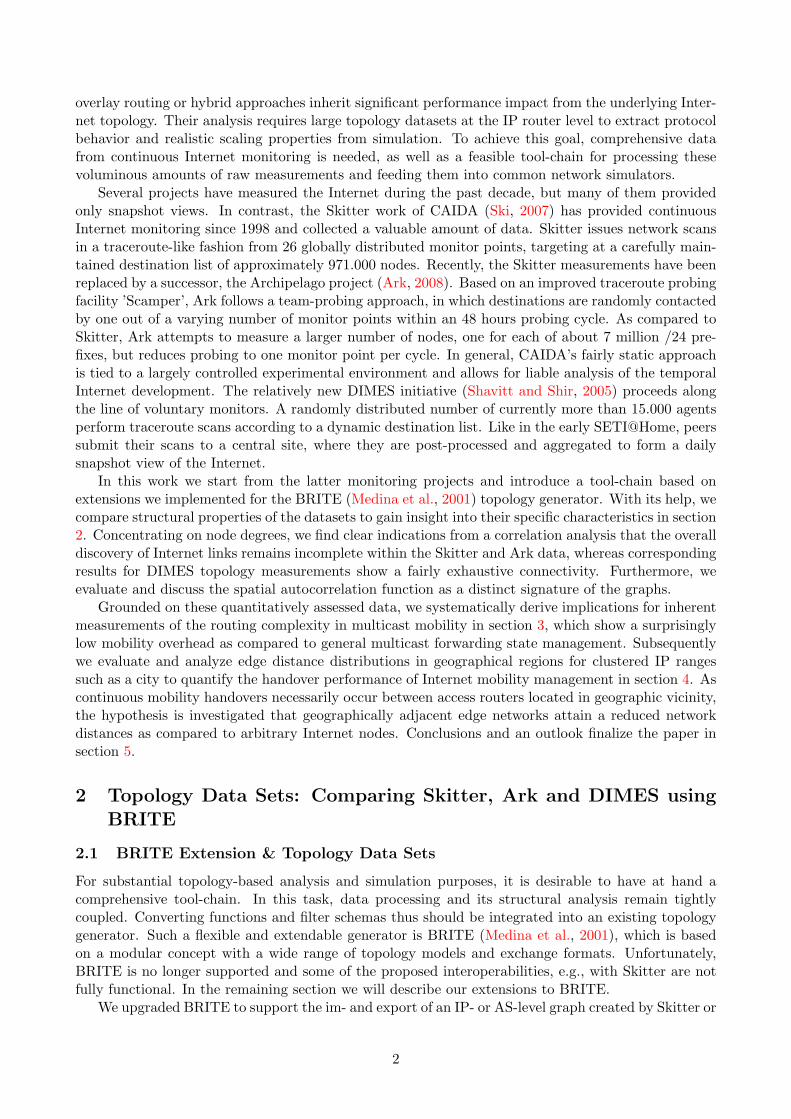
overlay routing or hybrid approaches inherit significant performance impact from the underlying Inter-net topology. Their analysis requires large topology datasets at the IP router level to extract protocolbehavior and realistic scaling properties from simulation. To achieve this goal, comprehensive datafrom continuous Internet monitoring is needed, as well as a feasible tool-chain for processing thesevoluminous amounts of raw measurements and feeding them into common network simulators.
Several projects have measured the Internet during the past decade, but many of them providedonly snapshot views. In contrast, the Skitter work of CAIDA (Ski, 2007) has provided continuousInternet monitoring since 1998 and collected a valuable amount of data. Skitter issues network scansin a traceroute-like fashion from 26 globally distributed monitor points, targeting at a carefully main-tained destination list of approximately 971.000 nodes. Recently, the Skitter measurements have beenreplaced by a successor, the Archipelago project (Ark, 2008). Based on an improved traceroute probingfacility ’Scamper’, Ark follows a team-probing approach, in which destinations are randomly contactedby one out of a varying number of monitor points within an 48 hours probing cycle. As compared toSkitter, Ark attempts to measure a larger number of nodes, one for each of about 7 million /24 pre-fixes, but reduces probing to one monitor point per cycle. In general, CAIDA’s fairly static approachis tied to a largely controlled experimental environment and allows for liable analysis of the temporalInternet development. The relatively new DIMES initiative (Shavitt and Shir, 2005) proceeds alongthe line of voluntary monitors. A randomly distributed number of currently more than 15.000 agentsperform traceroute scans according to a dynamic destination list. Like in the early SETI@Home, peerssubmit their scans to a central site, where they are post-processed and aggregated to form a dailysnapshot view of the Internet.
In this work we start from the latter monitoring projects and introduce a tool-chain based onextensions we implemented for the BRITE (Medina et al., 2001) topology generator. With its help, wecompare structural properties of the datasets to gain insight into their specific characteristics in section2. Concentrating on node degrees, we find clear indications from a correlation analysis that the overalldiscovery of Internet links remains incomplete within the Skitter and Ark data, whereas correspondingresults for DIMES topology measurements show a fairly exhaustive connectivity. Furthermore, weevaluate and discuss the spatial autocorrelation function as a distinct signature of the graphs.
Grounded on these quantitatively assessed data, we systematically derive implications for inherentmeasurements of the routing complexity in multicast mobility in section 3, which show a surprisinglylow mobility overhead as compared to general multicast forwarding state management. Subsequentlywe evaluate and analyze edge distance distributions in geographical regions for clustered IP rangessuch as a city to quantify the handover performance of Internet mobility management in section 4. Ascontinuous mobility handovers necessarily occur between access routers located in geographic vicinity,the hypothesis is investigated that geographically adjacent edge networks attain a reduced networkdistances as compared to arbitrary Internet nodes. Conclusions and an outlook finalize the paper insection 5.
2 Topology Data Sets: Comparing Skitter, Ark and DIMES usingBRITE
2.1 BRITE Extension & Topology Data Sets
For substantial topology-based analysis and simulation purposes, it is desirable to have at hand acomprehensive tool-chain. In this task, data processing and its structural analysis remain tightlycoupled. Converting functions and filter schemas thus should be integrated into an existing topologygenerator. Such a flexible and extendable generator is BRITE (Medina et al., 2001), which is basedon a modular concept with a wide range of topology models and exchange formats. Unfortunately,BRITE is no longer supported and some of the proposed interoperabilities, e.g., with Skitter are notfully functional. In the remaining section we will describe our extensions to BRITE.
We upgraded BRITE to support the im- and export of an IP- or AS-level graph created by Skitter or
2

DIMES. The raw IP-level Skitter measurements are provided in a specific DB format by CAIDA, whichneeds to be converted into readable ASCII using CAIDA tools. The BRITE Extension decomposesthe traceroute paths in separate, bi-directional edges. The import routine creates a complete graphover all selected Skitter files taken from different monitor points. Thereby all edges are extracted fromall input files to shape the final graph. Consequently, including more monitor point data will providea more complete view of interconnects, which can change the graph characteristic significantly. In thecase where two or more measurements for an edge connecting the same vertices are obtained fromdifferent monitor files, the mean value of the delay will be assigned as link weight. Whenever the delaybetween nodes cannot be calculated based on the RTT measurements, a configurable default valuewill be assumed.
In contrast to Skitter, DIMES aggregates all monitor information into one node and one edge filerespectively. Like in the Skitter case, multiply measured edges may be part of the data, which willbe resolved analogously. It is important to note, that DIMES data must be pre-processed to reviseincompletely written node identifiers. Unresolved router addresses are composed of (last known)source and (first known) destination IP address and a pseudo hop number. If unresolved, this datawill cause one IP level node to be mapped onto different, artificial addresses, leading to a distortedhop identification within the graph.
The immense amount of data obtained from the scanning projects cannot be used in full fortopology-based simulations, e.g., in a network simulator platform. To generate computationally lessexpensive reduced topologies of preserved properties, the BRITE Extension also provides two filterschemas:
The Map Sampling algorithm (Magoni and Pansiot, 2002) creates a subgraph with a predefinednumber of nodes and a mean degree reflecting the input topology.
The Radial Neighborhood View extracts a subset of the original topology centered within a prede-fined hop distance around a preselected node. Let G = (V,E) be the original topology and v ∈ V thechosen center node, then this view selects the subgraph G′ = (V ′, E′) with V ′ = {v′ ∈ V | dist(v, v′) ≤maxHop}.
Topology input data are taken as sanitized DIMES data and Skitter IP level measurements aggre-gated over all monitor points. Our graph calculations are based on the freely available BRITE analysisroutines contributed by Mathias Golombek. We extended this analysis tool for calculating the JointDegree Distribution.1
2.2 IP Alias Resolution
Trace collections as obtained from Skitter and Ark are likely to include different IP addresses thatbelong to the same router. Such aliases need to be resolved prior to constructing a router-leveltopology. There are several heuristic method for alias discovery, cf. (Donnet and Friedman, 2007) fora comprehensiv overview.
Aliases are not immediately visible from traceroute paths, but can be identified using analytic andactive methods. In our analysis we employed a combination of a graph-based method to identify aliascandidates analytically, followed by an active probing with the CAIDA tool ’iffinder’2, which evaluatesICMP error messages for packets sent with IP RECORD ROUTE option.
Dimes data are already aggregated in node and edge files and thus withstand a trace-based aliasresolution. However, the project provides router files that identify different IP interfaces belonging tothe same router.
1All BRITE extensions and the DIMES pre-process script can be downloaded from www.realmv6.org/brite-extension.html.
2see http://www.caida.org/tools/measurement/iffinder/
3

1 0 0 1 0 1 1 0 2 1 0 3
1 0 0
1 0 1
1 0 2
1 0 3
1 0 4
1 0 5
S k i t t e r < x > = 4 , 4 2 σx = 8 , 8 5 D I M E S < x > = 6 , 7 7 σx = 1 6 , 5 9 L i n e a r f i t w i t h s l o p e γ
Abso
lute F
reque
ncy [
#]
N o d e D e g r e e [ # ]
γ = - 2 , 1 9
γ = - 2 , 2 4
(a) Skitter (raw) versus DIMES
1 0 0 1 0 1 1 0 2 1 0 3
1 0 0
1 0 1
1 0 2
1 0 3
1 0 4
1 0 5
γ = - 2 , 4 6
S k i t t e r < X > = 4 , 2 7 σX = 7 , 9 5 A r k T e a m 2 < X > = 3 , 1 8 σX = 5 , 3 1 L i n e a r f i t w i t h s l o p e γ
Abso
lute F
reque
ncy [
#]
N o d e D e g r e e [ # ]
γ = - 2 , 2 7
(b) Skitter and Ark with iffinder IP Alias resolution
Figure 1: Node Degree Distribution x with mean <x> and dispersion σx
4

2.3 Node Degree Analysis & Results
In this section we apply the obtained tool-chain to a comparative analysis of Skitter and DIMESmeasurement data. We focus on the basic property of node degree distributions and correlationswithin the obtained network graphs.
The degree distributions for single nodes are displayed in figure 1 on a log-log scale along with alinear best fit of a corresponding power law. We compare raw Skitter data with the DIMES networkgraphs and apply iffinder-based IP Alias resolution to Skitter and Ark measurements. While theresulting power law exponents −γ = 2.19, 2.24 and 2.27 for Skitter and DIMES remain compatibleand close to the original values of Faloutsos et al. (Faloutsos et al., 1999), the corresponding Ark valuedeviates. In general, the statistical accuracies evidently differ, increasing from 0, 947 for Skitter to0, 970 for DIMES. The datasets mainly deviate for higher nodal degrees, with Skitter and Ark fallingrelatively shorter for degrees above 200.
A closer insight into the interconnection properties of the graphs is given by the joint degreedistribution. This correlation law defines the probability that a randomly selected edge connectsnodes with degree k1 and k2. Let m(k1, k2) denote the number out of M total edges directed from k1
to k2 degree nodes, then the correctly normalized joint degree distribution is calculated as
P (k1, k2) = m(k1, k2)/M.
It does not only describe the one hop neighborhood structure of an average k-degree node, butcan also be used to derive other well-known measures (Newman, 2002; Mahadevan et al., 2006). Notethat the single node degree distribution p(k) does not directly follow from integration, but requires abias correction factor, i.e., p(k) ∝
∑j P (k, j)/k.
Figure 2 displays the corresponding joint degree distributions for Skitter, DIMES and Ark as linear-log contours. For our bi-directionally linked graphs, the probability distribution is symmetric andadmits a steep, but smooth decay from low to high node degree correlations. The latter is significantlysharpened for the Skitter and Ark datasets, representing a reduced “visibility” of links between nodesof degrees above 25. Concomitantly, Skitter and Ark distributions admit large, discontinuous wholesin high degree regions. As both measurements where taken at the same time, and as we can expectdistributions for the statistical size of the Internet to smoothly fill the event space, these results clearlyindicate an incomplete picture or “limited” horizon of the topology discovered by the small numberof Skitter monitor points. Ark team probing, which reduces standard tracing of a destination to onlyone monitor, enhances these effects.
The assortativity coefficient r, given in captions of fig. 2, is the correlation coefficient of theneighboring degrees and serves as a simple measure of first order dependence for the network graph.For AS-level topologies, it has been consistently identified as of significant negative values (Newman,2002; Mahadevan et al., 2006), indicating the disassortative tendency of AS’ to connect at dissimilardegrees. By contrast, the corresponding node-level values for the Skitter and DIMES topologies showan assortative preference of IP routers to interconnect at compatible degrees, while slightly negativevalues are attained subsequent to alias resolution in Skitter and Ark. However, the correlation valuesof Skitter and Ark are almost one order of magnitude lower than for DIMES, pointing to furtherdifferences in the internal correlations of the graphs obtained from the two datasets.
To gain a deeper understanding of the mesh properties of the graphs, we examine long-rangeinterdependencies as described by the spatial autocorrelation function of node degrees. Let x(v)denote the degree for a node v ∈ V with average < x > and dispersion σx, where averages areperformed over the complete topology G = (V,E), and X(v) = (x(v)− < x >)/σx its centered andnormalized transform. Further for a given node vi define vi,δ ∈ {v′ ∈ V | dist(vi, v′) = δ} to be a nodeof hop distance δ, then the spatial autocorrelation function reads
ρ(δ) =<X(vi) ·X(vi,δ)> .
The complex measure ρ(δ) quantifies the similarity of the node degree distribution with itself ata position shifted by δ hops. Obviously −1 ≤ ρ ≤ 1, ρ(0) = 1 and the decay of ρ characterizes the
5

0 2 0 4 0 6 0 8 0 1 0 00
2 0
4 0
6 0
8 0
1 0 0
N o d e D e g r e e k 1 [ # ]
Node
Degre
e k2 [#
]
(a) Skitter, Assortativity Coefficient r = 0, 011
0 2 0 4 0 6 0 8 0 1 0 00
2 0
4 0
6 0
8 0
1 0 0
N o d e D e g r e e k 1 [ # ]
Node
Degre
e k2 [#
]
1 , 0 0 0 E - 61 , 9 3 5 E - 63 , 7 4 5 E - 67 , 2 4 8 E - 61 , 4 0 3 E - 52 , 7 1 4 E - 55 , 2 5 3 E - 51 , 0 1 7 E - 41 , 9 6 7 E - 43 , 8 0 7 E - 47 , 3 6 8 E - 40 , 0 0 1 4 2 60 , 0 0 2 7 5 90 , 0 0 5 3 4 00 , 0 1 0 3 30 , 0 2 0 0 0
(b) DIMES, Assortativity Coefficient r = 0, 091
0 2 0 4 0 6 0 8 0 1 0 00
2 0
4 0
6 0
8 0
1 0 0
N o d e D e g r e e k 1 [ # ]
Node
Degre
e k2 [#
]
(c) Skitter with iffinder, Assortativity Coefficient r =−0.0094
0 2 0 4 0 6 0 8 0 1 0 00
2 0
4 0
6 0
8 0
1 0 0
N o d e D e g r e e k 1 [ # ]
Node
Degre
e k2 [#
]
1 , 0 0 0 E - 61 , 9 3 5 E - 63 , 7 4 5 E - 67 , 2 4 8 E - 61 , 4 0 3 E - 52 , 7 1 4 E - 55 , 2 5 3 E - 51 , 0 1 7 E - 41 , 9 6 7 E - 43 , 8 0 7 E - 47 , 3 6 8 E - 40 , 0 0 1 4 2 60 , 0 0 2 7 5 90 , 0 0 5 3 4 00 , 0 1 0 3 30 , 0 2 0 0 0
(d) Ark with iffinder, Assortativity Coefficient r = −0, 0028
Figure 2: Linear-Log Contours of the Joint Degree Distributions P (k1, k2), for 1 ≤ ki ≤ 100.
memory range of the stationary process X: For a random graph it admits zero values for δ > 0,its exponential decay indicates independent increments, i.e., the degree of a node reached in δ hopschanges as compared to its neighbors independent of the hop distance δ. Distributed memory effectsare present for polynomial decays, with long-range dependencies dominating for
∑δ |ρ(δ)| =∞.
The corresponding results for Skitter and DIMES data are displayed in figure 3 along with leastsquare fitted analytic curves. This long-range correlation picture reveals further data discrepancies.While the Skitter autocorrelation function quickly decays, values for DIMES decent in polynomialorder from positive nearby-neighbor degree correlation and oscillate to a negative regime for hopdistances from 5 to 7. These observations appear consistent with anticorrelations previously foundat AS-level transitions in (Newman, 2002; Mahadevan et al., 2006). As expected, autocorrelationconverges to zero for large distances in DIMES, whereas Skitter values saturate at a slightly negativelevel. The latter may be contributed to measurement artifacts.
6

1 1 0
- 1
0
1 S k i t t e r D I M E S E x p o n e n t i a l f i t w i t h y ~ e - 0 . 9 x P o l y n o m i a l f i t w i t h
y ~ 2 * 1 0 - 4 x 5 - 6 * 1 0 - 3 x 4 + 6 * 1 0 - 2 x 3
Autoc
orrela
tion
D i s t a n c e [ H o p s ]
Figure 3: Spatial Autocorrelation Functions
3 Exploring the Routing Complexity of Mobile Multicast
3.1 Problem Analysis
Unlike point-to-point mobility and despite of ten years of active research, mobile multicast protocoldevelopment is still in an early, premature state (Schmidt et al., 2008). The complexity of multicastforwarding state management, as already present in static environments, may be recognized as oneof the major reasons for hesitant engagement at the IETF. To acchieve optimal routing, any clientsubscribed to a group while in motion, requires delivery branches to pursue its new location. Anymobile source requests the entire delivery tree to adapt to its changing positions. However, multicastdistribution trees arising from handover scenarios are not independent, but highly correlated. It isthe aim of this paper to give realistic quantitative estimates on handover-initiated state establishmentand thereby to provide a minimal bound on the complexity of mobile multicast routing. Our analysisconcentrates on source specific shortest path trees (SPT) and is therefore valid for shared and sourcespecific tree protocols at the receiver side, but restricted to SPT based routing for senders.
The effect of source or receiver movement on the stability of shortest path trees is directly addressedby constructing and comparing multicast distribution trees. As key characteristics of multicast shortestpath trees only make an impact in large networks, and as topological setup fixes a dominant part of thedegrees of freedom in routing simulations, realistic Internet topology data is needed for our analysis,which we obtain from the data and tool-chain presented in the previous section.
The multicast tree analysis has been realized based on the network simulator OMNeT++ 3.3(Varga et al., 2007). In detail, we uniformly sample receivers and sources as attached to, and designatedmulticast routers from the edge nodes of the given topology data sets. Edge nodes are identified asrouters of degree one and represent transition points to ’customer’ networks within the Internet coresystems. A source resp. one receiver node is selected as mobile and moved from previous (pDR)to next designated router (nDR). The routing distance from pDR to nDR forms a basic measure ofmobility impact and is chosen at varying but predefined hop count. The next distribution tree is thenspanned from the nDR to all receivers in the mobile source scenario and with altered branch on thepath from source to the mobile in the receiver scenario. These trees are then analyzed w.r.t. changesin forwarding interfaces.
7

3.2 Semi-Empirical Results
Results for the relative change of distribution trees as a function of receiver multiplicity are shown infigure 4 for a step size of 5 (4(a), 4(b)) and 10 hops (4(d), 4(e)), as well as a function of DR-distances(4(c)). It is noteworthy that even in large networks and for moderate receiver numbers more than80% of multicast tree routes remain fixed under a handover.
An increasing number of receivers within the network will broaden its coverage with distributionstates and lead to lower state changes under mobility (cf. 4(a) - 4(e)). Conversely, the decreasingstability of multicast SPTs for increasing mobility impact is clearly visible from figure 4(c). Whencomparing mobility scenarios, it is noticeable that network size significantly influences multicast treestability only for moving receivers, due to the relevance of receiver-to-overall-node ratio. Sourcemovement remains fairly unaffected, which suggests a scaling law argument, i.e., a self-similar natureof multicast (sub-)trees added at distance in larger networks.
The coincidence rate for receivers remains below the results for mobile sources. Even though amoving source changes the tree root, its leaves represented by fixed receivers remain unchanged andadvance the correlation of mobility related distribution trees. This scenario does not apply for mobilereceivers and the results suggest that the intersection between the old and the new tree is locatedclose to the mobile. In the overall it can be concluded that the stability of multicast distribution treesunder mobility is surprisingly large, which raises hope for an efficient solution in the near future.
4 Handover Performance of Internet Mobility Management
Seamless support for Voice over IP (VoIP) and related real–time communication must be consideredcritical for deployment success into the mobile world. Therefore significant effort is continuously takenin the IETF to develop and improve protocols for seamless mobility handovers, FMIPv6 (Koodli, 2008)and HMIPv6 (Soliman et al., 2005) being the most prominent examples. Mobile IPv6 (Johnson et al.,2004) inherits a strong topology dependence through its binding update procedures with the HomeAgent (HA) and the Correspondent Node (CN). Handover acceleration schemes attempt to overcomethis obstacle by relocating immediate transfer negotiations to the vicinity of the mobile node, i.e., toaccess networks at the Internet edges. In previous analysis (Schmidt and Wahlisch, 2005) it couldbe shown that the handover performance actually attained largely depends on the relative networktopology of access components, when measured in an appropriate delay metric such as round triptime. Access router distance can be considered as the characteristic complexity parameter in fast orhierarchical mobile IPv6.
4.1 Regional Edge Distance Distributions
In this section we empirically analyze the regional edge distance distributions of exemplary areas inthe current Internet. The objective of this work is to inquire on the temporal handover distribution,which is an immediate function of access router distances. As the measure of locality admits enhancedsensitivity on local edge network structures, we performed own network scans to allow for more detailedinvestigation on regional topologies. Clusters of IP ranges from geographic regions such as cities arepre-selected in order to account for locality. To choose for a reliable source of geographic information,we evaluated eight different mapping resources in a first step by selecting a set of 30 distributed,geographically known IP ranges. The commercial product GeoIP (MaxMind LLC, 2006) thereby wasthe only resource to admit negligible errors. In a second, automated testing we compared data of largersamples with whois queries and found a coincidence rate of about 80 %. This result we consideredreasonable, as whois data commonly provide administrative addresses possibly distinct of physicalrouter locations.
Results are presented for the cities of San Francisco, USA, Berlin and Hamburg, Germany, andShanghai, China, which were exemplarily selected as geographic target regions. Scanning has beenperformed from origins at the locations of Berlin, Hamburg and Shanghai, at the 67th IETF meeting
8

0 2 0 4 0 6 0 8 0 1 0 0 1 2 0 1 4 0 1 6 0 1 8 0 2 0 00
1 02 03 04 05 06 07 08 09 0
1 0 0
S k i t t e r N e t w o r k 1 5 4 N o d e s S k i t t e r N e t w o r k 1 5 4 0 N o d e s S k i t t e r N e t w o r k 1 5 4 0 0 N o d e s D I M E S N e t w o r k 1 5 4 N o d e s D I M E S N e t w o r k 1 5 4 0 N o d e s D I M E S N e t w o r k 1 5 4 0 0 N o d e s
<Coin
ciding
Mult
icast
Route
rs> [%
]
R e c e i v e r s [ # ]
(a) Mobile receiver
0 2 0 4 0 6 0 8 0 1 0 0 1 2 0 1 4 0 1 6 0 1 8 0 2 0 00
1 02 03 04 05 06 07 08 09 0
1 0 0
S k i t t e r N e t w o r k 1 5 4 N o d e s S k i t t e r N e t w o r k 1 5 4 0 N o d e s S k i t t e r N e t w o r k 1 5 4 0 0 N o d e s D I M E S N e t w o r k 1 5 4 N o d e s D I M E S N e t w o r k 1 5 4 0 N o d e s D I M E S N e t w o r k 1 5 4 0 0 N o d e s
<Coin
ciding
Mult
icast
Route
rs> [%
]
R e c e i v e r s [ # ]
(b) Mobile sender
0 5 1 0 1 5 2 0 2 5 3 00
1 02 03 04 05 06 07 08 09 0
1 0 0
S k i t t e r N e t w o r k 1 5 4 N o d e s S k i t t e r N e t w o r k 1 5 4 0 N o d e s S k i t t e r N e t w o r k 1 5 4 0 0 N o d e s D I M E S N e t w o r k 1 5 4 N o d e s D I M E S N e t w o r k 1 5 4 0 N o d e s D I M E S N e t w o r k 1 5 4 0 0 N o d e s
<Coin
ciding
Mult
icast
Route
rs> [%
]
p D R - t o - n D R D i s t a n c e [ H o p s ]
(c) Mobile sender
0 2 0 4 0 6 0 8 0 1 0 0 1 2 0 1 4 0 1 6 0 1 8 0 2 0 00
1 02 03 04 05 06 07 08 09 0
1 0 0
S k i t t e r N e t w o r k 1 5 4 N o d e s S k i t t e r N e t w o r k 1 5 4 0 N o d e s D I M E S N e t w o r k 1 5 4 N o d e s D I M E S N e t w o r k 1 5 4 0 N o d e s
<Coin
ciding
Mult
icast
Route
rs> [%
]
R e c e i v e r s [ # ]
(d) Mobile receiver
0 2 0 4 0 6 0 8 0 1 0 0 1 2 0 1 4 0 1 6 0 1 8 0 2 0 00
1 02 03 04 05 06 07 08 09 0
1 0 0
S k i t t e r N e t w o r k 1 5 4 N o d e s S k i t t e r N e t w o r k 1 5 4 0 N o d e s D I M E S N e t w o r k 1 5 4 N o d e s D I M E S N e t w o r k 1 5 4 0 N o d e s
<Coin
ciding
Mult
icast
Route
rs> [%
]
R e c e i v e r s [ # ]
(e) Mobile sender
Figure 4: Relative router coincidence for subsequent multicast trees at pDR-nDR distances 5 & 10
9

0 5 0 1 0 0 1 5 0 2 0 0 2 5 0 3 0 00 , 0 0
0 , 0 1
0 , 0 2
0 , 0 3
0 , 0 4
0 , 0 5
Relat
ive Fr
eque
ncies
R T T [ m s ]
B e r l i n , G e r m a n y < x > = 8 6 , 2 9 6 7 2 σx = 1 8 5 , 4 6 6 3 8 H a m b u r g , G e r m a n y < x > = 7 9 , 7 5 8 7 8 σx = 1 7 5 , 0 9 7 6 2 S a n F r a n c i s c o , U S A < x > = 7 3 , 1 8 6 2 σx = 6 8 , 5 7 5 7 4 S h a n g h a i , C h i n a < x > = 3 8 8 , 0 7 1 1 9 σx = 3 4 1 , 4 5 6 4 8 R a n d o m L o c a t i o n < x > = 2 7 7 , 4 9 5 6 9 σx = 2 4 2 , 8 0 4 3 9
(a) Scan Data
0 5 0 1 0 0 1 5 0 2 0 0 2 5 0 3 0 00 , 0 0
0 , 0 1
0 , 0 2
0 , 0 3
0 , 0 4
0 , 0 5
Relat
ive Fr
eque
ncies
R T T [ m s ]
B e r l i n , G e r m a n y < x > = 9 4 , 1 4 7 7 9 σx = 1 3 0 , 7 7 1 4 1 H a m b u r g , G e r m a n y < x > = 7 3 , 4 3 1 0 9 σx = 1 1 6 , 7 6 8 5 4 S a n F r a n c i s c o , U S A < x > = 2 1 , 0 8 2 8 2 σx = 4 3 , 9 9 5 3 5 S h a n g h a i , C h i n a < x > = 2 5 7 , 6 1 7 6 8 σx = 2 5 2 , 6 4 2 1 7 R a n d o m < x > = 1 5 0 , 7 4 1 2 5 σx = 2 6 5 , 7 4 9 4 8
(b) CAIDA Data
Figure 5: Round Trip Time Distributions at Network Edges
in San Diego and with the help of various public traceroute facilities. Since the number of availableIP ranges vary from Shanghai (763) up to San Francisco (8476), subsets of equal sizes are selectedrandomly for each city. Statistical convergence with respect to sample size, but also for different datesand day times were compared, and a fair stability of the distributions could be observed for samplesubsets of 500 IP ranges.
We compare our results with distributions derived from CAIDA data. DIMES data do not includeRTT values and are thus unavailable. Host clusters for selected cities are taken from the CAIDAdestination list according to the GeoIP database. Skitter trace paths are minimized with respect toall available 18 monitor points, which are located more densely at the US West Cost and sparsely inEurope and Asia.
Resulting distributions for round trip times are displayed in figure 5. An additional curve derivedfor randomly located nodes is added to distinguish locality correlations.
Clearly our round trip time distributions vary significantly, while Skitter data evaluate to fairlysimilar distributions. Pronounced peaks at close distances can be observed for the areas of Berlin andHamburg, when monitored from the close vicinity. The effect on RTT results of source positioning forthe scanning is shown for San Francisco data in figure 6. RTT characteristics, though, appear heaviertailed, which supposedly is due to a sporadic occurrence of slow transition links. Tardy transitions areof lesser effect in the San Francisco region, for which again CAIDA measurements expose a distributionof higher significance.
10

0 5 0 1 0 0 1 5 0 2 0 0 2 5 0 3 0 0 3 5 0 4 0 0 4 5 0 5 0 0 5 5 0 6 0 0 6 5 0 7 0 00 , 0 0
0 , 0 5
0 , 1 0
0 , 1 5
0 , 2 0
0 , 2 5
Relat
ive Fr
eque
ncies
R T T [ m s ]
O r i g i n H a m b u r g , G e r m a n y O r i g i n S a n D i e g o , U S A
Figure 6: RTT Distributions Evaluated from Different Origins for San Francisco Nodes
In contrast, Shanghai data attain merely indifferent RTT distributions, which are even less pro-nounced than random samples. Non-negligible weights are situated beyond the displayed interval, ascan be read from mean and standard deviation values. This may be explained from a wide variety ofslow transit links present in the Chinese core networks.3 CAIDA skitter data seem to qualitativelyreflect these RTT law diversities. San Francisco values are very pronounced, whereas Hamburg andBerlin data show an intermediate characteristic. It should be noted, though, that the reverse of theproximity observations from (Subramanian et al., 2002) does not seem to hold: RTT distributionsadmit wide tails, whence even in close router distances enhanced mutual delays may be expected.
In total the results seem to indicate that inter–edge routing within a geographic region is frequentlyperformed via local transits and peering, which produce network proximity in ’the neighborhood’,but remain invisible for a distant monitor. From an applied perspective, these results support thehypothesis of section 2 that Internet link correlations only become visible when observed from anappropriately close perspective.
4.2 Internet Handover Performance
The results obtained so far may serve as an empirical fundament for realistic handover performanceestimates of the network. A mobile node moving from one access network to another in geographicalneighborhood does imposes traffic redirection, minimally from its previous to its new attachment.These operations cause delay and routing costs, which for the case of FMIPv6 (Koodli, 2008) aregiven by the unicast path from previous to next access router, and higher, otherwise.
Based on the results derived in (Schmidt and Wahlisch, 2005), we now can immediately calculateexpected values of characteristic handover measures. For packets sent at a constant bit rate of one per10 ms, the conditional expectation of packets lost or buffered for given inter–access–router delay wasderived for predictive and reactive handover procedures (cf. figure 6 of (Schmidt and Wahlisch, 2005)).Combining these previous results with those shown in figure 5, we arrive at expected periods for packetloss as functions of handover anticipation times. Results for the different regions as presented in figure7 jointly show a pronounced uniform minimum at handover anticipation of 25 ms for the cities ofSan Francisco, Hamburg and Berlin, while significant optimal values remain absent for Shanghai andrandom data. These results reflect the degree of locality in regional delay distributions.
3Another possible explanation could lie in a reduced accuracy of MaxMind GeoIP data for the Chinese region.
11

0 2 5 5 0 7 5 1 0 05 0
6 0
7 0
8 0
9 0
1 0 0
1 1 0
1 2 0
1 3 0
Packe
t Los
s [ms
]
A n t i c i p a t i o n T i m e [ m s ]
B e r l i n , G e r m a n y H a m b u r g , G e r m a n y S a n F r a n c i s c o , U S A S h a n g h a i , C h i n a R a n d o m
Figure 7: Expected Packet Loss in Predictive Handovers as a Function of Anticipation Time (0 =Reactive Handover)
5 Conclusions & Outlook
We introduced a tool-chain for data processing of Internet measurements and used it for a comparativeanalysis of CAIDA Skitter, Ark and DIMES data on the IP node level. Topological characteristics ofthe two datasets could be derived from a node degree correlation analysis, indicating a fairly uniformdiscovery of Internet links by DIMES, but a ’visible’ miss by Skitter and Ark. Investigations oflong-range autocorrelations indicate that the Internet topology shows mid-range memory effects, withpreferred clustering of similar degree nodes in the short range, but dissimilar ones on an inter-AS levelscale.
These data sets and tools where applied to analyze aspects of mobility management at the routinglayer. At first we quantified the complexity inherent to multicast tree adaptation under mobility.Topology-based simulations for CAIDA and DIMES data sets discovered a remarkably low requirementof multicast state change in moderate mobility regimes.
Inspired by mobile IP handover performance measures, we investigated routing distances in geo-graphically bound clusters of the Internet. Therein users are expected to move around freely whilecontinuously ’talking’ IP in the near future. Traceroute probes have been used to derive delay dis-tributions at Internet edges in San Francisco, Berlin, Hamburg and Shanghai. Comparison has beendrawn to CAIDA measurements only, since DIMES link data lack delay values. Our results seem toindicate a clear signatures of locality in the distance metric, which cannot be segregated from CAIDAmeasurements due to sparsely scattered monitor points. The application of these results to calculatingpacket loss after mobility handovers indicates that characteristic proximity measures in the Internetmay give rise to fairly stable anticipation timers.
References
Ark (2008), ‘Archipelago Project at CAIDA’, http://www.caida.org/projects/ark/.
Donnet, B. and Friedman, T. (2007), ‘Internet Topology Discovery: A Survey’, CommunicationsSurveys & Tutorials, IEEE 9(4), 56–69.URL: http://dx.doi.org/10.1109/COMST.2007.4444750
Faloutsos, M., Faloutsos, P. and Faloutsos, C. (1999), On Power-Law Relationships of the InternetTopology, in ‘SIGCOMM ’99: Proceedings of the conference on Applications, technologies, architec-tures, and protocols for computer communication’, ACM Press, New York, NY, USA, pp. 251–262.
Johnson, D. B., Perkins, C. and Arkko, J. (2004), Mobility Support in IPv6, RFC 3775, IETF.
12

Koodli, R. (2008), Mobile IPv6 Fast Handovers, RFC 5268, IETF.
Magoni, D. and Pansiot, J.-J. (2002), Internet Topology Modeler Based on Map Sampling, in ‘Pro-ceedings of the 7th IEEE Symposium on Computers and Communications’, IEEE Computer Society,Taormina, Italy, pp. 1021–1027.
Mahadevan, P., Krioukov, D., Fomenkov, M., Huffaker, B., Dimitropoulos, X., kc claffy and Vahdat,A. (2006), ‘The Internet AS-Level Topology: Three Data Sources and One Definitive Metric’, ACMSIGCOMM Comput. Commun. Rev. 36(1), 17–26.
MaxMind LLC (2006), ‘GeoIP’, http://www.maxmind.com.
Medina, A., Lakhina, A., Matta, I. and Byers, J. (2001), BRITE: An Approach to Universal TopologyGeneration, in ‘Proceedings of the International Workshop on Modeling, Analysis and Simulationof Computer and Telecommunications Systems’, IEEE Computer Society, Washington, DC, USA,p. 346.
Newman, M. E. J. (2002), ‘Assortative Mixing in Networks’, Physical Review Letters 89(20), 208701.
Schmidt, T. C. and Wahlisch, M. (2005), ‘Predictive versus Reactive – Analysis of Handover Per-formance and Its Implications on IPv6 and Multicast Mobility’, Telecommunication Systems 30(1–3), 123–142.
Schmidt, T. C., Wahlisch, M. and Fairhurst, G. (2008), Multicast Mobility in MIPv6: ProblemStatement and Brief Survey, IRTF Internet Draft – work in progress 04, MobOpts.URL: http://tools.ietf.org/html/draft-irtf-mobopts-mmcastv6-ps
Shavitt, Y. and Shir, E. (2005), ‘DIMES: Let the Internet Measure Itself’, ACM SIGCOMM ComputerCommunication Review 35(5), 71–74.
Ski (2007), ‘Skitter Project at CAIDA’, http://www.caida.org/tools/measurement/skitter.
Soliman, H., Castelluccia, C., Malki, K. and Bellier, L. (2005), Hierarchical Mobile IPv6 mobilitymanagement (HMIPv6), RFC 4140, IETF.
Subramanian, L., Padmanabhan, V. and Katz, R. (2002), Geographic Properties of Internet Routing,in ‘Proceedings of the 2002 USENIX Annual Technical Conference’, USENIX Association, Berkeley,CA, USA, pp. 243–259.
Varga, A. et al. (2007), ‘The OMNeT++ discrete event simulation system’, http://www.omnetpp.org.
13