Embed Size (px)
Citation preview
The GPT Behind IT: What is Happening to Semiconductor Prices?
David M. Byrne (Federal Reserve Board)
Stephen D. Oliner (American Enterprise Institute and UCLA)
Daniel E. Sichel (Wellesley College and NBER)
Paper Prepared for the IARIW-UNSW Conference
on Productivity: Measurement, Drivers and Trends
Sydney, Australia, November 26-27, 2013
Session 4B: ICT Productivity and Capital Services
Time: Tuesday, November 26, 3:45-6:00
[PRELIMINARY AND INCOMPLETE. DO NOT QUOTE WITHOUT PERMISSION.]
The GPT behind IT: What is happening to semiconductor prices?*
David M. Byrne, Federal Reserve Board Stephen D. Oliner, American Enterprise Institute and UCLA
Daniel E. Sichel, Wellesley College and NBER
November 2013
Abstract
How fast are semiconductor prices falling? Data from the Producer Price Index (PPI) for the United States suggests that these prices have barely been falling in recent years, a dramatic contrast from the exceptionally rapid declines in semiconductor prices reported from the mid- 1990s to the early 2000s. This slowdown in the rate of decline is puzzling given evidence that the performance of microprocessors (MPUs) continued to improve at a rapid pace after the mid-2000s. Also in the mid-2000s, Intel substantially changed its pricing behavior and product introduction strategy. Given these developments, this paper re-examines the measurement of quality-adjusted prices for MPUs for desktop PCs. We argue that, with the changes in Intel’s pricing behavior, the matched-model methodology used for the PPI index for MPUs may have started to be biased in the mid-2000s and that hedonic indexes provide a more accurate measure of price change since then. Our preferred hedonic index tracks the PPI closely through 2006. However, from 2006 to 2012, our preferred index of MPU prices fell at an average annual rate of 32 percent, while the PPI declined at only an 8 percent rate. This difference has important implications for gauging the rate of innovation in the semiconductor sector.
* The views expressed are those of the authors and not the Board of Governors of the Federal Reserve or other members of its staff. We thank Ana Aizcorbe, Ken Flamm, Charlie Gilbert, Kevin Krewell, Vincent Russo and other analysts in the Producer Price Index program at the Bureau of Labor Statistics, and seminar participants at the 2013 NBER Summer Institute and the Federal Reserve Bank of Boston. [PRELIMINARY AND INCOMPLETE. DO NOT QUOTE WITHOUT PERMISSION.]
1
1. Introduction
How fast are semiconductor prices falling? Data from the Producer Price Index (PPI) for the
United States suggests that these prices have barely been falling in recent years, a dramatic
contrast from the exceptionally rapid declines in semiconductor prices reported from the mid-
1990s to the early 2000s.1 This slower pace of decline raises important questions about the rate
of innovation in the semiconductor sector. Semiconductors are a key GPT (general-purpose
technology) lying behind the IT revolution. To the extent that the slower pace of price decline
reflects a slower pace of innovation in semiconductors and IT, the outlook for labor productivity
growth and potential output will be darker. Indeed, as discussed in Byrne, Oliner, and Sichel
(2013), the slower pace of decline in semiconductor prices has fueled suggestions that the IT
revolution largely has run its course. [To be filled in: More background on role of
semiconductors, IT, and other sectors in the broader economy.]
Given the importance of technological innovation in this sector, this paper re-examines
the measurement of quality-adjusted prices for microprocessors (MPUs) for desktop PCs. As the
backdrop for this analysis, Intel substantially changed its pricing behavior and product
introduction strategy in the mid-2000s. Before that point, Intel introduced new chips at the
technological cutting edge and lowered the list prices of existing chips to remain competitive on
a quality-adjusted basis. However, by 2006, Intel had shifted to a new paradigm in which it
introduced new chips throughout the performance spectrum and kept the list prices of existing
chips largely unchanged. We argue that, with these changes, the matched-model methodology
used for the PPI index for MPUs may have started to be biased in the mid-2000s and that
hedonic indexes provide a more accurate measure of price change since then. Our preferred
1 In addition to the PPI, a number of price indexes for semiconductors have been developed, including by Ellen Dulberger, Bruce Grimm, Ken Flamm, and Federal Reserve Board.
2
hedonic index tracks the PPI closely through 2006. However, from 2006 to 2012, our preferred
index of MPU prices fell at an average annual rate of 32 percent, while the PPI declined at only
an 8 percent rate.
The next section discusses the puzzle raised by the very slow rate of decline in the PPI
during recent years. As we document, the engineering frontier for MPUs continued to move out
rapidly after the mid-2000s even as the rate of price decline slowed. This disconnect between
the ongoing technological advances and the slowing price declines raises the possibility that the
PPI is not telling the right story.
Section 3 of the paper examines whether, given the pattern of prices since 2006, matched-
model indexes such as the PPI or hedonic indexes are likely to be more appropriate. We develop
a number of alternative explanations for how to interpret the change in Intel’s pricing strategy for
MPUs, and we use a series of stylized charts to show how matched-model and hedonic indexes
would handle different cases. Based on this analysis, we argue that matched-model indexes are
likely to be biased in almost every case. We show that hedonic indexes are better able to capture
trends in quality-adjusted prices. In addition, we suggest that, given the pattern of Intel’s prices,
a hedonic index that only uses data from the period in which a particular model enters the market
is preferred to a hedonic index that uses the full sample of prices.
Section 4 provides a brief review of our data, and section 5 describes the hedonic
regressions that we estimate.
Section 6 presents our results. [At this point, section 6 includes a bulleted summary of
main results and describes the relevant tables and figures. Rather than repeat them in this
incomplete introduction, we refer the reader interested in a quick overview to that section of the
paper.]
3
2. The Puzzle
As noted, the PPI for MPUs transitioned to a much slower pace of decline between 2003 and
2006 and has fallen very slowly since then. This section explores the plausibility of this extreme
slowdown from a few different perspectives. The first perspective is whether the slowdown
meshes with the trends in technological advance for MPU chips. The second perspective focuses
on the changes that occurred in Intel's pricing patterns for MPUs, which could have reduced the
information content of posted MPU prices.
Technology cycles and chip performance.2 As discussed in Aizcorbe, Oliner, and Sichel
(2008), there is a broad consensus that the pace of technical advance in the semiconductor
industry sped up in the mid-1990s, a development first brought to the attention of economists by
Jorgenson (2001). The standard definition of a semiconductor technology cycle is the amount of
time required to achieve a 30 percent reduction in the width of the smallest feature on a chip.
Because chips are rectangular, a 30 percent reduction in both the horizontal and vertical
directions implies about a 50 percent reduction (0.7*0.7) in the area required for the smallest
chip component.
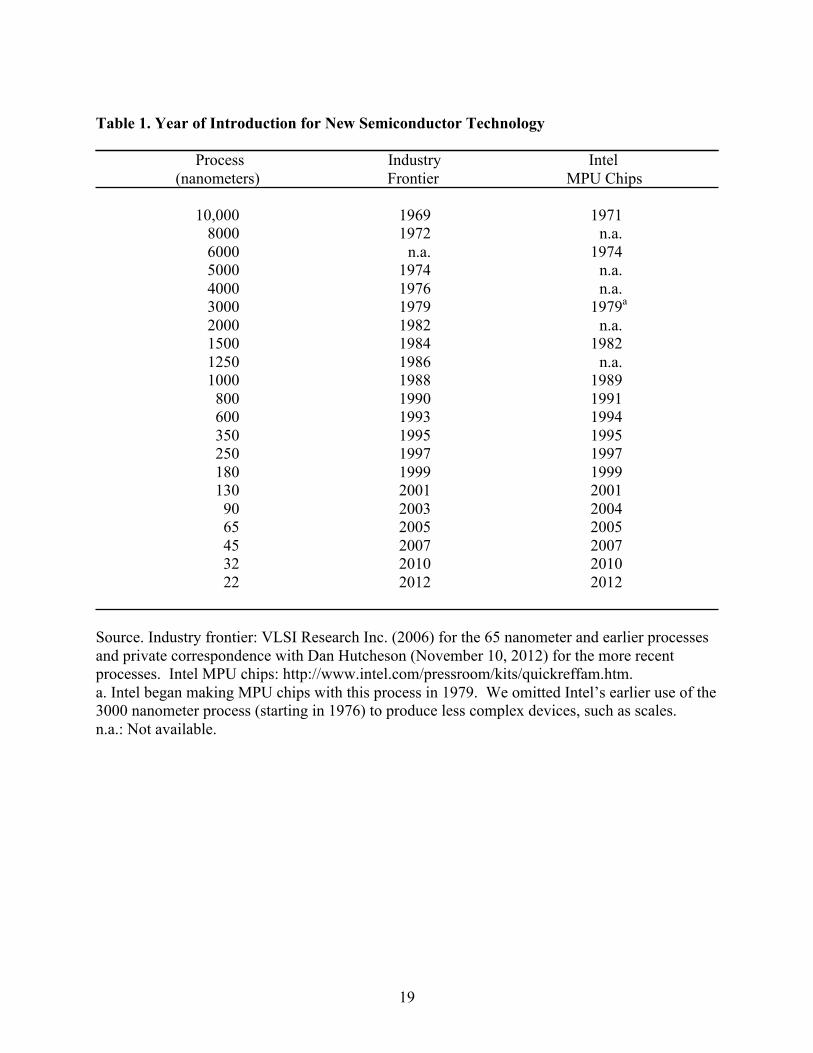
Table 1 presents the history of these scaling reductions for the semiconductor industry as
a whole and microprocessor (MPU) chips produced by Intel, updating a similar table in
Aizcorbe, Oliner, and Sichel (2008). As shown, the industry has achieved massive reductions in
scaling over time, leaving the width of a chip component in 2012 about 450 times smaller
(10,000/22) than in 1969. Except for the two-year lag at the beginning of this period, Intel
always has been at the industry frontier or within a year of the frontier.3
2 The text on technology cycles and benchmark performance tests as well as tables 1 and 2 are largely taken from Byrne, Oliner, and Sichel (2013). 3 For the 1500 nanometer process introduced in the early 1980s, the data indicate that Intel sold chips based on this technology two years before the process was used anywhere in the industry, an obvious inconsistency. Fortunately,
4
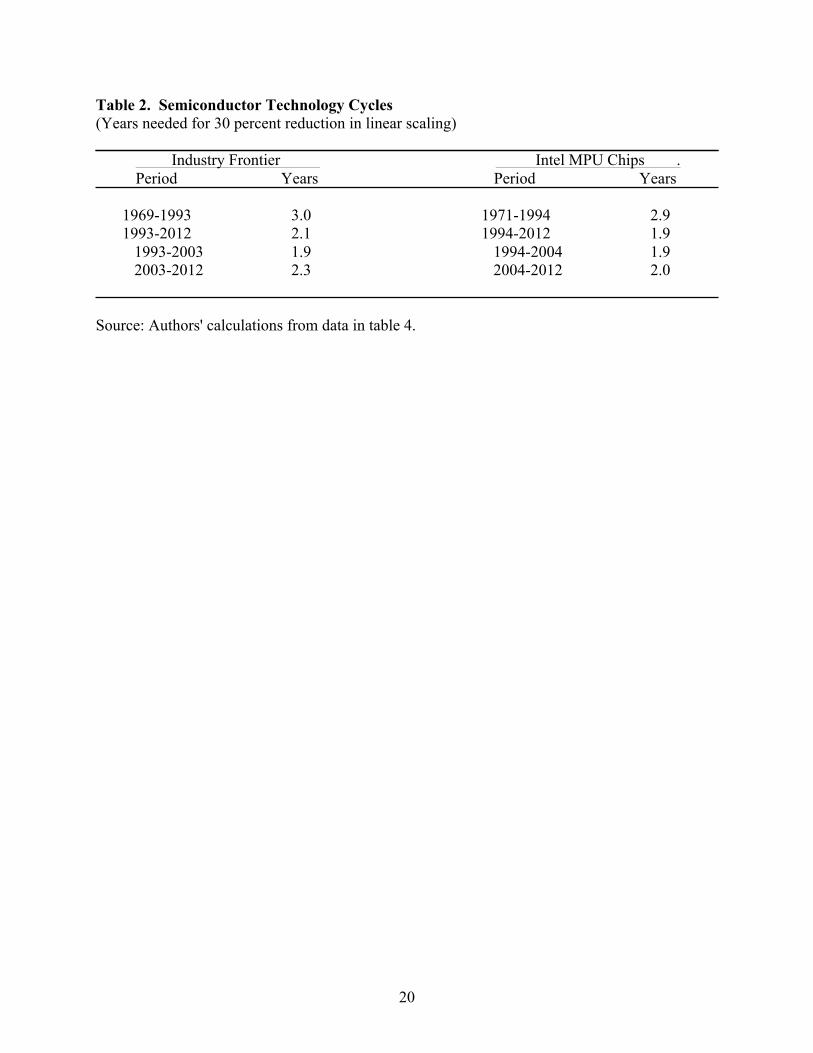
Given these introduction dates, table 2 reports the average length of the technology cycle
(as defined above) for various periods. For the industry as a whole, the technology cycle
averaged three years until 1993 and then dropped to about two years from 1993 to 2012. Within
the later period, the scaling advances were especially rapid from 1993 to 2003 and a bit slower
after 2003. Even so, the average cycle since 2003 has remained substantially shorter than the
three-year cycle in effect before the 1990s. For Intel's MPU chips, there has been no pullback at
all from the two-year cycle. The upshot is that the cycles in semiconductor technology ― a key
driver of quality improvement in IT products ― have remained rapid.
While the pace of miniaturization has been sustained, semiconductor producers have
changed the approach used to translate these engineering gains into faster performance.
Historically, each new generation of technology in semiconductors has allowed for an increase in
the number of basic calculations performed per second for a given chip design. However, as
speed continued to increase, dissipating the generated heat became problematic. In response,
Intel shifted around 2006 toward raising “clockspeed” more slowly and boosted performance
instead by placing multiple copies of the core architecture on each chip — a change enabled by
smaller feature size — and by improving the design of those cores (see Shenoy and Daniel,
2006).
The effect of this strategy on the rate of increase in performance for end users has been a
matter of some debate. Pillai (2013) examines the record and presents evidence that scores for
Intel MPUs on benchmark performance tests—based on standard tasks designed to reflect the
needs of computer users—rose more slowly from 2001 to 2008 than in the 1990s. Our own
extension of his results to more recent data suggests that the rate of performance improvement
this problem has no effect on the average length of the technology cycles that we present below because the average length depends only on the frontier technology at the beginning and end of the period under consideration, and there are no inconsistencies in these endpoint values.
5
over 2001-08 persisted through 2012 without any further slowdown.4 Over the full period from
2001 to 2012, our results show that the end-user performance of Intel’s MPU chips improved
roughly 30 percent per year on average. End users have continued to see substantial gains in
performance, just not the extraordinary rate of increase recorded in the 1990s.
It is possible, of course, that improvements in the engineering frontier are not translating
into MPU prices. Perhaps the cost of achieving these advances began rising more quickly after
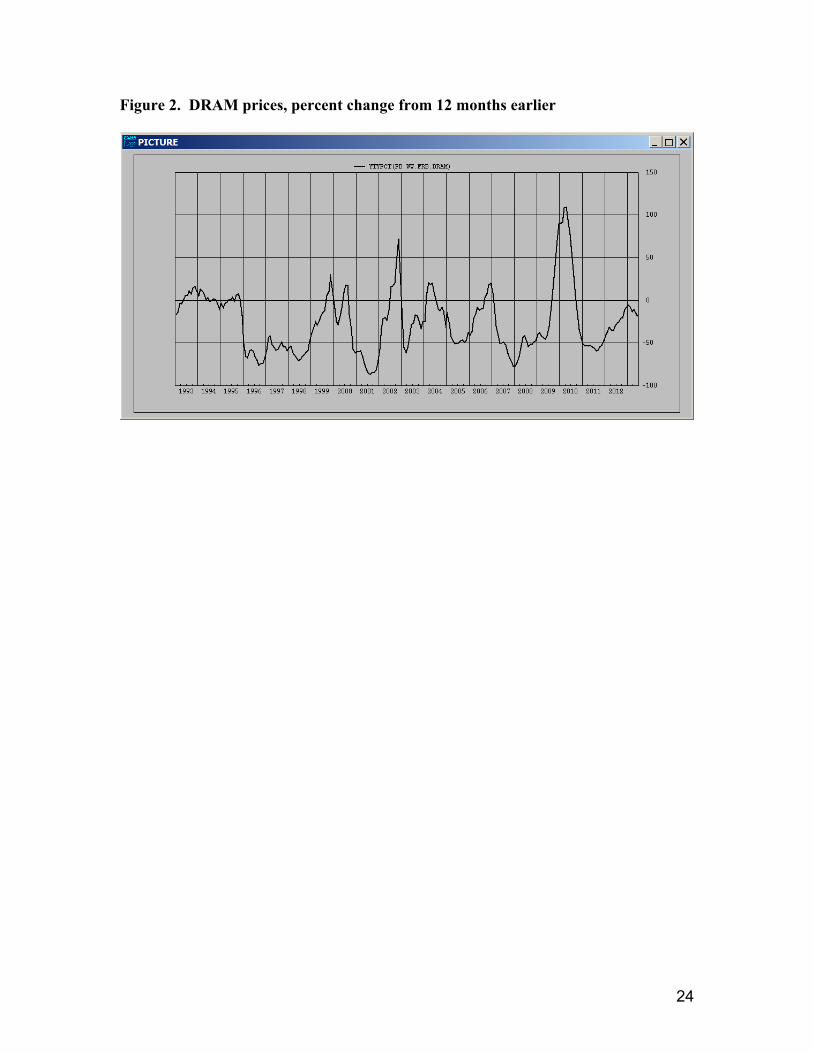
2006. Although we do not have direct evidence on this point for MPUs, it is not true for memory
chips (DRAMs), for which bit density is the most important characteristic.5 Figure 2 shows
percent changes in prices of DRAMs from 1993 to early 2013. As can be seen, DRAM prices do
not appear to exhibit a trend break in their rate of decline around 2006. At least for DRAMs,
there does not appear to have been a break in the translation of engineering advances to prices.
Given this evidence that quality of MPUs continued to improve after 2006, the shift to
much slower price declines in the PPI is something of a puzzle. We next consider the possibility
that changes in the properties of Intel’s posted prices after 2006 could have distorted the
measurement of price trends in the PPI.
Pricing patterns. Between 2003 and 2006, the properties of Intel’s posted prices for
semiconductors changed dramatically.6 Prior to 2003, the price of a specific Intel MPU model
tended to drop fairly rapidly in the year or two following its introduction especially once a new,
higher performance model became available. By 2006, this pattern had completely changed; the
price of a specific model tended to remain essentially flat after its introduction, even after a new,
4 We used SPEC performance data for this analysis. We accessed the data on December 5, 2012 and used the benchmark suite SPEC® CPU2006. 5 Flamm (1993) discusses characteristics of DRAM chips. 6 While the BLS does not indicate which company’s prices are included in the PPI for MPUs, it is only reasonable to assume that Intel is included given its dominant market position. Moreover, it appears that BLS has been, at least in part, using Intel’s posted prices for MPUs (see Holdway (2001)).
6
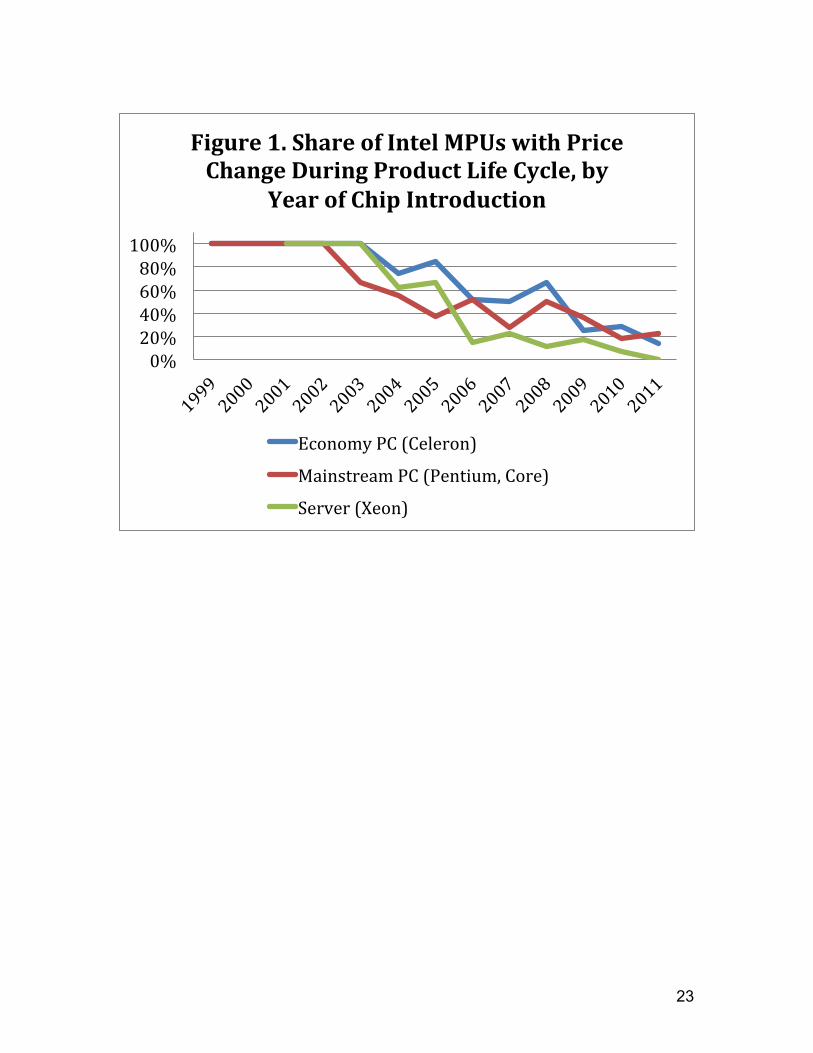
higher performance model became available at a similar price. Figure 1 highlights the dramatic
shift in pricing behavior, showing the share of Intel MPU models by year of introduction that
experienced a price change during its life cycle.7 As shown, all of the models introduced from
1999 to 2002 experienced at least one change in price. The share of chips with a price change
then fell dramatically over the next several years. Among the chips introduced in 2010 and 2011
― the final cohorts in the figure ― less than a quarter have had any change in their posted
prices.
As noted above, around 2006 Intel shifted toward the use of multiple processors (cores)
on a chip to boost performance.8 Nosko (2010) focuses on the introduction of the Core 2 Duo
model in that year; with this innovation, Intel pulled ahead of rival AMD in a decisive way.
Moreover, as Nosko describes, Intel dramatically changed its innovation and pricing strategy
around this time. From this point forward, Intel introduced new models throughout its product
line rather than at the top its product line and changed its pricing strategy as shown in figure 1.
Connecting these changes in the industry to Intel’s posted prices is challenging. Nonetheless,
these changes indicate that something important happened in MPU industry in the mid-2000s
that may have consequences for price measurement.
It is possible that Intel’s posted prices after 2006 are less reflective of actual transactions
prices than in earlier years. The basis for this conjecture is simple. The posted prices indicate
that, in many periods when a new, more powerful MPU model had been introduced into the
market, buyers would pay roughly the same price for an older, less powerful model. That
outcome would require either that buyers place little or no value on greater performance or that,
somehow, barriers prevented transitions to newer, more powerful models. We find it unlikely
7 These data are described below. 8 See Pillai (2013), Shenoy and Daniel (2006), and Thompson (2012).
7
that, in a mature market, models of significantly different quality would sell for roughly the same
price for an extended period of time.
If Intel's posted prices did, in fact, become less representative of transaction prices, this
could have reflected Intel's efforts to price discriminate more actively among different classes of
buyers after 2006, when the company attained a much stronger market position vis-a-vis its chief
competitor, AMD. For example, Intel’s (unchanging) posted prices could have applied to small
and medium sized purchasers, while Intel might have offered large buyers of MPUs
progressively larger discounts on older models as they aged and as newer, more powerful chips
became available in the market. Of course, Intel may have been offering discounts before, but
this scenario envisions that Intel began offering time-varying discounts to some buyers that got
larger as specific models got older. This scenario could rationalize the apparent puzzle of
models with different performance selling in the market at the same time at the same posted
price. [Fill in details.]
Another possibility is that posted prices are representative of transaction prices but that
the volume of sales of older models dropped off dramatically. If so, it would be essential to have
model-level sales data so as to be able to construct a weighted price index that down weights
older, lower performance models. [At this point, we do not have shipments or sales data at the
model level; we’re pursuing one lead on this.]
From a price measurement perspective, the dramatic shift in the pattern of pricing raises
some important questions for measuring quality-adjusted prices of MPUs.9 Do these post-2006
prices reflect actual transactions prices or did the nature of posted “prices” change around 2006?
If measurement error is present, and these prices do not fully reflect transactions prices, what
9 For models of pricing and innovation behavior in the MPU industry, see Aizcorbe and Kortum (20xx), Nosko (2010), and Pillai (2013).

8
approaches for developing quality-adjusted price measures are preferable? Alternatively, if the
post-2006 prices do reflect transaction prices, what approaches for measuring quality-adjusted
prices are preferable? The next section investigates the properties of matched-model and
hedonic indexes in a post-2006 pricing environment.
3. Matched-Model or Hedonic?
As noted, the change in the pattern of Intel’s posted prices for MPUs raises important questions
for price measurement. In this section, we argue that the change in the pattern of Intel’s posted
prices could cause significant biases in a matched-model index (like the PPI) and that hedonic
indexes are preferred. We also argue that, given the current pricing environment, it is useful to
consider approaches that focus only on prices in the first period of a model’s introduction.
First, we consider a standard unweighted matched-model index. (As noted above, we do
not have model-level quantity weights so are considering unweighted indexes.) We refer to this
unweighted matched-model index as a PPI-like matched-model index because it is constructed in
a manner similar to the procedure used by the BLS for the MPU price index.
Second, we consider two variants on a hedonic price index.10 Consider a dummy variable
10 We also considered the imputation approach to constructing hedonic indexes. That approach is appealing because it does not constrain the hedonic coefficients to be the same in every period and it provides flexibility to choose any price index formula. We may still try this but have not yet done so for two reasons. First, we will be focusing on hedonic regressions that only use prices in the period of a model’s introduction. That setup does not seem readily amenable to imputation methods. Second, our sample size is small enough that we would have too few observations to run reliable cross-section hedonic regressions in every period.
9
specification for a matched-model index:
ln( Pi,t ) = !! + Σk βkX k,i,t + Σt dtDi,t + εi,t
where Pit is the price of chip i in period t, Xkit is the value of characteristic k for chip i in period t,
Dit is a vector of time dummy variables that equals 1 if chip i is observed at time t and zero
otherwise, and εit is an error term.
The first variant of this hedonic regression uses all of the price observations in our
sample. The second variant only uses prices for chips in their first period of introduction. This
procedure follows an approach used in the 1980s for constructing hedonic price indexes for
mainframe computers at a time that there was concern that IBM list prices might not be actual
transaction prices.11
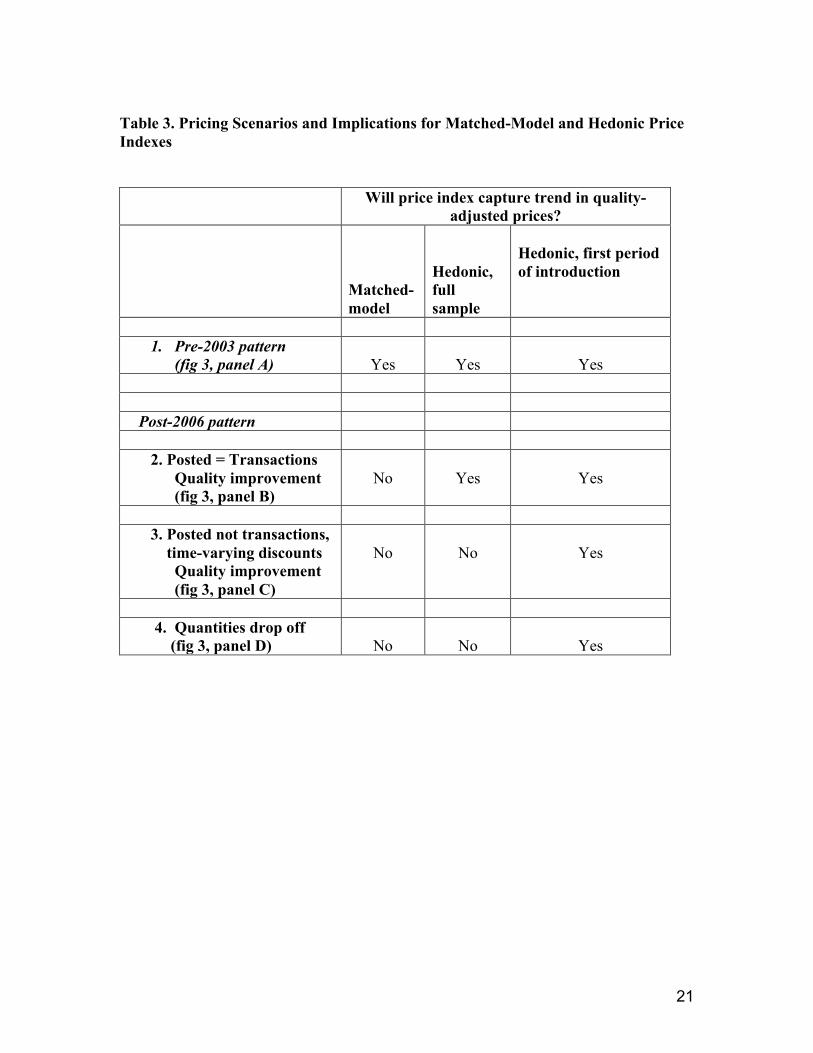
How well would these variants (matched model, full-sample hedonic, and introduction-
period hedonic) measure trends in quality-adjusted prices under different explanations for the
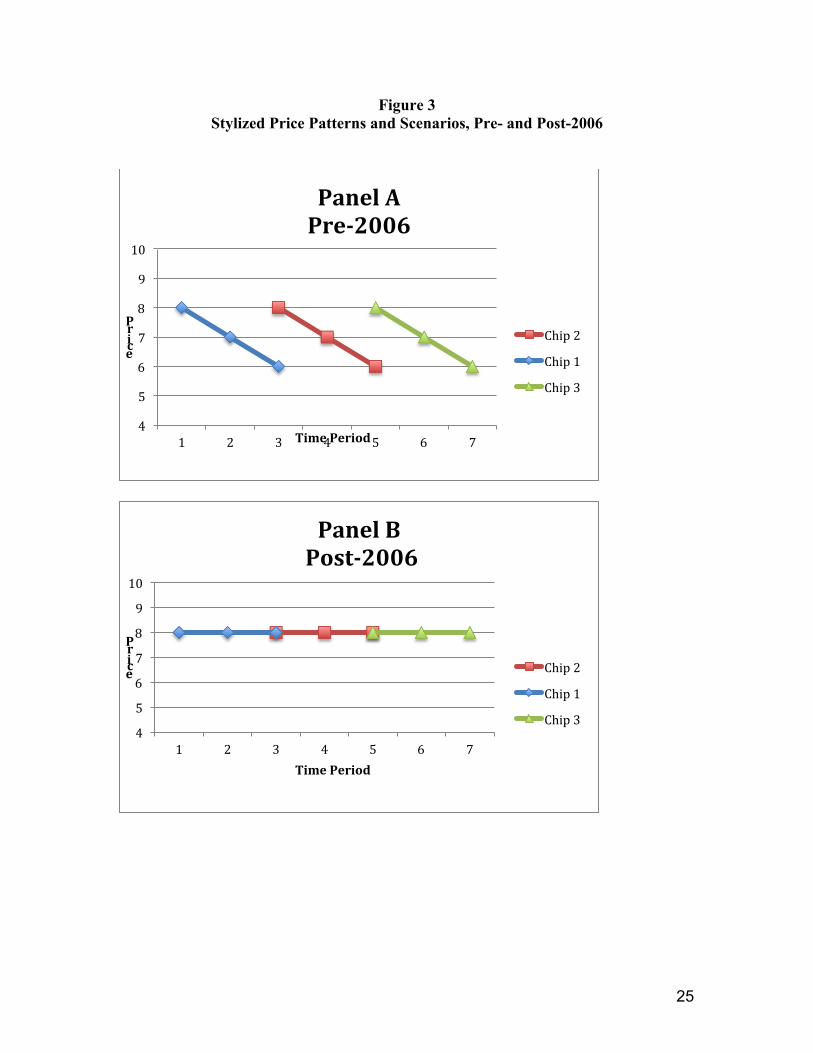
shift in the pattern of Intel’s posted prices after 2006? These scenarios are highlighted in figure
3, using highly stylized representations of pricing patterns. In these figures, each model is in the
market for three periods, and we assume that each successive model is of higher quality than the
prior model. Our assessment of the performance of different price indexes under each of these
scenarios is summarized in table 3.
We start with the pricing pattern before 2003 (figure 3, panel A). In this scenario, where
prices fall as a model ages, all three price index variants could capture changes in quality-
adjusted prices. For the matched-model index, we need to assume that markets are in
equilibrium such that price-performance ratios are at least roughly equalized across models. In
that case, the gap between model prices in periods when two models are in the market would
11 See Dulberger (1986).
10
represent quality change, and a matched-model index would correctly adjust for this quality
change. For the hedonic indexes, both the full-sample and introduction-period indexes should
adequately capture quality change provided that an appropriate measure of quality is available to
include on the right-hand side of the hedonic equation. This favorable assessment of all three
indexes is designated in table 3 by the “Yes” entries in the first row.
Now, consider the post-2006 pattern of posted prices. Suppose that these prices actually
represent transactions prices and that prices of new models enter the market at the same price
that exiting models leave the market. Further, assume that quality improvement is ongoing so
that each successive model is higher quality than the prior model (figure 3, panel B). In this
scenario, a matched-model index would go seriously astray. It would indicate that prices had not
changed because the price of individual models never changes. However, this index would
completely miss the ongoing quality improvement because two models of different quality are,
apparently, in the market at the same time at the same price. In contrast, both variants of the
hedonic indexes would correctly capture the quality improvement and would deliver an
appropriate measure of quality-adjusted prices. (Again, assuming that an appropriate measure of
quality is available.)
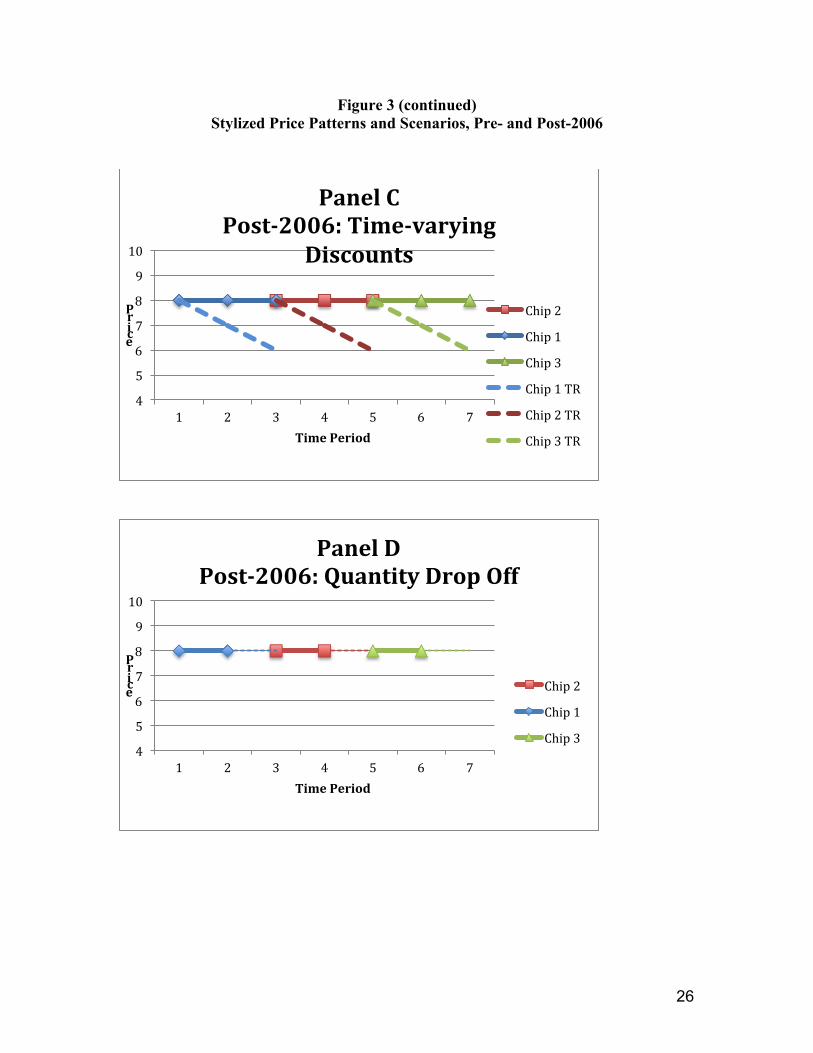
Panel C of figure 3 illustrates the time-varying discounts scenario in which posted prices
do not represent transactions prices. In Panel C, the solid lines of each color show posted prices
for a series of three Intel models, highlighting that posted prices remained flat following a
model’s introduction. The dashed lines show actual transactions prices faced by large
purchasers; these prices fall for each model following its introduction as large buyers receive
bigger discounts as the model ages and new higher performance models become available.
11
However, these prices are unobservable. All we have at this point is Intel’s posted prices.12 In
this scenario, a matched-model index would do fine if actual transactions prices (the dashed lines
in the figure) were observable. But, a matched-model index based on the observable posted
prices would go astray because it would not capture the improvement in quality in successive
models. (See line 3 of table 3.)
In the time-varying discount scenario shown in panel C, a full-sample hedonic index
based on observable posted prices would not be ideal because the posted prices are measured
with error. Actual transaction prices of each model are falling over time but a full-sample
hedonic index would not account for this measurement error. Accordingly, estimates of quality-
adjusted price change from a full-sample hedonic index likely would be biased (line 3).
If the time-varying discount story in panel C is right, then the implicit measurement error
could be handled by the introduction-period variant of the hedonic index.13 In this approach, the
hedonic regression is estimated only using prices of models in their period of introduction. The
performance variables in the hedonic regression would control for improvements in quality in
successive models and the price observations measured with error would be excluded from the
regression and the calculation of the index. Thus, the introduction-period hedonic index would
deliver an appropriate quality-adjusted price index (line 3). We illustrate this point with a simple
simulation exercise. [Not included in this draft.]
Panel D of figure 3 illustrates the scenario in which posted prices do not change, but the
quantity purchased of a specific model drops off as the model get older and face competition
12 Getting actual transactions prices is complicated. The contracts between Intel and purchases are complex and have many dimensions so extracting the true transaction price would be very difficult, even if we had full information about these contracts. 13 Of course, for the introduction-price hedonic to deliver the right index it must be the case that at the time of introduction the transaction price and the list price coincide or that the discounts on models at introduction does not vary across models or time.
12
from newer, more powerful models with lower quality-adjusted prices. If we had data on
quantities, a shipments- or sales-weighted index would account for the declining importance of
the older model. However, we do not have model (chip) level quantity data. Accordingly, we
are forced to consider price indexes that put equal weight on every price observation. In panel
D, the solid, heavier line represents the early, high-quantity part of each model’s life cycle and
the dashed, thinner line represents the later part when sales have dropped.
Under our assumption that quality is improving over time, an unweighted matched-model
and a full-sample hedonic index would be problematic as they would put too much weight on
price observations for which there were few transactions. On the other hand, the introduction-
period hedonic would be preferable, provided that prices at introduction corresponded to
transactions prices or that discounts at introduction did not vary across time or model (line 4 of
table 3). These latter assumptions may or may not be right, but the introduction-period hedonic
seems more likely to capture the trend in quality-adjusted prices in this scenario than would an
unweighted matched-model index or a full-sample hedonic index. (Of course, if we are able to
get model-level quantity data, and if the posted prices accurately represented transaction prices
over the chip's life cycle, there would be no reason to prefer the introduction-period hedonic
index.)
As we consider the assessments in table 3, we are drawn to the introduction-period
hedonic index. Given the post-2006 pricing pattern, the matched-model index seems
problematic. It would appear to be unbiased in the post-2006 period only if the performance of
successive models is not improving over time, a situation that is contradicted by the evidence
discussed above about the engineering frontier. The hedonic indexes appear more promising. In
the scenarios in which Intel’s posted prices reflect actual transactions prices, the full-sample and
13
the introduction-period hedonic indexes have the potential to deliver unbiased measures of
quality-adjusted prices. However, the introduction-period variant seems preferred in a scenario
in which Intel’s posted prices do not reflect actual transactions prices, such as in the time-varying
discount scenario we described above. The introduction-period variant also seems preferred
given that the lack of data on model-level shipments limits the analysis to unweighted indexes.
4. Data
• We are using posted wholesale price lists from Intel for MPUs used in desktop computers
from 1999 to 2012. We also have begun to analyze data on MPUs going into servers.
Those results will be incorporated into the next draft of the paper.
• Even though our sample size is small, we have data on the full universe of models
introduced by Intel.
• Information on the relative quality of the chips came from measures of MPU
performance for specific representative tasks estimated by the System Performance
Evaluation Corporation (SPEC), a non-profit corporation that publishes these measures as
a service to the technology industry and user communities. These data are the benchmark
performance data referred to above.
5. Specification of the Hedonic Regressions
We ran separate regressions for the 2000-2006 and 2006-2012 periods because the definition of
the variable measuring performance (SPEC) differs across the two periods as the benchmarks
were updated to be more appropriate for later model desktop PCs. The price indexes from the
two periods were spliced together to generate the price index spanning the full period from 2000-
14
2012. In both periods, we ran the hedonic regression on all prices and also just on prices in the
first period in which a model was introduced.
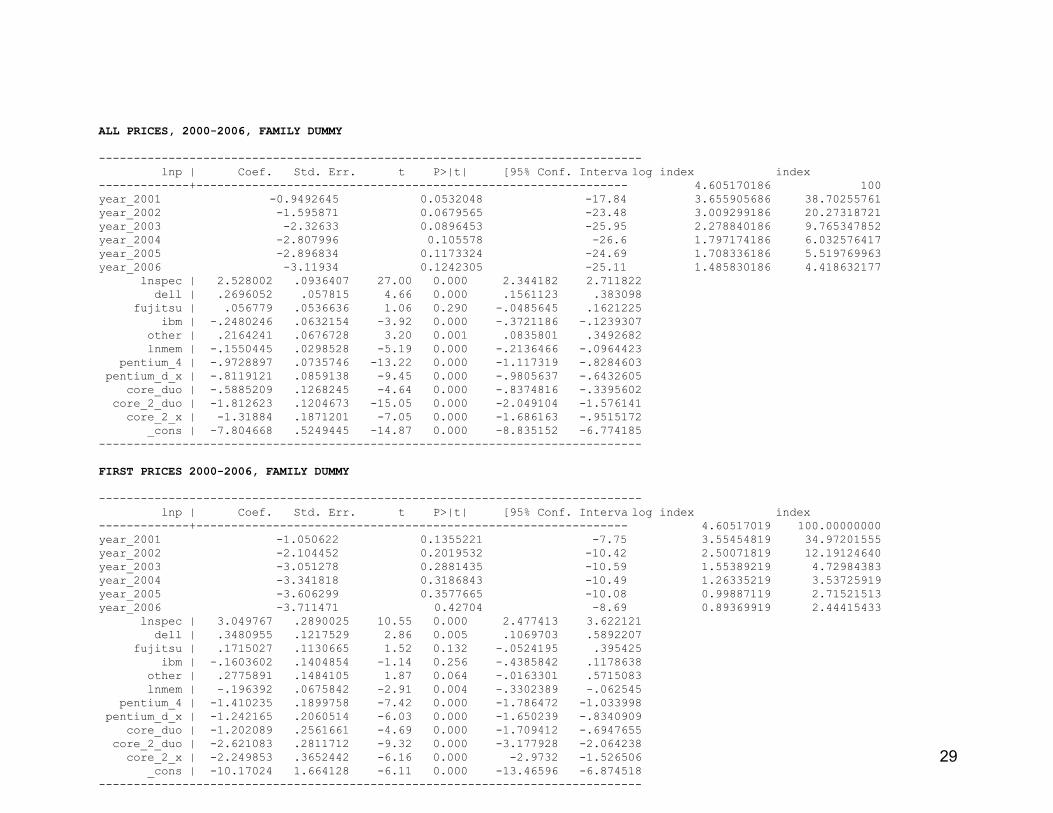
In the earlier period, we regress ln(P) on a constant, year dummies, the performance
measure ln(SPEC), a dummy variable for the manufacturer of the PC on which the benchmark
performance test was completed (includes Dell, Fujitsu, IBM, and all others), ln(memory) of the
PC on which the performance test was completed, and an Intel chip family dummy (including
Pentium 4, Pentium DX, Core Duo, Core 2 Duo, and Core 2X).
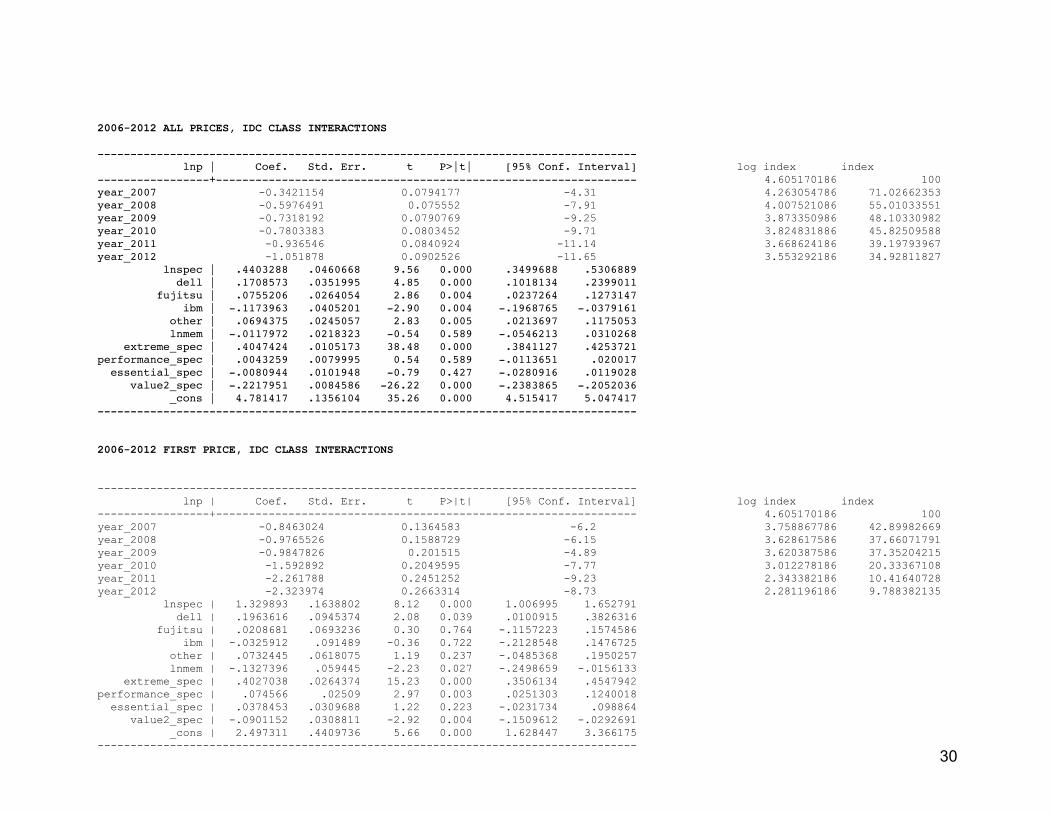
The specification for 2006-12 differs slightly from that for the earlier period. We add
interaction terms between the performance variable (ln SPEC) and dummy variables for the
performance class of a chip as identified by the consulting firm IDC. The five performance
classes (Extreme, Performance, Essential, Mainstream, and Value) indicate the capabilities of the
chip relative to others in the market at that time. As chips age, IDC moves chips down to lower
performance classes. This specification allows the value attached to incremental increases in
performance to differ across the classes of chips. With the inclusion of these interactions, we
drop the dummy variables for the Intel chip families, which are a cruder proxy for the segment of
the market in which the chip resides. We would have liked to use the 2006-12 specification for
the earlier period as well; however, the IDC performance classifications are only available
starting in 2006.
6. Results
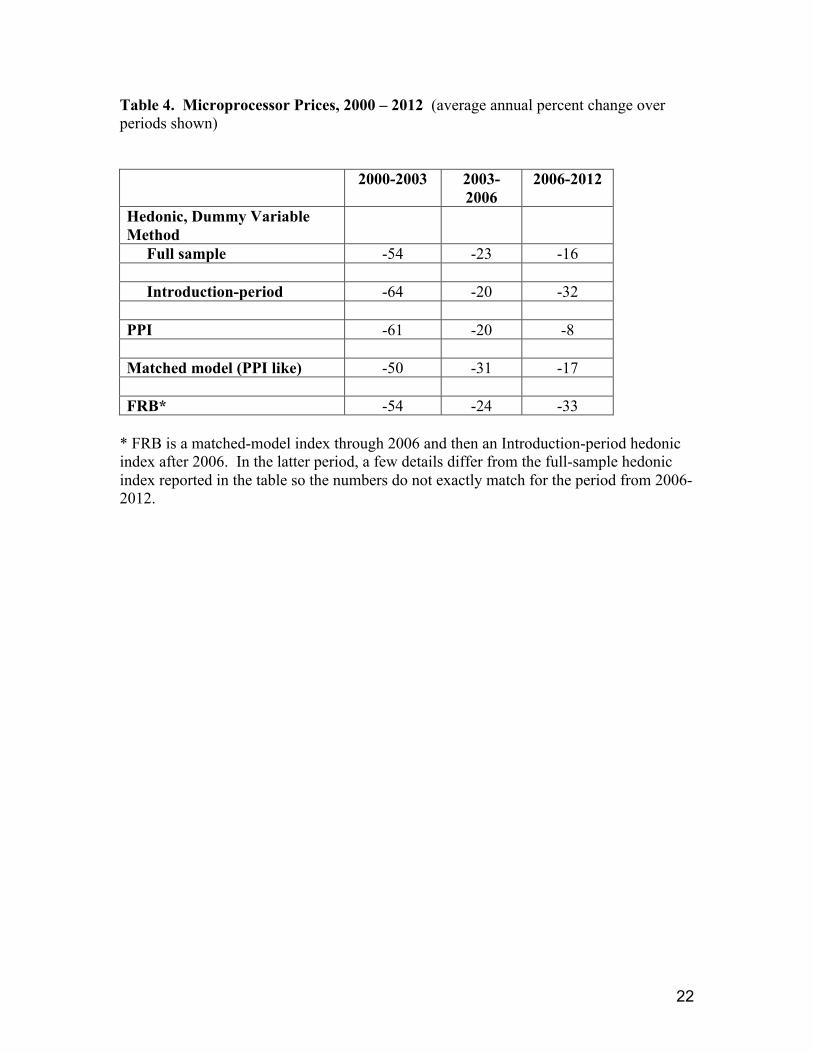
Table 4 shows percent changes over selected periods for several MPU price indexes: the full-
sample hedonic index, the introduction-period hedonic index, the official PPI, a matched-model
index we estimated, and the Federal Reserve Board’s index. (The regression output for the full-
15
sample and introduction-period hedonic indexes are reported in appendix tables. These tables
also report levels of our indexes.)
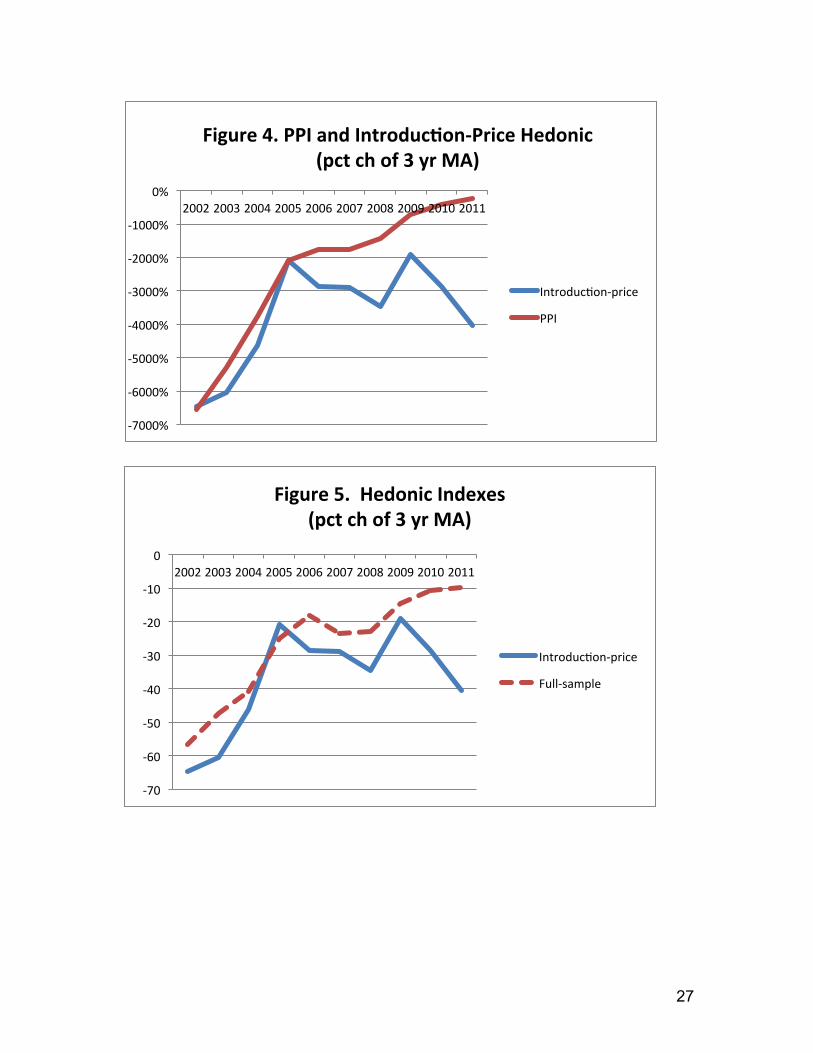
Figure 4 plots percent changes in our preferred introduction-price hedonic index and the
PPI. Figure 5 plots percent changes in our preferred introduction-price hedonic index and the
full-sample hedonic index. In these two charts we smooth the data to make the trends more
visible; we take a three-year centered moving average of the series and then construct percent
changes from that smoothed series.
Summary of Key Results:
• The official PPI shows a dramatic slowdown in rates of price decline for MPUs. As
shown in table 4 and figure 4, the PPI fell rapidly from 1999 to 2003 (61 percent per year
on average) and then the rate of decline slowed; the index fell at an average annual rate of
20 percent from 2003 to2006 and then at only an 8 percent pace over 2006-2012. This
index provides the basis of the observation that MPU prices are no longer falling rapidly.
• We can largely replicate trends in the PPI using a matched-model index calculated
with the posted Intel prices. We estimated a matched-model index on the Intel list prices
for MPUs. These estimates are shown in the line labeled “Matched model (PPI like).”
We refer to it this way because the matched-model procedure roughly follows the PPI
procedure, although, undoubtedly, our data differ. As shown in table 4, this index
captures the broad pattern of the PPI over 2000-12, although the slowdown in the rate of
price decline is not as sharp as in the PPI.
• In the period before 2003, all of the indexes show very rapid declines in MPU prices.
This is the outcome suggested by the scenario analysis summarized in figure 3 and table
16
3. That is, with Intel’s ubiquitous re-pricing of existing chips before 2003, the matched-
model, full-sample hedonic, and introduction-period hedonic indexes all would capture
the change in quality-adjusted prices. These patterns are evident in table 4 and figures 4
and 5.
• In the transition period from 2003 to 2006, all of the indexes also show the same trend
in MPU prices. They all indicate a slowdown in the rate of price decline, and the extent
of the slowing is similar for all of the indexes. This pattern is evident in table 4 and in
figures 4 and 5.
• However, since 2006, the indexes show very different trends, with the introduction-
period hedonic showing notably more rapid price declines than the other indexes. As
reported in table 4, the PPI reports a decline of just 8 percent per year in quality-adjusted
MPU prices (and our matched-model index shows a similar pattern). The full-sample
hedonic index exhibits a decline of 16 percent. However, the introduction-period hedonic
index falls 32 percent per year in this period. This pattern is clearly evident in figures 4
and 5 as well.
• The pattern across price indexes is what would be expected under the post-2006 pricing
scenarios discussed in this paper. The analysis described in table 3 and figure 3
indicates that, under a number of scenarios, the introduction-period hedonic index would
be preferred and would more completely adjust for quality changes in MPUs. And, the
faster rate of price decline exhibited by the introduction-period index follows this pattern.
• The rate of price decline exhibited by the introduction-period index after 2006 (32
percent) is about consistent with rate of performance improvement over this period as
measured by the benchmark performance tests reported above.

17
7. Conclusion
[To be written.]

18
References [Incomplete] Aizcorbe, Ana and Sumuel Kortum (2006), “Moore’s Law and the Semiconductor Industry: A Vintage Model,” Scandinavian Journal of Economics, vol. 107(4), p. 603-630, December. Aizcorbe, Ana, Stephen D. Oliner, and Daniel E. Sichel (2008), “Shifting Trends in Semiconductor Prices and the Pace of Technological Progress” Byrne, David M., Stephen D. Oliner, and Daniel E. Sichel (2013), “Is the Information Technology Revolution Over?” International Productivity Monitor, March. Cole, Roseanne, Y.C. Chen, Joan A. Barquin-Stolleman, Ellen Dulberger, Nurhan Halvacian, and James H. Hodge (1986), “Quality Adjusted Price Indexes for Computer Processors and Selected Peripheral Equipiment”, Survey of Current Business. Flamm, Kenneth (2006) “The Microeconomics of Microprocessor Innovation,” prepared for 2007 meeting of NBER-CRIW summer workshop Flamm, Kenneth (1993) “Measurement of DRAM Prices: Technology and Market Structure” in Price Measurements and their Uses UChicago Press. Holdway (2001), Michael, “An Alternative Methodology: Valuing Quality Change for Microprocessors in the PPI,” unpublished manuscript. Jorgenson, Dale (2001), “Information Technology and the U.S. Economy” American Economic Review Nosko, Christopher (2010), “Competition and Quality Choice in the CPU Market”, unpublished manuscript. Pillai, Uni (2013) “A Model of Technological Progress in the Microprocessor Industry”, forthcoming, Journal of Industrial Economics. Shenoy, Sunil R. and Akhilseh Daniel (2006), “Intel Architecture and Silicon Cadence: The Catalyst for Industry Inovation,” Intel white paper. Thompson (2012), “Moore’s Law Goes Multicore: The economic and strategic consequences of a fundamental change in how computers work,” Berkeley Haas School of Business, manuscript.
19
Table 1. Year of Introduction for New Semiconductor Technology Process Industry Intel (nanometers) Frontier MPU Chips
10,000 1969 1971 8000 1972 n.a. 6000 n.a. 1974 5000 1974 n.a. 4000 1976 n.a. 3000 1979 1979a 2000 1982 n.a. 1500 1984 1982 1250 1986 n.a. 1000 1988 1989 800 1990 1991 600 1993 1994 350 1995 1995 250 1997 1997 180 1999 1999 130 2001 2001 90 2003 2004 65 2005 2005 45 2007 2007 32 2010 2010
22 2012 2012 Source. Industry frontier: VLSI Research Inc. (2006) for the 65 nanometer and earlier processes and private correspondence with Dan Hutcheson (November 10, 2012) for the more recent processes. Intel MPU chips: http://www.intel.com/pressroom/kits/quickreffam.htm. a. Intel began making MPU chips with this process in 1979. We omitted Intel’s earlier use of the 3000 nanometer process (starting in 1976) to produce less complex devices, such as scales. n.a.: Not available.
20
Table 2. Semiconductor Technology Cycles (Years needed for 30 percent reduction in linear scaling) Industry Frontier Intel MPU Chips . Period Years Period Years 1969-1993 3.0 1971-1994 2.9 1993-2012 2.1 1994-2012 1.9 1993-2003 1.9 1994-2004 1.9 2003-2012 2.3 2004-2012 2.0
Source: Authors' calculations from data in table 4.
21
Table 3. Pricing Scenarios and Implications for Matched-Model and Hedonic Price Indexes Will price index capture trend in quality-
adjusted prices?
Matched-model
Hedonic, full sample
Hedonic, first period of introduction
1. Pre-2003 pattern
(fig 3, panel A)
Yes
Yes
Yes Post-2006 pattern 2. Posted = Transactions
Quality improvement (fig 3, panel B)
No
Yes
Yes
3. Posted not transactions, time-varying discounts
Quality improvement (fig 3, panel C)
No
No
Yes
4. Quantities drop off (fig 3, panel D)
No
No
Yes
22
Table 4. Microprocessor Prices, 2000 – 2012 (average annual percent change over periods shown) 2000-2003 2003-
2006 2006-2012
Hedonic, Dummy Variable Method
Full sample -54 -23 -16 Introduction-period -64 -20 -32 PPI -61 -20 -8 Matched model (PPI like) -50 -31 -17 FRB* -54 -24 -33
* FRB is a matched-model index through 2006 and then an Introduction-period hedonic index after 2006. In the latter period, a few details differ from the full-sample hedonic index reported in the table so the numbers do not exactly match for the period from 2006-2012.
23
0%#20%#40%#60%#80%#100%#
Figure'1.'Share'of'Intel'MPUs'with'Price'Change'During'Product'Life'Cycle,'by'
Year'of'Chip'Introduction'
Economy#PC#(Celeron)#Mainstream#PC#(Pentium,#Core)#Server#(Xeon)#
24
Figure 2. DRAM prices, percent change from 12 months earlier
25
Figure 3 Stylized Price Patterns and Scenarios, Pre- and Post-2006
4#
5#
6#
7#
8#
9#
10#
1# 2# 3# 4# 5# 6# 7#
Price&
Time'Period''
Panel'A'PreE2006'
Chip#2#Chip#1#Chip#3#
4#5#6#7#8#9#10#
1# 2# 3# 4# 5# 6# 7#
Price&
Time'Period''
Panel'B''PostE2006''
Chip#2#Chip#1#Chip#3#
26
Figure 3 (continued) Stylized Price Patterns and Scenarios, Pre- and Post-2006
4#5#6#7#8#9#10#
1# 2# 3# 4# 5# 6# 7#
Price&
Time'Period''
Panel'C'PostE2006:'TimeEvarying'
Discounts'
Chip#2#Chip#1#Chip#3#Chip#1#TR#Chip#2#TR#Chip#3#TR#
4#5#6#7#8#9#10#
1# 2# 3# 4# 5# 6# 7#
Price&
Time'Period''
Panel'D'PostE2006:'Quantity'Drop'Off'
Chip#2#Chip#1#Chip#3#
27
!7000%%
!6000%%
!5000%%
!4000%%
!3000%%
!2000%%
!1000%%
0%%2002%2003%2004%2005%2006%2007%2008%2009%2010%2011%
Figure'4.'PPI'and'Introduc2on3Price'Hedonic'(pct'ch'of'3'yr'MA)'
Introduc6on!price%
PPI%
!70%
!60%
!50%
!40%
!30%
!20%
!10%
0%2002%2003%2004%2005%2006%2007%2008%2009%2010%2011%
Figure'5.''Hedonic'Indexes'(pct'ch'of'3'yr'MA)'
Introduc6on!price%
Full!sample%

28
Appendix Hedonic Regressions [Next pages]
29
ALL PRICES, 2000-2006, FAMILY DUMMY
------------------------------------------------------------------------------ lnp | Coef. Std. Err. t P>|t| [95% Conf. Interval]log index index-------------+---------------------------------------------------------------- 4.605170186 100year_2001 -0.9492645 0.0532048 -17.84 3.655905686 38.70255761year_2002 -1.595871 0.0679565 -23.48 3.009299186 20.27318721year_2003 -2.32633 0.0896453 -25.95 2.278840186 9.765347852year_2004 -2.807996 0.105578 -26.6 1.797174186 6.032576417year_2005 -2.896834 0.1173324 -24.69 1.708336186 5.519769963year_2006 -3.11934 0.1242305 -25.11 1.485830186 4.418632177 lnspec | 2.528002 .0936407 27.00 0.000 2.344182 2.711822 dell | .2696052 .057815 4.66 0.000 .1561123 .383098 fujitsu | .056779 .0536636 1.06 0.290 -.0485645 .1621225 ibm | -.2480246 .0632154 -3.92 0.000 -.3721186 -.1239307 other | .2164241 .0676728 3.20 0.001 .0835801 .3492682 lnmem | -.1550445 .0298528 -5.19 0.000 -.2136466 -.0964423 pentium_4 | -.9728897 .0735746 -13.22 0.000 -1.117319 -.8284603 pentium_d_x | -.8119121 .0859138 -9.45 0.000 -.9805637 -.6432605 core_duo | -.5885209 .1268245 -4.64 0.000 -.8374816 -.3395602 core_2_duo | -1.812623 .1204673 -15.05 0.000 -2.049104 -1.576141 core_2_x | -1.31884 .1871201 -7.05 0.000 -1.686163 -.9515172 _cons | -7.804668 .5249445 -14.87 0.000 -8.835152 -6.774185------------------------------------------------------------------------------
FIRST PRICES 2000-2006, FAMILY DUMMY
------------------------------------------------------------------------------ lnp | Coef. Std. Err. t P>|t| [95% Conf. Interval]log index index-------------+---------------------------------------------------------------- 4.60517019 100.00000000year_2001 -1.050622 0.1355221 -7.75 3.55454819 34.97201555year_2002 -2.104452 0.2019532 -10.42 2.50071819 12.19124640year_2003 -3.051278 0.2881435 -10.59 1.55389219 4.72984383year_2004 -3.341818 0.3186843 -10.49 1.26335219 3.53725919year_2005 -3.606299 0.3577665 -10.08 0.99887119 2.71521513year_2006 -3.711471 0.42704 -8.69 0.89369919 2.44415433 lnspec | 3.049767 .2890025 10.55 0.000 2.477413 3.622121 dell | .3480955 .1217529 2.86 0.005 .1069703 .5892207 fujitsu | .1715027 .1130665 1.52 0.132 -.0524195 .395425 ibm | -.1603602 .1404854 -1.14 0.256 -.4385842 .1178638 other | .2775891 .1484105 1.87 0.064 -.0163301 .5715083 lnmem | -.196392 .0675842 -2.91 0.004 -.3302389 -.062545 pentium_4 | -1.410235 .1899758 -7.42 0.000 -1.786472 -1.033998 pentium_d_x | -1.242165 .2060514 -6.03 0.000 -1.650239 -.8340909 core_duo | -1.202089 .2561661 -4.69 0.000 -1.709412 -.6947655 core_2_duo | -2.621083 .2811712 -9.32 0.000 -3.177928 -2.064238 core_2_x | -2.249853 .3652442 -6.16 0.000 -2.9732 -1.526506 _cons | -10.17024 1.664128 -6.11 0.000 -13.46596 -6.874518------------------------------------------------------------------------------
30
2006-2012 ALL PRICES, IDC CLASS INTERACTIONS
---------------------------------------------------------------------------------- lnp | Coef. Std. Err. t P>|t| [95% Conf. Interval] log index index-----------------+---------------------------------------------------------------- 4.605170186 100year_2007 -0.3421154 0.0794177 -4.31 4.263054786 71.02662353year_2008 -0.5976491 0.075552 -7.91 4.007521086 55.01033551year_2009 -0.7318192 0.0790769 -9.25 3.873350986 48.10330982year_2010 -0.7803383 0.0803452 -9.71 3.824831886 45.82509588year_2011 -0.936546 0.0840924 -11.14 3.668624186 39.19793967year_2012 -1.051878 0.0902526 -11.65 3.553292186 34.92811827 lnspec | .4403288 .0460668 9.56 0.000 .3499688 .5306889 dell | .1708573 .0351995 4.85 0.000 .1018134 .2399011 fujitsu | .0755206 .0264054 2.86 0.004 .0237264 .1273147 ibm | -.1173963 .0405201 -2.90 0.004 -.1968765 -.0379161 other | .0694375 .0245057 2.83 0.005 .0213697 .1175053 lnmem | -.0117972 .0218323 -0.54 0.589 -.0546213 .0310268 extreme_spec | .4047424 .0105173 38.48 0.000 .3841127 .4253721performance_spec | .0043259 .0079995 0.54 0.589 -.0113651 .020017 essential_spec | -.0080944 .0101948 -0.79 0.427 -.0280916 .0119028 value2_spec | -.2217951 .0084586 -26.22 0.000 -.2383865 -.2052036 _cons | 4.781417 .1356104 35.26 0.000 4.515417 5.047417----------------------------------------------------------------------------------
2006-2012 FIRST PRICE, IDC CLASS INTERACTIONS
---------------------------------------------------------------------------------- lnp | Coef. Std. Err. t P>|t| [95% Conf. Interval] log index index-----------------+---------------------------------------------------------------- 4.605170186 100year_2007 -0.8463024 0.1364583 -6.2 3.758867786 42.89982669year_2008 -0.9765526 0.1588729 -6.15 3.628617586 37.66071791year_2009 -0.9847826 0.201515 -4.89 3.620387586 37.35204215year_2010 -1.592892 0.2049595 -7.77 3.012278186 20.33367108year_2011 -2.261788 0.2451252 -9.23 2.343382186 10.41640728year_2012 -2.323974 0.2663314 -8.73 2.281196186 9.788382135 lnspec | 1.329893 .1638802 8.12 0.000 1.006995 1.652791 dell | .1963616 .0945374 2.08 0.039 .0100915 .3826316 fujitsu | .0208681 .0693236 0.30 0.764 -.1157223 .1574586 ibm | -.0325912 .091489 -0.36 0.722 -.2128548 .1476725 other | .0732445 .0618075 1.19 0.237 -.0485368 .1950257 lnmem | -.1327396 .059445 -2.23 0.027 -.2498659 -.0156133 extreme_spec | .4027038 .0264374 15.23 0.000 .3506134 .4547942performance_spec | .074566 .02509 2.97 0.003 .0251303 .1240018 essential_spec | .0378453 .0309688 1.22 0.223 -.0231734 .098864 value2_spec | -.0901152 .0308811 -2.92 0.004 -.1509612 -.0292691 _cons | 2.497311 .4409736 5.66 0.000 1.628447 3.366175----------------------------------------------------------------------------------