Embed Size (px)
Citation preview

DATA COLLECTION VIEWGRAPH 1
The issue is not: How do we collect data?
It is: How do we obtain useful data?
What Is Data Collection?
Data Collection
is
obtaining useful information.

DATA COLLECTION VIEWGRAPH 2
Why Collect Data?
To estabish a factual basis
for making decisions
I think the problem is . . .
becomes
The data indicate the problem is . . .

DATA COLLECTION VIEWGRAPH 3
If . . . then . . .
Making a Data Collection Plan
Why do we want the data?
What purpose will they serve?
Formulate your change statement:

DATA COLLECTION VIEWGRAPH 4
Making a Data Collection Plan
Where will we collect the data?
• Refer to the process Flowchart
• Identify steps where you expect changes
• Take data at those steps and at the end of the process
DATA COLLECTION VIEWGRAPH 5
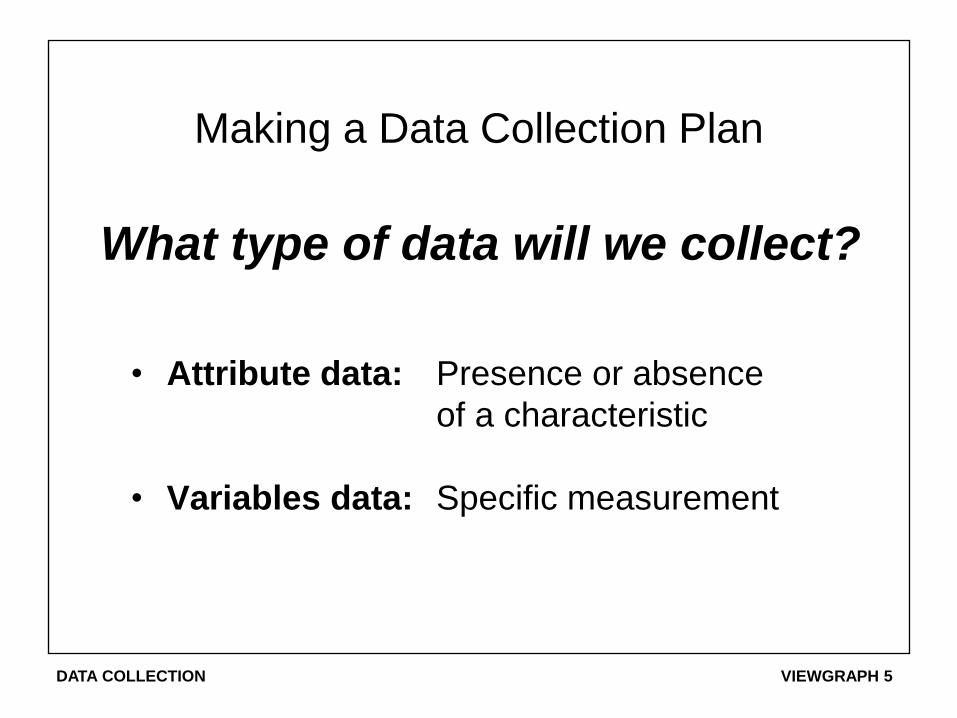
Making a Data Collection Plan
• Attribute data: Presence or absence
of a characteristic
• Variables data: Specific measurement
What type of data will we collect?
DATA COLLECTION VIEWGRAPH 6
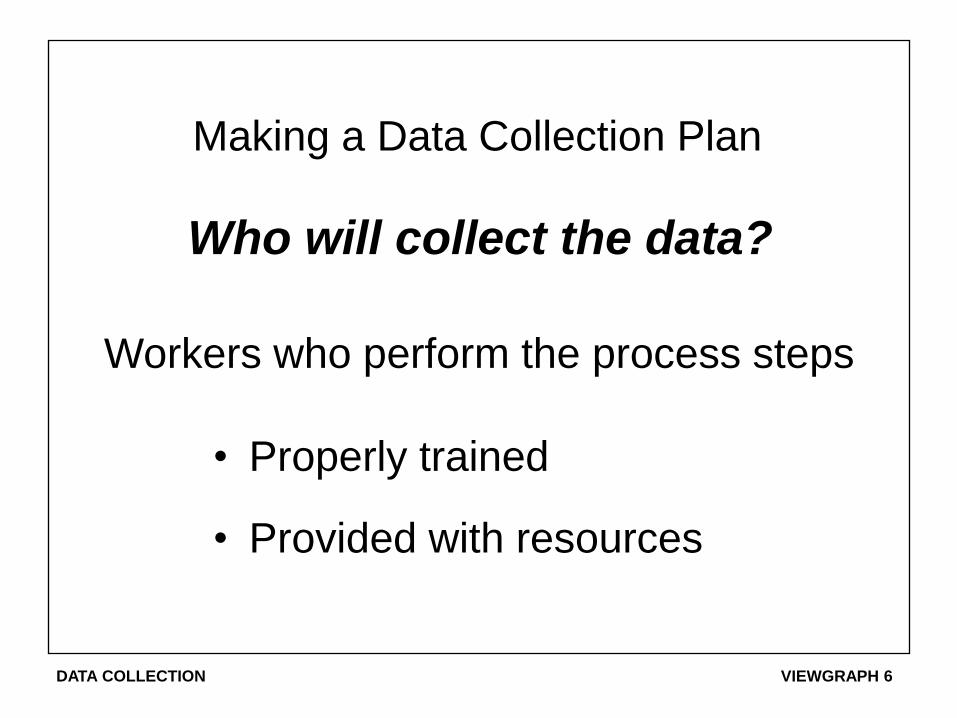
Who will collect the data?
Making a Data Collection Plan
• Properly trained
• Provided with resources
Workers who perform the process steps

DATA COLLECTION VIEWGRAPH 7
Making a Data Collection Plan
• Small sample sizes
• Collect frequently
• Dependent on availability
of data, cost, consequences
How do we collect the right data?
DATA COLLECTION VIEWGRAPH 8
Data Collection Problems
Failure to establish Operational Definitions
• When and how often to collect data
• How to collect data
• Units of measurement
• Criteria for defects
• Handling of multiple defects

DATA COLLECTION VIEWGRAPH 9
Data Collection Problems
Adding bias to the collection process
• Slowdown or speedup
• Fear
• Errors in procedures
• Missing data

DATA COLLECTION VIEWGRAPH 10
Uses for Checksheets
• Record data for further analysis
• Provide historical record
• Introduce Data Collection methods

DATA COLLECTION VIEWGRAPH 11
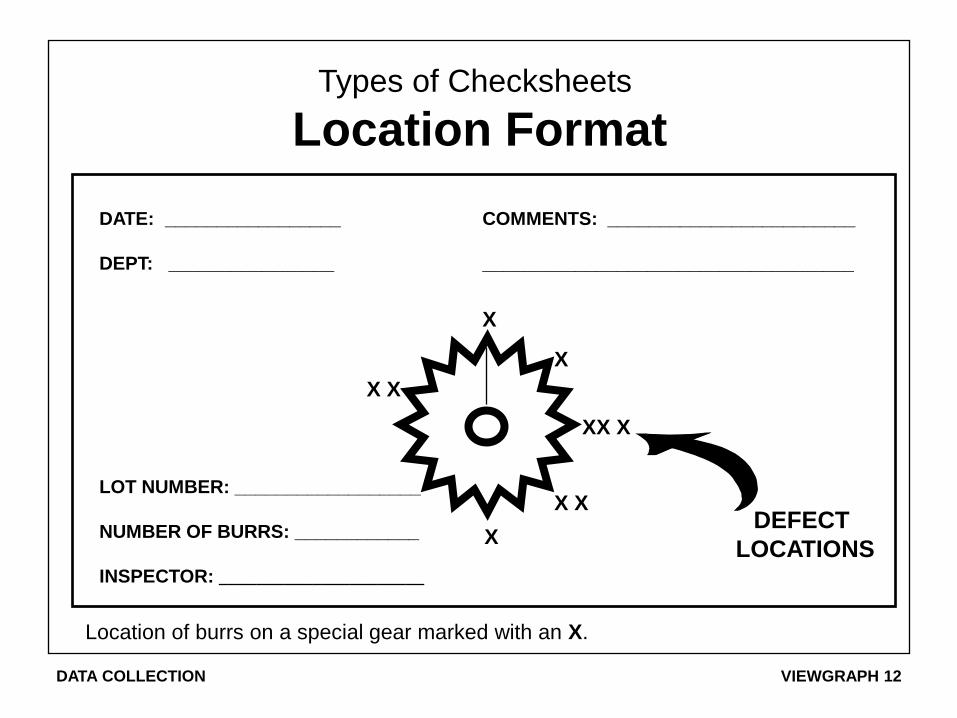
Types of Checksheets
Tabular Format
JULY 94
DEFECT 12 13 14 15 16 17 18 TOTAL
WRONG NSN || | || | | | 8
FAULTY MATERIAL | || | | 5
PMS NOT DONE || ||| || ||| | ||| || 16
INSTALL PROBLEMS | | 2
DATA COLLECTION VIEWGRAPH 12
DATE: _________________ COMMENTS: ________________________
DEPT: ________________ ____________________________________
LOT NUMBER: __________________
NUMBER OF BURRS: ____________
INSPECTOR: ______________________
X
X
XX X
X X
X X
X DEFECT
LOCATIONS
Types of Checksheets
Location Format
Location of burrs on a special gear marked with an X.
DATA COLLECTION VIEWGRAPH 13
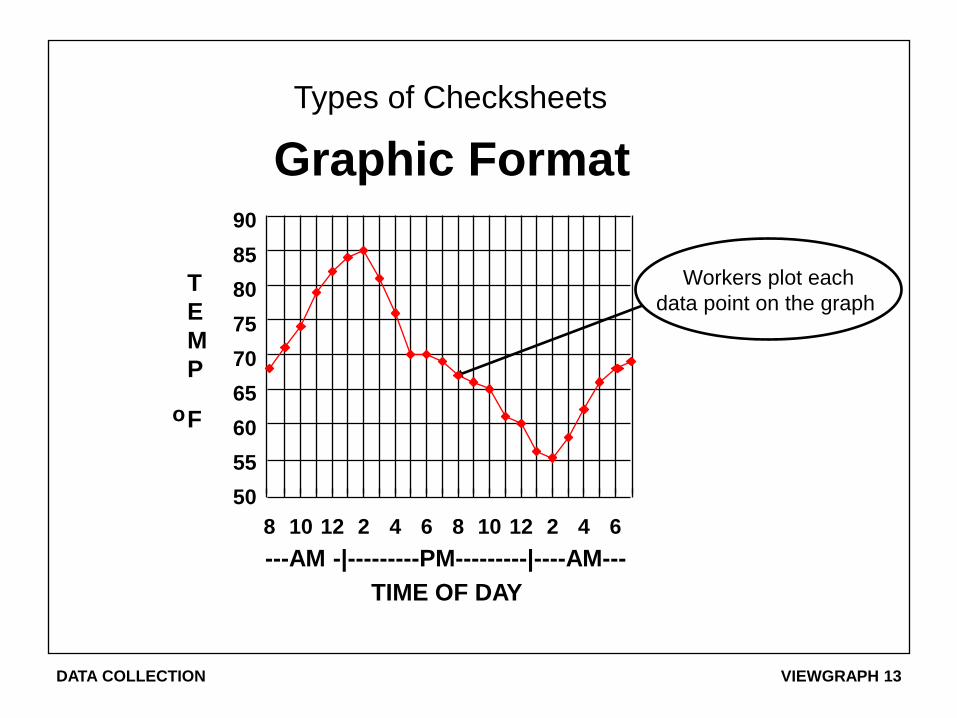
TIME OF DAY
---AM -|---------PM---------|----AM---
T
E
M
P F
Workers plot each
data point on the graph
50
55
60
65
70
75
80
85
90
8 10 12 2 4 6 8 10 12 2 4 6
Graphic Format
Types of Checksheets
o
DATA COLLECTION VIEWGRAPH 14
Making a Useful Checksheet
• Tailored for specific purpose
• Workers help develop form
• Columns labeled clearly
• User-friendly format
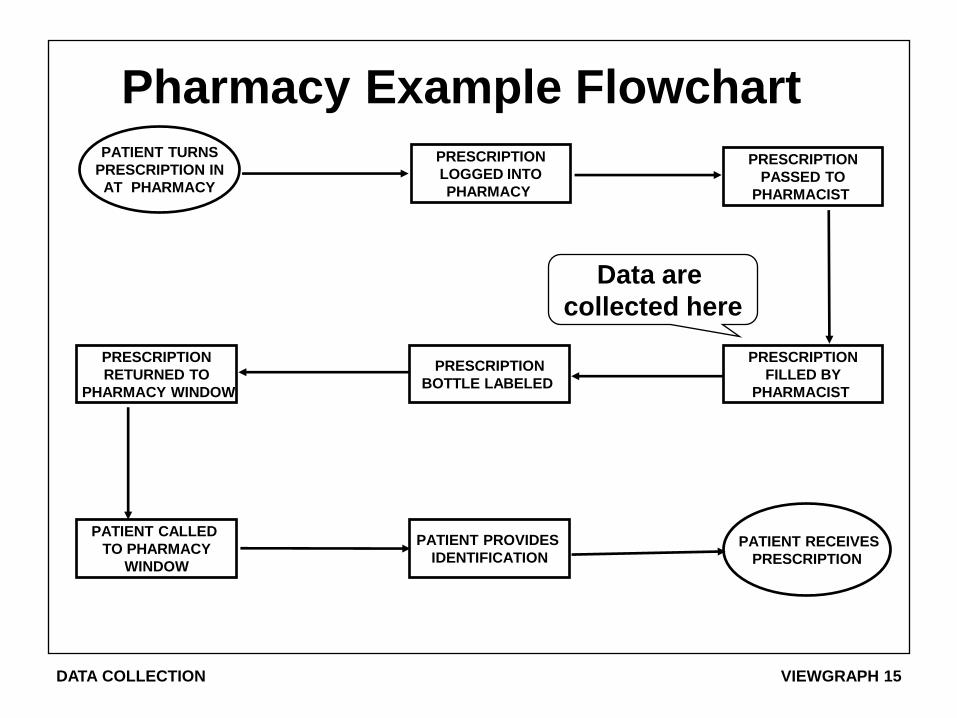
DATA COLLECTION VIEWGRAPH 15
Pharmacy Example Flowchart PATIENT TURNS
PRESCRIPTION IN
AT PHARMACY
PRESCRIPTION
LOGGED INTO
PHARMACY
PRESCRIPTION
PASSED TO
PHARMACIST
PRESCRIPTION
FILLED BY
PHARMACIST
PRESCRIPTION
BOTTLE LABELED
PRESCRIPTION
RETURNED TO
PHARMACY WINDOW
PATIENT CALLED
TO PHARMACY
WINDOW
PATIENT PROVIDES
IDENTIFICATION PATIENT RECEIVES
PRESCRIPTION
Data are
collected here

DATA COLLECTION VIEWGRAPH 16
Time
(Mins)
LEGEND: MAKALAPA NAVMEDCLINIC - 16 July 94 - Elapsed time to fill prescription - 1 every 30 mins
0
5
10
15
20
25
8 9 10 11 12 13 14 15 16 17 18 19
Pharmacist annotates
on the checksheet the
time (in mins) it takes
to fill the prescription.
Time of Day
Time to fill prescription
Time for pharmacist’s actions
Pharmacy Example Checksheet

DATA COLLECTION VIEWGRAPH 17
Equipment is
offloaded from
the vehicles
Equipment is
uncrated
Equipment is
positioned at
surveyed location
Equipment is
interconnected
electrically
Individual pieces
of equipment are
tested
Full system testing
is completed
Gateway Example Flowchart
Data are
collected here

DATA COLLECTION VIEWGRAPH 18
LEGEND: Elapsed time (in mins) to uncrate equipment - 19 August 94 - MCBH Kaneohe Bay, Hawaii
Gateway Example Checksheet
UNCRATING (IN MINS) TOTAL TIME (IN MINS)
160-179
180-199
200-219
220-239
240-259
260-279
280-299
300-319
320-339
340-359
360-379
0550-0599
0600-0649
0650-0699
0700-0749
0750-0799
0800-0849
0850-0899
0900-0949
0950-0999
1000-1049
1050-1099

DATA COLLECTION VIEWGRAPH 19
YARDS FROM THE TARGET COUNTS
-180 YDS to -120 YDS
-120 YDS to -060 YDS
-060 YDS to 000 YDS
000 YDS to 060 YDS
060 YDS to 120 YDS
120 YDS to 180 YDS
180 YDS to 240 YDS
240 YDS to 300 YDS
300 YDS to 360 YDS
360 YDS to 420 YDS
Checksheet Example
Data taken: USS CROMMELIN (FFG-37) at PMRF, 135 RDS BL&P, Mount 31, 25 June 94
MOUNT 31 GUNEX DATA

DATA COLLECTION VIEWGRAPH 20
04 08 12 16 20 24 28 32 36 00 0
4
6
8
10
12
14
16
18
20
2
PERCENT BODY FAT
X XX
XX XX XX XX XX XX XX XX XX XX
XX XX XX XX XX XX XX XX XX XX
XX XX XX XX XX XX XX XX XX XX
XX XX XX XX XX
X XX XX
X X
DATA COLLECTORS
SIMPLY PLACE AN X
ON THE CHECKSHEET
Checksheet Example
22
Data taken: USS LEADER (MSO-490), all 80 personnel assigned, 25 June 94
NU
MB
ER
OF
PE
RS
ON
NE
L
BODY FAT DATA

DATA COLLECTION VIEWGRAPH 21
Checksheet Example GEAR DEFECT DATA
I.D. Size Wrong
O.D. Size Wrong
Nicks
Burrs
Tooth Geometry
Blemishes
Other
Total 3 5 2 3 5 3 3 3 2 3 6 38
5
1
12
9
2
8
1
l l ll l
l
ll ll ll ll l l ll
l l l
l
l
l l l l ll
l
ll l l
l
l ll
Defect Category 0700 0800 0900 1000 1100 1200 1300 1400 1500 1600 1700 TOTAL
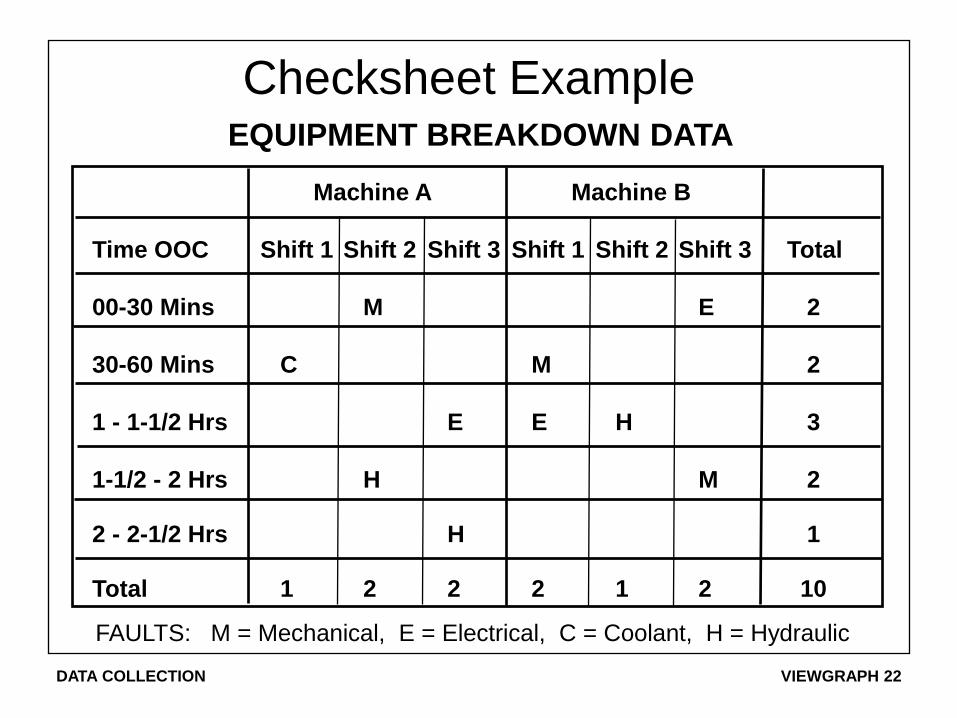
DATA COLLECTION VIEWGRAPH 22
Checksheet Example EQUIPMENT BREAKDOWN DATA
FAULTS: M = Mechanical, E = Electrical, C = Coolant, H = Hydraulic
Machine A Machine B
Time OOC Shift 1 Shift 2 Shift 3 Shift 1 Shift 2 Shift 3 Total
00-30 Mins M E 2
30-60 Mins C M 2
1 - 1-1/2 Hrs E E H 3
1-1/2 - 2 Hrs H M 2
2 - 2-1/2 Hrs H 1
Total 1 2 2 2 1 2 10