Embed Size (px)
Citation preview
What is a Number?
History 5011

Numbers and Comparisons
• A single number is not meaningful in isolation
• Knowing that a medieval king had 10,000 soldiers would not by itself tell us anything about his military strength—it all depends if the next kingdom has 5,000 or 20,000
• Meaningful comparisons are always based on comparison of some kind.

Implicit Comparisons
• In 2003 my wife had 355 students in Hist 1301.
• That is meaningful to me because I have a frame of reference: I know how big other classes are, and I have ideas about how big they should be.

0
100
200
300
2003 2008 2013
Enrollment in History 1301 by Year

0
100
200
300
400
500
1998 2003 2008 2013
Enrollment in History 1301 by Year

Isolated counts are meaningless
• Always must have comparison
• Never rely on implicit comparison: audience may have different reference groups in mind (is 350 a low number?)
• Comparison should be explicit
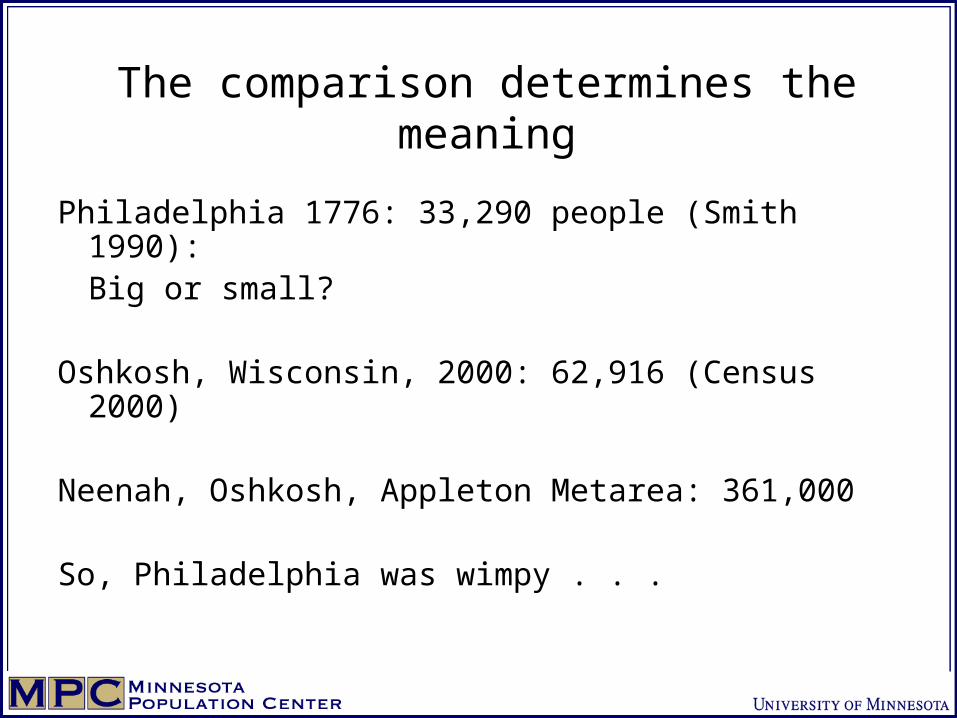
The comparison determines the meaning
Philadelphia 1776: 33,290 people (Smith 1990):Big or small?
Oshkosh, Wisconsin, 2000: 62,916 (Census 2000)
Neenah, Oshkosh, Appleton Metarea: 361,000
So, Philadelphia was wimpy . . .
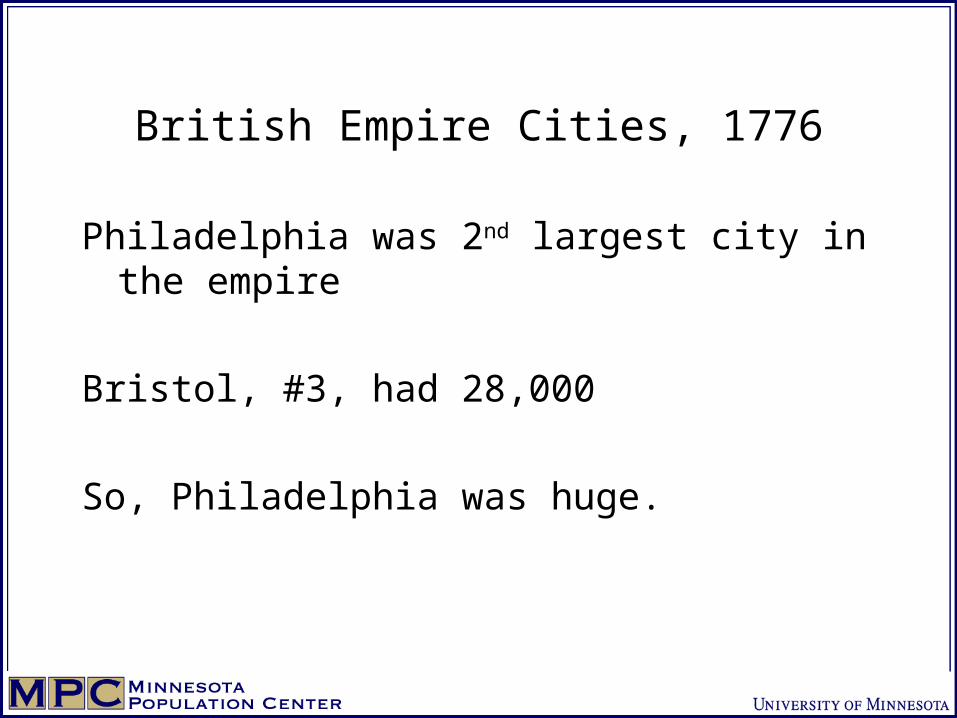
British Empire Cities, 1776
Philadelphia was 2nd largest city in the empire
Bristol, #3, had 28,000
So, Philadelphia was huge.
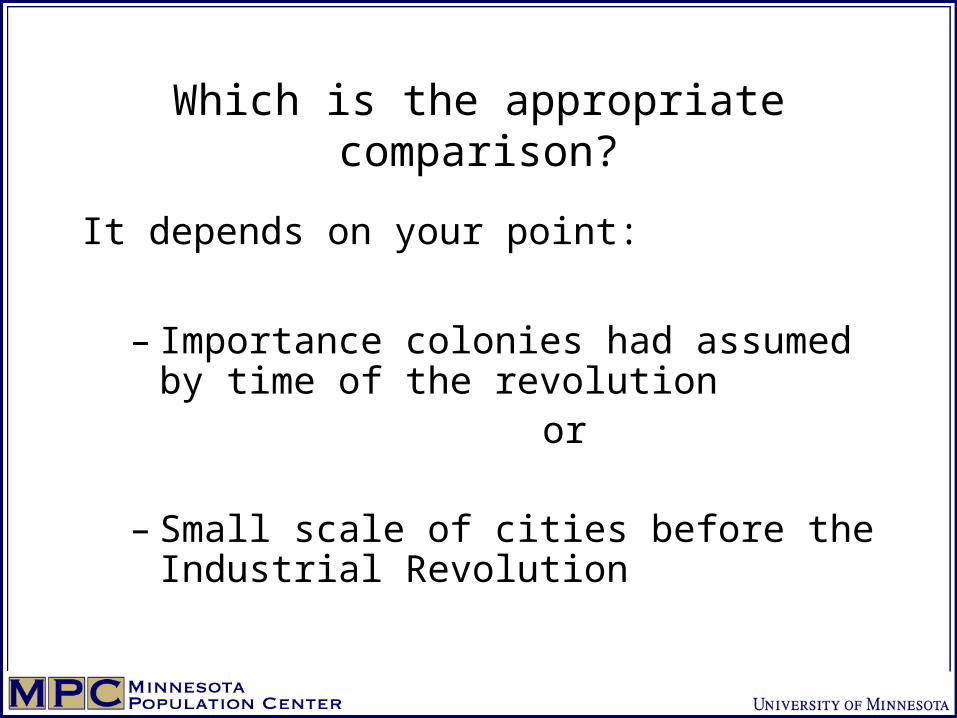
Which is the appropriate comparison?
It depends on your point:
– Importance colonies had assumed by time of the revolution
or
– Small scale of cities before the Industrial Revolution

Quantitative Comparisons
Compare Philadelphia to Boston in 1790 Census
Philadelphia: 28,522
Boston: 18,320
Subtraction: 28,000-18,000=10,000
But: is 10,000 big or small?

Absolute differences depend on size of base
Bangalore, 2000: 5,430,000
St. Petersburg, 2000: 5,420,000
So we need to size of the base to evaluate
Significance of 10,000 population difference
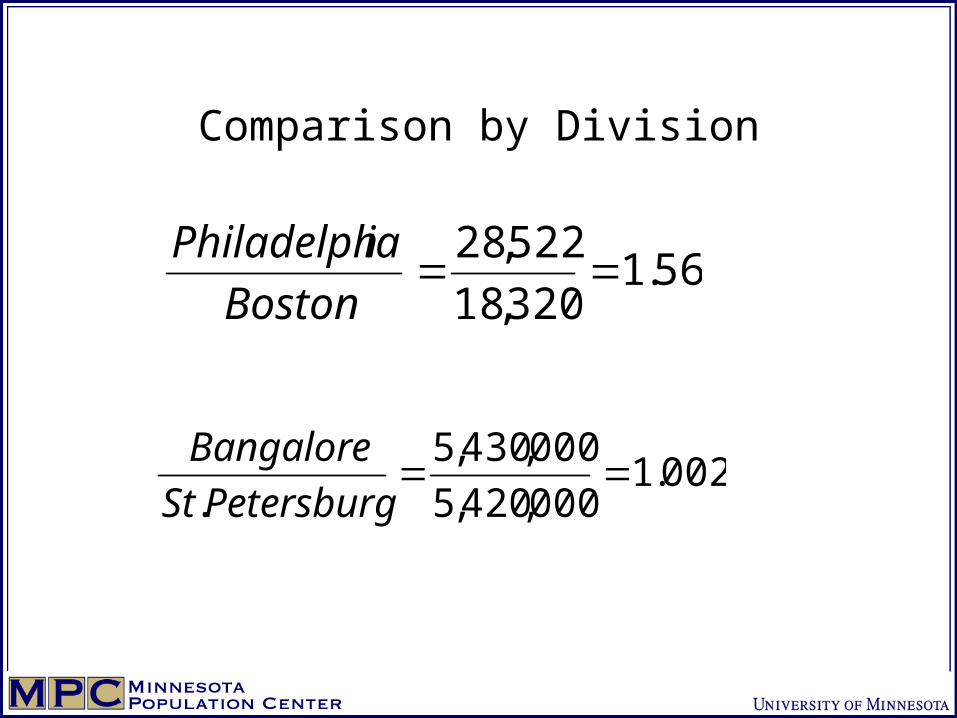
Comparison by Division
56.1320,18
522,28
Boston
iaPhiladelph
002.1000,420,5
000,430,5
.
PetersburgSt
Bangalore
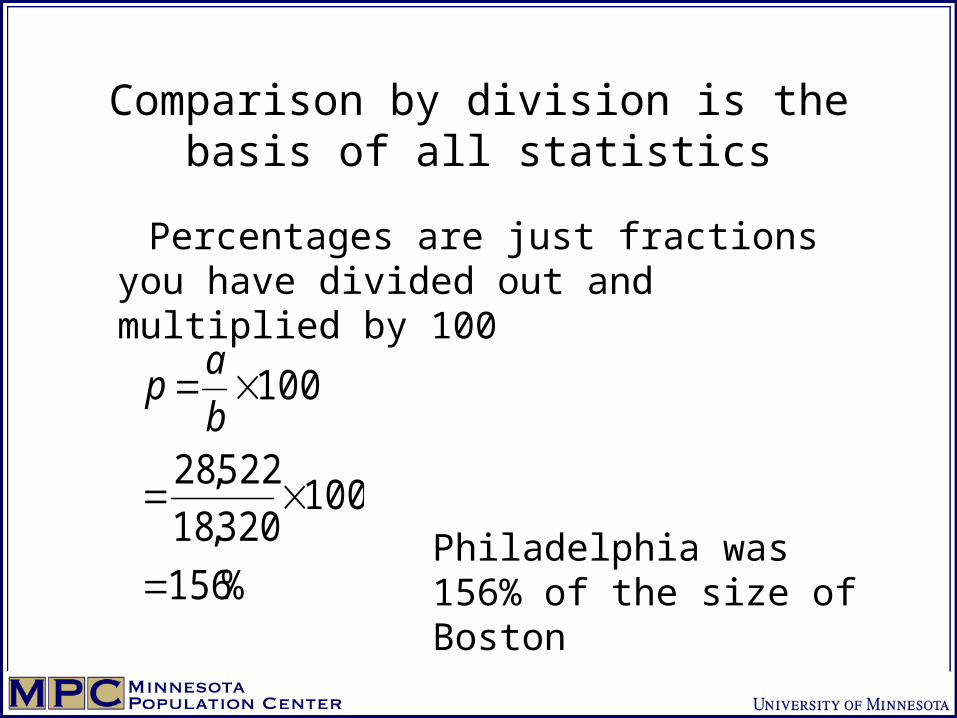
Comparison by division is the basis of all statistics
Percentages are just fractions you have divided out and multiplied by 100
%156
100320,18
522,28
100
b
ap
Philadelphia was 156% of the size of Boston
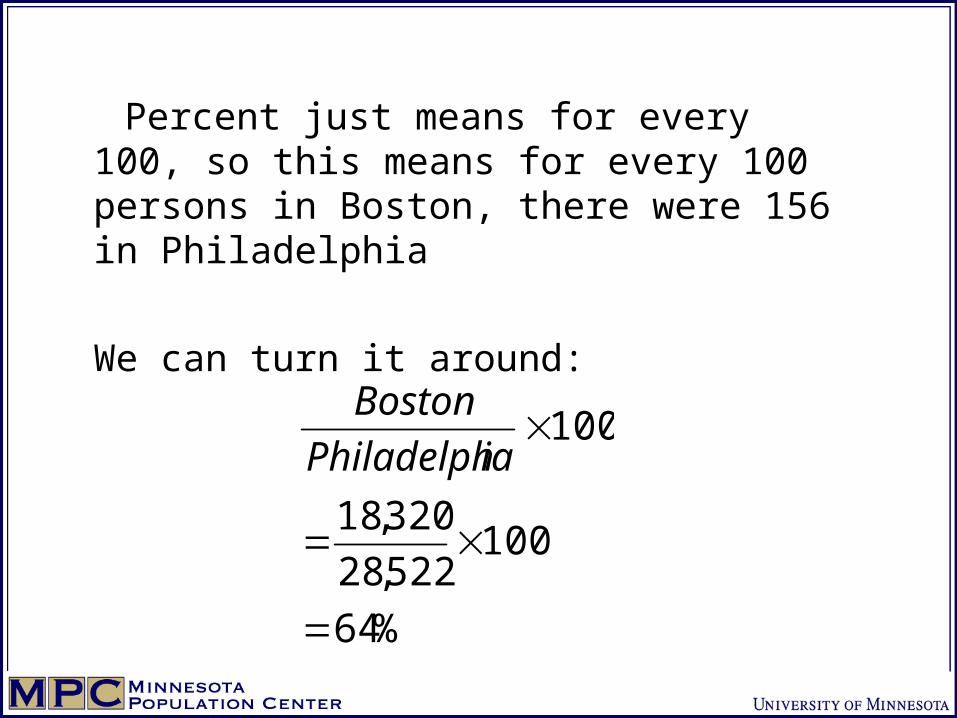
Percent just means for every 100, so this means for every 100 persons in Boston, there were 156 in Philadelphia
We can turn it around:
%64
100522,28
320,18
100
iaPhiladelph
Boston
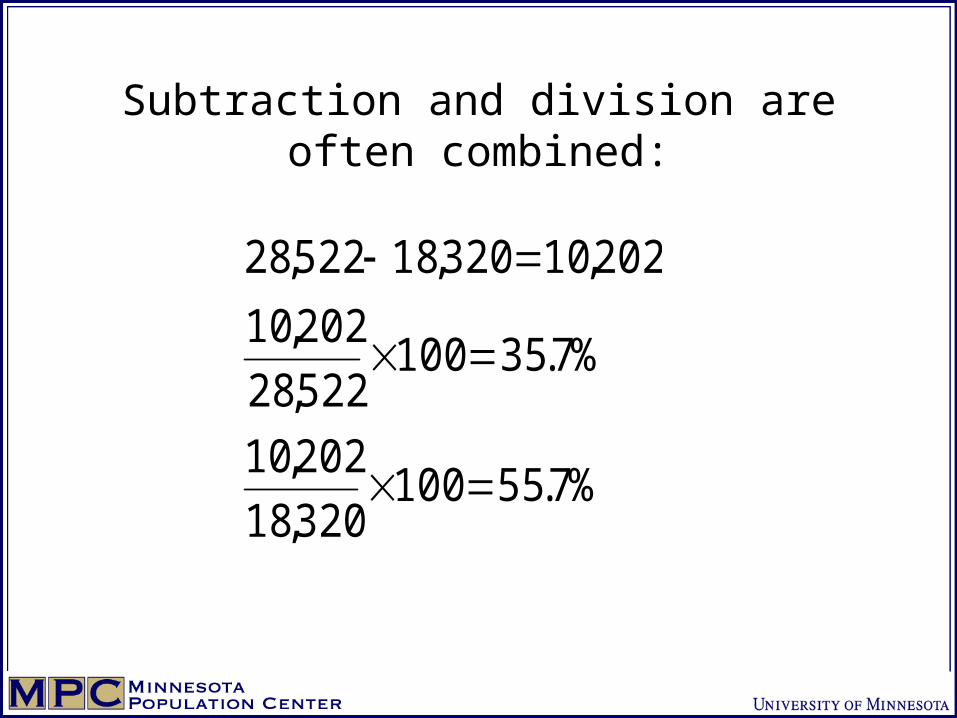
Subtraction and division are often combined:
%7.55100320,18
202,10
%7.35100522,28
202,10
202,10320,18522,28
Even though the absolute difference is 10,202, the percentage difference differs according to the reference group:
Boston was 36% smaller than Philadelphia, but Philadelphia 56% larger than Boston
Numerator (10,202) is the same, denominator differs
Reference group for comparison is always the denominator

The denominator provides a point of reference—a standard for meaningful
comparison
Which makes more sense:
Boston 36% smaller, or
Philadelphia 56% larger?
It depends on the point we are trying to make.
Percentages are fractions
• Numerator should represent the cases that exhibit the characteristic we are trying to measure
• Denominator provides a standard for comparison
• So if we are studying Boston, Boston should be in the numerator and Philadelphia in the denominator
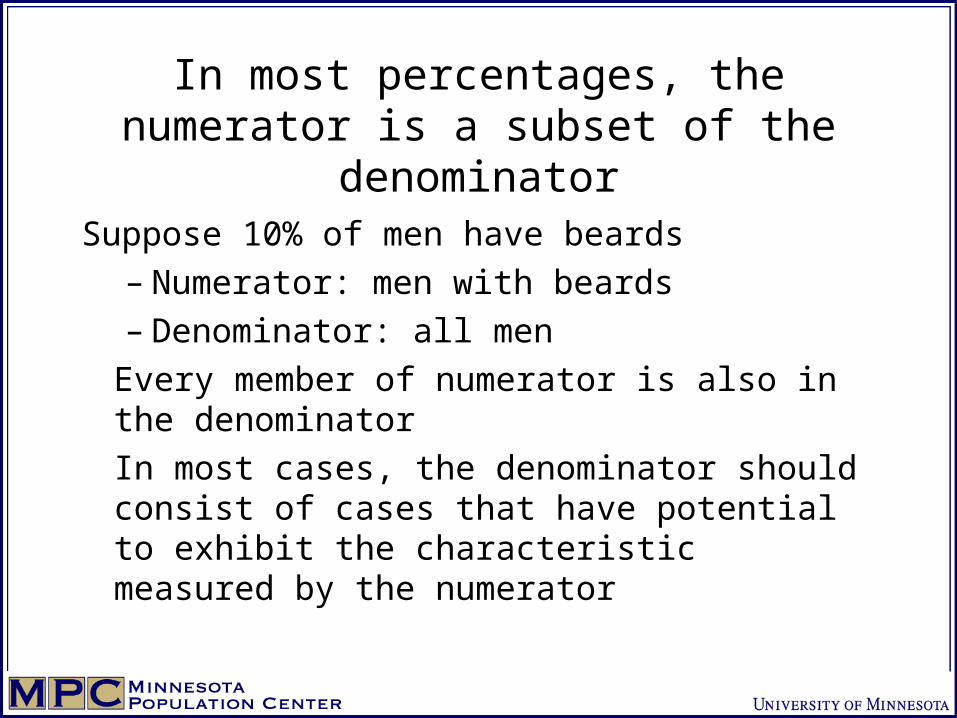
In most percentages, the numerator is a subset of the denominator
Suppose 10% of men have beards– Numerator: men with beards– Denominator: all men
Every member of numerator is also in the denominator
In most cases, the denominator should consist of cases that have potential to exhibit the characteristic measured by the numerator
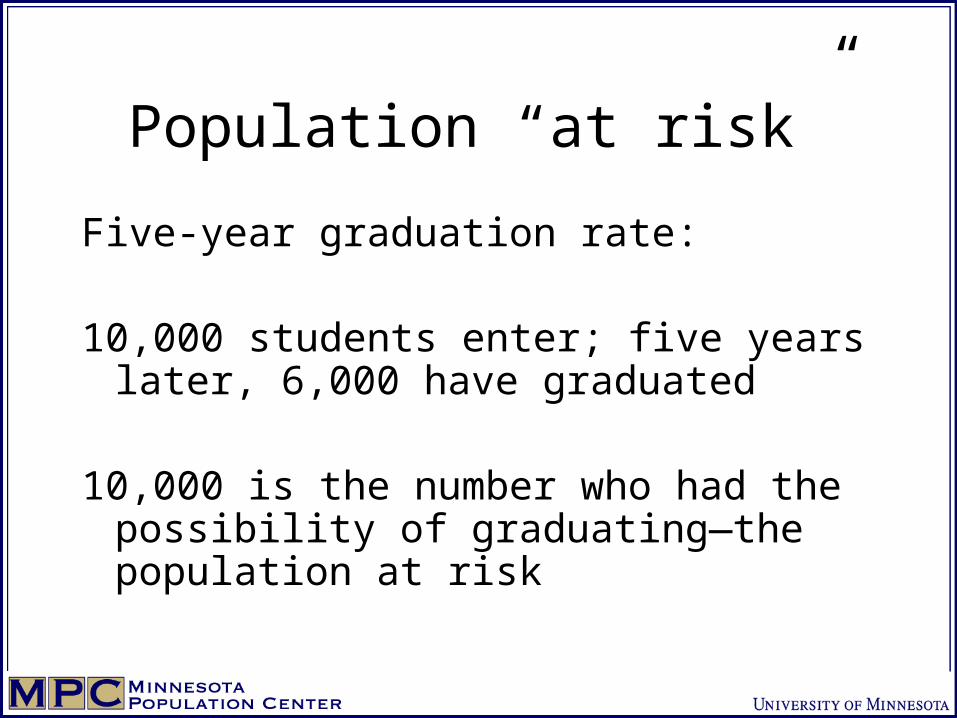
Population “at risk”
Five-year graduation rate:
10,000 students enter; five years later, 6,000 have graduated
10,000 is the number who had the possibility of graduating—the population at risk

Selecting most appropriate population at risk for the question at hand is an art
• Most sensitive measures usually have the smallest possible denominators
• Best denominators usually contain all the cases in the the numerator, but exclude cases that could not be in the numerator
• Eliminate extraneous cases in the numerator• Extraneous cases blur and distort the statistic
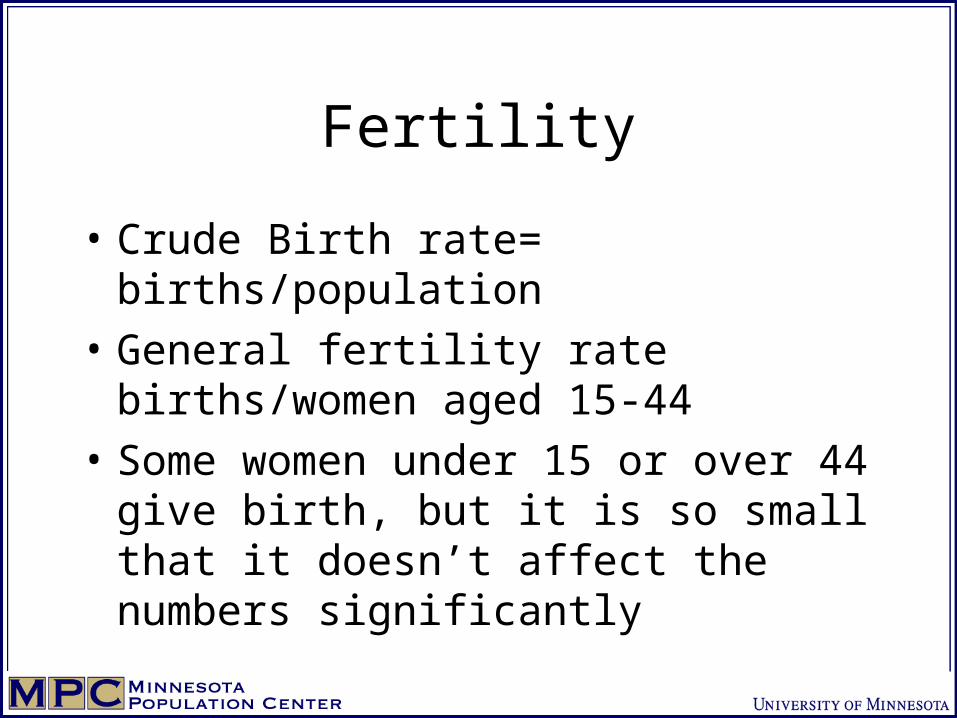
Fertility
• Crude Birth rate= births/population
• General fertility rate births/women aged 15-44
• Some women under 15 or over 44 give birth, but it is so small that it doesn’t affect the numbers significantly

What is extraneous?
Suppose we are measuring the fascist vote in a country where only adult male literate property holders can vote, and not all of them register, and not all of the registered people vote.
Numerator is fascist vote. Possible denominators:
Total population, adults, adult males, eligible adult males, registered voters, actual voters.
Which people are extraneous?
What is best denominator?

Watch your denominators
Beware of the population at risk

Degrees Earned, 1985 (thousands)
Bachelors Masters Doctorates
Males 477 151 23
Females 461 148 10
Possible questions:
What percent of doctorates were earned by women?
What percent of women warned doctorates?
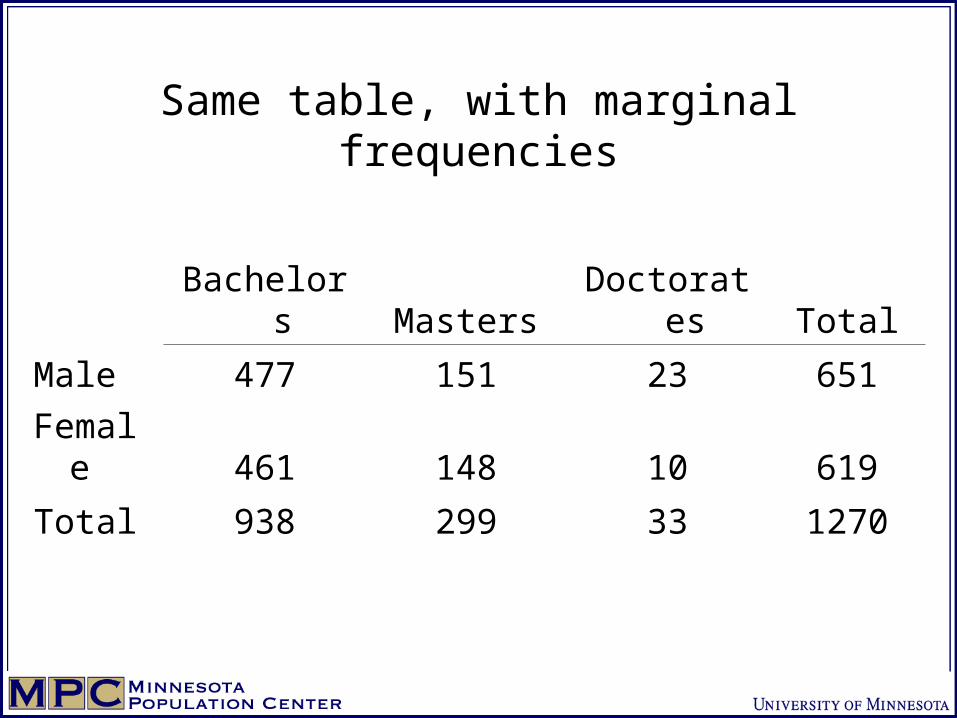
Same table, with marginal frequencies
Bachelors Masters Doctorates Total
Male 477 151 23 651
Female 461 148 10 619
Total 938 299 33 1270
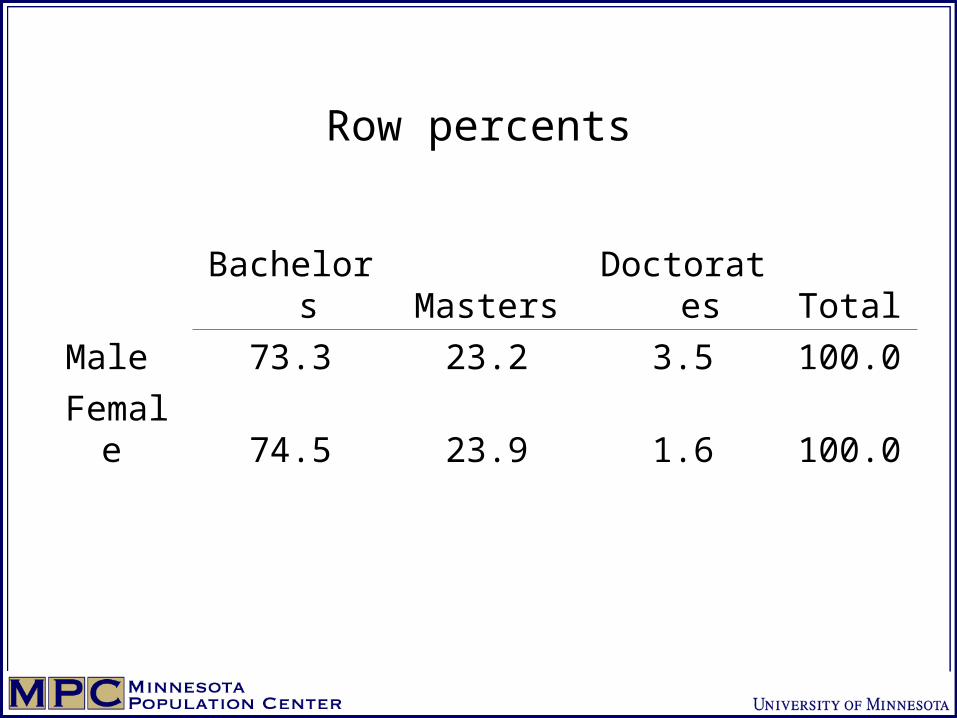
Row percents
Bachelors Masters Doctorates Total
Male 73.3 23.2 3.5 100.0
Female 74.5 23.9 1.6 100.0

Column percents
Bachelors Masters Doctorates
Male 50.9 50.5 69.7
Female 49.1 49.5 30.3
Total 100.0 100.0 100.0

Some terms
• Variable: characteristic of a population that can vary (e.g., age, which can vary from 0 to about 114; sex, which can vary from male to female)
• Population: any group of things one is analyzing (could be people, could be wills, could be firms)
More terms
• Numeric variable: a variable measured in numbers, such as age, height, weight, income. Called scale variable in SPSS.
• Categorical variable: a variable not measured on a numeric scale, such as sex, race, class. Note, however, that we usually code such variables as numbers (e.g. 1=male, 2=female). Called nominal variable in SPSS.

Setting Up Google Drive for Assignments
• Log in to Google Drive
• Create a folder named
HIST3011-yourlastname
• Share the folder with me
• Put all your exercise results in the folder, labeled appropriately