Embed Size (px)
Citation preview
1 | P a g e
Chapter-04, surveys 1#.Q.What is SAMPLING (Sir)A selection taken from a larger group (the "population") so that you can examine it to find out something about the larger groupFor example, you could sample a glass of water to find out what the quality of water in the whole lake was. It might not be totally accurate, but it is easier than testing the whole lake.Sampling is Statistical method of obtaining representative data or observations from a group (lot, batch, population, or universe).3#.Q.Importance of sampling/why sampling
Get information about large populations, Resources (time, money) and workload Gives results with known accuracy that can be calculated mathematically. More accuracy i.e. Can Do A Better Job of Data Collection When it’s impossible to study the whole population To minimize Costs Field time
4#.Q. Types of sampling: 2 type (sir) 1. Probability (Random) Samples
a) Simple random sample b) Systematic random sample c) Stratified random sample d) Cluster sample e) Multistage sample f) Multiphase sample
2. Non-Probability Samples a. Convenience sample b. Purposive sample c. Quota 1. Probability (Random) Samples
A probability sampling scheme is one in which every unit in the population has a chance (greater than zero) of being selected in the sample, and this probability can be accurately determined. When every element in the population does have the same probability of selection, this is known as an 'equal probability of selection' (EPS) design. Such designs are also referred to as 'self-weighting' because all sampled units are given the same weighta.Simple random sampleApplicable when population is small, homogeneous & readily available. All subsets of the frame are given an equal probability. Each element of the frame thus has an equal probability of selection. It provides for greatest number of possible samples. This is done by assigning a number to each unit in the sampling frame. A table of random number or lottery system is used to determine which units are to be selected.Advantage
Estimates are easy to calculate. Simple random sampling is always an EPS design, but not all EPS designs are simple random sampling.
Disadvantages If sampling frame large, this method impracticable. Minority subgroups of interest in population may not be present in sample in sufficient numbers for study.
b.Systematic random sampleSystematic sampling relies on arranging the target population according to some ordering scheme and then selecting elements at regular intervals through that ordered list. Systematic sampling involves a random start and then proceeds with the selection of every kth element from then onwards. In this case, k= (population size/sample size).
1 | P a g e
2 | P a g e
It is important that the starting point is not automatically the first in the list, but is instead randomly chosen from within the first to the kth element in the list. A simple example would be to select every 10th name from the telephone directory (an 'every 10th' sample, also referred to as 'sampling with a skip of 10').Advantage: Sample easy to select
Suitable sampling frame can be identified easily Sample evenly spread over entire reference population
Disadvantage: Sample may be biased if hidden periodicity in population coincides with that of selection. Difficult to
assess precision of estimate from one survey.c.Stratified random sample:Where population embraces a number of distinct categories, the frame can be organized into separate "strata." Each stratum is then sampled as an independent sub-population, out of which individual elements can be randomly selected. Every unit in a stratum has same chance of being selected. Using same sampling fraction for all strata ensures proportionate representation in the sample. Adequate representation of minority subgroups of interest can be ensured by stratification & varying sampling fraction between strata as required finally, since each stratum is treated as an independent population, different sampling approaches can be applied to different strata.d.Cluster sampleCluster sampling is an example of 'two-stage sampling. First stage a sample of areas is chosen; Second stage a sample of respondents within those areas is selected. Population divided into clusters of homogeneous units, usually based on geographical contiguity. Sampling units are groups rather than individuals. A sample of such clusters is then selected. All units from the selected clusters are studied.Advantages:
Cuts down on the cost of preparing a sampling frame. This can reduce travel and other administrative costs.
Disadvantages: Sampling error is higher for a simple random sample of same size. Often used to evaluate vaccination coverage in EPI
Two types of cluster sampling methods. One-stage sampling. All of the elements within selected clusters are included in the sample. Two-stage sampling. A subset of elements within selected clusters is randomly selected for inclusion in
the sample. Identification of clusters samplesList all cities, towns, villages & wards of cities with their population falling in target area under study.
Calculate cumulative population & divide by 30, this gives sampling interval. Select a random no. less than or equal to sampling interval having same no. of digits. This forms 1st
cluster. Random no.+ sampling interval = population of 2nd cluster. Second cluster + sampling interval = 4th cluster. Last or 30th cluster = 29th cluster + sampling interval
e.Multistage sampleComplex form of cluster sampling in which two or more levels of units are embedded one in the other.First stage random number of districts chosen in all states. Followed by random number of talukas, villages. Then third stage units will be houses. All ultimate units (houses, for instance) selected at last step are surveyed.
2 | P a g e
3 | P a g e
f.Multiphase samplePart of the information collected from whole sample & part from subsample.In Tb survey MT in all cases – Phase IX –Ray chest in MT +ve cases – Phase IISputum examination in X – Ray +ve cases - Phase III Survey by such procedure is less costly, less laborious & more purposeful
2. Non-Probability Samples Any sampling method where some elements of population have no chance of selection (these are sometimes referred to as 'out of coverage'/'under covered'), or where the probability of selection can't be accurately determined. It involves the selection of elements based on assumptions regarding the population of interest, which forms the criteria for selection. Hence, because the selection of elements is nonrandom, non-probability sampling not allows the estimation of sampling errorsa.Purposive sample:The researcher chooses the sample based on who they think would be appropriate for the study. This is used primarily when there are a limited number of people that have expertise in the area being researchedb.Quota:The population is first segmented into mutually exclusive sub-groups, just as in stratified sampling. Then judgment used to select subjects or units from each segment based on a specified proportion. For example, an interviewer may be told to sample 200 females and 300 males between the age of 45 and 60. It is this second step which makes the technique one of non-probability sampling. In quota sampling the selection of the sample is non-random. c.CONVENIENCE SAMPLING Sometimes known as grab or opportunity sampling or accidental or haphazard sampling.
A type of non-probability sampling which involves the sample being drawn from that part of the population which is close to hand. That is, readily available and convenient.
The researcher using such a sample cannot scientifically make generalizations about the total population from this sample because it would not be representative enough.
For example, if the interviewer was to conduct a survey at a shopping center early in the morning on a given day, the people that he/she could interview would be limited to those given there at that given time, which would not represent the views of other members of society in such an area, if the survey was to be conducted at different times of day and several times per week.
This type of sampling is most useful for pilot testing. In social science research, snowball sampling is a similar technique, where existing study subjects are
used to recruit more subjects into the sample.
5#Q. Acceptable Response Rates, According to Babbie, a response rate of 50% is adequate for analysis and reporting a response rate of 60% is good a response rate of 70% is very good
3 | P a g e
4 | P a g e
6#Q. Response rate The proportion of people who respond: Example: If you distribute 50 questionnaires and you get 25 questionnaires back, your response rate is 50%. # That answered = response rate # You contacted7#Q. Ways to increase response rate
Generate positive publicity for your survey. Appeal to people’s helping tendencies – ask them to help. Make the topic salient - seem important Ensure that respondents see the value of participating. Point out personal connection to the topic Tailor, personalize communications Make the questionnaire interesting-short and easy to complete AND easy to return Provide incentives Show positive regard; Say thank you Indicate that opportunities to respond are limited For mail survey, provide 1st class postage/return postage. Over sample Use a combination of survey modes – telephone plus mail Make (multiple) follow-up contacts – by mail, email, telephone, in person…
8#.Q. Population definitionA population can be defined as including all people or items with the characteristic one wishes to understand. Because there is very rarely enough time or money to gather information from everyone or everything in a population, the goal becomes finding a representative sample (or subset) of that population 6#Q. Survey Designs Used to collect descriptive data Study attitudes or values of a group Common practices of a group May be used to describe elements of a specific group or generalize to a larger population May study relationships between/among variablesWhy Do a Survey? The goal of any survey is to collect data which can be analyzed, and used to aid decisionsSurveys Are a MEANS to an END The goal is NOT to “do a survey” The goal is to acquire data to make proper decisions A survey is only one channel of information in support of that decision-making process9#Q.Why Do A Survey? Interested in Individuals Interested in Big Groups Interested in Aggregation of Views Interested in Recent & Current Events10#Q.Six steps in Survey Research:
1) Research Design 2) Select Sample 3) Construct Questions 4) Ask Questions 5) Analyze Data 6) Report Results7)
4 | P a g e
5 | P a g e
11#Q. Will using a survey be culturally appropriate? Things to consider:
Literacy level Tradition of reading, writing Setting Not best choice for people with oral tradition Translation (demands more than just literal translation) How cultural traits affect response How to sequence the questions Pretesting the questionnaire when it may be viewed as intrusive Computer access and use if an electronic survey
12#Q.Types of surveys 1) Hand-out 2) Mail 3) Telephone 4) Face-to-face 5) Email6) Web survey – Online survey 7) Mixed mode: uses two or more of above
13#Q. Advantages & Disadvantages of SurveysAdvantages: Speed – Faster data collection than other methods Cost - Relatively inexpensive data collection Accuracy – Survey data can be very accurate if sampling is properly done Efficiency – Measured as a ration of accuracy to cost, surveys are generally very efficient data collection methods Disadvantages: Survey error – Potentially large sources of error in surveys Communication Problems - Each of the different communication survey methods has its own unique problems.14#Q. Classifying Survey Research Methods
1. By method of communication. Personal Interviews Telephone interviews Self-administered interviews 2. By degree of structure and disguise. Structured disguised Structured undisguised Unstructured disguised Unstructured undisguised 3. By time frame (Temporal classification).
Although most surveys are for individual research projects conducted only once over a short time period, other projects require multiple surveys over a long period. Thus, surveys can be classified on a temporal basis.
5 | P a g e
6 | P a g e
15#Q. Cross-sectional surveys Studies in which various segments of a population are sampled and data collected at a single point in time. A study in which various segments of a population are sampled and data are collected at a single moment in timeDo you make New Year’s resolutions? A Harris Interactive survey conducted in November 2008 indicates that women (74 percent) are more likely than men (58 percent) to actually make a New Year’s resolution. However, more men than women “always or often keep their resolutions” (22 percent of men compared to 14 percent of women). This was a cross-sectional study becauseIt collected the data at a single point in time. That is, the survey asked people to reflect on their past behavior, rather than ask them if they made a resolution, then follow up a year later to see if the resolution was kept. Such a study samples various segments of the population to investigate relationships among variables by cross-tabulation. Most business research surveys fall into this category. We can think of cross-sectional studies as taking a snapshot of the current situation. The typical method of analyzing a cross-sectional survey is to divide the sample into appropriate subgroups. For example, if a winery expects income levels to influence attitudes toward wines, the data are broken down into subgroups based on income and analyzed to reveal similarities or differences among the income subgroups. If a manager thinks that length of time an employee has been with the organization will influence their attitudes toward corporate policies, employees might be broken into different groups based on tenure (e.g., less than 5 years, 5–9 years, 10–14 years, and 15 years or more) so their attitudes can be examined.16#Q. Longitudinal/ Cohorts surveys:A survey of respondents at different times, thus allowing analysis of response continuity and changes over time.In a longitudinal study respondents are questioned at multiple points in time. The purpose of longitudinal studies is to examine continuity of response and to observe changes that occur over time. Many syndicated polling services, such as Gallup, conduct regular polls. For example, the Bureau of Labor Statistics conducts the National Longitudinal Survey of Youth, interviewing the same sample of individuals repeatedly since 1979. (Respondents, who were “youth” at the beginning of the study, are now in their 40s.) Research scientist Jay Zagorsky recently analyzed the longitudinal data from that study to determine that those who married and stayed with their spouse accumulated almost twice as much wealth as single and divorced people in the study.13 The Yankelovich MONITOR has been tracking American values and attitudes for more than 30 years. This survey is an example of a longitudinal study that uses successive samples; its researchers survey several different samples at different times. Longitudinal studies of this type are sometimes called cohort studies , because similar groups of people who share a certain experience during the same time interval (cohorts) are expected to be included in each sample. Exhibit 9.2 illustrates the results of
6 | P a g e
7 | P a g e
17#Q. Types of survey research methods Include the interview, questionnaire and normative survey Survey Methods
a. Interviews ==================================== Investigator asks specific questions of a respondent and records responses Affords opportunity for in-depth analysis Types Structured - investigator uses a specific set of questions Unstructured - no fixed agenda Has flexibility to diverge from the nature of a question vs. questionnaire “Go where the discussion leads you”
b. Personal Interview ============================ Advantages of the personal interview:
More adaptable Interviewer can observe the respondent Greater rate of return than questionnaire Easier to explain questions c. Questionnaires “Pen and paper response” a pre-determined set of questions Provides anonymity and encourages honest responses Questions should be standardized (everyone answers the same question) and determined to be valid and
reliable Requires self-reporting & subject to bias recall
Disadvantage – may not be able to explore a response in depth This problem may be alleviated with a good design
d. Mailings Response rates tend to be low Respondent not interested incomplete responses may require discard Respondent does not fill out the survey correctly requiring discard 40% - 60% response rates common 60% - 80% often considered excellent Because response rates tend to be low a large sample is usually required18#Q. Design the Survey Map out questions to help you gain the information needed to meet the survey objective Question Types of survey: Open:
1. No pre-set selections – type in text, numbers – whatever is appropriate for the question. 2. Open-ended questions – unstructured fill-in-the-blank types of questions. 3. Good for gathering general information and revealing what is on the respondents’ minds 4. Open-ended questions require a lot of time to analyze and are more readily open to misinterpretation.
Closed: 1. Choose from pre-set selections only 2. Multiple choice, Yes/No, True/False (etc.) 3. Choices are structured; respondents must choose from a scale or a series of options. 4. Good for nailing down specific, numeric options, and they’re easier to analyze 5. They may not offer enough choices and options for people to truly express their opinions
Mixed: 1. Combinations of closed and open (i.e. “Other – Please specify_________”)
7 | P a g e
8 | P a g e
Chapter-05, Dietary survey methods1#Q. Dietary survey at individual levelSurvey:A survey is a series of questions asked of a group of people in order to gain informationInformation gathered can be facts, attitudes, feelings, beliefsA structured way to collect standardized information from individuals using a questionnaireSurveys may be conducted once; at repeated intervals, or concurrently with multiple samplesThey may be used to collect information from a few or many2#Q. Why Do a Survey?The goal of any survey is to collect data which can be analyzed, and used to aid decisions3#Q. DIETARY ASSESSMENT METHODS OF INDIVIDUAL LEVEL Methods used for measuring food consumption of individuals can be classified in several ways. One way is to classify them into prospective and retrospective methods. Another way of classification is into current diet and food/dietary habits. With current diet you mean the diet that you actually eat or have eaten. With food habits, the usual diet you mean the diet that you usually eat, but not necessarily the diet that you eat right now, for instance today. The current diet methods are the various record methods, the duplicate portion technique and 24/48 hour recall methods. The dietary habits methods are the various diet history methods and the food frequency questionnaires.
1. Prospective methods In the prospective methods the diet are recorded when you consume the foods. The various methods differ in how precise you are in estimating the portion sizes. In general one records food for 3 to 7 days
a. Menu records A menu recording is a record of the respondent’s food intake at the time of consumption regarding type of food, but does not indicate any portion sizes.
b. Estimated food records In an estimated food record, respondents record the foods eaten at the time of consumption and estimate the portion sizes, for instance with the aid pictures of foods, rulers, standard household measuring cups and spoons. Detailed descriptions of all foods and beverages, including brand names, and their method of preparation and cooking are recorded.
c. Weighed food records In a weighed record all foods and beverages consumed are weighed by the subject, parent or caretaker at the time of consumption. Details of methods of food preparation, description of foods, and brand names should also be recorded. For composite dishes, weights of all raw ingredients used in the recipe should be noted, as well as the weight of the portion consumed. The advantage is that you do not need to estimate portion sizes and the portion sizes will be more accurate compared to the other methods. The primarily disadvantage is that it is necessary to bring the scale with you all the time during the recording period.
d. The duplicate portion technique In this method duplicate portions of all foods and beverages consumed are collected in a container and later analyzed. Advantages with prospective methods One of the major advantages with the prospective methods is that they are not affected by the memory since the foods and beverages are recorded at the time of consumption. Another advantage is that portion sizes can be more accurately estimated compared to retrospective methods. Concerning the duplicate portion technique it is an advantage that nutrients can be analyzed. An advantage, that is valid for all current methods, is that information regarding irregularities in food intake can be obtained.
8 | P a g e
9 | P a g e
Disadvantages with prospective methods Probably the greatest disadvantage of prospective methods is that they often affect the consumption of foods and beverages. Several studies have demonstrated that the total intake will be low and that there is a selective underreporting (3). Another disadvantage is that you can only perform this method during a short time period, normally not more than a week. Prospective methods are not affected by the memory, except for the duplicate portion technique since subjects already at the grocery store have to remember to by the double amount of foods and beverages that they normally need. Then they have to prepare the meal for double portions so that you can throw one portion into the container. Validation studies on the duplicate portion technique indicate an underestimation of the total food intake.
2. Retrospective methods In retrospective methods information is collected on foods and beverages already consumed. Among the retrospective methods are the 24 and 48 hour recalls current diet methods and diet histories and food frequency questionnaires dietary habits methods. Quantities of foods consumed can be obtained by food models, pictures of foods, rulers, standard household measuring cups and spoons.
1) 24 hour and 48 hour recalls In the 24 hour or 48 hour recall methods subjects are asked to recall the food intake during the previous 24 hour or 48 hour period or the preceding day(s) (5). Detailed descriptions of all foods and beverages consumed, including, if possible, brand names and cooking methods, are recorded by the interviewer. Mineral and vitamin supplement use is also noted. To cover a longer time period you can repeat the interviews, and thereby get a better estimate of the individual’s intake, so called repeated 24/48 hour recalls. The recalls can also be performed as telephone interviews. The advantages of these methods are that they are simple, cheap and a large sample size is possible to obtain. In addition, as with all retrospective methods, the food habits are not affected by the methodsThe disadvantages with these methods are that the interviewer can affect the result and if the recalls are not repeated, the time period will be too short to be able to obtain information on the individual level. People have good as well as bad memory and the ability to estimate quantities vary. These factors affect the quality of the methods.
9 | P a g e
10 | P a g e
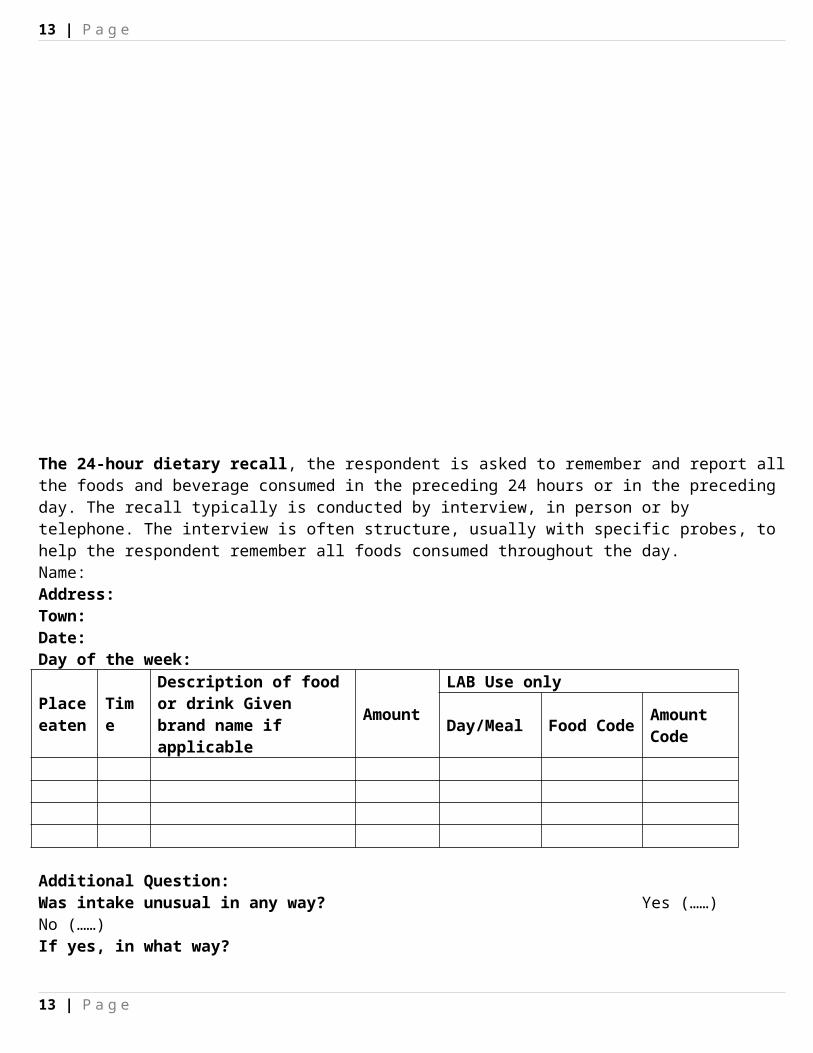
The 24-hour dietary recall, the respondent is asked to remember and report all the foods and beverage consumed in the preceding 24 hours or in the preceding day. The recall typically is conducted by interview, in person or by telephone. The interview is often structure, usually with specific probes, to help the respondent remember all foods consumed throughout the day.Name:Address:Town:Date:Day of the week:
Place eaten Time
Description of food or drink Given brand name if applicable
AmountLAB Use only
Day/Meal Food Code Amount Code
Additional Question:Was intake unusual in any way? Yes (……) No (……)If yes, in what way?Do you take vitamin or mineral supplements? Yes (…..) No (….)If yes, how many per day? (…..) per week (…..)If yes, what kind? (Give brand if possible)Multivitamin Iron Ascorbic acid other (list)
2) Diet histories With this method, or rather methods, one will obtain an estimate of the individual’s dietary habits during a long time period, from weeks up to one year. However, it has been demonstrated that describing food habits during a year is almost impossible, due to seasonal variations. Therefore, it is important to define the time period covered. The method, first developed by Bertha Burke in 1947 (6) is made up of three parts.The first part consists of a collection of general information on the overall eating pattern. The general information obtained includes detailed descriptions of foods, their frequency of consumption, and usual portion sizes in common household measures. This first part also consists of a 24 hour recall. The second part consists of a questionnaire on the frequency of consumption of specific food items, used to verify and clarify the information on the kinds and amounts of foods given as the usual intake in the first component. This second part serves as a “cross-check” for the information on usual intake obtained from the first part. The third part consists of a three-day food record using household measures. Since this last part showed to be the least helpful it is often abandoned. An advantage with these methods is that relatively long time periods can be studied and thereby the intake on the individual level can be obtained. Another advantage is that the interviewer can contribute to a good communication; thus, a low drop-out rate can be obtained. It is also likely that these methods give a more valid intake compared to other methods Disadvantages with the methods are that they are very labour intensive, which affects both the interviewer and the volunteer, and unsuitable for large surveys. Also, the results obtained depend on the skill of the interviewer, which impacts the quality of the interview. Researchers will not obtain information on the day-to-day variation in food intake and, as with all retrospective methods, good memory is important for estimating frequencies and portion sizes.
10 | P a g e
11 | P a g e
3) Food frequency questionnaires These questionnaires are designed to obtain qualitative, descriptive information about usual food consumption pattern (8). The first component of the questionnaire is a list of foods, beverages, supplements, etcetera; and the second part is a set of frequency-of-use response categories. Advantages with food frequency questionnaires are that, compared with the other methods, they are not a heavy burden for the volunteers. You do not need skilled personnel; you will get a relatively low drop-out rate and avoid interviewer bias. In general, they are relatively cheap, can be filled out quickly and are not difficult to analyze. The aforementioned advantages are valid when you already have a questionnaire. However, it is very time consuming to construct and validate this type of questionnaireDisadvantages are that it is almost impossible to obtain the total food intake, which sometimes is forgotten. In addition, skilled personnel are crucial when constructing a questionnaire, as well as producing nutrient scores and performing energy adjustments.
4) Assessment of intake in the distant past These data are derived from some form of food frequency questionnaire or diet history interview. The methods are primarily used in case-control studies when dietary information is needed from the distant past. Results from studies in which current as well as past diet were assessed reveal that the recalled diet agrees more closely with the current diet than with the past diet (10-12). This demonstrates that the current diet is having a strong influence on the recalled diet.
11 | P a g e
12 | P a g e
Chapter-06, Anthropometric survey1#Q. Different type of classification system use in anthropometric analysisAnthropometry refers to the measurement of the human individual. The term ‘nutritional anthropometry’ first appeared in Body measurement and Human Nutrition’ (Brozek, 1956) and has been defined by jelliffe (1966) as:Measurements of the variations of the physical dimensions and the gross composition of the human body at different levels and degree of nutrition.Anthropometry is the study of the measurement of the human body in terms of the dimensions of bone, muscle, and adipose (fat) tissue. Measures of subcutaneous adipose tissue are important because individuals with large values are reported to be at increased risks for hypertension, adult-onset diabetes mellitus, cardiovascular disease, gallstones, arthritis, and other disease, and forms of cancer. 2#Q. Advantages of anthropometrics:
The procedure use simple, safe, noninvasive technique which can be used at the bedside and are applicable to larger sample size
Equipment required is inexpensive, portable and durable and can be made or purchased locally Relatively unskilled personnel can perform measurement procedure Information is generated on past long term nutritional history, which can not be obtained with equal
confidence using other technique The procedure can assist in the identification of mild to moderate malnutrition as well as severe stage of
malnutrition Screening test of identifying individuals at high risk to malnutrition, can be devised
Limitations of Anthropometry: Inter-observers errors in measurement, Limited nutritional diagnosis, Problems with reference
standards, i.e. local versus international standards. Arbitrary statistical cut-off levels for what considered as abnormal values.3#Q. Anthropometric measurements are of two types:
1. Growth measurement, 2. Body composition measurement1. Growth measurement:
The most widely used anthropometric measurement of growth is those of stature (height or length) and body weight. This measurement can be made quickly and easily. Recumbent length is measured in infants and children less than two years of age. Height is measured in older children and adults. Knee height measurements can also be used to estimate height in those person with severe spinal curvature or who are unable to stand
a. Measurement of head circumference: Head circumference really measure brain growth. Brain growth and head circumference beyond the first year of life. Nearly all brain growth occurs in the first two years and virtually ceases by four years of age. Chronic malnutrition during the first few months of life or intrauterine growth retardation may decrease the number of brain cells and result in an abnormally low head circumference. For the measurement of head circumference, a narrow, flexible and non stretch tape.
b. Measurement of recumbent length: Recumbent length refers to stature taken while lying down .Until age 2, children must be measured in the recumbent position. Use a recumbent measuring board with a fixed headpiece and sliding foot piece that are both perpendicular/upright (form a 90-degree angle) to the measurement surface.Common errors in measuring recumbent length
Improper equipment used., Hat, hair barrettes or big hairdos not removed. Shoes, sandals, socks are not removed. Child's head is not in correct position. Legs are not straightened or properly positioned. Heels or legs are not flat against the recumbent board. Only one leg is extended rather than both legs.
12 | P a g e
13 | P a g e
c. Measurement of height: Children over two years of age and adults are generally measured in the standing position using a stadiometer or portable anthropometry. Some form of right angle headboard and a measuring rod or non-stretchable tape fixed to a vertical surface can be used. In the field, vertical surfaces are not always available.When measuring height, the subject stands straight with the head positioned. The frankfrut plane is horizontal, feet together, knee straight and heels, buttock and shoulder blades in contact with vertical surface of the stadiometer.
d. Measurement of weight: In the field survey, a suspended scale and weighing sling may be used for weighing infants and Children less than two years of age. Weight for height is also useful in evaluating the benefits of inter vention program, as this index is more sensitive to changes in nutritional status than height for age.
2. Body Composition Measuremen t:The body mass index (BMI) or Quetelet index is a measure of relative weight based on an individual's mass and height
BMI' provides a simple numeric measure of a person's thickness or thinness, allowing health professionals to discuss overweight and underweight problems more objectively with their patients. However, BMI has become controversial because many people including physicians have come to rely on its apparent numerical authority for medical diagnosis.BMI's purpose; it is meant to be used as a simple means of classifying sedentary (physically inactive) individuals or rather populations with an average body composition.For these individuals, the current value settings are as follows: a BMI of 18.5 to 25 may indicate optimal weight, a BMI lower than 18.5 suggest the person is underweight, a number above 25 may indicate the person is overweight, a number above 30 suggests the person is obese.For a given height, BMI is proportional to mass. However, for a given mass, BMI is inversely proportional to the square of the height. So, if all body dimensions double and mass scales naturally with the cube of the height, then BMI doubles instead of remaining the same. These results in taller people having a reported BMI that is uncharacteristically high compared to their actual body fat levels. In comparison, the Ponderal index is based on this natural scaling of mass with the third power of the height. However, many taller people are not just "scaled up" short people, but tend to have narrower frames in proportion to their height.Dietary survey ON a National level. PER CAPITA CONSUMPTION Per capita consumption is the available amount of food/energy/nutrients per person and day. This data is obtained by taking the sum of food production plus imports minus the sum of exports and foods for animals. Losses due to storage, transportation, distribution etcetera should be drawn of the total amount, but is difficult to measure. These data can be obtained from national statistic bureaus, OECD Food Consumption Statistics and FAO Food Balance Sheets. This type of data can be used in ecological studies, to follow trends in food production and give a broad view for comparison between countries. One should bear in mind that the quality between countries can vary, which of course make comparisons difficult. Also, it is important to realise that it is foods available for consumption and not the amount that is really consumed.
13 | P a g e
BMI
14 | P a g e
3. DIETARY DATA ON THE HOUSEHOLD LEVEL. HOUSEHOLD BASED SURVEYS Household based surveys give information of the household’s expenses for foods. This can later be transformed to foods. Usually a household member keeps record on all expenses and type of foods during a specific time period, usually one to four weeks and preferably evenly distributed during the year. This type of data can be used to monitor differences due to socioeconomic status, geographical area, type of family etcetera. Household surveys do not give information on the distribution of the consumption between the family members, cooking methods or losses. These surveys are often performed of economical reasons rather than nutritional reasons. 4. FOOD CONSUMPTION OF INDIVIDUALS. DIETARY ASSESSMENT METHODS Methods used for measuring food consumption of individuals can be classified in several ways. One way is to classify them into prospective and retrospective methods. Another way of classification is into current diet and food/dietary habits. With current diet you mean the diet that you actually eat or have eaten. With food habits, the usual diet you mean the diet that you usually eat, but not necessarily the diet that you eat right now, for instance today. The current diet methods are the various record methods, the duplicate portion technique and 24/48 hour recall methods. The dietary habits methods are the various diet history methods and the food frequency questionnaires.
14 | P a g e
15 | P a g e
Chapter-07, Nutritional surveillance systems1#Q. What is Nutritional surveillance: Nutrition surveillance or information systems (the terms are used interchangeably here) collect, analyze, interpret and report on information about the nutritional status of populations and most importantly are used to inform appropriate response strategies. CharacteristicsNutritional status is a well-recognized outcome of human welfare. Over the past 20 years, methods for collecting information on nutritional status have been standardized with the result that rates of acute malnutrition have become one of the most common and reliable indicators used in emergencies. Nutrition surveillance systems vary significantly and will depend on the context / type of emergency and information required, as well as the capacity of staff and other resources available. The biggest challenge for all nutrition surveillance systems is to ensure effective linkages between information and action.2#Q. Objectives NSS:The objectives of a nutrition surveillance system depend on context. These include the following:
Advocacy This is used as a means of highlighting an evolving crisis
Identification of appropriate response/intervention strategies In emergencies these may include non-food as well as food assistance to address the underlying causes of malnutrition. In development scenarios, this may include nutrition education and activities directed to increasing diversity of food production food access. Both emergencies and development settings may also require micronutrient supplementation programmes.
Triggering a response Nutrition surveillance systems provide a trend analysis focusing on the magnitude of change. This may trigger a more in depth assessment that in turn may lead to response.
TargetingNutrition information can help target areas that are more at risk or in greater need of assistance,
Identification of malnourished children Most forms of surveillance will identify acutely malnourished children. 3#Q. Methods NSSThe following are the main methods used for surveillance:
Large scale national surveys Repeated small scale surveys Clinic-based monitoring Sentinel site surveillance School census data Rapid nutrition assessments Rapid screening based on mid-upper arm circumference (MUAC)
4#Q. Process of NSS15 | P a g e
16 | P a g e
1. Population groups In emergencies, acute malnutrition, especially wasting, among children 6 to 59 months is usually taken as a proxy indicator for the general health and wellbeing of the entire community. However, in certain contexts information on the nutritional status of adolescents, adults or the elderly may also be valuable.
2. Indicators: A number of standard indicators are used to assess the nutritional status of the population and the underlying causes of malnutrition. These include:
Anthropometric (body measurements to assess nutritional status) measurements Clinical and biochemical indicators of micronutrient deficiency diseases Indicators to assess the underlying causes of malnutrition such as care practices, health status, water
and sanitation, and food security indicators such as dietary diversity.3. Data collection
Factors that have to be considered include: Frequency of data collection Identification and capacity of enumeration staff Access to data collection areas by enumerators4. Analysis of data
There are a variety of computer programmes that can be used to analyze nutrition and related data. These include Nutritional survey (ENA) software and Epi Info. The quality of data needs to be maintained at a high level in order for it to be credible / provide an accurate representation of the population.
5. Interpretation of data The following should be taken into account when interpreting data:
Rates of acute malnutrition in relation to thresholds for responseA number of classification systems have been developed around which particular emergency interventions should be initiated. In addition, more specific nutrition ‘decision trees’ have been developed to indicate when selective feeding programmes should be started.
Trends over time and seasonality Nutrition data must be interpreted in relation to pre-emergency levels of malnutrition and normal seasonal patterns.
Underlying causes of malnutritionThe relative importance of food, health and care as nutritional risk factors need to be identified so that appropriate responses can be prioritized.
Relationship between malnutrition and mortality The relationship between mortality and nutritional status is not clearly defined. In some cases it is strong and in others it is weaker. 5#Q. Challenges of nutrition surveillance systems
Sustainability is one of the biggest challenges Surveillance systems fail is that national or local governments are unable to provide the level of
resources needed to maintain a system
16 | P a g e