Embed Size (px)
Citation preview

What Information Is Necessary for Speech Categorization? HarnessingVariability in the Speech Signal by Integrating Cues Computed
Relative to Expectations
Bob McMurrayUniversity of Iowa
Allard JongmanUniversity of Kansas
Most theories of categorization emphasize how continuous perceptual information is mapped to catego-ries. However, equally important are the informational assumptions of a model, the type of informationsubserving this mapping. This is crucial in speech perception where the signal is variable and contextdependent. This study assessed the informational assumptions of several models of speech categorization,in particular, the number of cues that are the basis of categorization and whether these cues represent theinput veridically or have undergone compensation. We collected a corpus of 2,880 fricative productions(Jongman, Wayland, & Wong, 2000) spanning many talker and vowel contexts and measured 24 cues foreach. A subset was also presented to listeners in an 8AFC phoneme categorization task. We then traineda common classification model based on logistic regression to categorize the fricative from the cue valuesand manipulated the information in the training set to contrast (a) models based on a small number ofinvariant cues, (b) models using all cues without compensation, and (c) models in which cues underwentcompensation for contextual factors. Compensation was modeled by computing cues relative to expec-tations (C-CuRE), a new approach to compensation that preserves fine-grained detail in the signal. Onlythe compensation model achieved a similar accuracy to listeners and showed the same effects of context.Thus, even simple categorization metrics can overcome the variability in speech when sufficientinformation is available and compensation schemes like C-CuRE are employed.
Keywords: speech perception, categorization, compensation, cue integration, fricatives
Supplemental materials: http://dx.doi.org/10.1037/a0022325.supp
1. Categorization and Information
Work on perceptual categorization encompasses diverse do-mains like speech perception, object identification, music percep-tion, and face recognition. These are unified by the insight thatcategorization requires mapping from one or more continuousperceptual dimensions to a set of meaningful categories, and it isoften assumed that the principles governing this may be commonacross domains (e.g., Goldstone & Kersten, 2003; though seeMedin, Lynch, & Solomon, 2000).
The most important debates concern the memory representa-tions used to distinguish categories, contrasting accounts based on
boundaries (e.g., Ashby & Perrin, 1988), prototypes (e.g., Homa &Cultice, 1984; Posner & Keele, 1968; Reed, 1972), and sets ofexemplars (Hintzman, 1986; Medin & Schaffer, 1978; Nosofsky,1986). Such representations are used to map individual exemplars,described by continuous perceptual cues, onto discrete categories.But these are only part of the story. Equally important for anyspecific type of categorization (e.g., speech categorization) is thenature of the perceptual cues.
There has been little work on this within research on categori-zation. What has been done emphasizes the effect of categories onperceptual encoding. We know that participants’ categories canalter how individual cue values along dimensions like hue areencoded (Goldstone, 1995; Hansen, Olkkonen, Walter, & Gegen-furtner, 2006). For example, a color is perceived as more yellow inthe context of a banana than a pear. Categories may also warpdistance within a dimension as in categorical perception (e.g.,Goldstone, Lippa, & Shiffrin, 2001; Liberman, Harris, Hoffman, &Griffith, 1957), though this has been controversial (Massaro &Cohen, 1983; Roberson, Hanley, & Pak, 2009; Schouten, Gerrits,& Van Hessen, 2003; Toscano, McMurray, Dennhardt, & Luck,2010). Finally, the acquisition of categories can influence theprimitives or dimensions used for categorization (Oliva & Schyns,1997; Schyns & Rodet, 1997).
Although there has been some work examining how categoriesaffect continuous perceptual processing, there has been little workexamining the other direction, whether the type of information thatserves as input to categorization matters. Crucially, does the nature
This article was published Online First March 21, 2011.Bob McMurray, Department of Psychology, University of Iowa; Allard
Jongman, Department of Linguistics, University of Kansas.This research was supported by National Institutes of Health Grant
DC-008089 to Bob McMurray and Grant DC-02537 to Allard Jongman.We thank Yue Wang for help with the perceptual experiment, DanMcEchron for assistance coding the additional cues and data management,and especially Jennifer Cole in helping to lay the groundwork for theparsing/C-CuRE approach. We also thank Terry Nearey, Bruce Hayes, BenMunson, Gregg Oden, and Kristian Markon for helpful feedback on someof the ideas presented here.
Correspondence concerning this article should be addressed to BobMcMurray, E11 SSH, Department of Psychology, University of Iowa,Iowa City, IA 52240. E-mail: [email protected]
Psychological Review © 2011 American Psychological Association2011, Vol. 118, No. 2, 219–246 0033-295X/11/$12.00 DOI: 10.1037/a0022325
219

of the perceptual dimensions constrain or distinguish theories ofcategorization? In fact, some approaches (e.g., Soto & Wasserman,2010) have argued that we can understand much about categori-zation by abstracting away from the specific perceptual dimen-sions.
Nonetheless, we cannot ignore this altogether. Smits, Jongman,and Sereno (2006), for example, taught participants auditory cat-egories along either resonance-frequency or duration dimensions.The distribution of the exemplars was manipulated to contrastboundary-based, prototype, and statistical accounts. Althoughboundaries fit well for frequency categories, duration categoriesrequired a hybrid of boundary and statistical accounts. Thus, thenature of the perceptual dimension may matter for distinguishingtheoretical accounts of categorization.
Beyond the matter of which specific cues are encoded, a secondissue, and the focus of this study, is whether and how perceptualcues are normalized during categorization. Perceptual cues areaffected by multiple factors, and it is widely, though not univer-sally, accepted that perceptual systems compensate for thesesources of variance. For example, in vision, to correctly perceivehue, observers compensate for light source (McCann, McKee, &Taylor, 1976); in music, pitch is computed relative to a tonic note(relative pitch); and in speech, temporal cues like duration may becalibrated to the speaking rate (Summerfield, 1981), while pitch iscomputed relative to the talker’s pitch range (Honorof & Whalen,2005).
Many theories of categorization do not address the relationshipbetween compensation and categorization. Compensation is oftenassumed to be a low-level autonomous process occurring prior toand independently of categorization (though see Mitterer & deRuiter, 2008). Moreover, in laboratory learning studies, it doesn’tmatter whether perceptual cues undergo compensation. Boundar-ies, prototypes, and exemplars can be constructed with eithercompensated or uncompensated inputs, and most experiments con-trol for factors that demand compensation like lighting.
However, there are conditions under which such assumptionsare unwarranted. First, if the input dimensions were context de-pendent and categorization was difficult, compensation couldmake a difference in whether a particular model of categorizationcould classify the stimuli with the same accuracy as humans. Thisis unlikely to matter in laboratory-learning tasks where categori-zation is relatively unambiguous, but it may be crucial for real-lifecategory systems like speech in which tokens cannot always beunambiguously identified. Here, a model’s accuracy may be asmuch a product of the information in the input as the nature of themappings.
Second, if compensation is a function of categorization wecannot assume it is autonomous. Color constancy, for example, isstronger at hue values near category prototypes (Kulikowski &Vaitkevicius, 1997). In speech, phonemes surrounding a targetphoneme affect the same cues, such that the interpretation of a cuefor one phoneme may depend on the category assigned to others(Cole, Linebaugh, Munson, & McMurray, 2010; Sawusch & Pis-oni, 1974; Smits, 2001a, 2001b; Whalen, 1989; though see Nearey,1990). Such bidirectional effects imply that categorization andcompensation are not independent, and models of categorizationmust account for both, something that few models in any domainhave considered (though see Smits, 2001a, 2001b).
Finally, and perhaps most important, some theories of catego-rization make explicit claims about the nature of the informationleading to categorization. In vision, Gibsonian approaches (Gib-son, 1966) and geon theory (e.g., Biederman, 1995) posit invariantcues for object recognition, but in speech perception, the theory ofacoustic invariance (Blumstein & Stevens, 1980; Lahiri, Gewirth,& Blumstein, 1984; Stevens & Blumstein, 1978) and quantaltheory (Stevens, 2002; Stevens & Keyser, 2010) posit invariantcues for some phonetic distinctions (cf. Sussman, Fruchter, Hil-bert, & Sirosh, 1998). Other approaches, such as the version ofexemplar theory posited in speech, explicitly claim that althoughthere may be no invariant perceptual cues, category representationscan cope with this without compensation (e.g., Pisoni, 1997). Insuch theories, compensation prior to categorization is not neces-sary, and this raises the possibility that normalization does notoccur at all as part of the categorization process.
Any theory of categorization can be evaluated on two levels: themechanisms that partition the perceptual space and the nature ofthe perceptual space. This latter construct refers to the informa-tional assumptions of a theory and is logically independent fromthe categorization architecture. For example, one could build aprototype theory on either raw or compensated inputs, and exem-plars could be represented in either format. In Marr’s (1982) levelsof analysis, the informational assumptions of a theory can be seenas part of the first, computational level of analysis, where theproblem is defined in terms of input–output relationships, and themechanism of categorization may be best described at the algo-rithmic level. However, when the aforementioned conditions aremet, understanding the informational assumptions of a theory maybe crucial for evaluating it. Contrasting with Marr, we argue thatlevels of analysis may constrain each other: One must properlycharacterize a problem to distinguish solutions.
Speech perception presents a compelling domain in which toexamine these issues, as all of the above conditions are met. Thus,the purpose of this study is to evaluate the informational assump-tions of several approaches to speech categorization and to askwhat kind of information is necessary to support listener-likecategorization. This was done by collecting a large data set ofmeasurements on a corpus of speech tokens and manipulating theinput to a series of categorization models to determine whatinformational structure is necessary to obtain listener-like perfor-mance. Although our emphasis is on theories of speech perception,consistent with a history of work relating speech categories togeneral principles of categorization,1 this may also uncover prin-ciples that are relevant to categorization more broadly.
1 There is a long history of empirical work showing striking common-alities between speech perception and other domains of perceptual catego-rization. Most famously, categorical perception is seen in the perception ofspeech (Liberman et al., 1957), color (Bornstein & Korda, 1984), and faces(Beale & Keil, 1995; to name a few); the later refutations of categoricalperception (e.g., Schouten et al., 2003; Toscano et al., 2010) have also beenobserved in color (Roberson & Davidoff, 2000; Roberson et al., 2009) andfaces (Roberson & Davidoff, 2000). Prototype effects are seen in both dotpatterns (Posner & Keele, 1968) and speech categories (Miller, 1997;among many other domains). Effects of top-down expectations can beobserved in color categorization (Mitterer & de Ruiter, 2008) and speech(Ganong, 1980), though they may work differently in music (McMurray,Dennhardt, & Struck-Marcell, 2008). Finally, evidence for a
220 MCMURRAY AND JONGMAN

The remainder of this introduction discusses the classic prob-lems in speech perception and the debate over compensation ornormalization. We then present a new approach to compensationthat addresses concerns about whether fine-grained acoustic detailis preserved. Finally, we describe the speech categories we inves-tigated, the eight fricatives of English. Section 2 presents theempirical work that is the basis of our modeling: a corpus of 2,880fricatives, with measurements of 24 cues for each, and listeners’categorization for a subset of them. Sections 3 and 4 then presenta series of investigations in which the input to a standard catego-rization model is manipulated to determine which informationalaccount best yields listener-like performance.
1.1. The Information Necessary for Speech Perception
Speech perception is increasingly being described as a problemof mapping from continuous acoustic cues to categories (e.g., Holt& Lotto, 2010; Nearey, 1997; Oden & Massaro, 1978). We take arelatively theory-neutral approach to what a cue is, defining a cueas a specific measurable property of the speech signal that canpotentially be used to identify a useful characteristic like thephoneme category or the talker. Our use of this term is not meantto imply that a specific cue is actually used in speech perception,or that a given cue is the fundamental property that is encodedduring perception. Cues are merely a convenient way to measureand describe the input.
A classic framing in speech perception is the problem of lack ofinvariant cues in the signal for categorical distinctions like pho-nemes. Most speech cues are context dependent, and there are few,if any, that invariantly signal a given phonetic category. There isdebate on how to solve this problem (e.g., Fowler, 1996; Lind-blom, 1996; Ohala, 1996) and about the availability of invariantcues (e.g., Blumstein & Stevens, 1980; Lahiri et al., 1984; Suss-man et al., 1998). But there is little question that this is a funda-mental issue that theories of speech perception must address. Thus,the information in the signal to support categorization is of fun-damental importance to theories of speech perception.
As a result of this, a common benchmark for theories of speechperception is accuracy, the ability to separate categories. Thisbenchmark is applied to complete theories (e.g., Hillenbrand &Houde, 2003; Johnson, 1997; Maddox, Molis, & Diehl, 2002;Nearey, 1990; Smits, 2001a), and even to phonetic analyses ofparticular phonemic distinctions (e.g., Blumstein & Stevens, 1980,1981; Forrest, Weismer, Milenkovic, & Dougall, 1988; Jongman,Wayland, & Wong, 2000; Stevens & Blumstein, 1978; Werker etal., 2007). The difficulty attaining this benchmark means thatsometimes accuracy is all that is needed to validate a theory. Thus,speech meets our first condition: Categorization is difficult, andthe information available to it matters.
Classic approaches to the lack of invariance problem positednormalization or compensation processes for coping with specificsources of variability. In speech, normalization is typically definedas a process that factors out systematic but phonologically non-distinctive acoustic variability (e.g., systematic variability thatdoes not distinguish phonemes) for the purposes of identifyingphonemes or words. Normalization is presumed to operate on theperceptual encoding prior to categorization, and classic normaliza-tion processes include rate (e.g., Summerfield, 1981) and talker(Nearey, 1978; see chapters in Johnson & Mullenix, 1997) nor-malization. Not all systematic variability is nonphonological, how-ever; the acoustic signal at any point in time is always affected bythe preceding and subsequent phonemes, due to a phenomenonknown as coarticulation (e.g., Cole et al., 2010; Delattre, Liber-man, & Cooper, 1955; Fowler & Smith, 1986; Ohman, 1966). Asa result, the term compensation has often been invoked as a moregeneral term to describe both normalization (e.g., compensatingfor speaking rate) and processes that cope with coarticulation (e.g.,Mann & Repp, 1981). Whereas normalization generally describesprocesses at the level of perceptual encoding, compensation can beaccomplished either precategorically or as part of the categoriza-tion process (e.g., Smits, 2001b). Due to this greater generality, weuse the term compensation throughout this article.
A number of studies have shown that listeners compensate forcoarticulation in various domains (e.g., Fowler & Brown, 2000;Mann & Repp, 1981; Pardo & Fowler, 1997). Crucially, the factthat portions of the signal are affected by multiple phonemes raisesthe possibility that how listeners categorize one phoneme mayaffect how subsequent or preceding cues are interpreted. Forexample, consonants can alter the formant frequencies listeners useto categorize vowels (Ohman, 1966). Do listeners compensate forthis variability, by categorizing the consonant and then interpretingthe formant frequencies differently on the basis of the consonant?Or, do they compensate for coarticulation by tracking low-levelcontingencies between the cues for consonants and vowels orhigher level contingencies between phonemes? Studies on thishave offered conflicting results (Mermelstein, 1978; Nearey, 1990;Smits, 2001a; Whalen, 1989).
Clearer evidence for such bidirectional processes comes fromwork on talker identification. Nygaard, Sommers, and Pisoni(1994), for example, showed that learning to classify talkers im-proves speech perception, and a number of studies have suggestedthat visual cues about a talker’s gender affect how auditory cuesare interpreted (Johnson, Strand, & D’Imperio, 1999; Strand,1999). Thus, interpretation of phonetic cues may be conditioned onjudgments of talker identity. As a whole, then, there is ampleinterest, and some evidence, that compensation and categorizationare interactive, the second condition under which informationalfactors are important for categorization.
Compensation is not a given, however. Some forms of compen-sation may not fully occur prior to lexical access. Talker voice, orindexical properties of the signal (which do not contrast individualphonemes and words), affects a word’s recognition (Creel, Aslin,& Tanenhaus, 2008; McLennan & Luce, 2005) and memory(Bradlow, Nygaard, & Pisoni, 1999; Palmeri, Goldinger, & Pisoni,1993). Perhaps most tellingly, speakers’ productions graduallyreflect indexical detail in auditory stimuli they are shadowing(Goldinger, 1998), suggesting that such detail is part of the repre-sentations that mediate perception and production. Thus, compen-
graded competition between categories can be seen in both speech(McMurray, Aslin, et al., 2008) and color perception (Huette & McMurray,2010). Perhaps most important, many of the models of categorization inspeech rely on similar principles to categorization in nonspeech, principleslike exemplar encoding (Goldinger, 1998) or prototypes (Miller, 1997), andmany of the same models have been applied to both speech and nonspeechproblems (e.g., Goldinger, 1998; Oden & Massaro, 1978).
221STATISTICAL MODELS OF FRICATIVE PERCEPTION
sation for talker voice is not complete—indexical factors are not(completely) removed from the perceptual representations used forlexical access and may even be stored with lexical representations(Pisoni, 1997). This challenges the necessity of compensation as aprecursor to categorization.
Thus, informational factors are essential to understandingspeech categorization: The signal is variable and context depen-dent; compensation may be dependent on categorization but mayalso be incomplete. As a result, it is not surprising that sometheories of speech perception make claims about the informationnecessary to support categorization.
On one extreme, although many researchers have abandonedhope of finding invariant cues (e.g., Lindblom, 1996; Ohala,1996), for others, the search for invariance is ongoing. A variety ofcues have been examined, such as burst onset spectra (Blumstein& Stevens, 1981; Kewley-Port & Luce, 1984) or locus equationsfor place of articulation in stop consonants (Sussman et al., 1998;Sussman & Shore, 1996) and duration ratios for voicing (e.g.,Pind, 1995; Port & Dalby, 1982). Most important, quantal theory(Stevens, 2002; Stevens & Keyser, 2010) posits that speech per-ception harnesses specific invariant cues for some contrasts (par-ticularly manner of articulation, e.g., the b–w distinction). Invari-ance views, broadly construed, then, make the informationalassumptions that (a) a small number of cues should suffice formany types of categorization and that (b) compensation is notrequired to harness them.
On the other extreme, exemplar approaches (e.g., Goldinger,1998; Hawkins, 2003; Johnson, 1997; Pierrehumbert, 2001, 2003)argue that invariant cues are neither necessary nor available. If thesignal is represented faithfully and listeners store many exemplarsof each word, context dependencies can be overcome withoutcompensation. Each exemplar in memory is a holistic chunk con-taining both the contextually conditioned variance and the contextand is matched in its entirety to incoming speech. Because of this,compensation is not needed and may impede listeners by elimi-nating fine-grained detail that helps sort things out (Pisoni, 1997).Broadly construed, then, exemplar approaches make the informa-tional assumptions that (a) input must be encoded in fine-graineddetail with all available cues and that (b) compensation or normal-ization does not occur.
Finally, in the middle lies a range of theoretical approaches thatdo not make strong informational claims. For lack of a better term,we call these cue-integration approaches, and they include thefuzzy logical model (FLMP; Oden, 1978; Oden & Massaro, 1978),the normalized a posteriori probability model (NAPP; Nearey,1990), the hierarchical categorization of coarticulated phonemes(HICAT; Smits, 2001a, 2001b), statistical learning models (Mc-Murray, Aslin, & Toscano, 2009; Toscano & McMurray, 2010),and connectionist models like TRACE (Elman & McClelland,1986). Most of these can be characterized as prototype models,though they are also sensitive to the range of variation. All assumethat multiple (perhaps many) cues participate in categorization andthat these cues must be represented more or less veridically.However, few make strong claims about whether explicit compen-sation of some form occurs (although many implementations useraw cue values for convenience). In fact, given the high-dimensional input, normalization may not be needed—categoriesmay be separable with a high-dimensional boundary in raw cuespace (e.g., Nearey, 1997), and these models have been in the
forefront of debates as to whether compensation for coarticulationis dependent on categorization (e.g., Nearey, 1990, 1992, 1997;Smits, 2001a, 2001b). Thus it is an open question whether com-pensation is needed in such models.
Across theories, two factors describe the range of informationalassumptions. Invariance accounts can be distinguished from ex-emplar and cue-integration accounts on the basis of number ofcues (and their invariance). The other factor is whether cuesundergo compensation or not. On this, exemplar and invarianceaccounts argue that cues do not undergo explicit compensation,whereas cue-integration models appear more agnostic. Our goalwas to contrast these informational assumptions using a commoncategorization model. However, this requires a formal approach tocompensation, which is not currently available. Thus, the nextsection describes several approaches to compensation and elabo-rates a new, generalized approach that builds on their strengths tooffer a more general and formally well-specified approach basedon computing cues relative to expectations (C-CuRE).
1.2. Normalization, Compensation, and C-CuRE
Classic normalization schemes posit interactions between cuesthat allow the perceptual system to remove the effects of con-founding factors like speaker and rate. These are bottom-up pro-cesses motivated by articulatory relationships and signal process-ing. Such accounts are most associated with work on vowelcategorization (e.g., Hillenbrand & Houde, 2003; Rosner & Pick-ering, 1994), though to some extent complex cue combinationslike locus equations (Sussman et al., 1998) or consonant–vowel(CV) ratios (Port & Dalby, 1982) also fall under this framework.Such approaches offer concrete algorithms for processing theacoustic signal, but they have not led to broader psychologicalprinciples for compensation.
Other approaches emphasize principles at the expense of com-putational specificity. Fowler’s (1984; Fowler & Smith, 1986;Pardo & Fowler, 1997) gestural parsing posits that speech is codedin terms of articulatory gestures and that overlapping gestures areparsed into underlying causes. So, for example, when a partiallynasalized vowel precedes a nasal stop, the nasality gesture isassigned to the stop (a result of anticipatory coarticulation), be-cause English does not use nasalized vowels contrastively (as doesFrench), and the vowel is perceived as more oral (Fowler &Brown, 2000). As part of direct realist accounts, gestural parsingcompensates only for coarticulation—the initial gestural encodingovercomes variation due to talker and rate.
Gow (2003) argued that parsing need not be gestural. Hisfeature–cue parsing suggests that similar results can be achievedby grouping principles operating over acoustic features. This toohas been primarily associated with coarticulation—variation intalker and/or rate is not discussed. However, the principle capturedby both accounts is that by grouping overlapping acoustic cues orgestures, the underlying properties of the signal can be revealed(Ohala, 1981).
In contrast, Kluender and colleagues argued that low-level au-ditory mechanisms may do some of the work of compensation.Acoustic properties (like frequency) may be interpreted relative toother portions of the signal: A 1,000-Hz tone played after a 500-Hztone will sound higher than after an 800-Hz tone. This is supportedby findings that nonspeech events (e.g., pure tones) can create
222 MCMURRAY AND JONGMAN
seemingly compensatory effects on speech (e.g., Holt, 2006;Kluender, Coady, & Kiefte, 2003; Lotto & Kluender, 1998; thoughsee Viswanathan, Fowler, & Magnuson, 2009). Thus, auditorycontrast, either from other events in the signal or from long-termexpectations about cues (Kluender et al., 2003) may alter theinformation available in the signal.
Parsing and contrast accounts offer principles that apply acrossmany acoustic cues, categories, and sources of variation. However,they have not been formalized in a way that permits a test of thesufficiency of such mechanisms to support categorization ofspeech input. All three accounts also make strong representationalclaims (articulatory vs. auditory), and a more general approach tocompensation may be more useful (Ohala, 1981).
In developing a principled, yet computationally specific, ap-proach to compensation, one final concern is the role of finephonetic detail. Traditional approaches to normalization assumedbottom-up processes that operate autonomously to clean up thesignal before categorization, stripping away factors like talker orspeaking rate.2 However, research has shown that such seeminglyirrelevant detail is useful to phonetic categorization and wordrecognition. Word recognition is sensitive to within-category vari-ation in voice onset time (Andruski, Blumstein, & Burton, 1994;McMurray, Aslin, Tanenhaus, Spivey, & Subik, 2008; McMurray,Tanenhaus, & Aslin, 2002), indexical detail (Creel et al., 2008;Goldinger, 1998), word-level prosody (Salverda, Dahan, & Mc-Queen, 2003), coarticulation (Dahan, Magnuson, Tanenhaus, &Hogan, 2001; Marslen-Wilson & Warren, 1994), and alternationslike reduction (Connine, 2004; Connine, Ranbom, & Patterson,2008) and assimilation (Gow, 2003). In many of these cases, suchdetail facilitates processing by allowing listeners to anticipateupcoming materials (Gow, 2001, 2003; Martin & Bunnell, 1981,1982), resolve prior ambiguity (Gow, 2003; McMurray, Tanen-haus, & Aslin, 2009), and disambiguate words faster (Salverda etal., 2003). Such evidence has led some to reject normalizationaltogether in favor of exemplar approaches (e.g., Pisoni, 1997;Port, 2007), which preserve continuous detail.
What is needed is a compensation scheme that is applicableacross different cues and sources of variance, is computationallywell-specified, and can retain and harness fine-grained acousticdetail. Cole et al. (2010; McMurray, Cole, & Munson, in press)introduced such a scheme in an analysis of vowel coarticulation;we develop it further as a more complete account of compensation.This account, computing cues relative to expectations (C-CuRE),combines grouping principles from parsing accounts with therelativity of contrast accounts.
Under C-CuRE, incoming acoustic cues are initially encodedveridically, but as different sources of variance are categorized,cues are recoded in terms of their difference from expected values.Consider a stop-vowel syllable. The fundamental frequency (F0) atthe onset of the vowel is a secondary cue for voicing. In the dataset we describe here, F0 at vowel onset had a mean of 149 Hz forvoiced sounds and 163 Hz for voiceless ones, though it wasvariable (SDvoiced � 43.2; SDvoiceless � 49.8). Thus F0 is infor-mative for voicing, but any given F0 is difficult to interpret. An F0of 154 Hz, for example, could be high for a voiced sound or lowfor a voiceless one. However, once the talker is identified (on thebasis of other cues or portions of the signal), this cue may becomemore useful. If the talker’s average F0 was 128 Hz, then thecurrent 154 Hz is 26 Hz higher than expected and likely the result
of a voiceless segment. Such an operation removes the effects oftalker on F0 by recoding F0 in terms of its difference from theexpected F0 for that talker, making it more useful for voicingjudgments.
C-CuRE is similar to both versions of parsing in that it partialsout influences on the signal at any time point. It also builds onauditory-contrast approaches by positing that acoustic cues arecoded as the difference from expectations. However, it is alsomore general than these theories. Unlike gestural and feature–cueparsing, talker is parsed from acoustic cues in the same way ascoarticulation; unlike contrast accounts, expectations can be basedon abstractions, and there is an explicit role for categorization(phonetic categories, talkers, etc.) in compensation.
C-CuRE is straightforward to implement using linear regression.To do this, first a regression equation is estimated predicting thecue value from the factor(s) being parsed out, for example, F0 asa function of talker gender. Next, for any incoming speech token,this formula is used to generate the expected cue value given whatis known (e.g., if the speaker is known), and the actual cue valueis subtracted from it. The residual becomes the estimate of contrastor deviation from expectations. In terms of linear regression, then,parsing in the C-CuRE framework separates the variance in anycue into components and uses the regression formula to generateexpectations on which the remaining variance can be used to doperceptual work.
When the independent factors are dichotomous (e.g., male–female), the regression predictions will be based on the cell meansof each factor. This could lead to computational intractability if theregression had to capture all combinations of factors. For example,a vowel’s first formant frequency (F1) is influenced by the talker’sgender, the voicing of neighboring consonants, and the height ofthe subsequent vowel. If listeners required cell means of thefour-way Talker � Initial Voicing � Final Voicing � VowelHeight contrast to generate expectations, it is unlikely that theycould track all of the possible combinations of influences on a cue.However, Cole et al. (2010; McMurray et al., in press) demon-strated that by performing the regression hierarchically (e.g., firstpartialing out the simple effect of talker, then the simple effect ofvoicing, then vowel height, and so on), substantial improvementscan be made in the utility of the signal using only simple effects,without needing higher order interactions.
In sum, C-CuRE offers a somewhat new approach to compen-sation that is computationally well specified, yet principled. Itmaintains a continuous representation of cue values and does notdiscard variation due to talker, coarticulation, and the like. Rather,C-CuRE capitalizes on this variation to build representations forother categories. It is neutral with respect to whether speech isauditory or gestural, but consistent with principles from bothparsing approaches, and with the notion of contrast in auditorycontrast accounts. Finally, C-CuRE explicitly demands a catego-rization framework: Compensation occurs as the informational
2 Such accounts did not imply that such factors were eliminated fromevery level of encoding, but rather that they were stripped away fromencodings used during phonetic categorization. Indexical variation, forexample, would be posited to be eliminated in the representations thatsupport phonological categorization while still being available to supportspeaker identification.
223STATISTICAL MODELS OF FRICATIVE PERCEPTION
content of the signal is interpreted relative to expectations drivenby categories.
The goal of this project is to evaluate the informational assump-tions of theories of speech categorization in terms of compensatedversus uncompensated inputs, a question at the computational level(Marr, 1982). Testing this quantitatively requires that we assume aparticular form of compensation, a solution properly described atthe algorithmic level, and existing forms of compensation do nothave the generality or computational specificity to be applied.C-CuRE offers such a general, yet implementable compensationscheme, and as a result, our test of compensation at the informationlevel also tests this specific processing approach.
Such a test has been conducted only in limited form by Cole etal. (2010). This study used parsing in the C-CuRE framework toexamine information used to anticipate upcoming vowels and didnot examine compensation for variance in a target segment. Itshowed that the recoding of formant values as the difference fromexpectations on the basis of talker and intervening consonant wasnecessary to leverage coarticulatory information for anticipatingupcoming vowels. This validated C-CuRE’s ability to harnessfine-grained detail but did not address its generality, as only twocues were examined (F1 and F2); these cues were similar in form(both are frequencies); only a small number of vowels were used;and results were not compared with listener data. Thus, it is anopen question as to how well C-CuRE scales to dozens of cuesrepresenting different signal components (e.g., amplitudes, dura-tions, and frequencies) in the context of a larger set of categories,and it is unclear whether its predictions match listeners’.
1.3. Logic and Overview
Our goal was to contrast three informational accounts: (a) that asmall number of invariant cues distinguish speech categories; (b)that a large number of cues is sufficient without compensation; and(c) that compensation must be applied. To accomplish this, wemeasured a set of cues from a corpus of speech sounds and usedthem to train a generic categorization model. This was comparedwith listener performance on a subset of that corpus. By manipu-lating the cues available to the model and whether compensationwas applied, we assessed the information required to yield listenerperformance.
One question that arises is which phonemes to use. Ideally, theyshould be difficult to classify, as accuracy is likely to be a distin-guishing factor. There should also be a large number of categoriesfor a more realistic test. For a fair test, the categories should havea mix of cues in which some have been posited to be invariant andothers more contextually determined. Finally, C-CuRE suggeststhat the ability to identify context (e.g., the neighboring phoneme)underlies compensation. Thus, during perceptual testing, it wouldbe useful to be able to separate the portion of the stimulus thatprimarily cues the phoneme categories of interest from portionsthat primarily cue contextual factors. The fricatives of Englishmeet these criteria.
1.4. Phonetics of Fricatives
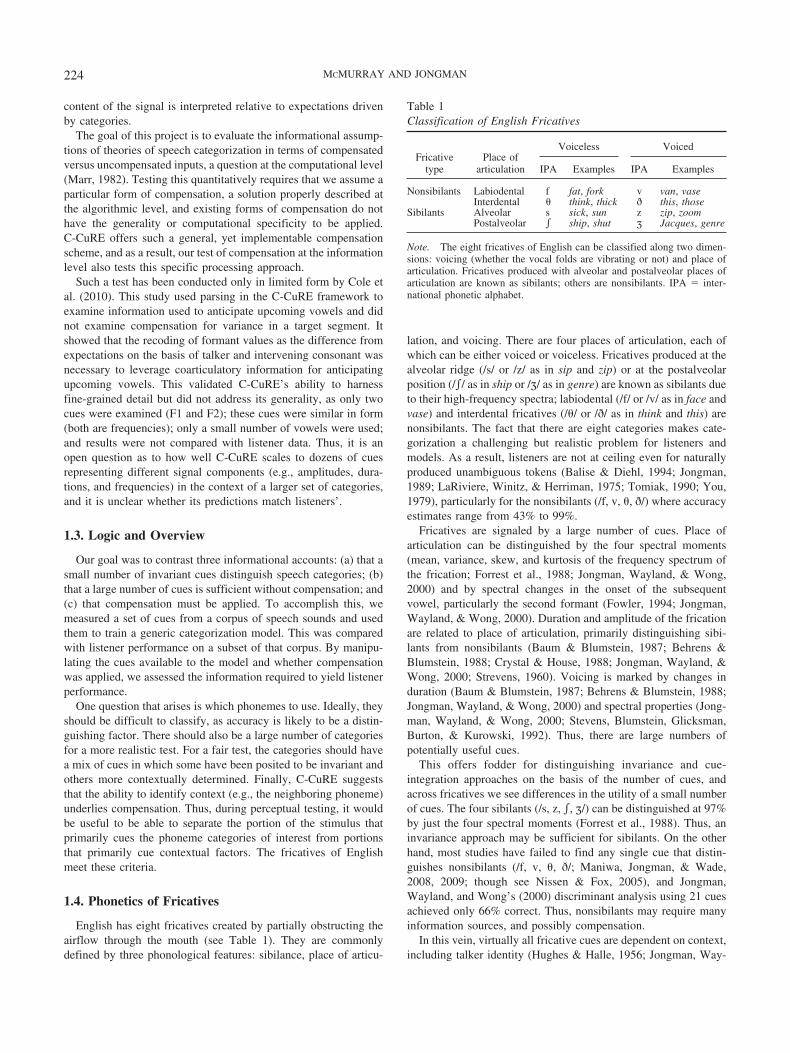
English has eight fricatives created by partially obstructing theairflow through the mouth (see Table 1). They are commonlydefined by three phonological features: sibilance, place of articu-
lation, and voicing. There are four places of articulation, each ofwhich can be either voiced or voiceless. Fricatives produced at thealveolar ridge (/s/ or /z/ as in sip and zip) or at the postalveolarposition (/�/ as in ship or /�/ as in genre) are known as sibilants dueto their high-frequency spectra; labiodental (/f/ or /v/ as in face andvase) and interdental fricatives (/�/ or /ð/ as in think and this) arenonsibilants. The fact that there are eight categories makes cate-gorization a challenging but realistic problem for listeners andmodels. As a result, listeners are not at ceiling even for naturallyproduced unambiguous tokens (Balise & Diehl, 1994; Jongman,1989; LaRiviere, Winitz, & Herriman, 1975; Tomiak, 1990; You,1979), particularly for the nonsibilants (/f, v, �, ð/) where accuracyestimates range from 43% to 99%.
Fricatives are signaled by a large number of cues. Place ofarticulation can be distinguished by the four spectral moments(mean, variance, skew, and kurtosis of the frequency spectrum ofthe frication; Forrest et al., 1988; Jongman, Wayland, & Wong,2000) and by spectral changes in the onset of the subsequentvowel, particularly the second formant (Fowler, 1994; Jongman,Wayland, & Wong, 2000). Duration and amplitude of the fricationare related to place of articulation, primarily distinguishing sibi-lants from nonsibilants (Baum & Blumstein, 1987; Behrens &Blumstein, 1988; Crystal & House, 1988; Jongman, Wayland, &Wong, 2000; Strevens, 1960). Voicing is marked by changes induration (Baum & Blumstein, 1987; Behrens & Blumstein, 1988;Jongman, Wayland, & Wong, 2000) and spectral properties (Jong-man, Wayland, & Wong, 2000; Stevens, Blumstein, Glicksman,Burton, & Kurowski, 1992). Thus, there are large numbers ofpotentially useful cues.
This offers fodder for distinguishing invariance and cue-integration approaches on the basis of the number of cues, andacross fricatives we see differences in the utility of a small numberof cues. The four sibilants (/s, z, �, �/) can be distinguished at 97%by just the four spectral moments (Forrest et al., 1988). Thus, aninvariance approach may be sufficient for sibilants. On the otherhand, most studies have failed to find any single cue that distin-guishes nonsibilants (/f, v, �, ð/; Maniwa, Jongman, & Wade,2008, 2009; though see Nissen & Fox, 2005), and Jongman,Wayland, and Wong’s (2000) discriminant analysis using 21 cuesachieved only 66% correct. Thus, nonsibilants may require manyinformation sources, and possibly compensation.
In this vein, virtually all fricative cues are dependent on context,including talker identity (Hughes & Halle, 1956; Jongman, Way-
Table 1Classification of English Fricatives
Fricativetype
Place ofarticulation
Voiceless Voiced
IPA Examples IPA Examples
Nonsibilants Labiodental f fat, fork v van, vaseInterdental � think, thick ð this, those
Sibilants Alveolar s sick, sun z zip, zoomPostalveolar � ship, shut � Jacques, genre
Note. The eight fricatives of English can be classified along two dimen-sions: voicing (whether the vocal folds are vibrating or not) and place ofarticulation. Fricatives produced with alveolar and postalveolar places ofarticulation are known as sibilants; others are nonsibilants. IPA � inter-national phonetic alphabet.
224 MCMURRAY AND JONGMAN

land, & Wong, 2000), the adjacent vowel (Jongman, Wayland, &Wong, 2000; LaRiviere et al., 1975; Soli, 1981; Whalen, 1981),and sociophonetic factors (Jongman, Wang, & Sereno, 2000; Mun-son, 2007; Munson, McDonald, DeBoe, & White, 2006). This istrue even for cues like spectral moments that have been posited tobe relatively invariant.
Thus, fricatives represent an ideal platform for examining theinformational assumptions of models of speech categorization.They are difficult to categorize, and listeners can potentially utilizea large number of cues to do so. Both invariant and cue-combination approaches may be appropriate for some fricatives,but the context dependence of many, if not all, cues raises thepossibility that compensation is necessary. Given the large numberof cues, it is currently uncertain what information will be requiredfor successful categorization.
1.5. Research Design
We first collected a corpus of fricative productions and mea-sured a large set of cues in both the frication and vocalic portionof each. Next, we presented a subset of this corpus to listeners inan identification experiment with and without the vocalic portion.Although this portion contains a number of secondary cues tofricative identity, it is also necessary for accurate identification ofthe talker (Lee, Dutton, & Ram, 2010) and vowel, which isnecessary for compensating in the C-CuRE framework. The com-plete corpus of measurements, including the perceptual results, isavailable in the online supplemental materials. Finally, we imple-mented a generic categorization model using logistic regression(see also Cole et al., 2010; McMurray et al., in press), which isinspired by Nearey’s (1990, 1997) NAPP model and Smits’s(2001a, 2001b) HICAT model. This model was trained to predictthe intended production (not listeners’ categorizations, as in NAPPand some versions of HICAT) from particular sets of cues in eitherraw form or after parsing. The model’s performance was thencompared with listeners’ to determine what informational structureis needed to create their pattern of responding. This was used tocontrast three informational accounts distinguished by the numberof cues and the presence or absence of compensation.
2. Empirical Work
2.1. The Corpus
The corpus of fricatives for this study was based on the record-ings and measurements of Jongman, Wayland, and Wong (2000),with additional measurements of 10 new cues on these tokens.
2.1.1. Method and measurements. Jongman, Wayland, andWong (2000) analyzed 2,873 recordings of the eight Englishfricatives /f, v, �, ð, s, z, �, �/. Fricatives were produced in theinitial position of a consonant–vowel–consonant (CVC) syllable inwhich the vowel was /i, e, æ, ɑ, o, u/, and the final consonant was/p/. Twenty speakers (10 women, 10 men) produced each CVCthree times in the carrier phrase “Say ____ again.” This led to 8(fricatives) � 6 (vowels) � 3 (repetitions) � 20 (speakers), or2,880 tokens, of which 2,873 were analyzed. All recordings weresampled at 22 kHz (16-bit quantization, 11-kHz low-pass filter).The measurements reported here are all of the original measure-ments of Jongman, Wayland, and Wong (2000; the JWW data-
base),3 although some cues were collapsed (e.g., spectral momentsat two locations). We also measured 10 new cues from thesetokens to yield a set of 24 cues for each fricative. A complete listis shown in Table 2, and Figure 1 shows a labeled waveform andspectrogram of a typical fricative recording. Details on the mea-surements of individual cues and the transformations applied tothem can be found in the Appendix.
We deliberately left out compound or relative cues (based ontwo measured values) like locus equations or duration ratios toavoid introducing additional forms of compensation into our dataset. We did include the independent measurements that contributeto such cues (e.g., duration of the vowel and consonant separately).Compound cues are discussed (and modeled in a similar frame-work) in the supplemental materials (Note 6).
The final set of 24 cues represents to the best of our knowledgeall simple cues that have been proposed for distinguishing place,voicing, or sibilance in fricatives and also includes a number ofcues not previously considered (such as F3, F4, and F5, andlow-frequency energy).
2.1.2. Results. Because the purpose of this corpus is toexamine the information available to categorization, we do notreport a complete phonetic analysis. Instead, we offer a briefanalysis that characterizes the information in this data set, askingwhich cues could be useful for fricative categorization and theeffect of context (talker and vowel) on them. A complete analysisis found in the supplemental materials (Note 1); see Jongman,Wayland, and Wong (2000) for extensive analyses of those mea-sures.
Our analyses consisted of a series of hierarchical linear regres-sions. In each one, a single cue was the dependent variable, and theindependent variables were a set of dummy codes4 for fricativeidentity (seven variables). Each regression first partialed out theeffect of talker (19 dummy codes) and vowel (five dummy codes),before entering the fricative terms into the model. We also ranindividual regressions breaking fricative identity down into pho-netic features (sibilance, place of articulation, and voicing). Table3 displays a summary.
Every cue was affected by fricative identity. Although effect sizesranged from large (10 cues had Rchange
2 � .40) to very small (root-mean-square [RMS]vowel, the smallest: Rchange
2 � .011), all werehighly significant. Even cues that were originally measured to com-pensate for variance in other cues (e.g., vowel duration to normalizefricative duration) had significant effects. Interestingly, two of thenew measures (F4 and F5) had surprisingly large effects.
A few cues could clearly be attributed to one feature over others,although none was associated with a single feature. The twoduration measures and low-frequency energy were largely associ-ated with voicing; RMSF and F5AMPF were largely affected by
3 The exception to this is the second formant frequency (F2), which wasremeasured to ensure consistency between it and the other four formants interms of the procedure and the measurer.
4 Dummy coding is a standard technique in regression (Cohen & Cohen,1983) in which an independent factor with multiple levels (e.g., talker) isrecoded into several variables. Each of the N � 1 levels of the factor isgiven a single variable that is coded 1 if the current data point has that leveland 0 otherwise. These variables are then entered as a group into theregression.
225STATISTICAL MODELS OF FRICATIVE PERCEPTION

sibilance; and the formant frequencies F2, F4, and F5 had moder-ate effects of place of articulation for sibilants and nonsibilants.However, the bulk of the cues were correlated with multiplefeatures.
Although few cues were uniquely associated with one feature,most features had strong correlates. Many cues were sensitive toplace of articulation in sibilants, suggesting an invariance approachmay be successful for distinguishing sibilants. However, therewere few cues for place in nonsibilants (F4, F5, and the third andfourth moments in the transition). These showed only moderate tolow effect sizes (none greater than .1) and were context dependent.Thus, categorizing nonsibilants may require at least cue integra-tion, and potentially, compensation.
We next asked if any cues appeared more invariant than others.That is, are there cues that are correlated with a single feature(place of articulation, sibilance, or voicing) but not with context?There is no standard for what statistically constitutes an invariantcue, so we adopted a simple criterion based on Cohen and Cohen’s(1983) definition of effect sizes as small (R2 � .05), medium(.05 � R2 � .15), and large (R2 � .15): A cue is invariant if it hada large effect of a single feature (sibilance, place of articulation,voicing) and at most, small effects of context.
No cue met this definition. Contextual factors (talker and vowel)accounted for a significant portion of the variance in every cue,particularly cues in the vocalic portion. However, relaxing thiscriterion to allow moderate context effects yielded several.
Peak frequency (MaxPF) was highly correlated with place ofarticulation (Rchange
2 � .483), was less so with sibilance (R2 �.260; it distinguishes /s/ from /�/), and was virtually uncorrelatedwith voicing (R2 � .004). Although it was moderately related totalker (R2 � .084), it was not related to vowel. The narrow-band
Figure 1. Annotated waveform and spectrogram of a typical sample inthe corpus, /�ip/ “sheep.” Annotations indicate a subset of the cues that aredescribed in Table 2. W1, W2, and W3 refer to Window 1, Window 2, andWindow 3, respectively.
Table 2Summary of the Cues Included in the Present Study
Cue VariableCue in
frication Description Cue for Source
Peak frequency MaxPF Yes Frequency with highest amplitude Place JWWFrication duration DURF Yes Duration of frication Voicing JWWVowel duration DURV No Duration of vocalic portion Voicing JWWFrication RMS RMSF Yes Amplitude of frication Sibilance JWWVowel RMS RMSV No Amplitude of vocalic portion Compensation JWWF3 narrow-band amplitude (frication) F3AMPF Yes Amplitude of frication at F3 Place NewF3 narrow-band amplitude (vowel) F3AMPV No Amplitude of vowel at F3 Place NewF5 narrow-band amplitude (frication) F5AMPF Yes Amplitude of frication at F5 Place NewF5 narrow-band amplitude (vowel) F5AMPV No Amplitude of vowel at F5 Place NewLow-frequency energy LF Yes Mean RMS below 500 Hz in frication Voicing NewPitch F0 No Fundamental frequency at vowel onset Voicing NewFirst formant F1 No First formant frequency at vowel onset Voicing NewSecond formant F2 No Second formant frequency at vowel onset Place JWWThird formant F3 No Third formant frequency at vowel onset Place NewFourth formant F4 No Fourth formant frequency at vowel onset Unknown NewFifth formant F5 No Fifth formant frequency at vowel onset Unknown NewSpectral mean M1 Yes Spectral mean at two windows in frication noise
(onset and middle)Place/voicing JWW
Spectral variance M2 Yes Spectral variance at two windows in frication noise Place JWWSpectral skewness M3 Yes Spectral skewness at two windows in frication noise Place/voicing JWWSpectral kurtosis M4 Yes Spectral kurtosis at two windows in frication noise Place JWWTransition mean M1trans No Spectral mean in window including end of frication
and vowel onsetPlace JWW
Transition variance M2trans No Spectral variance in window including end offrication and vowel onset
Place JWW
Transition skewness M3trans No Spectral skewness in window including end offrication and vowel onset
Place JWW
Transition kurtosis M4trans No Spectral kurtosis in window including end offrication and vowel onset
Place JWW
Note. JWW indicates cues that were previously reported by Jongman, Wayland, and Wong (2000). Also shown are several derived cues included in asubset of the analysis. The “cue for” column indicates the phonological feature typically associated with each cue. RMS � root-mean-square.
226 MCMURRAY AND JONGMAN

amplitudes in the frication (F3AMPF and F5AMPF) showed asimilar pattern. Amplitude at F3 had a strong relationship to place(R2 � .450; /s/ vs. /�/) and a smaller relationship to sibilance (R2 �.239), whereas amplitude at F5 was related to sibilance (Rchange
2 �.394) but not to place within either class (nonsibilants: Rchange
2 �.001; sibilants: Rchange
2 � .02). Neither was strongly related tovoicing (F3AMPF: Rchange
2 � .002; F5AMPF: Rchange2 � .024), and
they were only moderately affected by context (F3AMPF: Rchange2 �
.098; F5AMPF: Rchange2 � .089).
Finally, the upper spectral moments in the frication werestrongly associated with fricative identity (M2: Rchange
2 � .68; M3:Rchange
2 � .39; M4: Rchange2 � .26; primarily place of articulation)
and only moderately with context (M2: Rchange2 � .04; M3: Rchange
2 �.07; M4: Rchange
2 � .03). This was true to a lesser extent for M1(fricative: Rchange
2 � .42; context: Rchange2 � .12).
In sum, every cue was useful for distinguishing fricatives,although most were related to multiple phonetic features, andevery cue was affected by context. There were several highlypredictive cues that met a liberal criterion for invariance. Together,they may be sufficient for categorization, particularly given thelarge number of potentially supporting cues.
2.2. Perceptual Experiment
The perceptual experiment probed listeners’ categorization of asubset of the corpus. We assessed overall accuracy and variation inaccuracy across talkers and vowels on the complete syllable andthe frication alone. Excising the vocalic portion eliminates somesecondary cues to fricatives but also reduces the ability to catego-rize the vowel and talker, which is required for compensation inC-CuRE. Thus, the difference between the frication-only andcomplete-syllable conditions may offer a crucial platform formodel comparison.
2.2.1. Method. The 2,880 fricatives in the corpus were toomany for listeners to classify in a reasonable amount of time, so thiswas trimmed to include 10 talkers (five women and five men), threevowels (/i, ɑ, u/), and the second repetition. This left 240 stimuli,which were identified twice by each listener. The presence or absenceof the vocalic portion was manipulated between subjects.
Procedure. Listeners were tested in groups of two to four.Stimuli were played from disk over Sony (MDR-7506) head-phones, using BLISS (Mertus, 1989). Stimuli were presented inrandom order at 3-s intervals. Listeners responded by circling oneof nine alternatives (f, v, th, dh, s, z, sh, zh, or “other”) on answersheets. Participants were asked to repeat a few words with /�, ð, �,�/ in the initial position to ensure they were aware of the differencebetween these sounds.
Participants. Forty Cornell University students (20 women,20 men) participated. Twenty served in each condition (completesyllable vs. frication only). All were native speakers of Englishwith no known speech or hearing impairments. Participants werepaid for their participation.
2.2.2. Results. Figure 2 shows a summary of listeners’ accu-racy. In the complete-syllable condition, listeners were highly accu-rate overall (M � 91.2%), particularly on the sibilants (M � 97.4%),whereas in the frication-only condition, performance dropped sub-stantially (M � 76.3%). There were also systematic effects of vowel(Figure 2B) and talker (Figure 2C) on accuracy. It was necessary tocharacterize which of these effects were reliable to identify criteria formodel evaluation. However, this proved challenging given that ourdependent measure has eight possibilities (eight response categories),and the independent factors included condition, talker, vowel, place,and voicing. Because we needed only to identify diagnostic patterns,we simplified this by focusing on accuracy and collapsing the depen-dent measure into a single binary variable: correct or incorrect (thoughsee Note 3 in the supplemental materials for a more descriptiveanalysis of the confusion matrices).
We used generalized estimating equations with a logistic linkingfunction to conduct the equivalent of a repeated-measures analysisof variance (ANOVA; Lipsitz, Kim, & Zhao, 1994). Talker,vowel, place, and voicing were within-subject factors; syllabletype (complete syllable vs. frication only) was a between-subjectsfactor. Because we had only two repetitions of each stimulus persubject, the complete model (subject, five factors, and interactions)was almost fully saturated. Thus, the context factors (talker andvowel) were included as main effects but did not participate ininteractions.
There was a significant main effect of syllable type, Wald �2(1) �69.9, p � .0001, with better performance in the complete-syllablecondition (90.8% vs. 75.4%) for every fricative (Figure 2A). Vowel(Figure 2B) had a significant main effect, Wald �2(2) � 12.1, p � .02:
Table 3Summary of Regression Analyses Examining Effects of Speaker(n � 20), Vowel (n � 6), and Fricative (n � 8) for Each Cue
Cue
Contextual factorFricativeidentity
(df � 7, 2848) Cue forSpeaker
(df � 19, 2860)Vowel
(df � 5, 2855)
MaxPF .084� .493� S, PsDURF .158� .021� .469� S, VDURV .475� .316� .060� VRMSF .081� .657� S, VRMSV .570� .043� .011�
F3AMPF .070� .028� .483� S, PsF3AMPV .140� .156� .076� Pn,a PsF5AMPF .077� .012� .460� SF5AMPV .203� .040� .046�
LF .117� .004† .607� S, VF0 .838� .007� .023�
F1 .064� .603� .082� Vb
F2 .109� .514� .119� S, Pn, PsF3 .341� .128� .054� PnF4 .428� .050� .121� Pn, PsF5 .294� .045� .117� Pn, PsM1 .122� .425� V, PsM2 .036� .678� S, V, PsM3 .064� .387� S, PsM4 .031� .262� PsM1trans .066� .043� .430� S, V, PsM2trans .084� .061� .164� Pn,c PsM3trans .029� .079� .403� S, V, Pn, PsM4trans .031� .069� .192� S, Pn, Ps
Note. Rchange2 values are shown. Missing values were not significant ( p �
.05). The final column shows secondary analyses examining individualcontrasts. Each cue is given the appropriate letter code if the effect size wasmedium or large (Rchange
2 � .05). A few exceptions with smaller effect sizesare marked because there were few robust cues to nonsibilants. Sibilantversus nonsibilant (/s, z, �, �/ vs. /f, v, �, ð/ is coded as S; voicing is codedas V; place of articulation in nonsibilants (/f, v/ vs. /�, ð/) is coded as Pn;and place of articulation in sibilants (/s, z/ vs. /�, �/) is coded as Ps. Cuesare further described in Table 2.a Rchange
2 � .043. b Rchange2 � .045. c Rchange
2 � .038.† p � .05. � p � .0001.
227STATISTICAL MODELS OF FRICATIVE PERCEPTION

Fricatives preceding /i/ had the lowest performance, followed by thosepreceding /ɑ/, and then /u/; both /i/ and /ɑ/ were significantly differentfrom /u/ (/i/: Wald �2[1] � 12.1, p � .001; /ɑ/: Wald �2[1] � 5.5, p �.019). Talker was also a significant source of variance, Wald �2(9) �
278.1, p � .0001, with performance by talker ranging from 75.0% to88.2% (Figure 2C).
Place of articulation was highly significant, Wald �2(3) �312.5, p � .0001. Individual comparisons against the postalveolars
Figure 2. Listeners’ performance (proportion correct) on an 8AFC fricative categorization task. A: Perfor-mance on each of the eight fricatives as function of condition. B: Performance across fricatives as a function ofvowel and condition. C: Performance by condition and speaker. D: Performance as a function of place ofarticulation and condition. E: Performance as a function of place of articulation and voicing across conditions.
228 MCMURRAY AND JONGMAN

(which showed the best performance) showed that all three placesof articulation were significantly worse (labiodental: Wald �2[1] �72.2, p � .0001; interdental: Wald �2[1] � 75.0, p � .0001;alveolar: Wald �2[1] � 51.6, p � .0001), though the large differ-ence between sibilants and nonsibilants was the biggest componentof this effect. A similar place effect was seen in both syllable types(Figure 2D), though attenuated in complete syllables, leading to aPlace � Condition interaction, Wald �2(3) � 12.0, p � .008.
The main effect of voicing was significant, Wald �2(1) � 6.2,p � .013: Voiceless fricatives were identified better than voicedfricatives. This was driven by the interdentals (Figure 2E), leadingto a significant Voicing � Place interaction, Wald �2(3) � 47.0,p � .0001. The voicing effect was also enhanced in the noise-onlycondition, where voiceless sounds were 8.9% better, relative to thecomplete-syllable condition, where the difference was 2.1%, asignificant Voicing � Syllable type interaction, Wald �2(1) � 4.1,p � .042. The three-way interaction (Voicing � Place � SyllableType) was not significant, Wald �2(3) � 5.9, p � .12.
Follow-up analyses separated the data by syllable type. Com-plete details are presented in the supplemental materials (Note 2),but several key effects should be mentioned. First, talker wassignificant for both conditions (complete syllable: Wald �2[9] �135.5, p � .0001; frication only: Wald �2[9] � 196.9, p � .0001),but vowel was significant only in complete syllables (completesyllable: Wald �2[1] � 71.0, p � .0001; frication only: Wald�2[2] � 0.9, p � .6). Place of articulation was significant in bothconditions (complete syllable: Wald �2[3] � 180.5, p � .0001;frication only: Wald �2[3] � 189.8, p � .0001), although voicingwas significant only in the frication-only condition (completesyllable: Wald �2[1] � 0.08, p � .7; frication only: Wald �2[1] �15.0, p � .0001).
To summarize, we found that (a) performance without thevocalic portion was substantially worse than with it, though per-formance in both cases was fairly good; (b) accuracy varied acrosstalkers; (c) sibilants were easier to identify than nonsibilants, butthere were place differences even within sibilants; and (d) thevowel identity affected performance, but only in the complete-syllable condition. This may be due to two factors. First, particularvowels may alter secondary cues in the vocalic portion in a waythat misleads listeners (for /ɑ/ and /i/) or helps them (for /u/).Alternatively, the identity of the vowel may cause subjects to treatthe cues in the frication noise differently. This may be particularlyimportant for /u/—its lip rounding has a strong effect on thefrication. As a result, listeners’ ability to identify the vowel (andthus account for these effects) may offer a benefit for /u/ that is notseen for the unrounded vowels.
2.3. Discussion
The acoustic analysis revealed that every cue was useful forcategorizing fricatives, but all were affected by context. However,the handful of nearly invariant cues raises the possibility thatuncompensated cues, particularly in combination, may be suffi-cient for separating categories. Our perceptual study also revealedconsistent differences across talkers, vowels, and fricatives inaccuracy. The presence or absence of the vocalic portion had thelargest effect. This hints at compensation using C-CuRE mecha-nisms, because this difference may be due both to secondary cuesto the fricative and also to listeners’ ability to identify the talker
and the vowel as a basis of compensation. This may also accountfor the effect of context vowels on accuracy in the complete-syllable condition but not in the fricative-only condition.
3. Computational Approach
Our primary goal was to determine what information is neededto separate fricative categories at listener-like levels. We thusemployed multinomial logistic regression as a simple, commonmodel of phoneme categorization that is theoretically similar toseveral existing approaches (Cole et al., 2010; Nearey, 1990; Oden& Massaro, 1978; Smits, 2001b). We varied its training set toexamine three sets of informational assumptions:
1. Naive invariance: This model used the small number ofcues that were robustly correlated with fricative identifyand less with context. Cues did not undergo compensa-tion—if cues are invariant with respect to context, thisshould not be required.
2. Cue integration: This model used every cue available,without compensation. This is consistent with the infor-mational assumptions of exemplar approaches and is anunexamined assumption of cue-integration models likeNAPP (Nearey, 1997).
3. Compensation: This model used every cue, but after theeffects of talker and vowel on these cues had been ac-counted for using C-CuRE.
It may seem a forgone conclusion that compensation will yield thebest performance—it has the most information and involves themost processing. However, our acoustic analysis suggests there issubstantial information in the raw cues to support fricative cate-gorization, and no one has tested the power of integrating 24 cuesfor supporting categorization. Thus, uncompensated cues may besufficient. Moreover, compensation in C-CuRE is not optimized tofricative categorization—it could transform the input in ways thathurt categorization. Finally, the goal is not necessarily the bestperformance, but listener-like performance—none of the modelsare optimized to the listeners’ responses, and they may or may notshow such effects.
The next section describes the categorization model and itsassumptions. Next, we describe how we instantiated each of ourthree hypotheses in terms of specific sets of cues.
3.1. Logistic Regression as a Model of PhonemeCategorization
Our model is based on work by Nearey (1990, 1997; see alsoCole et al., 2010; McMurray, et al., in press; Smits, 2001a, 2001b),which used logistic regression as a model of listeners’ mappingsbetween acoustic cues and categories. Logistic regression firstweights and combines multiple cues linearly. This is transformedinto a probability (e.g., the probability of an /s/ given the cues).Weights are determined during training to optimally separate cat-egories (see Hosmer & Lemeshow, 2000, for a tutorial). Theseparameters allow the model to alter both the location of theboundary in a multidimensional space and the amount that eachcue participates in categorization.
229STATISTICAL MODELS OF FRICATIVE PERCEPTION

Logistic regression typically uses a binary dependent variable(e.g., /s/ vs. /�/) as in Equation 1:
Ps�x1, x2 . . . �1
1 � e�0��1x1��2x2 . . .. (1)
Here, the exponential term is a linear function of the independentfactors (cues: x1 . . . xn) weighted by their regression coefficients(�s). Multinomial logistic regression generalizes this to map cuesto any number of categories. Consider, for example, a model builtto distinguish /s/, /z/, /f/, and /v/. First, there are separate regressionparameters for each of the four categories, except one, the refer-ence category5 (in this case, /v/). The exponential of each of theselinear terms is in Equation 2:
Ls � e�s0��s1x1��s2x2 . . .
Lz � e�z0��z1x1��z2x2 . . .
Lf � e�f0��f1x1��f2x2 . . .. (2)
These are then combined to yield a probability for any givencategory:
Ps �Ls
1 � Ls � Lz � Lf . (3)
The probability of the reference category is
Pv �1
1 � Ls � Lz � Lf . (4)
Thus, if there are 10 cues, the logistic regression requires 10parameters plus an intercept for each category (minus one). Thus,a multinomial logistic regression mapping 10 cues to four catego-ries requires 33 parameters. Typically these are estimated usinggradient descent methods that maximize the likelihood of the datagiven the parameters.
The models used here were first trained to map the data set ofacoustic measurements to the intended production. This is over-generous. The model knows both the cues in the acoustic signaland the category the speaker intended to produce—something thatlearners may not always have access to. However, by training it onintended productions, not listener data, its match to listeners’performance must come from the information in the input, as themodel is not trained to match listeners, only to achieve the bestcategorization it can with the input.
We held out from training the 240 tokens used in the perceptionexperiment. Thus, training consisted of 2,880 – 240 � 2,640tokens. After estimating the parameters, we used them to deter-mine the likelihood of each category for each token in the percep-tual experiment.
3.1.1. Evaluating the models. Evaluating logistic models istricky. There is no agreed upon measure for model comparison(like R2 in linear regression). Moreover, this study comparesmodels that use only a handful of cues to those that use many, andtherefore it should compensate for the increased power of the morecomplex models. Finally, model fit (e.g., how well the modelpredicts the training data) is less important than its ability to yieldlistener-like performance (on which it was not trained). Thus, weevaluated our models in three ways: the Bayesian informationcriterion, estimated performance by experimental condition, and
the likelihood of the human data given the model. We discuss thefirst two here and discuss the final measure in Section 4.4 whereit is used.
The Bayesian information criterion (BIC; Schwarz, 1978) isused for selecting among competing models. BIC is sensitive to thenumber of free parameters and the sample size. It is usuallycomputed using Equation 5, which provides an asymptotic approx-imation for large sample sizes:
BIC � �2 · lnL � k · lnn. (5)
Here, L is the likelihood of the model, k is the number of freeparameters, and n is the number of samples. Given two models, theone with the lower BIC is preferred.
BIC can be used in two ways. It is primarily used to comparetwo models’ fit to the training data. Secondarily, it offers anomnibus test of model fit. To do this, the model is first estimatedwith no independent variables. This “intercept-only” model shouldhave little predictive value, but if one response was a priori morelikely, it could perform above chance. Next, the independentfactors are added, and the two models are compared using BIC todetermine if the addition of the variables offers any real advantage.
Categorization performance can be computed from logistic re-gression models and is analogous to the listener data. This esti-mated listener performance can be compared as a function ofexperimental condition (e.g., as a function of fricative, talker, orvowel), for a qualitative match to listeners. If one of the modelsshows similar effects of talker, vowel, or fricative, this may offera compelling case for this set of informational assumptions.
Crucially, this relies on the ability to generate data analogous tolistener categorization from the logistic model. Although the lo-gistic formula yields a probability of each of the categories for anygiven set of cues, there is debate about how best to map this tolistener performance.
For any token, the optimal decision rule is to choose the mostlikely category as the response (Nearey & Hogan, 1986).6 Thisimplies that listeners always choose the same category for repeti-tions of the same token (even if it is only marginally better). Thisseems unrealistic: In our experiment listeners responded identi-cally to each repetition only 76.4% of the time in the frication-onlycondition and 90.5% of the time in the complete-syllable condition(close to the average accuracies). Thus, a more realistic approachis to use the probabilities generated by the model as the probabilitythe listener chose each category (as in Nearey, 1990; Oden &Massaro, 1978).
The discrete-choice rule generally yields better performancethan the probabilistic rule (typically about 10% in these models),and listeners likely lie between these extremes. This could bemodeled with something like the Luce-choice rule (Luce, 1959),which includes a temperature parameter controlling how “winner-
5 Multinomial logistic regression generalizes the binary form of logisticregression by implementing a series of binary comparisons between eachcategory and the reference category—so a common reference category isrequired. The choice of which outcome serves as the reference category isarbitrary and will make no difference in the resulting probability predic-tions (Hosmer & Lemeshow, 2000).
6 This is how classification tables in statistics packages like SPSS areconstructed.
230 MCMURRAY AND JONGMAN

take-all” the decision is. However, we had no independent data onthe listeners’ decision criteria, and because models were fit to theintended production, not to the perceptual response, we could notestimate this during training. We thus report both the discrete-choice and probabilistic decision rules for each model as a range,with the discrete choice as the upper limit and the probabilistic ruleas the lower limit.
Finally, neither method offers a direct fit to the perceptual data.BIC is based on the training data, and performance-based measuresare analogous to perceptual data but offer no way to quantitativelyrelate them. Thus, in Section 4.4 we describe a method of com-paring models based on the likelihood that the perceptual datawere generated by each model.
3.1.2. Theoretical assumptions of logistic regression as acategorization model. As a model of the interface betweencontinuous cues and phoneme categories, logistic regressionmakes a number of simplifications. First, it assumes linear bound-aries in cue space (unless interaction terms are included). How-ever, Nearey (1990) has shown that this can be sufficient for somespeech categories. Similarly, cue combination is treated as a linearprocess. However, weighting-by-reliability in vision (e.g., Ernst &Banks, 2002; Jacobs, 2002) also assumes linear combinations, andthis has been tested in speech as well (Toscano & McMurray,2010). Given the widespread use of this assumption in similarmodels in speech (e.g., Nearey, 1997; Oden & Massaro, 1978;Smits, 2001b), this seems uncontroversial. Moreover, lacking hy-potheses about particular nonlinearities or interaction terms, theuse of a full complement of interactions and nonlinear transfor-mations may add too many parameters to fit effectively.
Second, although there are more complicated ways to modelcategorization, many of these approaches are related to logisticregression. For example, a connectionist network that uses nohidden units and the softmax activation function is identical tologistic regression, and an exemplar model in which speech iscompared with all available exemplars will be highly similar to ourapproach.
Third, logistic regression can be seen as instantiating the out-come of statistical learning (e.g., Werker et al., 2007), as itscategories are derived from the statistics of the cues in the input.However, many statistical learning approaches in speech percep-tion (e.g., Maye, Werker, & Gerken, 2002; McMurray, Aslin, &Toscano, 2009) assume unsupervised learning, whereas logisticregression is supervised—the learner has access to both cues andcategories. We are not taking a strong stance on learning—likelyboth are at work in development. Logistic regression is just auseful tool for getting the maximum categorization value out of theinput to compare informational hypotheses.
Finally, our use of logistic regression as a common categoriza-tion platform intentionally simplifies the perceptual processes pro-posed in models of speech perception. However, this allows us totest assumptions about the information that contributes to catego-rization. By modeling phoneme identification using the sameframework, we can understand the unique contributions of theseinformational assumptions made by each class of model.
3.2. Hypotheses and Data Sets
3.2.1. Naive invariance model. The naive invariance modelasked whether a small number of uncompensated cues are suffi-
cient for classification. Prior studies have asked similar questionsfor fricatives (Forrest et al., 1988; Jongman, Wayland, & Wong,2000) using discriminant analysis, and results have been good,though imperfect. This has not yet been attempted with morepowerful logistic regression, and we have a lot more cues (partic-ularly for nonsibilants). Thus, it would be premature to rule outsuch hypotheses.
Section 2.1.2 suggested a handful of cues that are somewhat in-variant with respect to context (see Table 4). These nine cues distin-guish voicing and sibilance in all fricatives and place of articulation insibilants. We did not find any cues that were even modestly invariantfor place of articulation in nonsibilants. Thus, we added four addi-tional cues: two with relatively high R2s for place of articulation, butalso context (F4 and F5), and two that were less associated with place,but also with context (M3trans and M4trans). These were located in thevocalic portion, offering a way for the naive invariance model toaccount for the differences between the frication-only and complete-syllable conditions in the perceptual experiment—the loss of thesecues should lead to bigger decrements for nonsibilants and smallerdecrements for sibilants. As our selection of this cue set was madesolely by statistical reliability (rather than a theory of production), andwe did not use any compound cues, we term this a naive invarianceapproach.
3.2.2. Cue-integration model. The cue-integration hypothe-sis suggests that if sufficient cues are encoded in detail, theircombination is sufficient to overcome variability in any one cue.This is reflected in the informational assumptions of exemplarapproaches (e.g., Goldinger, 1998; Pierrehumbert, 2001, 2003),and it is an unexamined assumption in many cue-integration mod-els. It is possible that in a high-dimensional input space (24 cues),there are boundaries that distinguish the eight fricatives.
Our use of logistic regression as a categorizer could be apotentially problematic assessment of exemplar accounts, as it isclearly more akin to a prototype model than true exemplar match-ing. However, if the speech signal is compared with the entire“cloud” of exemplars, then the decision of an exemplar model forany input will reflect an aggregate of all the exemplars, a “genericecho” (Goldinger, 1998, p. 254), allowing it to show prototype-likeeffects (Pierrehumbert, 2003). In contrast, if the signal is comparedwith only a smaller number of tokens, this breaks down. Ulti-mately, formal models will be required to determine the optimaldecision rule for exemplar models in speech. However, given ouremphasis on information, logistic regression is a reasonabletest—it maps closely to both cue-integration models and someversions of exemplar theory and is sufficiently powerful to permitgood categorization.
Thus, we instantiated the cue-integration assumptions by usingall 24 cues with no compensation for talker or vowel. To accountfor the difference between the frication-only and complete-syllableconditions, we eliminated the 14 cues found in the vocalic portion(see Table 2), asking whether the difference in performance wasdue to the loss of additional cues.
3.2.3. Compensation/C-CuRE model. The final data settests the hypothesis that compensation is required to achievelistener-like performance. This is supported by our phonetic anal-ysis suggesting that all of the cues were somewhat context sensi-tive. To construct this data set, all 24 cues were processed tocompensate for the effects of the talker and vowel on each one.Although the goal of this data set was to test compensation in
231STATISTICAL MODELS OF FRICATIVE PERCEPTION

general, this was instantiated using C-CuRE because it is, to ourknowledge, the only general-purpose compensation scheme that iscomputationally specific, can be applied to any cue, and canaccomplish compensation without discarding fine-grained detail inthe signal (and may enable greater use of it; see Cole et al., 2010).
To construct the C-CuRE model, all 24 cues were first subjectedto individual regressions in which each cue was the dependentvariable and talker and vowel were independent factors. These twofactors were each represented by 19 and five dummy variables(respectively), one for each talker/vowel (minus one).7 After theregression equation was estimated, individual cue values were thenrecoded as standardized residuals. This recodes each cue as thedifference between the actual cue value and what would be pre-dicted for that talker and vowel.
The use of context in C-CuRE offers an additional route toaccount for differences between the complete-syllable andfrication-only conditions. Although excising the vocalic portioneliminates a lot of useful first-order cues (as in the cue-integrationmodel), it would also impair parsing. This is because it would bedifficult to identify the talker or vowel from the frication alone.Indeed, Lee et al. (2010) showed that the vocalic portion supportsmuch more robust identification of gender than the frication, evenwhen only six pitch pulses were present. Thus, if fricative catego-rization is contingent on identifying the talker or vowel, we shouldsee an additional decrement in the frication-only condition due tothe absence of this information.
Our use of regression for compensation complicates modelcomparison using BIC. How do we count the additional parame-ters? In the cue-integration model, each cue corresponds to sevendegrees of freedom (one parameter for each category minus one).In contrast, the compensation/C-CuRE model uses additional de-grees of freedom in the regressions for each cue: 19 degrees offreedom for talkers, 5 for vowels, and an intercept. Thus, insteadof 7 � 24 parameters, the complete C-CuRE model now has 32 �24 parameters, suggesting a substantial penalty.
However, there are three reasons why such a penalty wouldbe ill advised. First, the free parameters added by C-CuRE donot directly contribute to categorization, nor are they optimizedwhen the categorization model is trained. These parameters arefit to a different problem (the relationship between contextualfactors and cues) and are not manipulated to estimate thelogistic regression model. So although they are parameters inthe system, they are not optimized to improve categorization. In
7 Parsing regressions were run entering speaker codes first and thenvowel. However, this choice does not affect the residuals, as the ultimateregression equation (using all of the terms) is the same regardless of orderof entry. However, during online perception this may matter, as certainfactors may not be available at every time point—for example, the presenceof a carrier sentence prior to the fricative may make speaker available forparsing before the vowel (see McMurray et al., in press, for a discussion).
Table 4Summary of Cues Used in the Naive Invariance Model
Cue Cue for Context effect
Invariant to speaker andvowel
MaxPF Place in sibilants (R2 � .504) Speaker: Moderate (R2 � .084)Vowel: ns
DURF Voicing (R2 � .40) Speaker: Large (R2 � .16)Vowel: Small (R2 � .021)
RMSF Sibilance (R2 � .419) Speaker: Moderate (R2 � .081)Vowel: ns
F3AMPF Place in sibilants (R2 � .44) Speaker: Moderate (R2 � .07)Sibilance (R2 � .24) Vowel: Small (R2 � .028)
F5AMPF Sibilance (R2 � .39) Speaker: Moderate (R2 � .07)Vowel: Small (R2 � .012)
LF Voicing (R2 � .48) Speaker: Moderate (R2 � .11)Vowel: Small (R2 � .004)
M1 Place in sibilants (R2 � .55) Speaker: Moderate (R2 � .122)Vowel: ns
M2 Sibilance (R2 � .44) Speaker: Small (R2 � .036)Place in sibilants (R2 � .34) Vowel: ns
M3 Place in sibilants (R2 � .37) Speaker: Moderate (R2 � .064)Vowel: ns
Noninvariant cues to place innonsibilants
F4 Place in nonsibilants (R2 � .083) Speaker: Large (R2 � .43)Vowel: Small (R2 � .05)
F5 Place in nonsibilants (R2 � .082) Speaker: Large (R2 � .29)Vowel: Small (R2 � .045)
M3trans Place in nonsibilants (R2 � .061) Speaker: Small (R2 � .029)Vowel: Moderate (R2 � .079)
M4trans Place in nonsibilants (R2 � .062) Speaker: Small (R2 � .031)Vowel: Small (R2 � .069)
Note. Shown are the nine cues that were relatively invariant with respect to speaker and vowel as well as fournoninvariant cues that were included because they provided the best information about place of articulation innonsibilants. R2s are change statistics taken from analyses presented in Section 2. Cues are further described inTable 2.
232 MCMURRAY AND JONGMAN
fact, it is possible that the transformations imposed by C-CuREimpede categorization or make categorization look less likelisteners, as C-CuRE is removing the effect of factors likevowel and talker that we found to affect listener performance.
Second, the parameters for parsing with C-CuRE can be com-puted directly from the data. When the independent variables arediscrete, the regression parameters are related to the combinationof cell means. No complex optimization is needed to estimate thesevalues.
Finally, any scaled-up system, even without compensation,would need to identify vowels and talkers. Because the param-eters used in C-CuRE are simply the mean values of each cuewith respect to context, a cue-integration model that was trainedto identify the context along with the fricative would be esti-mating similar parameters anyways—they just would not beused in fricative identification. The C-CuRE model simplyreuses those parameters for compensation.
4. Results
Our analysis starts with a description of the results of eachmodel. Next we describe a scheme for making quantitative modelfits to the perceptual data and compare the three approaches.Finally, we address several assumptions of the compensation/C-CuRE model.
4.1. Naive Invariance
4.1.1. Complete syllables. Overall, the naive invariancemodel offered a good fit to the production data. BIC decreasedsubstantially from the intercept-only model (intercept only:11,034; invariance model: 3,399), and the chi-square test ofmodel fit was significant, �2(91) � 8,353, p � .0001. Likeli-hood ratio tests showed that the model used all 13 cues, all�2(7) � 28, p � .0001. The model averaged 83.3% correct onthe perception tokens using the discrete-choice rule and 74.8%correct using the probabilistic rule. Thus, this handful of in-variant cues supports fairly accurate identification, though lessso than listeners.
However, this model was not a good fit to listener perfor-mance. It was much poorer on nonsibilants than listeners, andthere were no differences within them (see Figure 3A). Simi-larly, within sibilants, it failed to capture listeners’ slightlybetter performance on the postalveolars (/�, �/) than alveolars(/s, z/). Moreover, the breakdown of performance by both vowel(Figure 3B) and talker (Figure 3C) did not show the expectedpatterns, with the model showing the inverse effect of voweland little correlation with listeners’ performance across talkers(R � .18).
Thus, this model undershoots listener performance by about15% when measured with the more realistic probabilistic deci-sion rule and by about 7.5% with the discrete-choice rule. Moreimportant, it does not describe listeners’ errors. The modelshowed the inverse effect of context vowel and a different effectof talker. Together, this suggests that the information in thissmall set of cues does not fully capture the similarity relationsthat underlie listeners’ categorization, nor is it sufficient tosupport listeners’ levels of accuracy.
4.1.2. Frication only. The invariant cues were largely foundin the frication portion of the stimulus— only four of the 13
were found in the vocalic portion. Thus, there should be littledifference between models when the cues in the vocalic portionwere eliminated to model the frication-only condition. This wasconfirmed, as this model performed at 70.1% on the probabi-listic rule and 78.7% on the discrete-choice rule (compared with74.5% and 83.3% when all 13 cues were used). Given the smalldifference between models, and the fact that both models werein the range of the listeners (M � 76.3%), we do not reportmore on this model.
4.2. Cue Integration
4.2.1. Complete syllables. When all cues were used, modelfit improved markedly. The intercept-only model had a BIC of11,034, and the full model showed a substantial decrease to3,381—lower than the naive invariance model even when pe-nalized for additional cues. The chi-square analysis of fit washighly significant, �2(168) � 8,977, p � .0001; however, themodel did not take advantage of all the cues. Likelihood ratiotests showed that five were not used: F2, �2(7) � 8.7, p � .27;F3AMPv, �2(7) � 12.7, p � .08; F5AMPv, �2(7) � 7.1, p �.41; M3trans, �2(7) � 9.7, p � .21; and M4trans, �2(7) � 12.7,p � .08.8 Interestingly, these were the cues that were mostaffected by vowel context. All other cues were highly signifi-cant, all �2(7) � 15, p � .03.
The model performed at 85.0% with the discrete-choice ruleand at 79.2% with the probabilistic rule, an increase over thenaive invariance model (2.5% and 5%, respectively). The newcues also allowed the model to better approximate listenerperformance. As Figure 4A shows, the model now exhibitsdifferential performance within the nonsibilants: The interden-tals are now worse than the labiodentals. In other ways, accu-racy did not reflect listeners. The model performs better onalveolars than postalveolars, better for /i/ than the other twovowels (Figure 4B), and its performance across talkers is notcorrelated with listeners (R � –.01). Thus, this model improvedover the naive invariance model in accuracy and match tolisteners, but it does not fully capture the pattern of errors andcontext effects.
8 We were initially surprised at the failure of F2 to participate in thecategorization model given the wealth of studies positing a role for eitherF2 at onset or F2 locus equations. We can think of two reasons for this.First, many of these studies have examined only sibilants (and voicelesssibilants at that)—the utility of this cue for sibilants may not have beensufficient to reach significance given the other meaningful contrasts andthe redundant information in the signal like the other formants (F3 inparticular). Second, Nearey (personal communication, February 14, 2010)suggested that F2 should show a quadratic relationship to place of articu-lation. We thus ran a second model including both linear and quadraticterms for each formant. Model performance was increased by 0.8% (85.8%vs. 85.0%), but not enough to outweigh the penalty of the additionalparameters (BICquadratics: 3,453 vs. BIClinear: 3,381 without). However inthe quadratic model, both the linear and quadratic terms for F2 were nowsignificant (linear: �2[7] � 25.6, p � .01; quadratic: �2[7] � 120.1, p �.0001), and significant quadratic effects were also observed for F4, �2(7) �18.4, p � .0001, and F5, �2(7) � 15.1 p � .035. Given the higher BIC,however, and the complexities of using quadratic terms in the parsingmodel, we used only the linear term in this and subsequent models.
233STATISTICAL MODELS OF FRICATIVE PERCEPTION

4.2.2. Frication only. Next, we examined whether themodel could account for performance on the frication noisealone by training a new model on just the 10 cues in thefrication (see Table 2).
This model fit the training data well, with a BIC of 11,034 forthe intercept-only version and 3,431 for the final model, �2(70) �
8,155, p � .0001, and all 10 cues significantly contributed toperformance, all �2(7) � 31, p � .001. Performance was worsethan the full model, mimicking the effect of eliminating the vocalicportion: The model averaged 77.9% for the discrete-choice ruleand 70.9% for the probabilistic one. This was quite close tolisteners (75.4%). This model also offered a close fit to the listen-
Figure 3. Performance of the naive invariance model and human listeners (in black). Model performance isrepresented by the gray range, bounded by the model’s performance estimated with the probabilistic rule on thebottom and the discrete-choice rule on the top. A: Accuracy for each of the eight fricatives. B: As a function ofvowel context. C: As a function of speaker.
Figure 4. Performance of the cue-integration model and human listeners on the complete-syllable condition.Model performance is represented by the gray range whose lower bound is performance using the probabilisticrule and whose upper bound reflects the discrete-choice rule. A: The complete model as a function of fricative.B: The complete model as a function of vowel context. C: The complete model as a function of speaker.
234 MCMURRAY AND JONGMAN

ers’ accuracy across fricatives (see Figure 5A). Although it out-performed them on /ð/,9 it correctly captured differences betweenthe other seven, particularly the sibilants. Its accuracy acrosstalkers and vowels was more variable. Listeners showed littledifferences across vowel, whereas the model was again best with/i/, although its range of performance included mostly the listenerdata. The effect of talker, however, was different between listenersand the model (R � –.04), though, as with vowels, listener per-formance was largely in the model’s range.
Thus, the frication-only version of the cue-integration modeloffers a better fit to the corresponding empirical data than thecomplete-syllable version, particularly in overall accuracy. It isimperfect for some of the context effects, but many of the broadpatterns are there. If anything, the complete-syllable version needsimprovement to account for listener performance.
4.3. Compensation/C-CuRE
The compensation model showed the best fit of all, �2(168) �10,381, p � .0001, with BIC reducing from 11,977 to 2,990. Incontrast to the cue-integration model, likelihood ratio tests showedthat all 24 cues affected performance, all �2(7) � 21, p � .004,suggesting that compensating for contextual variance helps themodel gain access to new information sources.
Accuracy was excellent. The model was 92.9% correct using thediscrete decision rule and 87.0% correct using the probabilisticrule (see Figure 6A). This is a large improvement (greater than7%) over the cue-integration model that puts performance in therange of human listeners. As Figure 6A shows, the model per-formed equivalently to listeners for sibilants and /�/, although itslightly undershot them for /f/ and /v/ and overshot them for /ð/.Perhaps most impressively, the effect of vowel context has com-pletely reversed from prior models and now fits the human data(Figure 6B), and the talker differences are also well correlated(R � .52; see Figure 6C). At a statistical level, this is surpris-ing—we have partialed the effects of talker and vowel out of theraw cues, and yet we are now seeing the correct effects in perfor-mance. This suggests that listeners’ differences across vowels maybe due to differences in compensation, not differences in the rawinformation available.
4.4. Model Comparison
The results thus far (see Table 5) indicate that compensated cuesusing C-CuRE offer the closest match to listeners in the complete-syllable condition, whereas the cue-integration approach workswell in the frication-only condition. Our goodness-of-fit measure,however, compared each model’s fit to the training data (theintended productions), showing only that the C-CuRE model is thebetter classifier of this data. Although the qualitative differencesbetween models in predicting vowel and talker effects suggest theC-CuRE model is a better fit to listeners, we have not reportedgoodness of fit to the perceptual data. Here we develop the tools todo so.
We focus on comparing the three models in the complete-syllable condition. The naive invariance and cue-integration mod-els were similar for the frication-only data and differed by only asingle cue (M4). Also, applying the C-CuRE model to thefrication-only data makes little sense theoretically—without the
vocalic portion it would be difficult to identify the talker or vowelto parse their effects from the cues in the frication.
The perception data take the form of a frequency distribution:for each token, the number of times each category was chosen. Theoutput of logistic regression is analogous: the probability of eachcategory given the input. From these probabilities and frequencies,we can use the multinomial distribution to compute the likelihoodof getting a particular distribution of responses (the listener data)given the probabilities computed by the model:
L �N!
X1!X2! . . . X8!p1
X1p2X2 . . . p8
X8. (6)
Here, N is the total number of responses; Xi is the number of timescategory i was selected; and pi is the probability of that categoryfrom the model. Multiplying this across each token in the data set(with p1 . . . p8 for each computed from the model based on thattoken’s cues) gives the total likelihood of the entire perceptual dataset given the model.
This allows us to compare any two models using odds ratios (theratio of the two likelihoods) to determine how much more likelyone model is over the other. Generally, to compute the odds ratio,we divided the likelihoods by 240 to compute the average likeli-hood of each token and used this to compute the average odds ratioacross tokens. We can also compute BIC from the log-likelihoods,to compute a BIC value relative to the observed perceptual data.
Thus, we first used each of the three models to compute theprobabilities for each response for each token in the data set. Wenext computed the likelihood of obtaining the distribution ofresponses observed in perceptual data for each token. These werelogged and summed to obtain the total log-likelihood of the datagiven each model.
Consistent with the accuracy data, the cue-integration model fitthe listener data better than the naive invariance model. Its log-likelihood (LL) was larger (–3,823 vs. –4,740), and it was 45.7times more likely to give rise to the responses for any perceptualtoken than the naive invariance model. Even when penalized for itscues, its BIC was still lower (8,605.3 vs. 10,018.2).
Next, we compared the cue-integration and compensation/C-CuRE models. Surprisingly, the C-CuRE model (LL � –7,142.7;BIC � 15,245) was a worse fit than the cue-integration model(LL � –3,823.1; BIC � 8,605.3). This was unexpected given thecompensation model’s better overall performance and its closermatch to the perceptual data.
Examining the log-likelihoods for individual tokens, we noticedthat although most were in the 0 to –50 range, the C-CuRE modelhad a handful of very unlikely tokens: 16 (out of 240) had log-likelihoods less than –100, and one was less than –1,000. This wasdue to the fact that it was extremely confident in categorizing sometokens, outputting probabilities near zero (1e�50 or less) for dis-preferred fricatives. If subjects responded even once for thesenear-zero probability events (e.g., if they were guessing), thisdramatically decreased the likelihood of the model (because thistiny probability, multiplied by all the others, squashes the more
9 This may have been due to cognitive factors that were not modeled.The fact that /ð/ generally appears only word-initially in function wordsand has the same orthographic representation as /�/ may have led listenersto select /ð/ less than other responses.
235STATISTICAL MODELS OF FRICATIVE PERCEPTION

likely probabilities from other trials). In contrast, the cue-integration model was less confident in its decision, so the prob-abilities for dispreferred fricatives were orders of magnitudelarger. As a result, guessing was not nearly as deleterious—themodel expected to be wrong occasionally.
Thus, we modified the logistic model to include a chance ofguessing, by constructing a mixture model in which the probabilityof a category was a mixture of logistic and guess trials:
pcategory � plogistic1 � pguess � pguess1/8. (7)
Here, plogistic is the probability of a given fricative from the logisticregression; pguess is the likelihood of guessing; and there is a 1/8chance of selecting any fricative on guess trials.
It was not clear how to estimate pguess, as we had no independentdata on listeners’ guessing. Ideally, one would estimate this pa-rameter with the rest of the parameters in the logistic model.
Figure 5. Performance of the cue-integration model and human listeners on the frication-only condition. Modelperformance is represented by the gray range whose lower bound is performance using the probabilistic rule andwhose upper bound reflects the discrete-choice rule. A: As a function of fricative. B: As a function of vowelcontext. C: As a function of speaker.
Figure 6. Performance of the compensation/C-CuRE (computing cues relative to expectations) model andhuman listeners on the complete-syllable condition. Model performance is represented by the gray range whoselower bound is performance using the probabilistic rule and whose upper bound reflects the discrete-choice rule.A: As a function of fricative. B: As a function of vowel context. C: As a function of speaker.
236 MCMURRAY AND JONGMAN
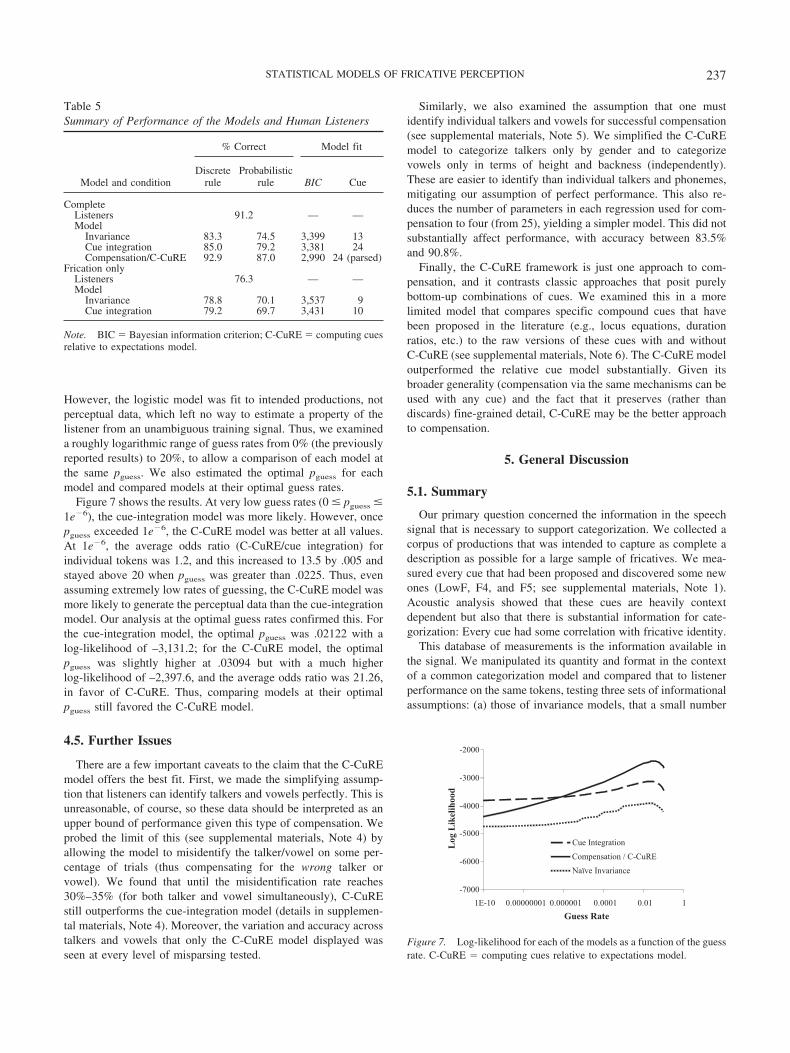
However, the logistic model was fit to intended productions, notperceptual data, which left no way to estimate a property of thelistener from an unambiguous training signal. Thus, we examineda roughly logarithmic range of guess rates from 0% (the previouslyreported results) to 20%, to allow a comparison of each model atthe same pguess. We also estimated the optimal pguess for eachmodel and compared models at their optimal guess rates.
Figure 7 shows the results. At very low guess rates (0 � pguess �1e�6), the cue-integration model was more likely. However, oncepguess exceeded 1e�6, the C-CuRE model was better at all values.At 1e�6, the average odds ratio (C-CuRE/cue integration) forindividual tokens was 1.2, and this increased to 13.5 by .005 andstayed above 20 when pguess was greater than .0225. Thus, evenassuming extremely low rates of guessing, the C-CuRE model wasmore likely to generate the perceptual data than the cue-integrationmodel. Our analysis at the optimal guess rates confirmed this. Forthe cue-integration model, the optimal pguess was .02122 with alog-likelihood of –3,131.2; for the C-CuRE model, the optimalpguess was slightly higher at .03094 but with a much higherlog-likelihood of –2,397.6, and the average odds ratio was 21.26,in favor of C-CuRE. Thus, comparing models at their optimalpguess still favored the C-CuRE model.
4.5. Further Issues
There are a few important caveats to the claim that the C-CuREmodel offers the best fit. First, we made the simplifying assump-tion that listeners can identify talkers and vowels perfectly. This isunreasonable, of course, so these data should be interpreted as anupper bound of performance given this type of compensation. Weprobed the limit of this (see supplemental materials, Note 4) byallowing the model to misidentify the talker/vowel on some per-centage of trials (thus compensating for the wrong talker orvowel). We found that until the misidentification rate reaches30%–35% (for both talker and vowel simultaneously), C-CuREstill outperforms the cue-integration model (details in supplemen-tal materials, Note 4). Moreover, the variation and accuracy acrosstalkers and vowels that only the C-CuRE model displayed wasseen at every level of misparsing tested.
Similarly, we also examined the assumption that one mustidentify individual talkers and vowels for successful compensation(see supplemental materials, Note 5). We simplified the C-CuREmodel to categorize talkers only by gender and to categorizevowels only in terms of height and backness (independently).These are easier to identify than individual talkers and phonemes,mitigating our assumption of perfect performance. This also re-duces the number of parameters in each regression used for com-pensation to four (from 25), yielding a simpler model. This did notsubstantially affect performance, with accuracy between 83.5%and 90.8%.
Finally, the C-CuRE framework is just one approach to com-pensation, and it contrasts classic approaches that posit purelybottom-up combinations of cues. We examined this in a morelimited model that compares specific compound cues that havebeen proposed in the literature (e.g., locus equations, durationratios, etc.) to the raw versions of these cues with and withoutC-CuRE (see supplemental materials, Note 6). The C-CuRE modeloutperformed the relative cue model substantially. Given itsbroader generality (compensation via the same mechanisms can beused with any cue) and the fact that it preserves (rather thandiscards) fine-grained detail, C-CuRE may be the better approachto compensation.
5. General Discussion
5.1. Summary
Our primary question concerned the information in the speechsignal that is necessary to support categorization. We collected acorpus of productions that was intended to capture as complete adescription as possible for a large sample of fricatives. We mea-sured every cue that had been proposed and discovered some newones (LowF, F4, and F5; see supplemental materials, Note 1).Acoustic analysis showed that these cues are heavily contextdependent but also that there is substantial information for cate-gorization: Every cue had some correlation with fricative identity.
This database of measurements is the information available inthe signal. We manipulated its quantity and format in the contextof a common categorization model and compared that to listenerperformance on the same tokens, testing three sets of informationalassumptions: (a) those of invariance models, that a small number
-7000
-6000
-5000
-4000
-3000
-2000
1E-10 0.00000001 0.000001 0.0001 0.01 1Guess Rate
Log
Like
lihoo
d
Cue Integration
Compensation / C-CuRE
Naïve Invariance
Figure 7. Log-likelihood for each of the models as a function of the guessrate. C-CuRE � computing cues relative to expectations model.
Table 5Summary of Performance of the Models and Human Listeners
Model and condition
% Correct Model fit
Discreterule
Probabilisticrule BIC Cue
CompleteListeners 91.2 — —Model
Invariance 83.3 74.5 3,399 13Cue integration 85.0 79.2 3,381 24Compensation/C-CuRE 92.9 87.0 2,990 24 (parsed)
Frication onlyListeners 76.3 — —Model
Invariance 78.8 70.1 3,537 9Cue integration 79.2 69.7 3,431 10
Note. BIC � Bayesian information criterion; C-CuRE � computing cuesrelative to expectations model.
237STATISTICAL MODELS OF FRICATIVE PERCEPTION
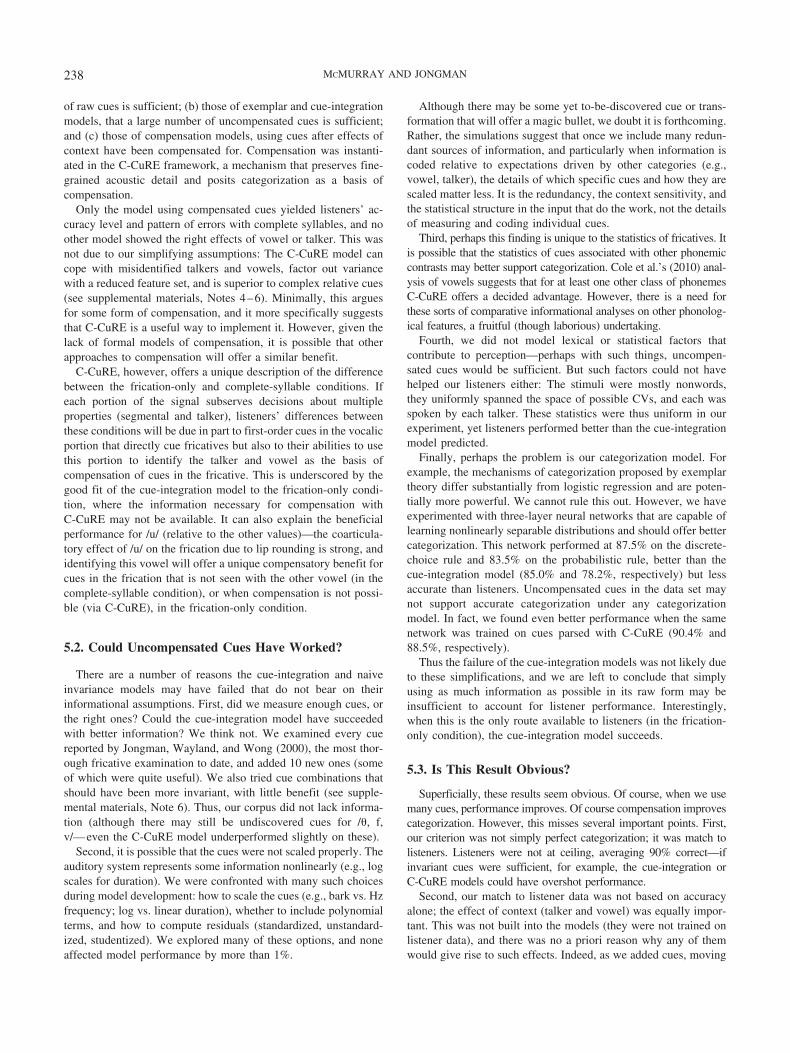
of raw cues is sufficient; (b) those of exemplar and cue-integrationmodels, that a large number of uncompensated cues is sufficient;and (c) those of compensation models, using cues after effects ofcontext have been compensated for. Compensation was instanti-ated in the C-CuRE framework, a mechanism that preserves fine-grained acoustic detail and posits categorization as a basis ofcompensation.
Only the model using compensated cues yielded listeners’ ac-curacy level and pattern of errors with complete syllables, and noother model showed the right effects of vowel or talker. This wasnot due to our simplifying assumptions: The C-CuRE model cancope with misidentified talkers and vowels, factor out variancewith a reduced feature set, and is superior to complex relative cues(see supplemental materials, Notes 4–6). Minimally, this arguesfor some form of compensation, and it more specifically suggeststhat C-CuRE is a useful way to implement it. However, given thelack of formal models of compensation, it is possible that otherapproaches to compensation will offer a similar benefit.
C-CuRE, however, offers a unique description of the differencebetween the frication-only and complete-syllable conditions. Ifeach portion of the signal subserves decisions about multipleproperties (segmental and talker), listeners’ differences betweenthese conditions will be due in part to first-order cues in the vocalicportion that directly cue fricatives but also to their abilities to usethis portion to identify the talker and vowel as the basis ofcompensation of cues in the fricative. This is underscored by thegood fit of the cue-integration model to the frication-only condi-tion, where the information necessary for compensation withC-CuRE may not be available. It can also explain the beneficialperformance for /u/ (relative to the other values)—the coarticula-tory effect of /u/ on the frication due to lip rounding is strong, andidentifying this vowel will offer a unique compensatory benefit forcues in the frication that is not seen with the other vowel (in thecomplete-syllable condition), or when compensation is not possi-ble (via C-CuRE), in the frication-only condition.
5.2. Could Uncompensated Cues Have Worked?
There are a number of reasons the cue-integration and naiveinvariance models may have failed that do not bear on theirinformational assumptions. First, did we measure enough cues, orthe right ones? Could the cue-integration model have succeededwith better information? We think not. We examined every cuereported by Jongman, Wayland, and Wong (2000), the most thor-ough fricative examination to date, and added 10 new ones (someof which were quite useful). We also tried cue combinations thatshould have been more invariant, with little benefit (see supple-mental materials, Note 6). Thus, our corpus did not lack informa-tion (although there may still be undiscovered cues for /�, f,v/—even the C-CuRE model underperformed slightly on these).
Second, it is possible that the cues were not scaled properly. Theauditory system represents some information nonlinearly (e.g., logscales for duration). We were confronted with many such choicesduring model development: how to scale the cues (e.g., bark vs. Hzfrequency; log vs. linear duration), whether to include polynomialterms, and how to compute residuals (standardized, unstandard-ized, studentized). We explored many of these options, and noneaffected model performance by more than 1%.
Although there may be some yet to-be-discovered cue or trans-formation that will offer a magic bullet, we doubt it is forthcoming.Rather, the simulations suggest that once we include many redun-dant sources of information, and particularly when information iscoded relative to expectations driven by other categories (e.g.,vowel, talker), the details of which specific cues and how they arescaled matter less. It is the redundancy, the context sensitivity, andthe statistical structure in the input that do the work, not the detailsof measuring and coding individual cues.
Third, perhaps this finding is unique to the statistics of fricatives. Itis possible that the statistics of cues associated with other phonemiccontrasts may better support categorization. Cole et al.’s (2010) anal-ysis of vowels suggests that for at least one other class of phonemesC-CuRE offers a decided advantage. However, there is a need forthese sorts of comparative informational analyses on other phonolog-ical features, a fruitful (though laborious) undertaking.
Fourth, we did not model lexical or statistical factors thatcontribute to perception—perhaps with such things, uncompen-sated cues would be sufficient. But such factors could not havehelped our listeners either: The stimuli were mostly nonwords,they uniformly spanned the space of possible CVs, and each wasspoken by each talker. These statistics were thus uniform in ourexperiment, yet listeners performed better than the cue-integrationmodel predicted.
Finally, perhaps the problem is our categorization model. Forexample, the mechanisms of categorization proposed by exemplartheory differ substantially from logistic regression and are poten-tially more powerful. We cannot rule this out. However, we haveexperimented with three-layer neural networks that are capable oflearning nonlinearly separable distributions and should offer bettercategorization. This network performed at 87.5% on the discrete-choice rule and 83.5% on the probabilistic rule, better than thecue-integration model (85.0% and 78.2%, respectively) but lessaccurate than listeners. Uncompensated cues in the data set maynot support accurate categorization under any categorizationmodel. In fact, we found even better performance when the samenetwork was trained on cues parsed with C-CuRE (90.4% and88.5%, respectively).
Thus the failure of the cue-integration models was not likely dueto these simplifications, and we are left to conclude that simplyusing as much information as possible in its raw form may beinsufficient to account for listener performance. Interestingly,when this is the only route available to listeners (in the frication-only condition), the cue-integration model succeeds.
5.3. Is This Result Obvious?
Superficially, these results seem obvious. Of course, when we usemany cues, performance improves. Of course compensation improvescategorization. However, this misses several important points. First,our criterion was not simply perfect categorization; it was match tolisteners. Listeners were not at ceiling, averaging 90% correct—ifinvariant cues were sufficient, for example, the cue-integration orC-CuRE models could have overshot performance.
Second, our match to listener data was not based on accuracyalone; the effect of context (talker and vowel) was equally impor-tant. This was not built into the models (they were not trained onlistener data), and there was no a priori reason why any of themwould give rise to such effects. Indeed, as we added cues, moving
238 MCMURRAY AND JONGMAN
from the invariance to the cue-integration model, there was littleimprovement in this regard; it was only when we added compen-sation that we saw such performance. Although one might expectthat adding cues or compensation could increase the fit of themodel to its training data, there was no reason to expect it to fitbetter to a completely independent data set reflecting idiosyncraticperformance across context. Thus, our close fit in this regardsuggests that these differences across speakers and vowels are notso much a function of the statistical distribution of speech cueswithin speakers and vowels but rather of the differential sensitivityof these distributions to compensation.
Third, C-CuRE was not optimized to the goal of identifying thefricative. This component of the model was trained independentlyof fricative categorization, simply recoding the input as distancefrom the expected cue values for that talker and/or vowel. Therewas no guarantee that this would yield a cue space better suited tofricative categorization, nor that it would result in the pattern ofcontext effects we observed. In fact, it is surprising that we see theeffects of talker and vowel in the categorization model only afterwe have parsed their effects out of the cue set.
Given these factors, success of the C-CuRE model was by nomeans a foregone conclusion, and its findings should not bedismissed easily.
5.4. Implications for Theories of Speech Perception
Fundamentally, the problem of lack of invariance is a question ofinformation. On this issue, our acoustic analyses confirm for fricativeswhat most researchers have concluded in general: There is no invari-ance in the signal (e.g., Lindblom, 1996; Ohala, 1996). Even measur-ing 24 cues and assessing the effects of context on each, we found notruly invariant cues, and even the best of what we had were notsufficient to match listener categorization performance.
More important, however, the lack of invariance is not problematic,and one does not need to go to extremes to surmount it. Motor theory(Liberman & Mattingly, 1985; Liberman & Whalen, 2000) explicitlyargues that the only solution to the lack of invariance is to code speechin terms of articulatory gestures. Exemplar theory (e.g., Hawkins,2003; Pierrehumbert, 2001) makes a similar point: If listeners retainevery exemplar they hear in fine-grained detail, this can be overcomewithout compensation. Although there are other reasons to argue forthese theories, the lack of invariance does not require any specificapproach to representation—categorization built on prototypes andacoustic cues can yield listener-like performance as long as manyinformation sources are used with simple compensation schemes.Lack of invariance does not equal lack of information and does notrequire a particular solution.
As our emphasis was information, we did not examine thecategorization process, and any theory of speech categorizationmust describe both. Thus, here, we discuss the implications ofthese findings for a number of theories of speech perception wherethey are directly relevant.
First, our cue-integration model shares the informational as-sumptions of exemplar theory: Use every bit of the signal, butwithout compensation. Clearly, the redundancy in a large cue setoffers advantages in performance, and when compensation is notavailable (lacking the vocalic portion), listeners behave in a waythat is consistent with these informational assumptions. However,C-CuRE offered substantially better accuracy (7%– 8%) and
uniquely fit the context effects on performance. This would seemto disfavor exemplar models.
One concern with this is that in exemplar models, categorizationmay do more of the work. Storing complete exemplars may capturecontextual dependencies, making compensation less necessary andenabling better processing based on raw cues. Testing this will requirea formal implementation, which raises several issues. First, categori-zation decisions in exemplar models are made by comparing theincoming input to clouds of stored exemplars. But how many exem-plars take part in this? If the input is compared with every exemplar,the model will act like a prototype model, as the entire distribution isrelevant to categorization and will perform similarly to logistic re-gression. On the other hand, if the input is compared only with theclosest matching exemplar (or a handful of nearby ones), a modelwould harness more exemplar-like processing to achieve a betterdecision, if there is a close match. However, when one is not available(e.g., a new talker), it may perform worse. Second, depending on thescope of the exemplars, all types of contextual dependencies may notbe captured, for example, coarticulation that crosses a word boundary(Cole et al., 2010). Thus, evaluating exemplar models may requireconcrete decisions about the categorization rule and exemplar scope.
Second, without oversimplifying the differences, our use oflogistic regression closely overlaps with a range of models wetermed cue-integration models, models like FLMP (Oden & Mas-saro, 1978), NAPP (Nearey, 1990, 1997), and HICAT (Smits,2001a, 2001b). FLMP and NAPP are not strongly committed toany particular form of input (other than cues being continuous andindependent), and we see no reason that input parsed with C-CuREcould not be used (though this would introduce feedback that maybe incompatible with FLMP; Massaro, 1989, 2000).
Of the cue-integration models, HICAT (Smits, 2001a, 2001b) is clos-est to our approach, in that a cue’s interpretation is conditioned on otherdecisions (e.g., the vowel). In HICAT, this is embedded (and optimized)as part of the categorization problem, using interaction terms (e.g., F1 �Speaker) in the categorization model. This potentially creates a problemof generalization, as the influence of categories on cues is encoded withina single categorization decision. For example, one would have to learn theinfluence of a vowel and speaker on F1onset for /s/ decisions separatelyfrom the same influences on F1 for /�/ decisions. This may lead to anexplosion of such interaction terms. In C-CuRE, on the other hand,context effects are independent of specific categories: Rather than con-ditionalizing the interpretation of cues on context, cues are recodedrelative to expectations derived from context, making them available formany processes. This accounts for findings that listeners hear the signal ascompensated: for example, hearing a nasalized vowel as more oral ifnasalization can be attributed to coarticulation from a nasal consonant(Fowler & Brown, 2000; see also Beddor, Harnsberger, & Lindemann,2002; Pardo & Fowler, 1997). Of course, it is an open question whethercues are only encoded in compensated form, and the frication-onlymodels suggest that both raw and compensated cues may need to beavailable to listeners. Either way, however, by recoding cues the param-eters needed for compensation are independent of those needed forcategorization (unlike HICAT), which makes model estimation muchmore tractable. Crucially, our simulations suggest this simpler approach issufficient to account for listener performance in this corpus.
Cue-integration models like NAPP and HICAT have frameddebates over cue sharing, situations like the one studied herewhere a single cue is affected by multiple factors (Mermelstein,1978; Nearey, 1990, 1992; Smits, 2001a; Whalen, 1989, 1992),
239STATISTICAL MODELS OF FRICATIVE PERCEPTION
and model fit to complex perceptual data sets has been an impor-tant tool for comparing hypotheses. Nearey (1990) has argued thatcompensation effects on fricative identity can be accounted forwithout category 3 cue relationships by assuming listeners aresimply biased toward particular pairs of phonemes, whereasWhalen (1992) and Smits (2001a) argued that fricative categori-zation is dependent on how the vowel is categorized. Our analysissupports the latter view, but using stimuli that capture the naturalstatistical distribution of cue values (clustered) and a richer infor-mation source. The generality of the C-CuRE compensation mech-anism, however, extends this by suggesting that phoneme catego-rization may also be contingent on talker identity (cf. Nygaard etal., 1994; Strand, 1999) and thus offers a more unified account.
Finally, in the last few years, a number of statistical learningaccounts of speech perception have emerged (de Boer & Kuhl, 2003;Feldman, Griffiths, & Morgan, 2009; McMurray, Aslin, & Toscano,2009; Toscano & McMurray, 2010; Vallabha, McClelland, Pons,Werker, & Amano, 2007). Our logistic model was not meant toadvocate for any particular categorization framework, nor do wemake strong claims about learning. However, it shares with statisticalapproaches the intuition that the statistical structure of the input isfundamental to categorization, and it represents a powerful proof ofconcept by demonstrating that speech perception may in principle belearnable from the input and that fairly complex variation in listenerperformance (e.g., the effect across talkers and vowels) can be derivedlargely from the information in input.
Ultimately, however, statistics (and hence, information) will not besufficient to fully describe perception; we must also consider process-ing. Herein lies a limitation of our implementation of the ideasproposed here: In this specific domain, how do listeners identify thevowel to compensate during fricative perception, when vowel iden-tification may also benefit from knowing the fricative? We suggestthat listeners must simultaneously and interactively identify the talker,vowel, and fricative. Although these factors are identified in parallel,the cues for each may be available at different times, meaning that atsome points in processing (e.g., before the vowel arrives) listenersmay rely on an approach closer to our cue-integration approach,whereas once these contextual sources of information are available,they may be able to revise their initial decisions. This favors anapproach more akin to interactive activation (e.g., Elman & McClel-land, 1986), where a partial decision about talker or vowel could beused to parse cues to the fricative, increasing confidence in thefricative decision, while simultaneously, partial decisions about thefricative can be used to parse cues to the vowel (see also Smits’s,2001b, fuzzy parallel version of HICAT). Over time, the systemgradually settles on a complete parse of all three factors without evermaking a discrete decision about any one. Ultimately, though, under-standing such mechanisms will require detailed analyses of the timecourse of processing (e.g., McMurray, Clayards, Tanenhaus, & Aslin,2008) and more dynamic models of perception.
5.5. Computing Cues Relative to Expectations
The C-CuRE approach builds on parsing approaches that havehistorically been associated with gestural or acoustic accounts(Fowler, 1984; Gow, 2003). In contrast, our work shows that suchoperations do not require a particular representational form (cf.McMurray et al., in press; Ohala, 1981). C-CuRE also builds onauditory contrast accounts (Holt, 2006; Kluender et al., 2003; Lotto &
Kluender, 1998) by proposing that cues are interpreted relative toexpectations, though these expectations can be driven by categories(perhaps in addition to lower level expectations). This generalityallows a simple implementation using linear regression to partial outboth articulatory (vowel) and nonarticulatory (talker) factors as thedifference between expected and actual cue values.
When compared with other ways of relativizing cues,C-CuRE has several advantages. By relying on rememberedprototype values it avoids having to wait to accumulate infor-mation. For example, relativizing frication duration on the basisof vowel duration means that listeners must wait until the endof the vowel to identify the fricative. In fact, recent work(McMurray, Clayards, et al., 2008) on asynchronous cues tovoicing suggests listeners do not do this. C-CuRE also does notrequire a lifetime of phonetic studies to determine relativizingrelationships for each cue, and it can be used equally well withany cue. It also is consistent with prototype and statisticalaccounts of phonetic categories, because in order to parse outthe effect of a category on a cue, you must know its mean andvariance (McMurray & Farris-Trimble, in press).
Finally, like exemplar accounts, C-CuRE stresses the impor-tance of fine-grained, continuous detail, including indexicalinformation and the fact that it must be retained and used formultiple decisions during perception. Thus, it is not vulnerableto critiques leveled at normalization models (e.g., Pisoni, 1997).Finally, also like exemplar accounts, we stress the importanceof indexical cues, while positing a different role for them.Rather than simply lumping indexical information in with pho-netic cues, indexical cues are used to identify talkers, and thatin turn is used to interpret cues signaling phonetic contrasts.
5.6. Conclusions
Speech categorization fundamentally requires massive cue inte-gration, but categorization must be performed at the same time ascompensatory mechanisms that cope with contextual influences.When we approach categorization in this richer framework, manyproblems appear easier. Although studies of small numbers of cuesare valuable for exploring which cues are used (e.g., Massaro &Cohen, 1976; Summerfield, 1981) and for answering theoreticalquestions (e.g., Miller & Volaitis, 1989; Pisoni & Tash, 1974),they may also oversimplify issues and exaggerate problems (e.g.,Shinn, Blumstein, & Jongman, 1985).
Massively redundant information is the norm in speech catego-rization, but at the same time, cue sharing happens everywhere,and compensation using information from other types of categoriesis needed to cope with it. That is, categorization and compensationmechanisms may be deeply intertwined, challenging the concep-tion that compensation occurs autonomously and precategorically.This has not been extensively explored outside of speech but maybe crucial for understanding domains in which the information thatsupports categorization is variable and context dependent, domainslike face perception, color perception, and even abstract categorysystems like syntactic categories (e.g., Monaghan, Chater, &Christiansen, 2005).
C-CuRE suggests important interactions between categorizationand the encoding of perceptual cues. However, it is not the only suchinteraction that has been proposed. Categorical perception (Libermanet al., 1957), for example, implies that cue encoding is accomplished
240 MCMURRAY AND JONGMAN
in terms of categories. Categorical perception has not held up toempirical scrutiny in speech (Massaro & Cohen, 1983; Schouten etal., 2003; Toscano et al., 2010), largely due to evidence that fine-grained detail is retained. C-CuRE suggests a more interesting way inwhich categories may affect the encoding of continuous cues, one thatpreserves continuous detail by recoding cues relative to expectationsderived from categories. Thus, understanding compensation in per-ception may require us to understand higher level processes likecategorization, object recognition, and scene organization, and viceversa. More important, the generality of mechanisms like C-CuREsuggests that debates over representation may be of less importance inunderstanding categorization than debates over process: When theinformation is right, the framework for categorization may matter lessthan the content it works on.
References
Andruski, J. E., Blumstein, S. E., & Burton, M. W. (1994). The effect ofsubphonetic differences on lexical access. Cognition, 52, 163–187. doi:10.1016/0010-0277(94)90042-6
Ashby, G., & Perrin, N. (1988). Toward a unified theory of similarity andrecognition. Psychological Review, 95, 124–150. doi:10.1037/0033-295X.95.1.124
Balise, R. R., & Diehl, R. L. (1994). Some distributional facts aboutfricatives and a perceptual explanation. Phonetica, 51, 99–110. doi:10.1159/000261962
Baum, S. R., & Blumstein, S. E. (1987). Preliminary observations on theuse of duration as a cue to syllable-initial fricative consonant voicing inEnglish. Journal of the Acoustical Society of America, 82, 1073–1077.doi:10.1121/1.395382
Beale, J. M., & Keil, F. C. (1995). Categorical effects in the perception offaces. Cognition, 57, 217–239. doi:10.1016/0010-0277(95)00669-X
Beddor, P. S., Harnsberger, J. D., & Lindemann, S. (2002). Language-specific patterns of vowel-to-vowel coarticulation: Acoustic structuresand their perceptual correlates. Journal of Phonetics, 30, 591–627.doi:10.1006/jpho.2002.0177
Behrens, S. J., & Blumstein, S. E. (1988). Acoustic characteristics ofEnglish voiceless fricatives: A descriptive analysis. Journal of Phonet-ics, 16, 295–298.
Biederman, I. (1995). Visual object recognition. In S. F. Kosslyn & D. N.Osherson (Eds.), An invitation to cognitive science, 2nd edition, Vol. 2:Visual cognition (pp. 121–165). Cambridge, MA: MIT Press.
Blumstein, S. E., & Stevens, K. N. (1980). Perceptual invariance and onsetspectra for stop consonants in different vowel environments. Journal ofthe Acoustical Society of America, 67, 648–662. doi:10.1121/1.383890
Blumstein, S. E., & Stevens, K. N. (1981). Phonetic features and acousticinvariance in speech. Cognition, 10, 25–32. doi:10.1016/0010-0277(81)90021-4
Boersma, P., & Weenink, D. (2009). Praat: Doing phonetics by computer(Version 5.1.38) [Computer program]. Retrieved from http://www.praat.org/
Bornstein, M. H., & Korda, N. O. (1984). Discrimination and matchingwithin and between hues measured by reaction times: Some implicationsfor categorical perception and levels of information processing. Psycho-logical Research, 46, 207–222. doi:10.1007/BF00308884
Bradlow, A. R., Nygaard, L. C., & Pisoni, D. B. (1999). Effects of talker,rate, and amplitude variation on recognition memory for spoken words.Perception & Psychophysics, 61, 206–219.
Cohen, J., & Cohen, P. (1983). Applied multiple regression/correlationanalysis for the behavioral sciences (2nd ed.). Hillsdale, NJ: Erlbaum.
Cole, J. S., Linebaugh, G., Munson, C., & McMurray, B. (2010). Unmask-ing the acoustic effects of vowel-to-vowel coarticulation: A statisticalmodeling approach. Journal of Phonetics, 38, 167–184. doi:10.1016/j.wocn.2009.08.004
Connine, C. M. (2004). It’s not what you hear but how often you hear it:On the neglected role of phonological variant frequency in auditoryword recognition. Psychonomic Bulletin & Review, 11, 1084–1089.
Connine, C. M., Ranbom, L., & Patterson, D. (2008). Processing variantforms in spoken word recognition: The role of variant frequency. Per-ception & Psychophysics, 70, 403–411. doi:10.3758/PP.70.3.403
Creel, S. C., Aslin, R. N., & Tanenhaus, M. K. (2008). Heeding the voiceof experience: The role of talker variation in lexical access. Cognition,106, 633–664. doi:10.1016/j.cognition.2007.03.013
Cronbach, L. J. (1987). Statistical tests for moderator variables: Flaws inanalyses recently proposed. Psychological Bulletin, 102, 414–417. doi:10.1037/0033-2909.102.3.414
Crystal, T., & House, A. (1988). Segmental durations in connected-speechsignals: Current results. Journal of the Acoustical Society of America,83, 1553–1573. doi:10.1121/1.395911
Dahan, D., Magnuson, J. S., Tanenhaus, M. K., & Hogan, E. M. (2001).Subcategorical mismatches and the time course of lexical access: Evi-dence for lexical competition. Language and Cognitive Processes, 16,507–534. doi:10.1080/01690960143000074
de Boer, B., & Kuhl, P. K. (2003). Investigating the role of infant-directedspeech with a computer model. Acoustic Research Letters Online, 4,129–134. doi:10.1121/1.1613311
Delattre, P., Liberman, A. M., & Cooper, F. S. (1955). Acoustic loci andtransitional cues for consonants. Journal of the Acoustical Society ofAmerica, 27, 769–773. doi:10.1121/1.1908024
Elman, J., & McClelland, J. (1986). Exploiting lawful variability in thespeech wave. In J. S. Perkell & D. Klatt (Eds.), Invariance and vari-ability in speech processes (pp. 360–380). Hillsdale, NJ: Erlbaum.
Ernst, M. O., & Banks, M. S. (2002, January 24). Humans integrate visualand haptic information in a statistically optimal fashion. Nature, 415,429–433. doi:10.1038/415429a
Feldman, N. H., Griffiths, T. L., & Morgan, J. L. (2009). The influence ofcategories on perception: Explaining the perceptual magnet effect asoptimal statistical inference. Psychological Review, 116, 752–782. doi:10.1037/a0017196
Forrest, K., Weismer, G., Milenkovic, P., & Dougall, R. N. (1988).Statistical analysis of word-initial voiceless obstruents: Preliminary data.Journal of the Acoustical Society of America, 84, 115–123. doi:10.1121/1.396977
Fowler, C. A. (1984). Segmentation of coarticulated speech in perception.Perception & Psychophysics, 36, 359–368.
Fowler, C. A. (1994). Invariants, specifiers, cues: An investigation of locusequations as information for place of articulation. Perception & Psycho-physics, 55, 597–610.
Fowler, C. A. (1996). Listeners do hear sounds, not tongues. Journal of theAcoustical Society of America, 99, 1730–1741. doi:10.1121/1.415237
Fowler, C. A., & Brown, J. (2000). Perceptual parsing of acoustic conse-quences of velum lowering from information for vowels. Perception &Psychophysics, 62, 21–32.
Fowler, C. A., & Smith, M. (1986). Speech perception as “vector analysis”:An approach to the problems of segmentation and invariance. In J.Perkell & D. H. Klatt (Eds.), Invariance and variability in speechprocesses (pp. 123–136). Hillsdale, NJ: Erlbaum.
Ganong, W. F. (1980). Phonetic categorization in auditory word recogni-tion. Journal of Experimental Psychology: Human Perception and Per-formance, 6, 110–125. doi:10.1037/0096-1523.6.1.110
Gibson, J. J. (1966). The senses considered as perceptual systems. Boston,MA: Houghton Mifflin.
Goldinger, S. D. (1998). Echoes of echoes? An episodic theory of lexicalaccess. Psychological Review, 105, 251–279. doi:10.1037/0033-295X.105.2.251
Goldstone, R. L. (1995). The effects of categorization on color perception.Psychological Science, 6, 298 –304. doi:10.1111/j.1467-9280.1995.tb00514.x
241STATISTICAL MODELS OF FRICATIVE PERCEPTION

Goldstone, R. L., & Kersten, A. (2003). Concepts and categories. In A. F.Healy & R. W. Proctor (Eds.), Comprehensive handbook of psychology,Vol. 4: Experimental psychology (pp. 591–621). New York, NY: Wiley.
Goldstone, R. L., Lippa, Y., & Shiffrin, R. M. (2001). Altering objectrepresentations through category learning. Cognition, 78, 27–43. doi:10.1016/S0010-0277(00)00099-8
Gow, D. W. (2001). Assimilation and anticipation in continuous spokenword recognition. Journal of Memory and Language, 45, 133–159.doi:10.1006/jmla.2000.2764
Gow, D. W. (2003). Feature parsing: Feature cue mapping in spoken wordrecognition. Perception & Psychophysics, 65, 575–590.
Hansen, T., Olkkonen, M., Walter, S., & Gegenfurtner, K. R. (2006).Memory modulates color appearance. Nature Neuroscience, 9, 1367–1368. doi:10.1038/nn1794
Hawkins, S. (2003). Roles and representations of systematic fine phoneticdetail in speech understanding. Journal of Phonetics, 31, 373–405.doi:10.1016/j.wocn.2003.09.006
Hillenbrand, J. M., & Houde, R. A. (2003). A narrow band pattern-matching model of vowel perception. Journal of the Acoustical Societyof America, 113, 1044–1055. doi:10.1121/1.1513647
Hintzman, D. L. (1986). “Schema abstraction” in a multiple-trace memorymodel. Psychological Review, 93, 411– 428. doi:10.1037/0033-295X.93.4.411
Holt, L. L. (2006). The mean matters: Effects of statistically-definednon-speech spectral distributions on speech categorization. Journal ofthe Acoustical Society of America, 120, 2801–2817. doi:10.1121/1.2354071
Holt, L. L., & Lotto, A. (2010). Speech perception as categorization.Attention, Perception & Psychophysics, 72, 1218–1227. doi:10.3758/APP.72.5.1218
Homa, D., & Cultice, J. (1984). Role of feedback, category size, andstimulus distortion on the acquisition and utilization of ill-defined cat-egories. Journal of Experimental Psychology: Learning, Memory, andCognition, 10, 83–94. doi:10.1037/0278-7393.10.1.83
Honorof, D. N., & Whalen, D. (2005). Perception of pitch location withina speaker’s F0 range. Journal of the Acoustical Society of America, 117,2193–2200. doi:10.1121/1.1841751
Hosmer, D. W., & Lemeshow, S. (2000). Applied logistic regression (2nded.). New York, NY: Wiley. doi:10.1002/0471722146
Huette, S., & McMurray, B. (2010). Continuous dynamics of color cate-gorization. Psychonomic Bulletin & Review, 17, 348–354. doi:10.3758/PBR.17.3.348
Hughes, G. W., & Halle, M. (1956). Spectral properties of fricativeconsonants. Journal of the Acoustical Society of America, 28, 303–310.doi:10.1121/1.1908271
Jacobs, R. A. (2002). What determines visual cue reliability? Trends inCognitive Sciences, 6, 345–350. doi:10.1016/S1364-6613(02)01948-4
Johnson, K. (1997). Speech perception without speaker normalization: Anexemplar model. In K. Johnson & J. W. Mullenix (Eds.), Talker vari-ability in speech perception (pp. 145–166). New York, NY: AcademicPress.
Johnson, K., & Mullenix, J. (Eds.). (1997). Talker variability in speechperception. New York, NY: Academic Press.
Johnson, K. C., Strand, E. A., & D’Imperio M. (1999). Auditory–visualintegration of talker gender in vowel perception. Journal of Phonetics,27, 359–384. doi:10.1006/jpho.1999.0100
Jongman, A. (1989). Duration of fricative noise required for identificationof English fricatives. Journal of the Acoustical Society of America, 85,1718–1725. doi:10.1121/1.397961
Jongman, A., Wang, Y., & Sereno, J. A. (2000). Acoustic and perceptualproperties of English fricatives. Proceedings of the 6th InternationalConference on Spoken Language Processing, 1, 536–539.
Jongman, A., Wayland, R., & Wong, S. (2000). Acoustic characteristics of
English fricatives. Journal of the Acoustical Society of America, 108,1252–1263. doi:10.1121/1.1288413
Kewley-Port, D., & Luce, P. A. (1984). Time-varying features of initialstop consonants in auditory running spectra: A first report. Perception &Psychophysics, 35, 353–360.
Kluender, K., Coady, J., & Kiefte, M. (2003). Sensitivity to change inperception of speech. Speech Communication, 41, 59–69. doi:10.1016/S0167-6393(02)00093-6
Kulikowski, J. J., & Vaitkevicius, H. (1997). Colour constancy as afunction of hue. Acta Psychologica, 97, 25–35. doi:10.1016/S0001-6918(97)00022-X
Lahiri, A., Gewirth, L., & Blumstein, S. E. (1984). A reconsideration ofacoustic invariance for place of articulation in diffuse stop consonants:Evidence from a cross-language study. Journal of the Acoustical Societyof America, 76, 391–404. doi:10.1121/1.391580
LaRiviere, C., Winitz, H., & Herriman, E. (1975). The distribution ofperceptual cues in English prevocalic fricatives. Journal of Speech andHearing Research, 18, 613–622.
Lee, C. Y., Dutton, L., & Ram, G. (2010). The role of speaker genderidentification in F0 height estimation from multispeaker, brief speechsegments. Journal of the Acoustical Society of America, 128, 384–388.doi:10.1121/1.3397514
Liberman, A. M., Harris, K. S., Hoffman, H. S., & Griffith, B. C. (1957).The discrimination of speech sounds within and across phoneme bound-aries. Journal of Experimental Psychology, 54, 358–368. doi:10.1037/h0044417
Liberman, A. M., & Mattingly, I. G. (1985). The motor theory of speechperception revised. Cognition, 21, 1–36. doi:10.1016/0010-0277(85)90021-6
Liberman, A. M., & Whalen, D. H. (2000). On the relation of speech tolanguage. Trends in Cognitive Sciences, 4, 187–196. doi:10.1016/S1364-6613(00)01471-6
Lindblom, B. (1996). Role of articulation in speech perception: Clues fromproduction. Journal of the Acoustical Society of America, 99, 1683–1692. doi:10.1121/1.414691
Lipsitz, S., Kim, K., & Zhao, L. (1994). Analysis of repeated categoricaldata using generalized estimating equations. Statistics in Medicine, 13,1149–1163. doi:10.1002/sim.4780131106
Lotto, A. J., & Kluender, K. R. (1998). General contrast effects in speechperception: Effect of preceding liquid on stop consonant identification.Perception & Psychophysics, 60, 602–619.
Luce, R. D. (1959). Individual choice behavior: A theoretical analysis.New York, NY: Wiley.
Maddox, W. T., Molis, M., & Diehl, R. (2002). Generalizing a neuropsy-chological model of visual categorization to auditory categorization ofvowels. Perception & Psychophysics, 64, 584–597.
Maniwa, K., Jongman, A., & Wade, T. (2008). Perception of clear frica-tives by normal-hearing and simulated hearing-impaired listeners. Jour-nal of the Acoustical Society of America, 123, 1114–1125. doi:10.1121/1.2821966
Maniwa, K., Jongman, A., & Wade, T. (2009). Acoustic characteristics ofclearly spoken English fricatives. Journal of the Acoustical Society ofAmerica, 125, 3962–3973. doi:10.1121/1.2990715
Mann, V. A., & Repp, B. (1981). Influence of preceding fricative on stopconsonant perception. Journal of the Acoustical Society of America, 69,548–558. doi:10.1121/1.385483
Marr, D. (1982). Vision: A computational investigation into the humanrepresentation and processing of visual information. New York, NY:Freeman.
Marslen-Wilson, W., & Warren, P. (1994). Levels of perceptual represen-tation and process in lexical access: Words, phonemes, and features.Psychological Review, 101, 653– 675. doi:10.1037/0033-295X.101.4.653
Martin, J. G., & Bunnell, H. T. (1981). Perception of anticipatory coar-
242 MCMURRAY AND JONGMAN

ticulation effects. Journal of the Acoustical Society of America, 69,559–567. doi:10.1121/1.385484
Martin, J. G., & Bunnell, H. T. (1982). Perception of anticipatory coar-ticulation effects in vowel-stop consonant-vowel sequences. Journal ofExperimental Psychology: Human Perception and Performance, 8, 473–488. doi:10.1037/0096-1523.8.3.473
Massaro, D. W. (1989). Testing between the TRACE model and the fuzzylogical model of speech perception. Cognitive Psychology, 21, 398–421.doi:10.1016/0010-0285(89)90014-5
Massaro, D. W. (2000). The horse race to language understanding: FLMPwas first out of the gate, and has yet to be overtaken. Behavioral andBrain Sciences, 23, 338–339. doi:10.1017/S0140525X00363245
Massaro, D. W., & Cohen, M. (1976). The contribution of fundamentalfrequency and voice onset time to the /zi/-/si/ distinction. Journal of theAcoustical Society of America, 60, 704–717. doi:10.1121/1.381143
Massaro, D. W., & Cohen, M. M. (1983). Categorical or continuous speechperception: A new test. Speech Communication, 2, 15–35. doi:10.1016/0167-6393(83)90061-4
Maye, J., Werker, J. F., & Gerken, L. (2002). Infant sensitivity to distri-butional information can affect phonetic discrimination. Cognition, 82,B101–B111. doi:10.1016/S0010-0277(01)00157-3
McCann, J. J., McKee, S. P., & Taylor, T. H. (1976). Quantitative studiesin retinex theory: A comparison between theoretical predictions andobserver responses to the “color Mondrian” experiments. Vision Re-search, 16, 445–458. doi:10.1016/0042-6989(76)90020-1
McLennan, C. T., & Luce, P. A. (2005). Examining the time course ofindexical specificity effects in spoken word recognition. Journal ofExperimental Psychology: Learning, Memory, and Cognition, 31, 306–321. doi:10.1037/0278-7393.31.2.306
McMurray, B., Aslin, R., Tanenhaus, M., Spivey, M., & Subik, D. (2008).Gradient sensitivity to within-category variation in speech: Implicationsfor categorical perception. Journal of Experimental Psychology: HumanPerception and Performance, 34, 1609–1631. doi:10.1037/a0011747
McMurray, B., Aslin, R. N., & Toscano, J. (2009). Statistical learning ofphonetic categories: Computational insights and limitations. Develop-mental Science, 12, 369–378. doi:10.1111/j.1467-7687.2009.00822.x
McMurray, B., Clayards, M., Tanenhaus, M., & Aslin, R. (2008). Trackingthe timecourse of phonetic cue integration during spoken word recog-nition. Psychonomic Bulletin & Review, 15, 1064–1071. doi:10.3758/PBR.15.6.1064
McMurray, B., Cole, J. S., & Munson, C. (in press). Features as anemergent product of computing perceptual cues relative to expectations.In R. Ridouane & N. Clement (Eds.), Where do features come from? Thenature and sources of phonological primitives. Amsterdam, the Nether-lands: Benjamins.
McMurray, B., Dennhardt, J., & Struck-Marcell, A. (2008). Context effectson musical chord categorization: Different forms of top-down feedbackin speech and music? Cognitive Science, 32, 893–920.
McMurray, B., & Farris-Trimble, A. (in press). Emergent information-level coupling between perception and production. In A. Cohn, C.Fougeron, & M. Huffman (Eds.), The Oxford handbook of laboratoryphonology. Oxford, England: Oxford University Press.
McMurray, B., Tanenhaus, M., & Aslin, R. (2002). Gradient effects ofwithin-category phonetic variation on lexical access. Cognition, 86,B33–B42. doi:10.1016/S0010-0277(02)00157-9
McMurray, B., Tanenhaus, M. K., & Aslin, R. N. (2009). Within-categoryVOT affects recovery from “lexical” garden paths: Evidence againstphoneme-level inhibition. Journal of Memory and Language, 60, 65–91.doi:10.1016/j.jml.2008.07.002
Medin, D. L., Lynch, E. B., & Solomon, K. O. (2000). Are there kinds ofconcepts? Annual Review of Psychology, 51, 121–147. doi:10.1146/annurev.psych.51.1.121
Medin, D. L., & Schaffer, M. M. (1978). Context theory of classification
learning. Psychological Review, 85, 207–238. doi:10.1037/0033-295X.85.3.207
Mermelstein, P. (1978). On the relationship between vowel and consonantidentification when cued by the same acoustic information. Perception& Psychophysics, 23, 331–336.
Mertus, J. (1989). BLISS manual. Brown University, Providence, RI.Miller, J. L. (1997). Internal structure of phonetic categories. Language
and Cognitive Processes, 12, 865–870. doi:10.1080/016909697386754Miller, J. L., & Volaitis, L. E. (1989). Effect of speaking rate on the
perceptual structure of a phonetic category. Perception & Psychophys-ics, 46, 505–512.
Mitterer, H., & de Ruiter, J. P. (2008). Recalibrating color categories usingworld knowledge. Psychological Science, 19, 629–634. doi:10.1111/j.1467-9280.2008.02133.x
Monaghan, P., Chater, N., & Christiansen, M. H. (2005). The differentialrole of phonological and distributional cues in grammatical categorisa-tion. Cognition, 96, 143–182. doi:10.1016/j.cognition.2004.09.001
Munson, B. (2007). The acoustic correlates of perceived sexual orientation,perceived masculinity, and perceived femininity. Language and Speech,50, 125–142. doi:10.1177/00238309070500010601
Munson, B., McDonald, E. C., DeBoe, N. L., & White, A. R. (2006). Theacoustic and perceptual bases of judgments of women and men’s sexualorientation from read speech. Journal of Phonetics, 34, 202–240. doi:10.1016/j.wocn.2005.05.003
Nearey, T. M. (1978). Phonetic feature systems for vowels. Bloomington,IN: Indiana University Linguistics Club.
Nearey, T. M. (1990). The segment as a unit of speech perception. Journalof Phonetics, 18, 347–373.
Nearey, T. M. (1992). Context effects in a double-weak theory of speechperception. Language and Speech, 35, 153–171.
Nearey, T. M. (1997). Speech perception as pattern recognition. Journal ofthe Acoustical Society of America, 101, 3241–3254. doi:10.1121/1.418290
Nearey, T. M., & Hogan, J. (1986). Phonological contrast in experimentalphonetics: Relating distributions of measurements in production data toperceptual categorization curves. In J. Ohala & J. Jaeger (Eds.), Exper-imental phonology (pp. 141–161). New York, NY: Academic Press.
Nissen, S. L., & Fox, R. A. (2005). Acoustic and spectral characteristics ofyoung children’s fricative productions: A developmental perspective.Journal of the Acoustical Society of America, 118, 2570–2578. doi:10.1121/1.2010407
Nosofsky, R. M. (1986). Attention, similarity, and the identification–categorization relationship. Journal of Experimental Psychology: Gen-eral, 115, 39–57. doi:10.1037/0096-3445.115.1.39
Nygaard, L., Sommers, M., & Pisoni, D. (1994). Speech perception as atalker-contingent process. Psychological Science, 5, 42– 46. doi:10.1111/j.1467-9280.1994.tb00612.x
Oden, G. C. (1978). Integration of place and voicing information in theidentification of synthetic stop consonants. Journal of Phonetics, 6,83–93.
Oden, G. C., & Massaro, D. W. (1978). Integration of featural informationin speech perception. Psychological Review, 85, 172–191. doi:10.1037/0033-295X.85.3.172
Ohala, J. J. (1981). The listener as a source of sound change. In C. S.Masek, R. A. Hendrick, & M. F. Miller (Eds.), Papers from the para-session on language and behavior (pp. 178–203). Chicago, IL: ChicagoLinguistics Society.
Ohala, J. J. (1996). Speech perception is hearing sounds, not tongues.Journal of the Acoustical Society of America, 99, 1718–1725. doi:10.1121/1.414696
Öhman, S. E. G. (1966). Coarticulation in VCV utterances: Spectrographicmeasurements. Journal of the Acoustical Society of America, 39, 151–168. doi:10.1121/1.1909864
Oliva, A., & Schyns, P. (1997). Coarse blobs or fine edges? Evidence that
243STATISTICAL MODELS OF FRICATIVE PERCEPTION
information diagnosticity changes the perception of complex visualstimuli. Cognitive Psychology, 34, 72–107. doi:10.1006/cogp.1997.0667
Palmeri, T. J., Goldinger, S., & Pisoni, D. (1993). Episodic encoding ofvoice attributes and recognition memory for spoken words. Journal ofExperimental Psychology: Learning, Memory, and Cognition, 19, 309–328. doi:10.1037/0278-7393.19.2.309
Pardo, J. S., & Fowler, C. A. (1997). Perceiving the causes of coarticula-tory acoustic variation: Consonant voicing and vowel pitch. Perception& Psychophysics, 59, 1141–1152.
Pierrehumbert, J. (2001). Exemplar dynamics: Word frequency, lenitionand contrast. In J. Bybee & P. Hopper (Eds.), Frequency effects and theemergence of linguistic structure (pp. 323–418). Amsterdam, the Neth-erlands: Benjamins.
Pierrehumbert, J. B. (2003). Phonetic diversity, statistical learning, andacquisition of phonology. Language and Speech, 46, 115–154. doi:10.1177/00238309030460020501
Pind, J. (1995). Speaking rate, VOT and quantity: The search for higher-order invariants for two Icelandic speech cues. Perception & Psycho-physics, 57, 291–304.
Pisoni, D. B. (1997). Some thoughts on “normalization” in speech percep-tion. In K. Johnson & J. W. Mullennix (Eds.), Talker variability inspeech processing (pp. 9–32). San Diego, CA: Academic Press.
Pisoni, D. B., & Tash, J. (1974). Reaction times to comparisons within andacross phonetic categories. Perception & Psychophysics, 15, 285–290.
Port, R. F. (2007). How are words stored in memory? Beyond phones andphonemes. New Ideas in Psychology, 25, 143–170. doi:10.1016/j.newideapsych.2007.02.001
Port, R. F., & Dalby, J. (1982). Consonant/vowel ratio as a cue for voicingin English. Perception & Psychophysics, 32, 141–152.
Posner, M. I., & Keele, S. W. (1968). On the genesis of abstract ideas.Journal of Experimental Psychology, 77, 353–363. doi:10.1037/h0025953
Reed, S. (1972). Pattern recognition and categorization. Cognitive Psychol-ogy, 3, 382–407. doi:10.1016/0010-0285(72)90014-X
Roberson, D., & Davidoff, J. (2000). The categorical perception of colorsand facial expressions: The effect of verbal interference. Memory &Cognition, 28, 977–986.
Roberson, D., Hanley, J. R., & Pak, H. (2009). Thresholds for colordiscrimination in English and Korean speakers. Cognition, 112, 482–487. doi:10.1016/j.cognition.2009.06.008
Rosner, B., & Pickering, J. (1994). Vowel perception and production.Oxford, England: Oxford University Press. doi:10.1093/acprof:oso/9780198521389.001.0001
Salverda, A. P., Dahan, D., & McQueen, J. (2003). The role of prosodicboundaries in the resolution of lexical embedding in speech comprehen-sion. Cognition, 90, 51–89. doi:10.1016/S0010-0277(03)00139-2
Sawusch, J. R., & Pisoni, D. B. (1974). On the identification of place andvoicing features in synthetic stop consonants. Journal of Phonetics, 2,181–194.
Schouten, M. E. H., Gerrits, E., & Van Hessen, A. J. (2003). The end ofcategorical perception as we know it. Speech Communication, 41, 71–80. doi:10.1016/S0167-6393(02)00094-8
Schwarz, G. E. (1978). Estimating the dimension of a model. Annals ofStatistics, 6, 461–464. doi:10.1214/aos/1176344136
Schyns, P. G., & Rodet, L. (1997). Categorization creates functionalfeatures. Journal of Experimental Psychology: Learning, Memory, andCognition, 23, 681–696. doi:10.1037/0278-7393.23.3.681
Shinn, P. C., Blumstein, S. E., & Jongman, A. (1985). Limitations ofcontext-conditioned effects on the perception of [b] and [w]. Perception& Psychophysics, 38, 397–407.
Smits, R. (2001a). Evidence for hierarchical categorization of coarticulatedphonemes. Journal of Experimental Psychology: Human Perception andPerformance, 27, 1145–1162. doi:10.1037/0096-1523.27.5.1145
Smits, R. (2001b). Hierarchical categorization of coarticulated pho-
nemes: A theoretical analysis. Perception & Psychophysics, 63,1109 –1139.
Smits, R., Jongman, A., & Sereno, J. (2006). Categorization of sounds.Journal of Experimental Psychology: Human Perception and Perfor-mance, 32, 733–754. doi:10.1037/0096-1523.32.3.733
Soli, S. D. (1981). Second formants in fricatives: Acoustic consequences offricative–vowel coarticulation. Journal of the Acoustical Society ofAmerica, 70, 976–984. doi:10.1121/1.387032
Soto, F. A., & Wasserman, E. (2010). Error-driven learning in visualcategorization and object recognition: A common-elements model. Psy-chological Review, 117, 349–381. doi:10.1037/a0018695
Stevens, K. N. (2002). Toward a model for lexical access based on acousticlandmarks and distinctive features. Journal of the Acoustical Society ofAmerica, 111, 1872–1891. doi:10.1121/1.1458026
Stevens, K. N., & Blumstein, S. E. (1978). Invariant cues for place ofarticulation in stop consonants. Journal of the Acoustical Society ofAmerica, 64, 1358–1368. doi:10.1121/1.382102
Stevens, K. N., Blumstein, S. E., Glicksman, L., Burton, M., & Kurowski,K. (1992). Acoustic and perceptual characteristics of voicing in frica-tives and fricative clusters. Journal of the Acoustical Society of America,91, 2979–3000. doi:10.1121/1.402933
Stevens, K. N., & Keyser, S. J. (2010). Quantal theory, enhancement and overlap.Journal of Phonetics, 38, 10–19. doi:10.1016/j.wocn.2008.10.004
Stoel-Gammon, C., Williams, K., & Buder, E. H. (1994). Cross-languagedifferences in phonological acquisition: Swedish and American /t/. Pho-netica, 51, 146–158. doi:10.1159/000261966
Strand, E. (1999). Uncovering the role of gender stereotypes in speechperception. Journal of Language and Social Psychology, 18, 86–100.doi:10.1177/0261927X99018001006
Strevens, P. (1960). Spectra of fricative noise in human speech. Languageand Speech, 3, 32–49.
Summerfield, Q. (1981). Articulatory rate and perceptual constancy inphonetic perception. Journal of the Acoustical Society of America, 7,1074–1095.
Sussman, H. M., Fruchter, D., Hilbert, J., & Sirosh, J. (1998). Linearcorrelates in the speech signal: The orderly output constraint. Behavioraland Brain Sciences, 21, 241–259. doi:10.1017/S0140525X98001174
Sussman, H. M., & Shore, J. (1996). Locus equations as phonetic descrip-tors of consonantal place of articulation. Perception & Psychophysics,58, 936–946.
Tomiak, G. (1990). An acoustic and perceptual analysis of the spectralmoments invariant with voiceless fricative obstruents (Unpublished doc-toral dissertation). SUNY Buffalo, Buffalo, NY.
Toscano, J., & McMurray, B. (2010). Cue integration with categories: Astatistical approach to cue weighting and combination in speech percep-tion. Cognitive Science, 34, 436–464.
Toscano, J. C., McMurray, B., Dennhardt, J., & Luck, S. (2010). Contin-uous perception and graded categorization: Electrophysiological evi-dence for a linear relationship between the acoustic signal and perceptualencoding of speech. Psychological Science, 21, 1532–1540. doi:10.1177/0956797610384142
Vallabha, G. K., McClelland, J. L., Pons, F., Werker, J. F., & Amano, S.(2007). Unsupervised learning of vowel categories from infant-directedspeech. Proceedings of the National Academy of Sciences, USA, 104,13273–13278. doi:10.1073/pnas.0705369104
Viswanathan, N., Fowler, C. A., & Magnuson, J. S. (2009). A criticalexamination of the spectral contrast account of compensation for coar-ticulation. Psychonomic Bulletin & Review, 16, 74–79. doi:10.3758/PBR.16.1.74
Werker, J. F., Pons, F., Dietrich, C., Kajikawa, S., Fais, L., & Amano, S.(2007). Infant-directed speech supports phonetic category learning inEnglish and Japanese. Cognition, 103, 147–162. doi:10.1016/j.cognition.2006.03.006
Whalen, D. H. (1981). Effects of vocalic formant transitions and vowel
244 MCMURRAY AND JONGMAN
quality on the English /s–�/ boundary. Journal of the Acoustical Societyof America, 69, 275–282. doi:10.1121/1.385348
Whalen, D. H. (1989). Vowel and consonant judgments are not indepen-dent when cued by the same information. Perception & Psychophysics,46, 284–292.
Whalen, D. H. (1992). Perception of overlapping segments: Thoughts onNearey’s model. Journal of Phonetics, 20, 493–496.
You, H.-Y. (1979). An acoustic and perceptual study of English fricatives(Unpublished master’s thesis). University of Alberta, Calgary, Alberta,Canada.
Appendix
Measurement and Data Processing of the Corpus of Cue Values
This appendix describes each of the individual cues that weremeasured in the corpus of fricatives and how they were measured.JWW refers to the original Jongman, Wayland, and Wong (2000)study.
Peak frequency was taken from JWW and measured from a40-ms window at the center of the frication noise. It is the fre-quency of the highest-amplitude peak of the fast Fourier transfor-mation (FFT) spectrum.
Frication duration and vowel duration were also obtained fromJWW and measured from zero-crossings. Fricative onset was thefirst point at which high-frequency energy appeared in the spec-trogram. Fricative offset/vowel onset was marked at the intensityminimum prior to the onset of periodic voicing energy for voice-less fricatives and as the earliest period at which the waveformchanged substantially (with respect to the frication) for voicedfricatives. Vowel offset was identified as the onset of the closureportion of the /p/.
Frication root-mean-square (RMS) amplitude and vowel RMSamplitude were obtained from JWW and measured by computingthe RMS amplitude in decibels for the entire frication as well asthree consecutive pitch periods at the point of maximum vowelamplitude, respectively.
Spectral mean, variance, skewness, and kurtosis were JWWmeasurements and computed from spectra obtained from three40-ms Hamming windows centered at the onset, midpoint, and endof the frication. Spectra were based on a linear frequency scale, asJongman, Wayland, and Wong (2000) reported little differencewhen values were derived from bark-scaled frequencies.
Transition moments were also derived in the same way from awindow that included the last 20 ms of the frication and the first 20ms of the vowel.
All spectral moment data were taken directly from the JWWdatabase, with three modifications. First, Jongman, Wayland, andWong (2000) reported the second moment as spectral variance,which can have very high values. We converted the second mo-ment to standard deviations by taking the square root of each value(see Stoel-Gammon, Williams, & Buder, 1994). Second, Window3 (the last 40 ms of the frication) was removed from the analysis
because it overlapped with Window 4 (which included the final 20ms of the frication and the first 20 ms of the vowel) and wouldhence violate the independence assumptions of most statisticaltests. Third, the moments in Windows 1 and 2 were highly corre-lated, particularly for the first two moments (M1: R � .85; M2:R � .82; M3: R � .63; M4: R � .43). This made it difficult forsome of the models to converge. Therefore, moments in these twowindows were averaged to create estimates of spectral mean,variance, skew, and kurtosis that spanned the two windows.
We also measured the following new cues, using a combinationof the Praat speech analysis software (Boersma & Weenink, 2009)and several custom MATLAB scripts.
Low-frequency energy was included as a potential measure ofvoicing during the frication. A spectrum over the entire fricationnoise was computed, and the average amplitude of the componentsbelow 500 Hz was measured.
Formant frequencies: The frequency of the first five formantsover the first 23.3 ms of vowel onset was measured in two stages.First, frequencies were automatically extracted for all files usingthe Burg algorithm with two different parameter sets (one selectedfor men and one for women). Next, a trained phonetic coderviewed plots of both formant tracks on top of the correspondingspectrograms and determined if either of the automatically codedtracks was correct. If not, formant frequency values were enteredby hand from the spectrogram.
Fundamental frequency (F0) was computed for the first 46.6 msof each vowel.
Narrow-band amplitude: This is a modification of the relativeamplitude measure reported by JWW. In their article, relativeamplitude was computed in two stages. First, the amplitude of F3at vowel onset for sibilants (/s, z, �, �/) and of F5 for nonsibilants(/f, v, �, ð/) was measured using a discrete Fourier transform overa 23.3-ms window. Second, a spectrum was derived over themiddle 23.3 ms of the fricative, and the amplitude of the frequencycomponent closest to the F3 or F5 values was obtained. Relativeamplitude was then the difference between fricative amplitude andvowel amplitude.
(Appendix continues)
245STATISTICAL MODELS OF FRICATIVE PERCEPTION

Although this is an excellent cue to place of articulation, wewere concerned that this cue was measured differently dependingon sibilance. In the vocalic portion, the amplitude in the F3 region(used for sibilants) is almost certainly greater than in the F5 region(used for nonsibilants). Thus this cue could artificially distinguishsibilants from nonsibilants. To avoid this, we measured both F3and F5 amplitude for all fricatives and treated them as two separatecues.
Jongman, Wayland, and Wong (2000) relativized this measureby subtracting the amplitude in the fricative from that of the vowel.We chose not to do this for two reasons. First, several of theanalyses were intended to examine the cues in the frication noisealone, and it was unclear whether such cues should be counted asfrication cues or vowel cues—there is clearly amplitude informa-tion in the fricative alone even if it cannot be relativized against thevowel. Second, and more important, we wanted our models to usefirst-order cues (e.g., without normalization). Thus, it made sense
to treat these as four independent cues: the amplitude in the F3 andF5 regions for the frication and for the vocalic portion. We refer tothese measurements as narrow-band amplitudes.
Finally, some of the cues (spectral mean and variance, in par-ticular) were large in real valued terms (spectral mean averaged5,879 Hz, and standard deviation averaged 2,121 Hz) in Window1. Including these along with values in the 0–1 range (e.g.,duration in seconds) posed a problem for fitting the logistic modelsdescribed in Sections 3 and 4. Thus, prior to analysis, all variableswere converted to Z scores (relative to the overall mean andstandard deviation), a form of centering that is common in regres-sion and other generalized linear models (Cronbach, 1987).
Received March 4, 2010Revision received November 1, 2010
Accepted November 2, 2010 �
Call for Papers: Special Section on Theory and Data in Categorization:Integrating Computational, Behavioral, and Cognitive Neuroscience Approaches
The Journal of Experimental Psychology: Learning, Memory, and Cognition (JEP:LMC) invitesmanuscripts for a special section on approaches to categorization, to be compiled by guest editorsStephan Lewandowsky and Thomas Palmeri working together with journal Associate EditorMichael Waldmann.
The goal of the special section is to showcase high-quality research that brings togetherbehavioral, computational, mathematical, neuropsychological, and neuroimaging approaches tounderstanding the processes underlying category learning. There has been some divergence betweenapproaches recently, with computational-mathematical models emphasizing the unity of category-learning processes while neuropsychological models emphasize the distinction between multipleunderlying memory systems. We are seeking articles that integrate cognitive neuroscience findingsin designing models or interpreting results, and behavioral studies and modeling results thatconstrain neuroscientific theories of categorization. In addition to empirical papers, focused reviewarticles that highlight the significance of cognitive neuroscience approaches to cognitive theory—and/or the importance of behavioral data and computational models on constraining neuroscienceapproaches—are also appropriate.
The submission deadline is June 1st, 2011. The main text of each manuscript, exclusive offigures, tables, references, or appendixes, should not exceed 35 double-spaced pages (approximately7,500 words). Initial inquiries regarding the special section may be sent to Stephan Lewandowsky([email protected]), Tom Palmeri ([email protected]), orMichael Waldmann ([email protected]).
Papers should be submitted through the regular submission portal for JEP: LMC (http://www.apa.org/pubs/journals/xlm/submission.html) with a cover letter indicating that the paper is tobe considered for the special section. For instructions to authors and other detailed submissioninformation, see the journal Web site at http://www.apa.org/pubs/journals/xlm.
246 MCMURRAY AND JONGMAN