Embed Size (px)
Citation preview
Institut de Recerca en Economia Aplicada Regional i Pública Document de Treball 2011/07 pàg. 1 Research Institute of Applied Economics Working Paper 2011/07 pag .1
1
Institut de Recerca en Economia Aplicada Regional i Pública Document de Treball 2014/14, 28 pàg.Research Institute of Applied Economics Working Paper 2014/14, 28 pag.
“What hurts the dominant airlines at hub airports?”
Xavier Fageda
Institut de Recerca en Economia Aplicada Regional i Pública Document de Treball 2014/14, pàg. 2 Research Institute of Applied Economics Working Paper 2014/14, pag. 2
2
WEBSITE: www.ub.edu/irea/ • CONTACT: [email protected]
The Research Institute of Applied Economics (IREA) in Barcelona was founded in 2005, as a research institute in applied economics. Three consolidated research groups make up the institute: AQR, RISK and GiM, and a large number of members are involved in the Institute. IREA focuses on four priority lines of investigation: (i) the quantitative study of regional and urban economic activity and analysis of regional and local economic policies, (ii) study of public economic activity in markets, particularly in the fields of empirical evaluation of privatization, the regulation and competition in the markets of public services using state of industrial economy, (iii) risk analysis in finance and insurance, and (iv) the development of micro and macro econometrics applied for the analysis of economic activity, particularly for quantitative evaluation of public policies.
IREA Working Papers often represent preliminary work and are circulated to encourage discussion. Citation of such a paper should account for its provisional character. For that reason, IREA Working Papers may not be reproduced or distributed without the written consent of the author. A revised version may be available directly from the author.
Any opinions expressed here are those of the author(s) and not those of IREA. Research published in this series may include views on policy, but the institute itself takes no institutional policy positions.
Institut de Recerca en Economia Aplicada Regional i Pública Document de Treball 2014/14, pàg. 3 Research Institute of Applied Economics Working Paper 2014/14, pag. 3
3
Abstract
This paper estimates a frequency equation to explain the determinants of network airline service levels at their hub airports. Drawing on European data for 2002-2013, we find that network airlines reduce frequencies when the share of low-cost airlines increases both on the route and at the hub airport. On the contrary, frequency choices of network airlines are not affected by competition from low-cost airlines operating in nearby secondary airports. We also find some evidence that mergers in Europe may result in a re-organization of the route structure in favor of the hubs of the larger airline.
Keywords: hub airports, competition, network airlines, low-cost airlines.
Xavier Fageda: Department of Economic Policy, University of Barcelona. Av. Diagonal 690, 08034 Barcelona (Spain). Tel. +34934039721. Fax.+34934024573. E-mail: [email protected]
Institut de Recerca en Economia Aplicada Regional i Pública Document de Treball 2014/14, pàg. 4 Research Institute of Applied Economics Working Paper 2014/14, pag. 4
4 �
0. Introduction
Network airlines have increasingly concentrated their flights in a small number of airports that
they dominate and from which they operate their hub-and-spoke routes. By adopting this strategy
they are able to reduce their costs, through the exploitation of density economies, and they can
offer higher flight frequencies, which are highly valued by business and connecting passengers.1
While competition between network airlines operating at different hubs to attract connecting
passengers may be intense, at their own hub airports the airlines have typically benefited from a
rather weak competition with low-cost airlines.
However, in Europe, network airlines are increasingly concerned by the expansion of the
operations of low-cost carriers at their operating bases. For example, the current financial distress
being faced by Iberia and Alitalia is, in part, attributable to competition from low-cost airlines
operating in Madrid and Rome-FCO airports, respectively. KLM has been forced to operate with a
low-cost subsidiary on many routes out of Amsterdam, while the bankruptcy of Malev can be
explained in part by the success of low-cost airlines operating from Budapest. More generally, in
the period 2002-2013, the network airlines’ share has fallen in 17 of 22 large European airports
that have traditionally been dominated by former flag carriers (see details in Table 1).
A loss in the competitiveness of the dominant network airlines may have a markedly negative
impact on their respective hub airports. The dominance of the network airlines has benefitted the
airports and their corresponding urban areas in a number of ways. The traffic is higher than that
generated solely by local demand because a large proportion of passengers in hub airports are
connecting passengers.2 Furthermore, the geographical scope of non-stop destinations is especially
high at hub airports.3 In this regard, several studies have shown that air traffic services have a
strong influence on firms’ location choices (Brueckner, 2003; Green, 2007; Bel and Fageda, 2008;
Bilotkach, 2013).
However, airport dominance and high route concentration may lead to higher average air fares,
as has been well documented in the literature. Without intending to be exhaustive, this is a
conclusion reported in Borenstein (1989), Brander and Zhang (1990), Brueckner et al. (1992),
������������������������������������������������������������1 It is generally accepted that the route operations of airlines are subject to density economies (Brueckner and Spiller, 1994), and that airlines can attract more connecting passengers in a hub-and-spoke structure by increasing service frequency than by increasing aircraft size (Wei and Hansen, 2006).�2 Systematic data for the proportion of connecting passengers at Europe’s large airports are not readily available. However, Urban Audit data for 2007 provide the following figures for major hubs: London-LHR: 35%; Frankfurt-FRA: 54%; Amsterdam-AMS: 42%; Paris-CDG: 32%. 3 In Europe, only hub airports offer a significant number of non-stop flights to intercontinental destinations, and it is unlikely that low-cost airlines can replicate their business model in the long-haul sector (Francis et al., 2007).�
Institut de Recerca en Economia Aplicada Regional i Pública Document de Treball 2014/14, pàg. 5 Research Institute of Applied Economics Working Paper 2014/14, pag. 5
5 �
Evans and Kessides (1993), Oum et al. (1993), Marín (1995), Berry et al. (1996), Fisher and
Kamerschen (2003), Fageda (2006), Goolsbee and Syverson (2008) and Bilotkach and Lakew
(2014). Equally well documented is the downward pricing pressure that low-cost airlines exert on
the routes they operate. Studies that deal with the impact of low-cost airlines on price competition
include Dresner et al. (1996), Windle and Dresner (1999), Morrison (2001), Hofer et al. (2008)
and Oliveira and Huse (2009).
Overall, an airport may be dominated by airlines operating hub-and-spoke or point-to-point
networks and this may have advantages and disadvantages from a social point of view. Within this
context, the objective of this paper is not to examine the welfare implications of the entry of low-
cost airlines in hub airports. Our aim is to determine which dimensions of competition might
undermine the competitive position of dominant airlines at hub airports. In particular, we want to
examine whether network airlines must reduce frequencies at their hubs when they are competing
with low-cost airlines.
We estimate an equation in which the dependent variable is the frequencies offered by
European network airlines on routes departing from their hub airports, using data for the period
2002-2013. Specifically, we seek to address the question of whether competition takes place at the
route, airport and/or city-pair levels. Furthermore, we seek to disentangle whether what actually
matters is the overall degree of competition or the identity of the competitor (that is, network or
low-cost airlines). We identify the competitive position of each airline by the flight frequencies
they are able to provide on a given route. Flight frequency is typically considered the main
attribute of air service quality as it determines the schedule delay cost, i.e., the difference between
the desired and actual time of departure.
Our contribution is set in the context of the literature on airline frequency competition at the
route level, defining a route as the link between two airports. Previous studies examining the
determinants of airline frequencies have focused primarily on route competition (Schipper et al.,
2002; Richard, 2003; Pai, 2010; Bilotkach et al., 2010, 2013; Brueckner and Luo, 2013). Indeed,
these studies use as indicators of competition the route concentration index, the presence of low-
cost airlines on the route and whether the airport is a hub or not. We add to this literature by
examining the impact on frequencies of competition at the airport level using as additional
indicators of competition the airport concentration index and the share of low-cost carriers in the
airport. Furthermore, we also consider the impact of competition at the city-pair level by including
as explanatory variable of frequencies the number of flights offered by low-cost airlines from
Institut de Recerca en Economia Aplicada Regional i Pública Document de Treball 2014/14, pàg. 6 Research Institute of Applied Economics Working Paper 2014/14, pag. 6
6 �
secondary airports in the same city-pair market. Finally, we also provide evidence about the effect
of mergers on frequencies offered by the smaller airline in Europe.
Additionally, some studies have analyzed the impact of low-cost airlines on price and capacity
competition but less evidence has been found regarding their impact on service levels in hub-and-
spoke structures. An important difference with previous studies on airline competition is that we
put exclusively the attention on choices of network airlines at their hub airports.
In this regard, Goolsbee and Syverson (2008) examine the responses of incumbent US airlines
to the threat of entry of Southwest using a sample of routes between 59 airports that Southwest
ever flies any flights in 1993-2004. They define the threat of entry on a route in those cases where
Southwest is offering flights in both endpoint airports of the route but not on the route. They find
that incumbents reduce prices when Southwest threatens a route but this fare cuts are not
accompanied with an increase of frequencies or seats. Goolsbee and Syverson (2008) also
examine passenger traffic when Southwest threatens entry to metropolitan area’s secondary airport
and they did not find significant results. While the study of Goolsbee and Syverson (2008)
examined whether the mere presence of Southwest in both endpoints (or in a nearby airport) of the
route influence the behavior of the incumbent airline in the route, we examine the impact of a
higher share of low-cost airlines in the origin (hub) airports and the influence of the amount of
flights offered by low-cost airlines from secondary airports.
Another study that is closely related with this paper is to Bettini and Oliveira (2008). They
analyze the determinants of major carrier’s capacity in routes connecting the 30 biggest Brazilian
airports, including as explanatory variables a dummy for those routes in which Gol is offering
flights and a dummy for those routes that have as endpoint a city with two commercial airports.
They found positive effects of low-cost entry and negative effects of the variable for adjacent
airports on major carrier’s capacity. While the focus of the study of Bettini and Oliveira (2008) is
about the effects of a low-cost airline offering flights in the route or not and whether the city is
served by two commercial airports, we provide evidence on the effects of a higher share of low-
cost airlines in both the route and the origin airport and of the amount of flights offered by low-
cost airlines from secondary airports.
It should be stressed that most empirical studies of airline competition have been conducted for
the US market, for which data availability is much better. In this paper, however, we provide
evidence of competition between network and low-cost airlines for a large sample of European
airports. To this point, note that we also provide evidence of the impact of mergers on the hubs of
the smaller airline in Europe. In this regard, Bilotkach et al. (2013) show that the merger of Delta
Institut de Recerca en Economia Aplicada Regional i Pública Document de Treball 2014/14, pàg. 7 Research Institute of Applied Economics Working Paper 2014/14, pag. 7
7 �
and Northwest led to a re-organization of the route structure in favor of the hubs of the larger
airline.
The rest of this paper is organized as follows. In the next section, we explain the data used in
the empirical analysis and the criteria applied in building the sample and variables. Then, we
specify the empirical model and state our expectations for each explanatory variable. The
following section deals with various econometric issues and reports the regression results. The last
section contains our concluding remarks.
1. Data
The empirical analysis draws on route-level data from large airports in the European Union (as
well as Norway and Switzerland) and covers a period that extends from 2002 through 2013. We
include the large European airports at which the same airline was dominant throughout the period
of study and at which that dominant airline was not a low-cost carrier. Following these criteria,
our sample is based on the following airline-airport pairs: Air France (Paris-CDG, Paris-Orly), Air
Lingus (Dublin), Alitalia (Rome-FCO), Austrian Airlines (Vienna), British Airways (London-
LHR, London-LGW), Czech Airlines (Prague), Iberia (Madrid), Finnair (Helsinki), KLM
(Amsterdam), LOT (Warsaw), Lufthansa (Frankfurt, Munich, Dusseldorf), SAS (Stockholm-
ARN, Copenhagen, Oslo-OSL), SN Brussels (Brussels), Swiss (Zurich), TAP (Lisbon) and Tarom
(Bucharest).
A number of large European airports are not included in the analysis because we were unable to
identify one dominant airline operating out of them for the whole period. For example, the
bankruptcy of Malev in 2011 prevents us from including Budapest, while the de-hubbing of
Alitalia from Milan-MXP has meant that Alitalia has operated very few flights at this airport since
2011.4 Likewise, it has proved impossible to determine whether Olympic Airlines or Aegean was
the dominant airline in Athens, while Manchester has had a highly diversified pool of airlines
offering flights with no single company accounting for a share of more than 10 per cent, and
various airlines have been dominant in the period in Barcelona (Iberia, Clickair and Vueling).5
Other airports, such as Palma de Mallorca, Berlin-TXL and London (LTN, STN), are not included
because they are dominated by low-cost carriers.
������������������������������������������������������������4 Redondi et al. (2012) provide an aggregate analysis of the impact of the de-hubbing of European airports. �5 Castillo-Manzano et al. (2012a, 2012b) report that competition with low-cost airlines has had a substantial impact on the traffic moved by network airlines at Spain’s large airports. �
Institut de Recerca en Economia Aplicada Regional i Pública Document de Treball 2014/14, pàg. 8 Research Institute of Applied Economics Working Paper 2014/14, pag. 8
8 �
However, it should be pointed out that not all the airports included in our sample can be
unequivocally classified as hub airports throughout the whole period.6 Specifically, British
Airways has been progressively reducing its traffic at London-LGW, but it continues to account
for around 18 per cent of the total flights at this airport. According to data from the UK Civil
Aviation Authority, the share of connecting passengers at LGW is still higher than 10 per cent.
The exclusion of important European airports from our sample is a limitation but the aim of the
analysis we conduct is to determine the influence of different attributes of competition on the hub
operations of network airlines. In this regard, our restricted sample covers a very high proportion
of all hub operations undertaken by network airlines at Europe’s airports.
We have been able to collect complete data for 952 routes on which the airlines under
consideration provided an air service in all the years of the period studied (2002-2013). As such,
the analysis excludes information for thin routes. Overall, our sample contains 11,424
observations, although regressions are based on 10,472 observations because we use a one-year
lag of some of the explanatory variables.
Our data include intra-European routes as well as links to non-European destinations. However,
the collection of population and per capita GDP data is more homogeneous in the case of the intra-
European routes. For EU destinations, population and per capita GDP data refer to the NUTS 3
regions (the statistical unit used by Eurostat) and have been provided by Cambridge Econometrics
(European Regional Database publication). For non-EU destinations, population data refer to
metropolitan areas and the information has been drawn from various sources: the OECD, United
Nations (World Urbanization Prospects), World Bank and national statistics agencies. To
construct the per capita GDP variable for these non-European destinations, we use the country
classification by income groups developed by the World Bank. Thus, we construct an index in
which we distinguish between low income, lower middle income, upper middle income and high
income countries. As such, the regressions that consider all routes use the country index for the
per capita GDP variable, while the regressions that consider solely the intra-European routes use
the continuous variable at the NUTS 3 level. Note that population and per capita GDP data (the
latter when considered at the EU regional level) are only available up to 2011 and so we use the
data from 2011 to compute figures for 2012 and 2013 to complete the series.
Airline frequency data at the route and airport level have been obtained from RDC aviation
(Capstats statistics), while route distance data are taken from the Official Airline Guide (OAG).
������������������������������������������������������������6 By definition, hub airports are those airports in which a dominant network carrier exploits the transfer traffic through coordinated banks of arrivals and departures. �
Institut de Recerca en Economia Aplicada Regional i Pública Document de Treball 2014/14, pàg. 9 Research Institute of Applied Economics Working Paper 2014/14, pag. 9
9 �
We have aggregated supply data that contains information on the frequencies provided by the
airline on the route (from airport i to airport j). This is a major limitation of our data because we
are not able to make the distinction between passengers that fly to the hub airport as final
destination and connecting passengers. To this point, we would like to remark that the contribution
of this paper is set in the context of the literature of airline frequency competition at the route
level, defining a route as the link between two airports. This being said, results of our analysis
should be complemented with studies that use origin and destination data of passengers.
Note we use explanatory variables that distinguish between two types of airlines: 1) Network
airlines: Airlines integrated in international alliances (Oneworld, Star Alliance and SkyTeam)
and/or former flag carriers of the respective countries of the airports of origin in our sample, and
2) Non-network airlines: airlines that are not former flag carriers and which are not integrated in
alliances. Thus, our approach distinguishes between airlines that exploit connecting traffic at
European airports as an essential part of their business and airlines that focus their business on
point-to-point routes. By drawing this distinction, we are able to avoid the complex task of having
to draw up a list of low-cost carriers without comprehensive data regarding airline costs.
In the case of the European Union, former flag carriers can be considered to be network airlines
regardless of whether they are integrated in international alliances or not.7 Taking this into
account, most airlines not integrated in such alliances and which provide services on intra-
European routes concentrate their business on point-to-point routes. Some exceptions do exist,
especially on certain intercontinental routes where airlines such as Emirates or Air Transat offer
services, but their aggregated impact is modest. In any case, the criterion employed allows us to
distinguish between airlines that operate hub-and-spoke routes and those that operate point-to-
point routes, especially in the case of intra-European routes.
We also consider whether the dominant airline has been involved in a merger with a larger
company. In our sample, the airlines involved in such mergers are KLM (since 2005), Iberia (since
2012), Austrian Airlines (since 2010) and Swiss (since 2006). SN has signed a strategic
partnership deal with Lufthansa but the latter does not have a majority stake.
Finally, we include a variable that examines the influence of low-cost airlines operating from a
nearby secondary airport. Hence, we include a variable that identifies the number of flights offered
by low-cost airlines from an airport that is less than 100 kilometers from the city center of the
������������������������������������������������������������7 In our sample, Air Lingus left Oneworld in 2007, TAP and SN Brussels joined Star Alliance in 2005 and 2009 respectively, and Tarom joined SkyTeam in 2010. These airlines have generally operated strategic partnerships with other network airlines when they have not been members of alliances. In this regard, we made some regressions using a dummy variable for observations in which the dominant airline was not integrated in an alliance and the variable presented a high degree of non-statistical significance. �
Institut de Recerca en Economia Aplicada Regional i Pública Document de Treball 2014/14, pàg. 10 Research Institute of Applied Economics Working Paper 2014/14, pag. 10
10 �
airport of origin in our sample. We compute the frequencies offered by low-cost airlines in the
same city-pair market as that of the dominant airline in the airports in our sample. For example,
SN Brussels offers flights on the Brussels-Manchester route and Ryanair also provides a service to
Manchester from Brussels-Charleroi. In our sample, the secondary airports at which low cost
airlines enjoy a considerable presence are Baneasa, Charleroi, Skavasta, Beauvais, Stansted,
Luton, Ciampino, Weeze, Bratislava and Moss. Ryanair has currently a leading position in most of
them except in Baneasa and Luton where the leading airlines are Wizzair and Easyjet,
respectively.
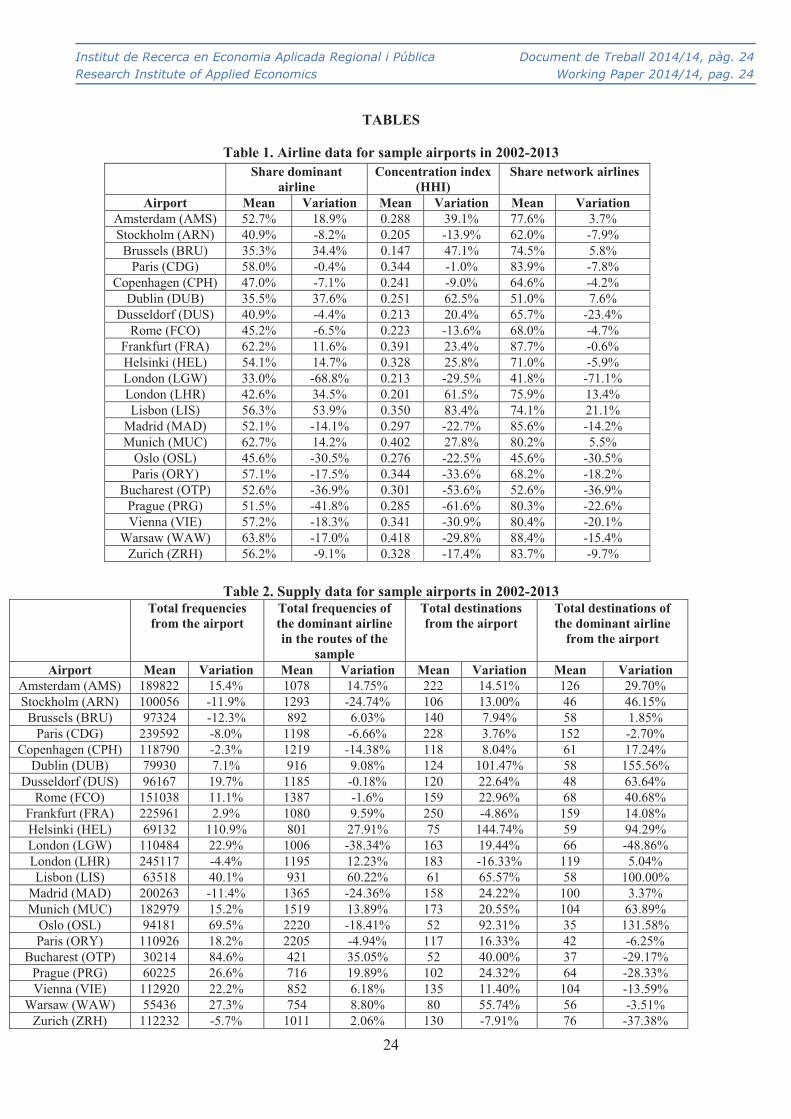
Table 1 reports data about the airline structure for the sample airports. The mean traffic share of
the dominant airline is in all circumstances higher than 30 per cent and in some cases as high as 60
per cent. Here, the dominance of the leading airlines at some airports has been strengthened while
in other it has weakened. In particular, the share of the dominant airline has been reduced in 14 of
the 22 airports making up our sample. The network airlines’ share is generally well above 50 per
cent, with the exceptions of Dublin, Oslo, London-LGW and Bucharest where low-cost airlines,
such as Ryanair, Norwegian, Easyjet and Wizzair, have a sizeable presence. This being said, the
network airlines’ share has fallen in most of the airports in the period of study – in fact, in 17 of
the 22 airports.
Table 2 shows supply data for the sample airports. In the period 2002-2013, the evolution in
total traffic is quite diverse with some airports recording substantial growth (for example,
Helsinki, Lisbon, Oslo and Bucharest), and others recording losses (for example, Stockholm,
Brussels and Madrid). Focusing on routes of our sample, the evolution of frequencies offered by
the dominant airline is also quite diverse. Some dominant airlines have substantially reduced the
mean number of flights offered in routes from their hub airports (airlines at Stockholm,
Copenhagen, London-Gatwick, Madrid or Oslo) while others have increased frequencies from
their hubs (for example, airlines at Amsterdam, Helsinki, Lisbon, Bucharest or Prague). Regarding
the total number of destinations offered from hub airports, only two of the largest hubs (London-
Heathrow and Frankfurt) and Zurich record some loses while dominant airlines in 8 of the 22
airports have reduced the number of non-stop destinations from their hub airports.
Overall, the airports considered here present great variation in the evolution of their traffic and
in the respective shares attributed to the different airlines operating out of them. Yet, what seems
clear is the trend towards an increase in the presence of airlines not integrated in an alliance in
many airports that were previously controlled by former flag carriers. This is quite remarkable if
we consider that our sample of airports excludes those that are the home base of a low-cost
Institut de Recerca en Economia Aplicada Regional i Pública Document de Treball 2014/14, pàg. 11 Research Institute of Applied Economics Working Paper 2014/14, pag. 11
11 �
airline.8 While it is not clear the aggregated effect of the increasing presence of non-network
airlines at European hub airports, they may have weakened the dominance of the former flag
carriers. In the following sections, we focus the attention on competition between network and
low-cost airlines operating from hub airports.
Insert Table 1 about here
Insert Table 2 about here
2. Empirical model
In this section, we implement a multivariate analysis to identify the determinants of the flight
frequencies offered by the dominant airlines at Europe’s large airports. We use similar control
variables to those employed in other empirical studies that estimate the determinants of
frequencies on air routes (see, for example, Schipper et al., 2002; Richard, 2003; Pai, 2010;
Bilotkach et al., 2010; Brueckner and Luo, 2013).9 Our specific contribution is to analyze the
impact of several variables of competition at the route, airport and city-pair levels. To this end, we
estimate the following equation using data for a large number of routes departing from our sample
of European airports:
Frequenciesdominant_airlinekt= � + �1Populationdestination
kt + �2Incomedestinationkt + �3Distancek + �4DEU
k + �5DUS_openskies
kt + �6Dinterhub_same_alliancekt + �7Hub_competitionkt + �8Dmerger
kt + + �9HHIroutekt +
�10Share_no-networkroutekt + �11HHIorigin_airport
kt + �12Share_no-networkorigin_airport
kt +
�13Frequenciessecondary_airportkt + �’Dorigin_airport
k + �'Dyear
t + �kt (1)
In this equation, the dependent variable is the total number of annual flights offered by the
dominant airline on route k in year t. As explanatory variables, we include variables that measure
the population and per capita income of the destination in order to control for demand. We expect
airlines to offer higher frequencies on routes that link richer and more populous cities.
We also take into account the influence of the route’s distance, calculated as the number of
kilometers flown to link the route’s endpoints. Airlines may prefer to use smaller planes at higher
frequencies on short-haul routes. Thus, we would expect a negative relationship between distance
and frequency as it has been found in Pai (2010) or Bilotkach et al. (2010).
Additionally, we include dummies for intra-European routes and routes to the United States for
the period after the EU-US open skies agreement was signed. Controlling for other factors,
demand on intra-European routes might be higher as a result of the greater degree of integration of
������������������������������������������������������������8 Ryanair has recently announced plans to expand its operations in Brussels-BRU and Rome-FCO, so this trend seems set to be reinforced in forthcoming years.�9 Other empirical studies of competition in frequencies include Borenstein and Netz (1999) and Salvanes et al. (2005). �
Institut de Recerca en Economia Aplicada Regional i Pública Document de Treball 2014/14, pàg. 12 Research Institute of Applied Economics Working Paper 2014/14, pag. 12
12 �
EU members and the fact that the EU market is a liberalized market. By contrast, former European
flag carriers may encounter more competition in the EU-US market following the open skies
agreement, while the supply of flights may have diversified with the introduction of new airlines
and airports. Thus, we expect a positive sign for the coefficient associated with the intra-EU route
variable and a negative sign for the variable capturing US destinations after the introduction of the
open skies agreement.
Unfortunately, our data only provide information of the airline that is effectively operating the
flight so that we do not know whether other airlines are involved in the route through code-share
agreements. Taking this into account, we include a variable that may work as a proxy for the
effects of code-share agreements. Indeed, we include a dummy that takes the value one for those
routes that connects two hubs of airlines integrated in the same alliance.10
While code-share agreements may be set between airlines in different scenarios, one of the
main areas of coordination of airlines integrated in an alliance has to do with the code-share
agreements. Hence, it is sensible to argue that the likelihood that the dominant airline has code-
share agreements with other airlines at its hubs is higher in those routes that that have the hub of
another airline in the same alliance as destination. We expect a negative sign for the coefficient
associated with this variable because additional flights in the route may be offered by code-share
partners of the dominant airline.
As we mention above, a limitation of our data is that we just have aggregated supply
information on the frequencies provided by the airline on the route. Taking into account the
limitations of our data, we include a variable that may capture part of the effect of inter-hub
competition on the frequencies offered by the dominant airline in the corresponding route. This
variable is constructed as the number of airports in the sample that have direct flights to the route’s
destination in the considered year. It is not clear the expected sign for the coefficient associated
with this variable. One the one hand, more airports serving the destination of the route may have a
negative effect on frequencies of the dominant airline in its hub due to stronger competition
coming from network airlines in other hubs. On the other hand, more airports serving the
destination could be indicating higher demand of flights to such destination which is not captured
by the other explanatory variables.
Furthermore, we consider a dummy variable that takes a value of one for routes and periods in
which the dominant airline at the airport was acquired by another larger airline. Following the
������������������������������������������������������������10 We do not compute the value one in those routes that connect hubs of the same airline. For example, the dominant airline in both endpoints of the route Stockholm-Copenhagen is SAS so that here the code-share agreements should not be relevant.
Institut de Recerca en Economia Aplicada Regional i Pública Document de Treball 2014/14, pàg. 13 Research Institute of Applied Economics Working Paper 2014/14, pag. 13
13 �
merger, a reorganization of the route network might have been implemented in favor of the
airports of the larger airline (Bilotkach et al., 2013). Hence, we expect a negative sign for the
coefficient associated with this variable.
The main focus of our analysis is on the competition variables. An important difference with
previous studies on airline competition is that we put exclusively the attention on choices of
network airlines at their hub airports. Under hub-and-spoke structures, the service levels of airlines
in the route will depend on the amount of traffic related with direct and connecting passengers.
Taking this into account, we include the following variables as indicators of competition at the
route, airport and city-pair level.
We include two variables that seek to capture competition at the route level. First, we consider
the route concentration, measured using the Herfindahl-Hirschman index, in terms of flight
frequencies. In addition to route concentration, we consider a variable that identifies the share of
non-network airlines on the route. The expected sign of the coefficient associated with these
variables is not a priori clear
A typical strategy of an incumbent airline against the entry of rivals in a route is to cut fares
and add flights to boost demand. Hence, we could expect a negative relationship between
frequencies and route concentration as it has been found in Bilotkach et al. (2010, 2013) and a
positive effect of entry of a low-cost airline in a route as it has been found in Bettini and Oliveira
(2008). Indeed, incumbents may compensate a loss in demand with proper pricing tactics.
Goolsbee and Syverson (2008), for example, do not find any negative demand effect on legacy
carriers due to the entry of Southwest Airlines in the US market.
However, the entry of low-cost carriers in our context may also have negative effects on
frequencies of network airlines in a route. While a network airline operate under a hub-and-spoke
structure, low-cost airlines operate under a point-to-point structure. Hence, network airlines are
likely competing with low-cost airlines with different cost structures and different quality
standards so that they could have to set higher prices. Thus, the entry of a low-cost airline in a
route may imply less demand coming from direct passengers and a possible reaction of the
incumbent airline to lower direct traffic is to reduce frequencies.
We include two additional variables as explanatory factors: the Herfindahl-Hirschman index in
terms of airline frequencies at the airport level, and the share that non-network airlines have at the
airport. The expected sign of the coefficient associated with these variables is not a priori clear.
As we have explained above, network airlines at their hubs can react by increasing or
decreasing frequencies when route competition is more intense. The variation in frequencies
Institut de Recerca en Economia Aplicada Regional i Pública Document de Treball 2014/14, pàg. 14 Research Institute of Applied Economics Working Paper 2014/14, pag. 14
14 �
offered by the hubbing airline in one route may affect other routes departing from the same hub
airport because the change in waiting times in the connecting flights may affect demand of
connecting passengers. Hence, competition at the airport level may have an effect on route
frequency choices of the dominant airline.
Note that competition between airlines integrated in the same alliance may be weak (in fact,
they usually operate code-share agreements) and other airlines (other than the dominant one)
operating hub-and-spoke networks frequently use the airport under consideration to feed their
hubs. In such circumstances, frequencies of the dominant airline may be especially affected by
competing airlines that operate point-to-point routes, because these airlines are more likely to be
disputing the passengers with final destination at the airport under consideration by means of
aggressive offers.
Furthermore, we include a variable that identifies the number of flights offered by low-cost
airlines in the same city-pair market from a nearby secondary airport. Again, the expected sign of
the coefficient associated with this variable is not a priori clear. The network airline could react to
the entry of low-cost airlines in the same city-pair market by cutting fares and increasing
frequencies. However, demand of the dominant airline at the large airport could be substantially
affected by competition from low-cost airlines operating at the nearby airport. Note that it might
also be the case that city-pair markets that are connected via different airports are particularly
dense corridors whose demand is not fully controlled by our explanatory variables. Finally, it
should be also taken into account that most of airports in our sample are slot-constrained airports
so that network carriers could not be able to change frequencies in reaction to low-cost airlines
entry in secondary airports because they would lose slots.
Finally, we include dummies for the airports of origin and year and �kt is a mean-zero random
error term. The airport dummies control for time-invariant airport-specific omitted variables,
while the year dummies control for the common trend on all routes in the dataset. Specifically,
airport and time fixed effects may help to control for relevant factors for which, unfortunately, we
have no available data. Indeed, one potential omitted variable in our empirical model is airport
congestion. This being said, the use of airport dummies may help in controlling its effect because
some airports are systematically more congested than others, and the use of year dummies may
also be helpful because the relevance of congestion is higher in boom periods. However, we must
recognize that a potential limitation of our analysis is that we are not able to control explicitly for
airport congestion.
Institut de Recerca en Economia Aplicada Regional i Pública Document de Treball 2014/14, pàg. 15 Research Institute of Applied Economics Working Paper 2014/14, pag. 15
15 �
3. Estimation and results
In this section, we deal with a number of econometric issues and discuss the results of the
regressions. The estimates may present non-stationarity and temporal autocorrelation problems.
We apply the Wooldridge test for autocorrelation in panel data. Under the null hypothesis of no
first-order autocorrelation, the residuals from the regression of the first-differenced variables
should have an autocorrelation of -0.5. This implies that the coefficient on the lagged residuals in
a regression of the lagged residuals on the current residuals should be -0.5 (see Wooldridge, 2002
for further details). The Wooldridge test shows that we may have a problem of serial
autocorrelation, which must be addressed. We also apply the panel unit root test developed by
Levin et al. (2002), which can be regarded as an augmented Dickey-Fuller (ADF) test when lags
are included with the null hypothesis of nonstationarity I(1) behavior. This test with one lag
indicates that there is no non-stationarity problem with our dependent variable.
We perform the estimation using two different techniques that take advantage of the panel
nature of our data: the route fixed and random effects models. The use of any of the two models
allows us to consider unobserved route heterogeneity.
An advantage of the fixed effects model is that it allows us to control for any omitted variables
that correlate with the variables of interest and which do not change over time. As such, the fixed
effects model is more reliable than other estimation techniques. A shortcoming of the fixed effects
model is that it may be less informative than other techniques because the effect of time-invariant
variables cannot be identified. Indeed, the random effects model has the advantage that it may
capture both the between and the within variation of the data while the fixed effect model only
captures the within variation of the data. However, a disadvantage of the random effects model is
related with the potential bias derived from the correlation between the explanatory variables and
the random effects.
The Hausman test shows the existence of substantial differences between the random and the
fixed effects. An important reason why the two estimators could be different is the existence of
correlation between the explanatory variables and the random effects, although other sorts of
misspecification may also read to rejection (Verbeek, 2000). For example, the fixed effects
estimator may be particularly imprecise when several explanatory variables are rarely changing or
not changing at all. In this regard, some studies have applied Monte Carlo simulations to show that
the Hausman test may be misleading when the variables used in the empirical analysis have a low
within variation (Clark and Linzer, 2012; Troeger, 2008).
Institut de Recerca en Economia Aplicada Regional i Pública Document de Treball 2014/14, pàg. 16 Research Institute of Applied Economics Working Paper 2014/14, pag. 16
16 �
In our model, many explanatory variables are either time-invariant or have a low within-
variation. However, the results of the Hausman test do not allow us to be confident with the
random effects model. Hence, what we have opted to do is to present the results using both the
random and fixed effects models assuming an AR(1) process in the error term and standard errors
robust to heteroscedasticity.
Airlines do not change flight frequency very frequently and therefore current shocks in
capacity allocation could be expected to be passed to the future observations. Hence, we could
consider including the lagged dependent variable as a regressor. To this point, note that several
previous studies like the one of Bettini and Oliveira (2008) uses quarterly data, while we use
annual data. This may help to overcome the potential inertia in frequency data. In our context, the
use of a dynamic model would require us to first differentiate all variables due to the presence of
autocorrelation in the residuals and the fact that we have a large number of cross-sections in
relation to the time periods. We have experimented with dynamic regressions and almost all
explanatory variables are not statistically significant. This may be a consequence of the low
within-variation (or not variation at all) of many explanatory variables
An additional issue that must be addressed is the potential endogeneity of the concentration
variables. To deal with this, we include a one-year lag of the concentration variables as
explanatory variables. It is difficult to make a case for the correlation between lagged
concentration and current unobserved shocks. We also experimented with additional lags of these
variables and the results are not affected. In order to simplify the presentation of our results, we
only report the results of regressions with a one-year lag of the concentration variables.11
We make the estimation using all the observations and for the different subsamples.
Specifically, we distinguish between intra-EU routes and routes that link the airports of origin in
our sample with non-EU destinations. Population and per capita income data are richer in the case
of the intra-European routes and the distinction between network and non-network airlines
operating on the route is clearer in the case of the intra-EU routes. Furthermore, we may find a
high variability in the regulatory regimes of routes with non-EU destinations.
In the case of intra-EU routes, we report results of an additional regression in which we exclude
those routes with presence of low-cost subsidiaries of the dominant airline. The presence of low-
������������������������������������������������������������11 All variables of competition could be exposed to an endogeneity bias in case that we were not able to capture appropriately the intensity of competition that low-cost airlines exert from secondary airports. In this regard, the variable of number of flights offered by low-cost airlines from secondary airports should help in mitigating such potential bias in our regressions.
Institut de Recerca en Economia Aplicada Regional i Pública Document de Treball 2014/14, pàg. 17 Research Institute of Applied Economics Working Paper 2014/14, pag. 17
17 �
cost subsidiaries in a route may distort our competition analysis.12 We also distinguish between
short-haul and long-haul routes. Thus, we estimate our equation for routes shorter and longer than
the mean distance for intra-EU routes, which is about 900 kilometers.
In short, we make the estimation using these samples: 1) all routes, 2) all intra-EU routes, 3)
intra-EU routes excluding routes with presence of low-cost subsidiaries of the dominant airline, 4)
intra-EU routes of less than 900 kilometers, 5) intra-EU routes of more than 900 kilometers.
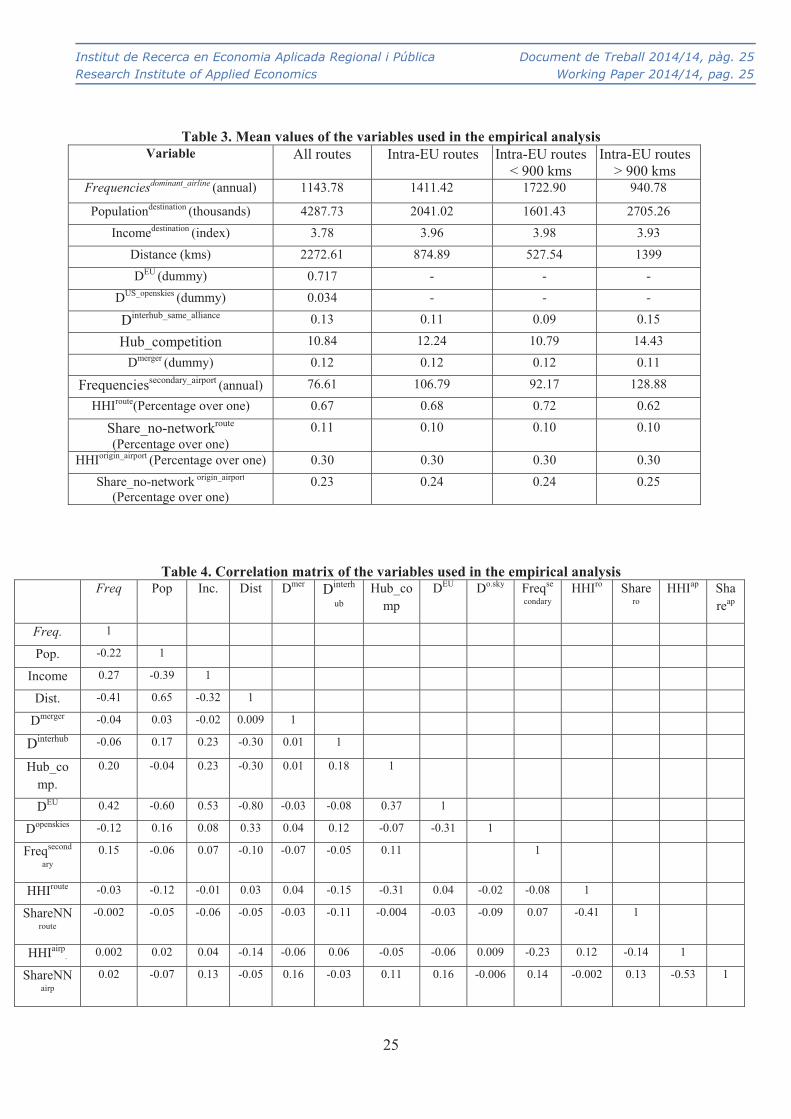
Table 3 shows the descriptive statistics of the variables used in the empirical analysis, while
Table 4 presents the correlation matrix of these variables. It can be seen that all the variables
present sufficient variability, as the standard deviation is high in relation to the mean values. In the
case of the correlation matrix, it is notable that the correlation between the concentration variables
and those that reflect the presence of non-network competitors is sufficiently low for us to be able
to identify the specific effects of each variable.
Insert table 3 about here
Insert table 4 about here
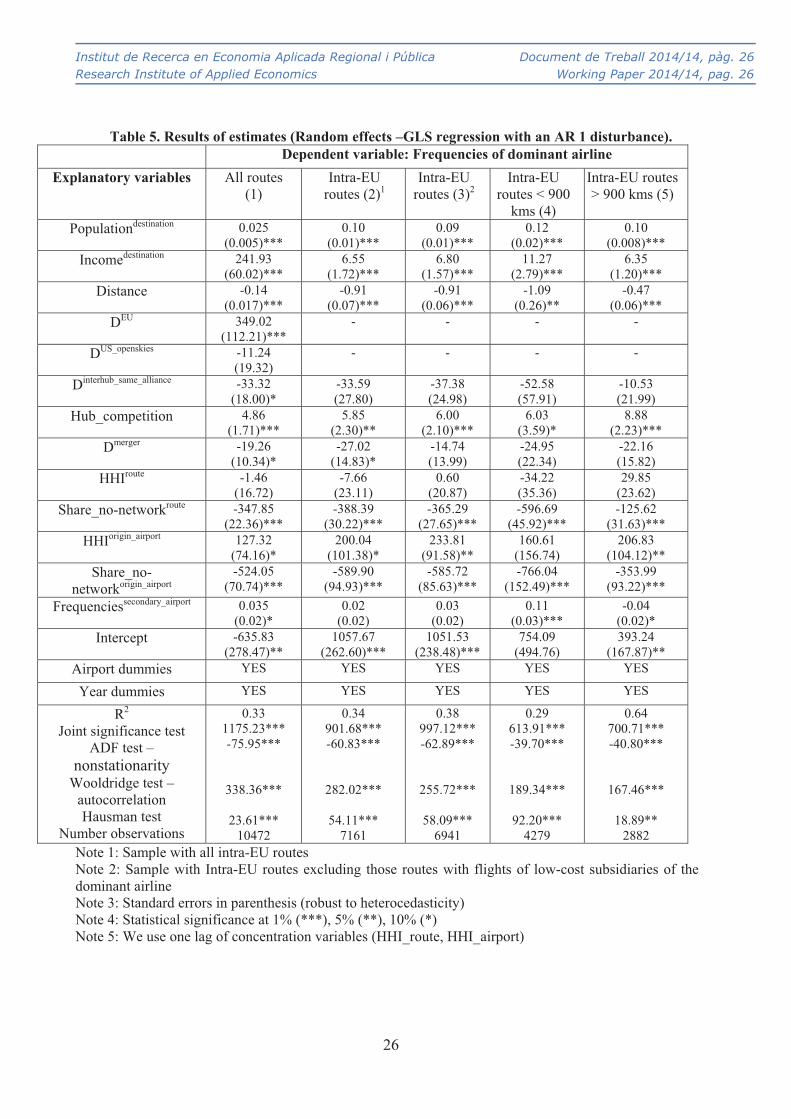
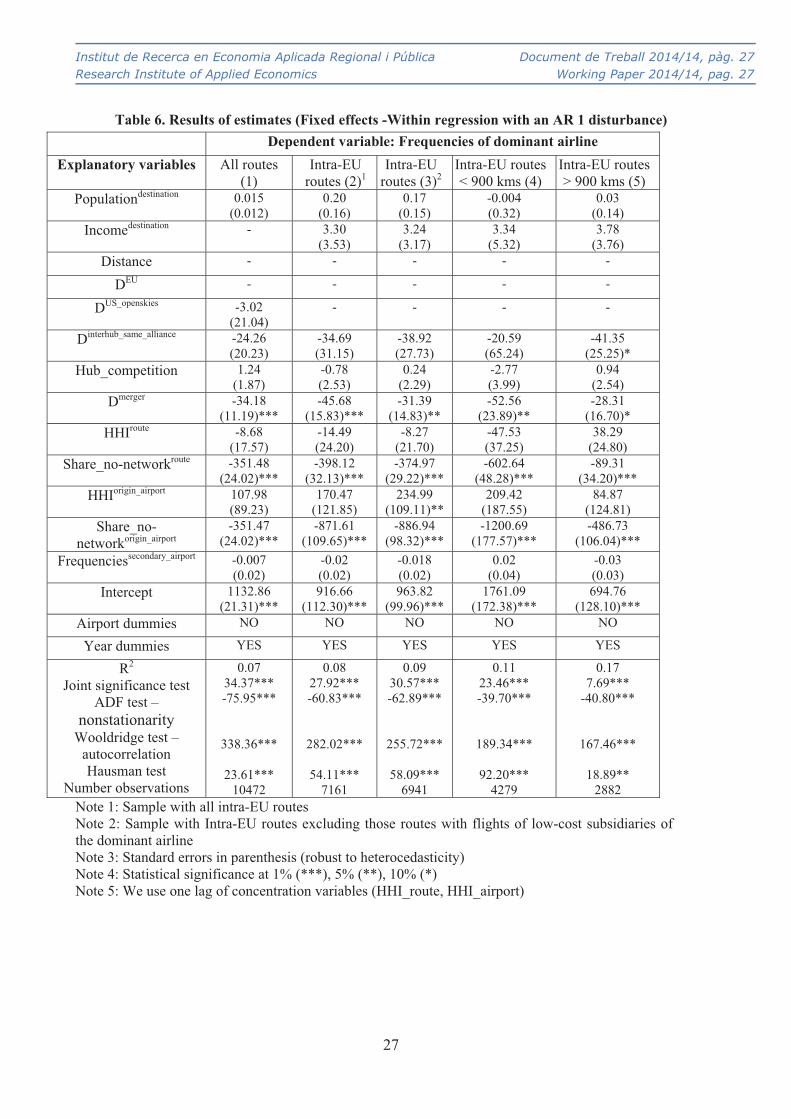
Tables 5 and 6 show the results of the estimates when using the random and fixed effects
model, respectively. As explained above, the fixed effects model is not able to capture the effect of
time-invariant variables and the within-variation of several explanatory variables is low. This
explains why the overall explanatory power of the model is considerably higher in the regressions
that use random effects and why more explanatory variables are statistically significant with the
use of random effects.
Insert table 5 about here
Insert table 6 about here
In the regressions that use the random effects model, the control variables, in general, work as
expected. The frequencies of the dominant airline are higher when the route links more populous
and richer endpoints. The fixed effects model does not seem to capture the impact of these control
variables as it concentrates on the within-variation of data. Furthermore, we find a negative
relationship between frequencies and distance in the regressions that can be identified.
The coefficient associated with the dummy variable for intra-EU routes is positive and
statistically significant in the regressions that can be identified. As expected, frequencies on intra-
������������������������������������������������������������12 Several low-cost subsidiaries of network carriers have their main base in airports away from the main hubs of the dominant airline as it is the case of Germanwings with the main base in Cologne, Vueling/Clickair with the main base in Barcelona or Air One which is mainly placed in tourist Italian destinations. However, some observations are affected by the presence of low-cost subsidiaries of the dominant airline, particularly several routes from Amsterdam, Madrid and Munich with presence of Transavia, Vueling and Germanwings, respectively. �
Institut de Recerca en Economia Aplicada Regional i Pública Document de Treball 2014/14, pàg. 18 Research Institute of Applied Economics Working Paper 2014/14, pag. 18
18 �
EU routes are higher due to greater demand in a geographical area characterized by no regulatory
restrictions and strong economic integration. Interestingly, the frequencies of the dominant airline
have fallen after the open skies agreement was introduced on routes to US destinations, but the
effect is not statistically significant. Overall, it is not clear from our results that former European
flag-carriers have been exposed to more intense competition in the EU-US market after the open
skies agreement came into force.
The coefficient associated with the dummy variable for routes that connect two hubs of airlines
integrated in the same alliance is negative in all regressions but it is generally not statistically
significant. Thus, we found no clear differences between routes more or less likely to be affected
by code-share agreements. The coefficient associated with the variable for hub competition is
positive and statistically significant in the random effects regressions but not statistically
significant and with different sign in the fixed effects regressions. Hence, we cannot reach
definitive conclusions regarding this variable.
We also find that the frequencies of dominant airlines are lower in the period following their
merger with a larger airline. The coefficient associated with this variable is always negative
(although it is more clearly significant in the regressions that use the fixed effects model). Overall,
we find some evidence for Europe that mergers may imply a re-organization of the route structure
in favor of the hubs of the larger airline (see Bilotkach et al., 2013, for an analysis with similar
results for the US airline market).
At the route level, the coefficient of the route concentration variable is not statistically
significant in any regression. On the contrary, the coefficient associated with the variable for share
of non-network competitors is negative and statistically significant at the 1% level in all the
regressions. This is in contrast with the results in Bilotkach et al. (2010, 2013) that find a negative
relationship between frequencies and route concentration and they also differ with results of
Bettini and Oliveira (2008) that found a positive effect on incumbent’s capacity of entry of a low-
cost airline in a route. Recall that an important difference with previous studies is that we put
exclusively the attention on choices of network airlines at their hub airports.
At the airport level, the coefficient of the variable of airport concentration is positive in all the
regressions. However, the statistical significance varies depending on the regression. It is
generally not statistically significant in the regressions that use fixed effects and it is generally
statistically significant at the 5% or 10% level in the regressions that use the random effects
model. Notably, the coefficient associated with the variable of the share of non-network airlines at
European airports is negative and statistically significant at the 1% level in all the regressions.
Institut de Recerca en Economia Aplicada Regional i Pública Document de Treball 2014/14, pàg. 19 Research Institute of Applied Economics Working Paper 2014/14, pag. 19
19 �
Overall, the picture is quite clear and the outcomes are similar in the random and fixed effects
regressions. The impact of the variables for non-network competitors is stronger than that of the
concentration variables. This is true when we look at both route and airport indicators of
competition.
Dominant airlines reduce frequencies in routes departing from their hubs when the share of
low-cost airlines in those routes is higher. In our sample, network airlines at their hubs do not
seem to follow the strategy of cutting fares and increase frequencies against the entry of low-cost
airlines. The reduction in frequencies by dominant airlines may be a consequence of lower
demand coming from direct passengers.
Furthermore, dominant airlines reduce frequencies in routes departing from their hubs when the
share of low-cost airlines in those hubs is higher. Results for the variable of share of non-network
carriers in the route suggest that the dominant airline may receive less demand from direct
passengers on those routes that suffer the rivalry of low-cost airlines, which may reduce the flight
frequency offered. Lower frequencies by the dominant airline on some routes may have indirect
effects on other routes because the demand from connecting passengers may be lower as a result
of less competitive connections; the coordination of banks of arrivals and departures could be
poorer with increased connecting times when the dominant airline reduces frequencies in some
routes.
To this point, recall that a major limitation of our data is that we are not able to make the
distinction between passengers that fly to the hub airport as final destination and connecting
passengers. While we consider that results that we find for the variable of share of non-network
airlines in the hub airports has to do with demand of connecting passengers, our analysis should be
complemented with empirical exercises using origin and destination data of passengers.
We do not find evidence that competition from low-cost airlines operating out of secondary
airports has a clear impact on frequencies of dominant airlines considered here.13 The coefficient
associated with the variable of frequencies of low-cost airlines in nearby secondary airports is
generally positive in the regressions that use the random effects model and generally negative in
the regressions that use the fixed effects model. This being said, it is not statistically significant in
all the regressions that use fixed effects and it is not statistically significant in the regressions that
use random effects for EU routes that not differentiate by route distance. Hence, results of our
analysis for the variable of secondary airports are similar to those obtained by Goolsbee and
Syverson (2008) while they differ from results obtained by Bettini and Oliveira (2008). ������������������������������������������������������������13 In a similar vein, Pels et al. (2009) find low cross-price elasticities in an analysis that examines competition between low-cost and network airlines in the multi-airport area of London.�
Institut de Recerca en Economia Aplicada Regional i Pública Document de Treball 2014/14, pàg. 20 Research Institute of Applied Economics Working Paper 2014/14, pag. 20
20 �
Note that Ryanair is the airline that typically operates in secondary nearby facilities of hub
airports. It could be that Ryanair and former flag carriers attract different types of passenger, so
that the leading low-cost airline in Europe is in fact fighting for more price-sensitive passengers.
Furthermore, most of airports in our sample are slot-constrained airports so that network carriers
may not be willing to change frequencies in reaction to low-cost airlines entry in secondary
airports because they would lose slots.
Overall, our empirical analysis indicates that dominant airlines may be worried by the increased
presence of non-network airlines at their hub airports but they should not be concerned by an
expansion of operations of low-cost airlines in secondary nearby airports. Critically, the negative
effects suffered by dominant airlines as a result of the stronger presence of non-network airlines at
their operating bases are not only felt on the routes on which they compete directly with each
other, but also on other routes that may suffer a reduction in demand from connecting passengers.
4. Concluding remarks
The main contribution of this paper has been to show that network airlines at their hubs reduce
frequencies when the share of low-cost airlines increases both on the route and at the hub airport.
On the contrary, frequency choices of network airlines at their hubs do not seem to be affected by
competition from low-cost airlines operating in nearby secondary airports. We also find some
evidence that mergers in Europe may result in a re-organization of the route structure in favor of
the hubs of the larger airline.
Moreover, the impact of the variables for non-network competitors is stronger than that of the
concentration variables. When we look at frequencies offered from dominant airlines at their hub
airports, competition between network and low-cost airlines may be intense but our analysis
suggest that competition between airlines in alliances seems to be relatively weak. Further analysis
should disentangle the effect derived from airlines that are integrated in the same alliance as that
of the hubbing airline from that derived from airlines in a different alliance.
A major limitation of our data is that we are not able to make the distinction between
passengers that fly to the hub airport as final destination and connecting passengers. Hence, our
analysis should be complemented with empirical studies using origin and destination data of
passengers. Another potential limitation of our analysis is that we are not able to control explicitly
for airport congestion. Further research could investigate the implications of flight delays in the
competition between network and low-cost airlines.
Institut de Recerca en Economia Aplicada Regional i Pública Document de Treball 2014/14, pàg. 21 Research Institute of Applied Economics Working Paper 2014/14, pag. 21
21 �
From our analysis, it seems clear that the increasing presence of low-cost airlines in European
hub airports has negative consequences for the network airlines that have traditionally dominated
those hubs. However, this does not mean that the levels of service at the hub airport are worse
when the share of low-cost airlines increases. In fact, it may be that there is only sufficient traffic
to support a certain number of hub airports and network carriers. The US market has seen a
reduction in the number of hubs and the number of network carriers over the last years. Europe
has a large number of hubs and network carriers in a relatively limited geographic area, and this
may not be a viable equilibrium in a more competitive environment.
References
Bel, G., Fageda, X. (2008). Getting there fast: Globalization, intercontinental flights and location of headquarters. Journal of Economic Geography 8(4), 471-495.
Berry, S., Carnall, M., Spiller, P.T. (1996). Airline Hubs: Costs, Markups and the Implications of Customer Heterogeneity. NBER Working Paper, 5561, 1-38.
Bilotkach, V. (2013). Are Airports Engines of Economic Development? A Dynamic Panel Data Approach. ‘Unpublished results’.
Bilotkach, V., Fageda, X., Flores-Fillol, R. (2013). Airline Consolidation and the Distribution of Traffic between Primary and Secondary Hubs. Regional Science and Urban Economics 43 (6), 951-963.
Bilotkach, V., Fageda, X., Flores-Fillol, R. (2010). Scheduled service versus personal transportation: The role of distance, Regional Science and Urban Economics 40 (1), 60-72.
Bilotkach, V., Lakew, P.A (2014). On sources of market power in the airline industry: Panel data evidence from the US airports. Transportation Research-A, 59 (1), 288 – 305.
Borenstein, S. (1989). Hubs and High Fares: Dominance and Market Power in the US Airline Industry. RAND Journal of Economics 20 (3), 344-65.
Borenstein, S., Netz, J. (1999). Why do all the flights leave at 8.am?: Competition and departure time differentiation in airline markets. International Journal of Industrial Organization, 17 (5), 611-640.
Brander, J.A., Zhang, A. (1990). A Market Conduct in the Airline Industry: An Empirical Investigation. The Rand Journal of Economics 21 (4), 567-583.
Brueckner, J.K. (2003). Airline traffic and urban economic development. Urban Studies 40 (8), 1455-1469.
Brueckner, J.K, Luo. D. (2013). Measuring Firm Strategic Interaction in Product-Quality Choices: The Case of Airline Flight Frequency. Economics of Transportation, 2(4), 95-108.
Brueckner, J.K., Spiller, P.T. (1994). Economies of traffic density in the deregulated airline industry. Journal of Law and Economics 37 (2), 379-415.
Brueckner, J.K., Dyer, N.J, Spiller, P.T. (1992). Fare Determination in Airline Hub-and-Spoke Networks. The RAND Journal of Economics 23 (3), 309-333.
Institut de Recerca en Economia Aplicada Regional i Pública Document de Treball 2014/14, pàg. 22 Research Institute of Applied Economics Working Paper 2014/14, pag. 22
22 �
Castillo-Manzano, J.I, López-Valpuesta, L., Pedregal, D.J. (2012a) What role will hubs play in the LCC point-to-point connections era? The Spanish experience. Journal of Transport Geography 24 (1), 262–270.
Castillo-Manzano, J.I., López-Valpuesta, L., Pedregal, D.J. (2012b). How can the effects of the introduction of a new airline on a national airline network be measured? A time series approach for the Ryanair case in Spain. Journal of Transport Economics and Policy 46 (2), 263–279.
Clark, T.S., Linzer, D.A. (2012). Should I Use Fixed or Random Effects?. “Unpublished results”. Dresner, M., Lin, J.S. C., Windle, R. (1996). The impact of low-cost carriers on airport and route
competition. Journal of Transport Economics and Policy 30 (2), 309-329. Fageda, X. (2006). Measuring conduct and cost parameters in the Spanish airline market. Review
of Industrial Organization, 28 (4), 379-399. Fisher, T., Kamerschen, D.R. (2003). Price-Cost Margins in the U.S Airline Industry using a
Conjectural Variation Approach. Journal of Transport Economics and Policy 37 (2), 227-259. Francis, G., Dennis, N., Ison, S., Humphreys, I. (2007). The transferability of the low-cost model
to long-haul airline operations. Tourism Management 28(2), 391-398. Goldsbee, A., Syverson, C. (2008). How do incumbents respond to the threat of entry? Evidence
from the major airlines. The Quarterly Journal of Economics 123(4), 1611-1633. Green, R.K. (2007). Airports and Economic Development, Real Estate Economics 35(1), 91–112. Hofer, C., Windle, R. J., Dresner, M. E. (2008). Price premiums and low cost carrier competition.
Transportation Research -Part E 44 (5), 864-882. Levin, A., Lin, C.F, Chia-Shang, J.C. (2002). Unit Root Tests in Panel Data: Asymptotic and
Finite Sample Properties. Journal of Econometrics, 108 (1), 1-24. Marín, P.L. (1995). Competition in European Aviation: Pricing Policy and Market Structure.
Journal of Industrial Economics 16 (2), 141-159. Morrison, S.A (2001). Actual, Adjacent and potential competition: Estimating the full effect of
Southwest airlines. Journal of Transport Economics and Policy 35 (2), 239-256.Oliveira, A.V.M, Huse, C. (2009). Localized competitive advantage and price reactions to entry:
Full-service vs. low-cost airlines in recently liberalized emerging markets. Transportation Research Part-E 45 (2), 307–320.
Oum, TH., Zhang, A., Zhang, Y. (1993). Inter-firm Rivalry and Firm-Specific Price Elasticities in Deregulated Airline Markets. Journal of Transports Economic and Policy 27 (2), 171-192.
Pai, V., 2010. On the factors that affect airline flight frequency and aircraft size. Journal of Air Transport Management 16 (4), 169-177.
Pels, E., Njegovan, N., Behrens, C. (2009). Low-cost airlines and airport competition. Transportation Research-E 45 (2), 335–344.
Redondi, R., P. Malighetti, Paleari, S. (2012). De-hubbing of airports and their recovery patterns. Journal of Air Transport Management 18 (1), 1-4.
Richard, O. (2003). Flight frequency and mergers in airline markets. International Journal of Industrial Organization 21 (6), 907–922
Salvanes, K.G., Steen, F., Sorgard, L. (2005). Hotelling in the air? Flight departures in Norway. Regional Science and Urban Economics 35 (2), 193-213.
Schipper, Y., P. Rietveld, Nijkamp, P. (2002). European airline reform: an empirical welfare analysis. Journal of Transport Economics and Policy 36 (2), 189-209.
Troeger, V. (2008). Problematic Choices: Testing for Correlated Unit Specific Effects in Panel Data. “Unpublished results”.

Institut de Recerca en Economia Aplicada Regional i Pública Document de Treball 2014/14, pàg. 23 Research Institute of Applied Economics Working Paper 2014/14, pag. 23
23 �
Urban Audit (2008). Connecting passengers at selected European airports 2007. London First report ‘Imagine a world class Heathrow’, Urban Audit.
Wei, W., Hansen, M (2006). An aggregate demand model for air passenger traffic in the hub-and-spoke network. Transportation Research Part-A 40 (10), 841–851.
Windle, R., Dresner, M. (1999). Competitive responses to low cost carrier entry. Transportation Research-E 35(1), 59-75.
Verbeek, M. (2000). A guide to modern econometrics. West Sussex; John Wiley and Sons. Wooldridge, J. M. (2002). Econometric Analysis of Cross Section and Panel Data. Cambridge,
MA: MIT Press. �
Institut de Recerca en Economia Aplicada Regional i Pública Document de Treball 2014/14, pàg. 24 Research Institute of Applied Economics Working Paper 2014/14, pag. 24
24 �
TABLES
Table 1. Airline data for sample airports in 2002-2013 Share dominant
airline Concentration index
(HHI) Share network airlines
Airport Mean Variation Mean Variation Mean Variation Amsterdam (AMS) 52.7% 18.9% 0.288 39.1% 77.6% 3.7% Stockholm (ARN) 40.9% -8.2% 0.205 -13.9% 62.0% -7.9%
Brussels (BRU) 35.3% 34.4% 0.147 47.1% 74.5% 5.8% Paris (CDG) 58.0% -0.4% 0.344 -1.0% 83.9% -7.8%
Copenhagen (CPH) 47.0% -7.1% 0.241 -9.0% 64.6% -4.2% Dublin (DUB) 35.5% 37.6% 0.251 62.5% 51.0% 7.6%
Dusseldorf (DUS) 40.9% -4.4% 0.213 20.4% 65.7% -23.4% Rome (FCO) 45.2% -6.5% 0.223 -13.6% 68.0% -4.7%
Frankfurt (FRA) 62.2% 11.6% 0.391 23.4% 87.7% -0.6% Helsinki (HEL) 54.1% 14.7% 0.328 25.8% 71.0% -5.9% London (LGW) 33.0% -68.8% 0.213 -29.5% 41.8% -71.1% London (LHR) 42.6% 34.5% 0.201 61.5% 75.9% 13.4% Lisbon (LIS) 56.3% 53.9% 0.350 83.4% 74.1% 21.1%
Madrid (MAD) 52.1% -14.1% 0.297 -22.7% 85.6% -14.2% Munich (MUC) 62.7% 14.2% 0.402 27.8% 80.2% 5.5%
Oslo (OSL) 45.6% -30.5% 0.276 -22.5% 45.6% -30.5% Paris (ORY) 57.1% -17.5% 0.344 -33.6% 68.2% -18.2%
Bucharest (OTP) 52.6% -36.9% 0.301 -53.6% 52.6% -36.9% Prague (PRG) 51.5% -41.8% 0.285 -61.6% 80.3% -22.6% Vienna (VIE) 57.2% -18.3% 0.341 -30.9% 80.4% -20.1%
Warsaw (WAW) 63.8% -17.0% 0.418 -29.8% 88.4% -15.4% Zurich (ZRH) 56.2% -9.1% 0.328 -17.4% 83.7% -9.7%
Table 2. Supply data for sample airports in 2002-2013 Total frequencies
from the airport Total frequencies of the dominant airline in the routes of the
sample
Total destinations from the airport
Total destinations of the dominant airline
from the airport
Airport Mean Variation Mean Variation Mean Variation Mean Variation Amsterdam (AMS) 189822 15.4% 1078 14.75% 222 14.51% 126 29.70% Stockholm (ARN) 100056 -11.9% 1293 -24.74% 106 13.00% 46 46.15%
Brussels (BRU) 97324 -12.3% 892 6.03% 140 7.94% 58 1.85% Paris (CDG) 239592 -8.0% 1198 -6.66% 228 3.76% 152 -2.70%
Copenhagen (CPH) 118790 -2.3% 1219 -14.38% 118 8.04% 61 17.24% Dublin (DUB) 79930 7.1% 916 9.08% 124 101.47% 58 155.56%
Dusseldorf (DUS) 96167 19.7% 1185 -0.18% 120 22.64% 48 63.64% Rome (FCO) 151038 11.1% 1387 -1.6% 159 22.96% 68 40.68%
Frankfurt (FRA) 225961 2.9% 1080 9.59% 250 -4.86% 159 14.08% Helsinki (HEL) 69132 110.9% 801 27.91% 75 144.74% 59 94.29% London (LGW) 110484 22.9% 1006 -38.34% 163 19.44% 66 -48.86% London (LHR) 245117 -4.4% 1195 12.23% 183 -16.33% 119 5.04% Lisbon (LIS) 63518 40.1% 931 60.22% 61 65.57% 58 100.00%
Madrid (MAD) 200263 -11.4% 1365 -24.36% 158 24.22% 100 3.37% Munich (MUC) 182979 15.2% 1519 13.89% 173 20.55% 104 63.89%
Oslo (OSL) 94181 69.5% 2220 -18.41% 52 92.31% 35 131.58% Paris (ORY) 110926 18.2% 2205 -4.94% 117 16.33% 42 -6.25%
Bucharest (OTP) 30214 84.6% 421 35.05% 52 40.00% 37 -29.17% Prague (PRG) 60225 26.6% 716 19.89% 102 24.32% 64 -28.33% Vienna (VIE) 112920 22.2% 852 6.18% 135 11.40% 104 -13.59%
Warsaw (WAW) 55436 27.3% 754 8.80% 80 55.74% 56 -3.51% Zurich (ZRH) 112232 -5.7% 1011 2.06% 130 -7.91% 76 -37.38%
Institut de Recerca en Economia Aplicada Regional i Pública Document de Treball 2014/14, pàg. 25 Research Institute of Applied Economics Working Paper 2014/14, pag. 25
25 �
Table 3. Mean values of the variables used in the empirical analysis Variable All routes Intra-EU routes Intra-EU routes
< 900 kms Intra-EU routes
> 900 kms Frequenciesdominant_airline (annual) 1143.78 1411.42 1722.90 940.78
Populationdestination (thousands) 4287.73 2041.02 1601.43 2705.26
Incomedestination (index) 3.78 3.96 3.98 3.93
Distance (kms) 2272.61 874.89 527.54 1399 DEU (dummy) 0.717 - - -
DUS_openskies (dummy) 0.034 - - -
Dinterhub_same_alliance 0.13 0.11 0.09 0.15
Hub_competition 10.84 12.24 10.79 14.43 Dmerger (dummy) 0.12 0.12 0.12 0.11
Frequenciessecondary_airport (annual) 76.61 106.79 92.17 128.88 HHIroute(Percentage over one) 0.67 0.68 0.72 0.62
Share_no-networkroute
(Percentage over one) 0.11 0.10 0.10 0.10
HHIorigin_airport (Percentage over one) 0.30 0.30 0.30 0.30 Share_no-network origin_airport
(Percentage over one)
0.23 0.24 0.24 0.25
Table 4. Correlation matrix of the variables used in the empirical analysis Freq Pop Inc. Dist Dmer Dinterh
ub Hub_co
mp DEU Do.sky Freqse
condaryHHIro Share
ro HHIap Sha
reap
Freq. 1
Pop. -0.22 1
Income 0.27 -0.39 1
Dist. -0.41 0.65 -0.32 1
Dmerger -0.04 0.03 -0.02 0.009 1
Dinterhub -0.06 0.17 0.23 -0.30 0.01 1
Hub_comp.
0.20 -0.04 0.23 -0.30 0.01 0.18 1
DEU 0.42 -0.60 0.53 -0.80 -0.03 -0.08 0.37 1
Dopenskies -0.12 0.16 0.08 0.33 0.04 0.12 -0.07 -0.31 1
Freqsecond
ary 0.15 -0.06 0.07 -0.10 -0.07 -0.05 0.11 1
HHIroute -0.03 -0.12 -0.01 0.03 0.04 -0.15 -0.31 0.04 -0.02 -0.08 1
ShareNNroute
-0.002 -0.05 -0.06 -0.05 -0.03 -0.11 -0.004 -0.03 -0.09 0.07 -0.41 1
HHIairp. 0.002 0.02 0.04 -0.14 -0.06 0.06 -0.05 -0.06 0.009 -0.23 0.12 -0.14 1
ShareNNairp
0.02 -0.07 0.13 -0.05 0.16 -0.03 0.11 0.16 -0.006 0.14 -0.002 0.13 -0.53 1
Institut de Recerca en Economia Aplicada Regional i Pública Document de Treball 2014/14, pàg. 26 Research Institute of Applied Economics Working Paper 2014/14, pag. 26
26 �
Table 5. Results of estimates (Random effects –GLS regression with an AR 1 disturbance). Dependent variable: Frequencies of dominant airline
Explanatory variables All routes (1)
Intra-EU routes (2)1
Intra-EU routes (3)2
Intra-EU routes < 900
kms (4)
Intra-EU routes > 900 kms (5)
Populationdestination 0.025 (0.005)***
0.10 (0.01)***
0.09 (0.01)***
0.12 (0.02)***
0.10 (0.008)***
Incomedestination 241.93 (60.02)***
6.55 (1.72)***
6.80 (1.57)***
11.27 (2.79)***
6.35 (1.20)***
Distance -0.14 (0.017)***
-0.91 (0.07)***
-0.91 (0.06)***
-1.09 (0.26)**
-0.47 (0.06)***
DEU 349.02 (112.21)***
- - - -
DUS_openskies -11.24 (19.32)
- - - -
Dinterhub_same_alliance -33.32 (18.00)*
-33.59 (27.80)
-37.38 (24.98)
-52.58 (57.91)
-10.53 (21.99)
Hub_competition 4.86 (1.71)***
5.85 (2.30)**
6.00 (2.10)***
6.03 (3.59)*
8.88 (2.23)***
Dmerger -19.26 (10.34)*
-27.02 (14.83)*
-14.74 (13.99)
-24.95 (22.34)
-22.16 (15.82)
HHIroute -1.46 (16.72)
-7.66 (23.11)
0.60 (20.87)
-34.22 (35.36)
29.85 (23.62)
Share_no-networkroute -347.85 (22.36)***
-388.39 (30.22)***
-365.29 (27.65)***
-596.69 (45.92)***
-125.62 (31.63)***
HHIorigin_airport 127.32 (74.16)*
200.04 (101.38)*
233.81 (91.58)**
160.61 (156.74)
206.83 (104.12)**
Share_no-networkorigin_airport
-524.05 (70.74)***
-589.90 (94.93)***
-585.72 (85.63)***
-766.04 (152.49)***
-353.99 (93.22)***
Frequenciessecondary_airport 0.035 (0.02)*
0.02 (0.02)
0.03 (0.02)
0.11 (0.03)***
-0.04 (0.02)*
Intercept -635.83 (278.47)**
1057.67 (262.60)***
1051.53 (238.48)***
754.09 (494.76)
393.24 (167.87)**
Airport dummies YES YES YES YES YES
Year dummies YES YES YES YES YES
R2
Joint significance test ADF test –
nonstationarity Wooldridge test –
autocorrelation Hausman test
Number observations
0.33 1175.23*** -75.95***
338.36***
23.61*** 10472
0.34 901.68*** -60.83***
282.02***
54.11*** 7161
0.38 997.12*** -62.89***
255.72***
58.09*** 6941
0.29 613.91*** -39.70***
189.34***
92.20*** 4279
0.64 700.71*** -40.80***
167.46***
18.89** 2882
Note 1: Sample with all intra-EU routes Note 2: Sample with Intra-EU routes excluding those routes with flights of low-cost subsidiaries of the dominant airline Note 3: Standard errors in parenthesis (robust to heterocedasticity) Note 4: Statistical significance at 1% (***), 5% (**), 10% (*) Note 5: We use one lag of concentration variables (HHI_route, HHI_airport)
Institut de Recerca en Economia Aplicada Regional i Pública Document de Treball 2014/14, pàg. 27 Research Institute of Applied Economics Working Paper 2014/14, pag. 27
27 �
Table 6. Results of estimates (Fixed effects -Within regression with an AR 1 disturbance) Dependent variable: Frequencies of dominant airline
Explanatory variables All routes (1)
Intra-EU routes (2)1
Intra-EU routes (3)2
Intra-EU routes < 900 kms (4)
Intra-EU routes > 900 kms (5)
Populationdestination 0.015 (0.012)
0.20 (0.16)
0.17 (0.15)
-0.004 (0.32)
0.03 (0.14)
Incomedestination - 3.30 (3.53)
3.24 (3.17)
3.34 (5.32)
3.78 (3.76)
Distance - - - - -
DEU - - - - -
DUS_openskies -3.02 (21.04)
- - - -
Dinterhub_same_alliance -24.26 (20.23)
-34.69 (31.15)
-38.92 (27.73)
-20.59 (65.24)
-41.35 (25.25)*
Hub_competition 1.24 (1.87)
-0.78 (2.53)
0.24 (2.29)
-2.77 (3.99)
0.94 (2.54)
Dmerger -34.18 (11.19)***
-45.68 (15.83)***
-31.39 (14.83)**
-52.56 (23.89)**
-28.31 (16.70)*
HHIroute -8.68 (17.57)
-14.49 (24.20)
-8.27 (21.70)
-47.53 (37.25)
38.29 (24.80)
Share_no-networkroute -351.48 (24.02)***
-398.12 (32.13)***
-374.97 (29.22)***
-602.64 (48.28)***
-89.31 (34.20)***
HHIorigin_airport 107.98 (89.23)
170.47 (121.85)
234.99 (109.11)**
209.42 (187.55)
84.87 (124.81)
Share_no-networkorigin_airport
-351.47 (24.02)***
-871.61 (109.65)***
-886.94 (98.32)***
-1200.69 (177.57)***
-486.73 (106.04)***
Frequenciessecondary_airport -0.007 (0.02)
-0.02 (0.02)
-0.018 (0.02)
0.02 (0.04)
-0.03 (0.03)
Intercept 1132.86 (21.31)***
916.66 (112.30)***
963.82 (99.96)***
1761.09 (172.38)***
694.76 (128.10)***
Airport dummies NO NO NO NO NO
Year dummies YES YES YES YES YES
R2
Joint significance test ADF test –
nonstationarity Wooldridge test –
autocorrelation Hausman test
Number observations
0.07 34.37*** -75.95***
338.36***
23.61*** 10472
0.08 27.92*** -60.83***
282.02***
54.11*** 7161
0.09 30.57*** -62.89***
255.72***
58.09*** 6941
0.11 23.46*** -39.70***
189.34***
92.20*** 4279
0.17 7.69***
-40.80***
167.46***
18.89** 2882
Note 1: Sample with all intra-EU routes Note 2: Sample with Intra-EU routes excluding those routes with flights of low-cost subsidiaries of the dominant airline Note 3: Standard errors in parenthesis (robust to heterocedasticity) Note 4: Statistical significance at 1% (***), 5% (**), 10% (*) Note 5: We use one lag of concentration variables (HHI_route, HHI_airport)

Institut de Recerca en Economia Aplicada Regional i Pública Document de Treball 2014/03 pàg. 29 Research Institute of Applied Economics Working Paper 2014/03 pag. 29
29