Embed Size (px)
Citation preview

Research
Contributors
Hamish Preston, CFA
Director
U.S. Equity Indices
Aye M. Soe, CFA
Managing Director
Core and Multi-Assets Indices
What Happened to the Index Effect? A Look at Three Decades of S&P 500® Adds and Drops
EXECUTIVE SUMMARY
The index effect refers to the excess returns putatively associated with a
security being added to, or removed from, a headline index. Although it
has been studied for decades, the index effect has received more attention
in recent years amid the growth of passive investing and the accompanying
speculation that stock returns may be affected by buying and selling
pressures from index-tracking investors reacting to changes in index
membership.
This paper analyzes S&P 500 additions and deletions from the start of 1995
to June 2021. We focus on the S&P 500 given it is the world’s most widely
followed index—USD 13.5 trillion was indexed or benchmarked to the
large-cap U.S. equity gauge at the end of 20201—and so if the growth of
passive investing contributed to an index effect, one might expect it to
appear in S&P 500 additions and deletions.
Overall, our analysis corroborates the general consensus reflected in
existing literature: the S&P 500 index effect seems to be in a structural
decline (see Exhibit 1). Our analysis also suggests that an improvement in
stock liquidity may help to explain the attenuation in the index effect over
time.
Exhibit 1: The S&P 500 Index Effect Declined over Time
Source: S&P Dow Jones Indices LLC, FactSet. Chart based on median excess returns of sample additions and sample deletions between January 1995 and June 2021. Past performance is no
guarantee of future results. Chart is provided for illustrative purposes.
1 “Survey of Indexed Assets.” S&P Dow Jones Indices, Dec. 31, 2020.
8.32
-9.58
3.64
-6.99
-0.04
0.06
-15
-10
-5
0
5
10
Sample Additions Sample Deletions
Me
dia
n E
xce
ss R
etu
rns
vs.
S&
P 5
00
(A
nn
ou
nce
me
nt D
ate
to
Eff
ecti
ve
Da
te)
1995 to 1999 2000 to 2010 2011 to 2021
Register to receive our latest research, education, and commentary at on.spdji.com/SignUp.
What Happened to the Index Effect? September 2021
RESEARCH | Core 2
INTRODUCTION
Passive investing has grown tremendously over the past five decades:
cumulative flows into index-linked investment products surpassed those
going into active funds since 2008,2 and the exchange-traded fund (ETF)
industry has grown from USD 807 billion at the end of 2007 to nearly USD
8 trillion in 2020.3 Such growth has been accompanied by a list of
unwarranted criticisms to the extent that “dangers of passive investing”
turns up many multiples more Google News results than “dangers of
passive smoking.”4
Much has been written about the index effect. For example, it has been
well documented over the past three decades that stocks added to a
popular index tended to outperform the index between the “Announcement
Date” and “Effective Date,” and this was typically followed by a small post-
Effective Date correction.
This paper serves as a follow up to a prior paper published by S&P Dow
Jones Indices (S&P DJI) that examined the declining index effect across
five of the biggest global equity markets.5 For this update, we focus on the
S&P 500 given it is the world’s most widely followed and most liquid index,
with a large ecosystem.6 Hence, if the growth of index-based passive
assets is likely to have caused an index effect anywhere, one might
reasonably suppose the index effect would exist for S&P 500 additions and
deletions.
Our paper adds to the existing literature by offering a continuous look at
S&P 500 changes from the early days of index funds to end of June 2021.
Our analysis corroborates the general consensus reflected in existing
literature: the S&P 500 index effect seems to be in a structural decline, with
the median excess returns of our sample of additions falling from 8.32%
(1995-1999) to -0.04% (2011-2021). The magnitude of median excess
returns associated with our sample of deletions also fell, changing
from -9.58% (1995-1999) to 0.06% (2011-2021).
The declining index effect is likely a result of many structural changes
taking place in the financial industry and capital markets. From the rise of
2 https://www.morningstar.com/content/dam/marketing/shared/pdfs/Research/Fund_Flows_August2019_Final.pdf?
3 https://www.statista.com/statistics/224579/worldwide-etf-assets-under-management-since-1997/
4 For an overview of some of the common criticisms of passive investing, see Ganti, Anu and Craig Lazzara, “The Slings and Arrows of
Passive Fortune,” S&P Dow Jones Indices, April 2018.
5 Dash, Srikant and Aye M. Soe, “The Shrinking Index Effect: A Global Perspective,” November 2008.
6 See Bennett, Chris, Tim Edwards, Sherifa Issifu, and Craig Lazzara, “A Window on Index Liquidity: Volumes Linked to SPDJI Indices,” S&P
Dow Jones Indices, August 2019.
Index-based, passive investing has grown tremendously over the past five decades. If the growth of index-based passive assets is likely to have caused an index effect anywhere… …one might reasonably suppose the index effect would exist for S&P 500 additions and deletions. The S&P 500 index effect seems to be in a structural decline.

What Happened to the Index Effect? September 2021
RESEARCH | Core 3
the ETF market makers, to markets becoming more efficient,7 the passive
investing ecosystem is evolving, with index rebalancing at the heart of it.
LITERATURE OVERVIEW
Much of the literature and theory surrounding index effects have focused on
S&P 500 deletions and additions, with the earliest studies dating back to
1986.8 Bender, Nagori, and Tank9 compiled an exhaustive list of index
effect studies on the major U.S. and international equity benchmarks.
Among the S&P 500 studies, papers covering periods up to the early 2000s
generally found a positive index effect, but studies that covered the mid to
late 2000s noted a decline in the size of the index effect.
The more recent findings run counter to the notion that the rise of
index investing and capital flows into index-linked products affect
price discovery. In our 2008 paper, we noted that the index effect
perhaps may have become a victim of its own success, with a large number
of market participants entering the passive ecosystem. Renshaw7
attributed the ETF market makers for lessening the index effect. Bender et
al.9 found that markets have become more efficient, leading to a weakening
index effect.
Most studies take one of five perspectives when analyzing the index effect:
1. Price pressure hypothesis theorizes that prices will reverse after the
index change when heavy index fund trading subsides around the
change date.
2. Imperfect substitutes hypothesis states that the price effect is
permanent because index fund buying changes the available float of
shares.
3. Liquidity hypothesis suggests that prices are affected if the liquidity
of stocks being deleted is affected.
4. Information content hypothesis contends that index addition and
deletions are based on firm-specific factors that will affect prices of the
firm's stock. Also, additions and deletions from the index affect the
level of scrutiny and analyst coverage of the stocks.
5. Selection criteria hypothesis suggests that evidence of abnormal
returns is not robust since the stock selection process followed by
index providers itself uses historical prices.
7 See Renshaw, Anthony, “The Weakening Index Effect,” The Journal of Index Investing, Summer 2020, vol. 11, issue 1, pp. 17 -31. and
Bender et al. “The Past, Present and Future of the Index Effect,” Journal of Index Investing, Winter 2019.
8 For example, see Harris, L.E. and Eitan Gurel, “Price and Volume Effects Associated with Changes in the S&P 500 List: New Evidence for
the Existence of Price Pressures,” The Journal of Finance, 1986, vol. 41, issue 4, pp. 815-829; and A. Shleifer, “Do Demand Curves for
Stocks Slope Downwards?” The Journal of Finance, 1986, vol. 41, issue 3, pp.579-590.
9 “The Past, Present and Future of the Index Effect,” Journal of Index Investing, Winter 2019.
Papers covering periods up to the early 2000s generally found a positive index effect, but studies that covered the mid to late 2000s noted a decline in the size of the index effect. Previously, we noted that the index effect perhaps may have become a victim of its own success… …with a large number of market participants entering the passive ecosystem.
What Happened to the Index Effect? September 2021
RESEARCH | Core 4
S&P 500 CONSTITUENT CHANGES: INDEX MECHANICS
The S&P 500 is designed to measure the performance of the large-cap
U.S. equity segment and is widely regarded as the best single gauge of
large-cap U.S. equity performance: the 500 companies in the index
accounted for approximately 80% of the entire U.S. equity market
capitalization and over USD 13.5 trillion was indexed or benchmarked to
the S&P 500 at the end of 2020.10
The large-cap U.S. equity benchmark is maintained by S&P DJI’s U.S.
Index Committee, whose members are full-time S&P DJI employees. The
Index Committee meets monthly to review, among other things:
• Pending corporate actions that may affect index constituents;
• Statistics comparing the composition of the indices to the market;
• Companies that are being considered as candidates for addition to an
index; and
• Significant market events.11
Crucially, the S&P 500 is not necessarily the largest 500 U.S.-
domiciled companies: companies must first meet various criteria
before they are eligible to be considered for addition to the index .12
For example, firms must have a history of positive earnings and must meet
certain liquidity and size thresholds. Exhibit 2 summarizes the S&P 500
addition criteria outlined in the S&P U.S. Indices Methodology.
Satisfying the addition criteria does not guarantee S&P 500 inclusion: the
Index Committee also considers sector balance—as measured by
comparing Global Industry Classification Standard® (GICS®) sector weights
in the S&P Total Market Index (TMI), within the appropriate market
capitalization range—when considering constituent changes. Also, the
addition criteria are not used for determining ongoing S&P 500
membership because the Index Committee seeks to avoid index turnover
when possible. This means that existing S&P 500 stocks that may no
longer satisfy one or more of the addition criteria are not automatically
deleted from the index.
10
“Survey of Indexed Assets,” S&P Dow Jones Indices, Dec. 31, 2020.
11 For more information, see S&P U.S. Indices Methodology.
12 The addition criteria set forth in Exhibit 2 are also used for maintenance of the S&P MidCap 400 and the S&P S mallCap 600. Together with
the S&P 500, the three indices compose the S&P Composite 1500®.
The S&P 500 is widely regarded as the best single gauge of large-cap U.S. equity performance. Over USD 13.5 trillion was indexed or benchmarked to the S&P 500 at the end of 2020. The S&P 500 is not necessarily the largest 500 U.S.-domiciled companies. Firms must meet various criteria before they are eligible to be considered for index addition.

What Happened to the Index Effect? September 2021
RESEARCH | Core 5
*Prior to 2014, the S&P DJI earnings criterion required four consecutive quarters of positive earnings,
instead of the sum of the last four quarters being positive. **A company meeting the unadjusted company market capitalization criteria is also require d to have a
security-level float-adjusted market capitalization that is at least 50% of the respective index’s unadjusted company level minimum market capitalization threshold. Source: S&P Dow Jones Indices LLC. Data as of June 2021. Table is provided for illustrative purposes.
The S&P 500 does not have a set reconstitution schedule; changes to
the index are made on an ongoing, as-needed basis. Additions and
deletions are announced at 5:15 p.m. ET and typically become effective no
less than three business days after the implementation Effective Date.13
These announcements are available to the public via
www.spglobal.com/spdji before, or at the same time, they are available to
clients or the affected companies. Any company that is removed from the
S&P 500 may not be considered as a replacement candidate for the index
until at least one year after its index removal date.
ADDITIONS AND DELETIONS: DATA AND SAMPLE
The S&P 500 had 715 additions and 711 deletions between January 1995
and June 2021, averaging around 27 constituent adds and drops per
year.14 This annual average trended down over time: about 35 changes per
year were typical between 1995 and 1999, but this fell to about 28 per year
between 2000 and 2010, before falling to about 21 per year since 2011. A
majority of S&P 500 additions (378) graduated from the S&P MidCap 400®,
although many additions (332) came from outside the S&P Composite
1500®. Most deletions (529) went to outside the S&P 1500®, while 142
were moved to the S&P 400®. Exhibit 3 summarizes this information.
13
Less than three business days’ notice may be given at the discretion of the Index Committee.
14 The reason for the difference in the total number of adds and drops is that additional share classes for five companies were added in 2014
and 2015. One of these additional share classes was removed toward the end of 2015.
Exhibit 2: The S&P 500 Uses a Number of Index Addition Criteria
CRITERIA DESCRIPTION
Reconstitution of Stocks Throughout the year, as corporate actions arise
Earnings The sum of the most recent four consecutive quarters’ as-reported earnings should be positive, as should the most recent quarter’s*
Liquidity
The ratio of annual U.S. dollar value traded to float-adjusted market
capitalization should be 1.00 or greater, and the stock should trade a minimum of 250,000 shares in each of the six months leading up to the
evaluation date
Market Capitalization Unadjusted company market capitalizations of USD 13.1 billion or more; these ranges are reviewed from time to time to assure
consistency with market conditions
Public Float At least 10% of shares publicly floated**
IPO Seasoning 12 months required
Domicile of Constituents U.S. companies, based on multiple criteria such as fixed assets, revenues, listing, etc.
Sector Classification Global Industry Classification Standard (GICS)
Any company that is removed from the S&P 500 may not be considered as a replacement candidate for the index until at least one year after its index removal date. A majority of S&P 500 additions (378) graduated from the S&P 400, although many additions (332) came from outside the S&P 1500.

What Happened to the Index Effect? September 2021
RESEARCH | Core 6
Exhibit 3: S&P 500 Additions and Deletions over Time
PERIOD ADDITIONS ADDITIONS FROM
S&P 400 S&P 600® OUTSIDE S&P 1500
Entire period 715 378 5 332
1995 to 1999 177 96 0 81
2000 to 2010 312 158 4 150
2011 to 2021 226 124 1 101
PERIOD DELETIONS DELETIONS TO
S&P 400 S&P 600 OUTSIDE S&P 1500
Entire period 711 142 40 529
1995 to 1999 178 10 18 150
2000 to 2010 311 32 17 262
2011 to 2021 222 100 5 117
Source: S&P Dow Jones Indices LLC. Table shows S&P 500 additions and deletions, as announced by
S&P Dow Jones Indices, between Jan. 1, 1995, and June 30, 2021. Table is provided for illustrative purposes.
Exhibit 4 offers an overview of our sample that we use for our analysis. In
order to construct our sample of additions and deletions, we remove from
the data in Exhibit 3 any company that lacked a full series of FactSet
returns and volume information for the period starting 21 trading days prior
to the announcement date and ending 21 trading days after the Effective
Date.15 We also exclude restructurings, recapitalizations, bankruptcies,
acquisitions, mergers, spinoffs, and delistings in order to isolate the impact
of changes to index membership. We also exclude any changes for which
the Announcement Date and Effective Date were the same. The additions
and deletions used within our study are hereafter referred to as the “sample
additions” and “sample deletions.”
Exhibit 4: Our Sample Contains over 80% of Additions, but Far Fewer Deletions
PERIOD SAMPLE
ADDITIONS
SAMPLE ADDITIONS FROM
S&P 400 S&P 600 OUTSIDE S&P 1500
Entire period 576 355 5 216
1995 to 1999 130 89 0 41
2000 to 2010 260 151 4 105
2011 to 2021 186 115 1 70
PERIOD SAMPLE
DELETIONS
SAMPLE DELETIONS TO
S&P 400 S&P 600 OUTSIDE S&P 1500
Entire period 223 123 31 69
1995 to 1999 31 5 15 11
2000 to 2010 90 22 12 56
2011 to 2021 102 96 4 2
Source: S&P Dow Jones Indices LLC. Table shows sample S&P 500 additions and deletions, as announced by S&P Dow Jones Indices, between Jan. 1, 1995, and June 30, 2021. Inclusion within our
study is determined by the criteria outlined in the previous paragraph. Table is provided for illustrative purposes.
15
The Effective Date refers to the date of the last market close prior to the constituent cha nge being reflected as included in the S&P 500. This is the date on which a theoretical index tracker will likely purchase added (sell dropped) index constituents at or near the market close
to avoid tracking error.
Most deletions (529) went to outside the S&P 1500, while 142 were moved to the S&P 400. In our sample additions and deletions, we excluded restructurings, recapitalizations, bankruptcies, acquisitions, mergers, spinoffs, and delistings.

What Happened to the Index Effect? September 2021
RESEARCH | Core 7
Our sample additions represent over 80% (576 out of the 715) of all
additions to the S&P 500 between January 1995 and June 2021. The
majority (355 out of 576) of sample additions graduated from the S&P 400
and, as observed with all additions, there was a downward trend in the
number of sample additions over time—an annual average of 26, 24, and
18 in the periods 1995 to 1999, 2000 to 2010, and 2011 to 2021,
respectively.
However, our sample deletions contain only 31% of all deletions (223
out of 711). This proportion is particularly small for deletions to outside the
S&P 1500; only 69 out of 529 (13%) were included in our sample, reflecting
the fact that most deletions were caused by M&A activity or significant
restructurings. This speaks to the potential benefit of the Index Committee
making constituent changes on an ongoing, as-needed basis; they are able
to react to corporate actions in order to ensure the S&P 500 continues to
reflect the performance of large-cap U.S. equities.
TERMINOLOGY AND RETURNS ANALYSIS SETUP
As is common in studies of the index effect, we analyze companies’ excess
returns by taking the difference between a stock’s total return and that of
the S&P 500, thus controlling for market movements. We present results
based on median excess returns, mitigating the impact of extreme returns,
and controlling for differences in sample size across the different time
periods.
We use the following terminology throughout our study.
• Announcement Date (AD): This is the date on which the names of
companies to be added or removed from the index are announced by
S&P DJI.
• AD+X: X trading days after the Announcement Date.
• Effective Date (ED): The date of the last market close prior to the
constituent change being reflected in the S&P 500. This is typically the
date on which a theoretical index tracker purchases (sells) the index
addition (deletion) at or near the market close to avoid tracking error.16
• ED+X: X trading days after the Effective Date.
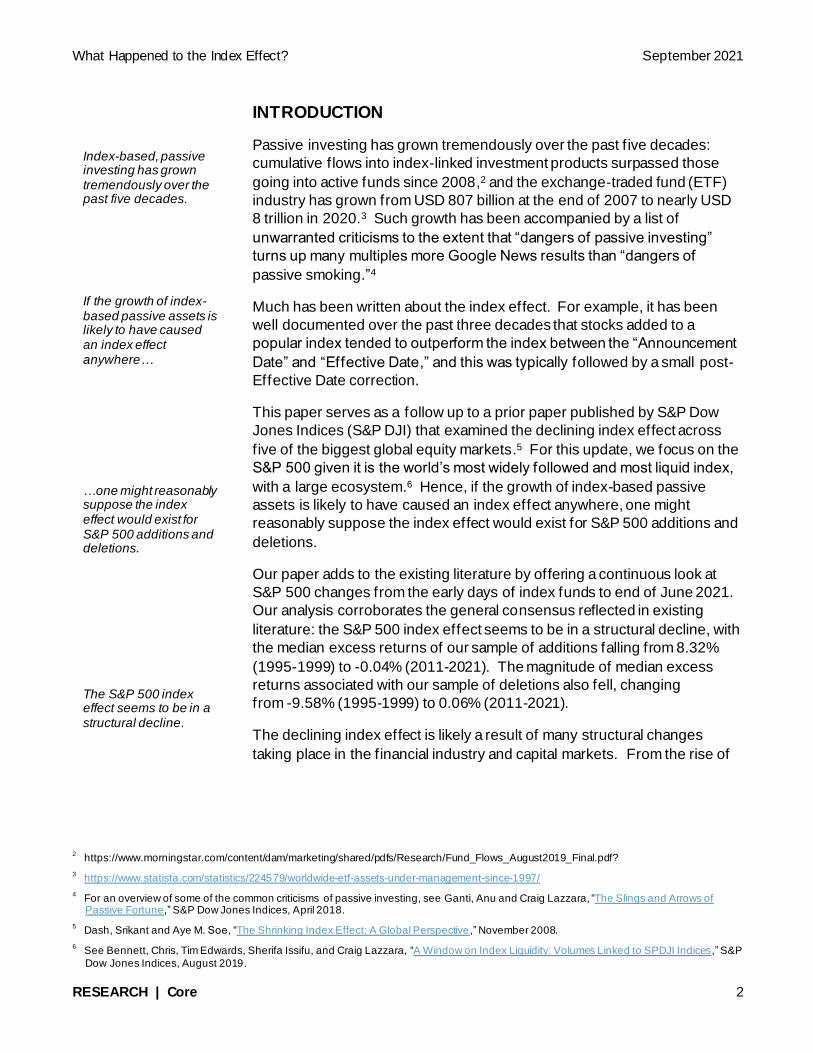
Exhibit 5 summarizes the horizons we use when assessing the excess
returns of sample additions and sample deletions between January 1995
and June 2021.
16
For example, suppose an index announcement states a constituent change will go into effect prior to the open on a particular date, Y. The
ED in our study is the trading day prior to Y.
There was a downward trend in the number of sample additions over time. Most deletions were caused by M&A activity or significant restructurings. We analyze companies’ excess returns by taking the difference between a stock’s total return and that of the S&P 500, thus controlling for market movements.
What Happened to the Index Effect? September 2021
RESEARCH | Core 8
Exhibit 5: Time Horizons Studied
FROM TO SHORTHAND
21 Days before Announcement Date Announcement Date AD-21 to AD
5 Days before Announcement Date Announcement Date AD-5 to AD
Announcement Date Effective Date AD to ED17
Effective Date 5 Days after Effective Date ED to ED+5
Effective Date 21 Days after Effective Date ED to ED+21
Source: S&P Dow Jones Indices LLC. Days refers to trading days. Table is provided for illustrative purposes.
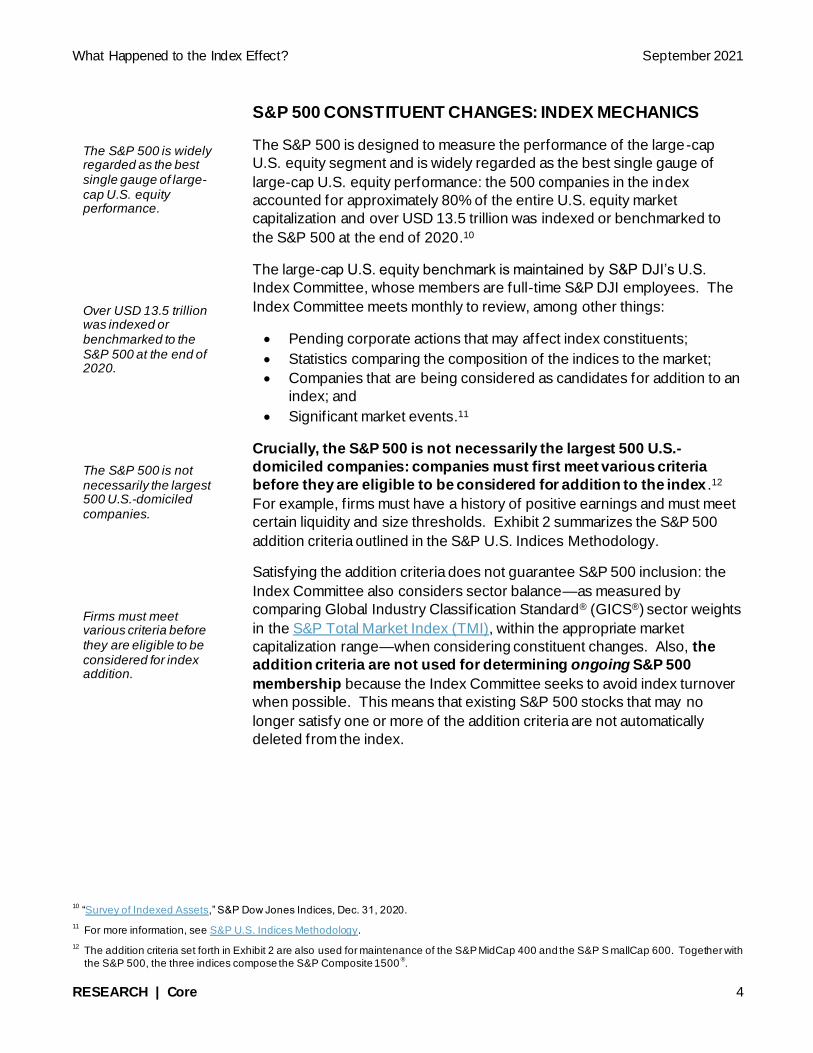
SAMPLE ADDITIONS
Over the past 25 years, median excess returns associated with sample
additions have declined (see Exhibit 6). Excess returns between the AD
and ED fell from 8.32% (1995 to 1999) to 3.64% (2000 to 2010) to -0.04%
(2011 to 2021). This is consistent with recent findings from research into
the S&P 500 index effect that found no abnormal returns between the AD
and ED.18
Exhibit 6: Median Excess Returns of Sample Additions
Source: S&P Dow Jones Indices LLC, FactSet. Charts show median excess total returns in USD of sample additions between January 1995 and June 2021. Past performance is no guarantee of future
results. Charts are provided for illustrative purposes.
To investigate whether the index effect varies depending on the
source of the addition, we separate sample additions into two groups .
Group 1 contains companies added from the S&P MidCap 400 and the
S&P SmallCap 600®, while Group 2 contains companies added from
outside of the mid- and small-cap indices. Exhibit 7 summarizes the
excess returns for both groups.
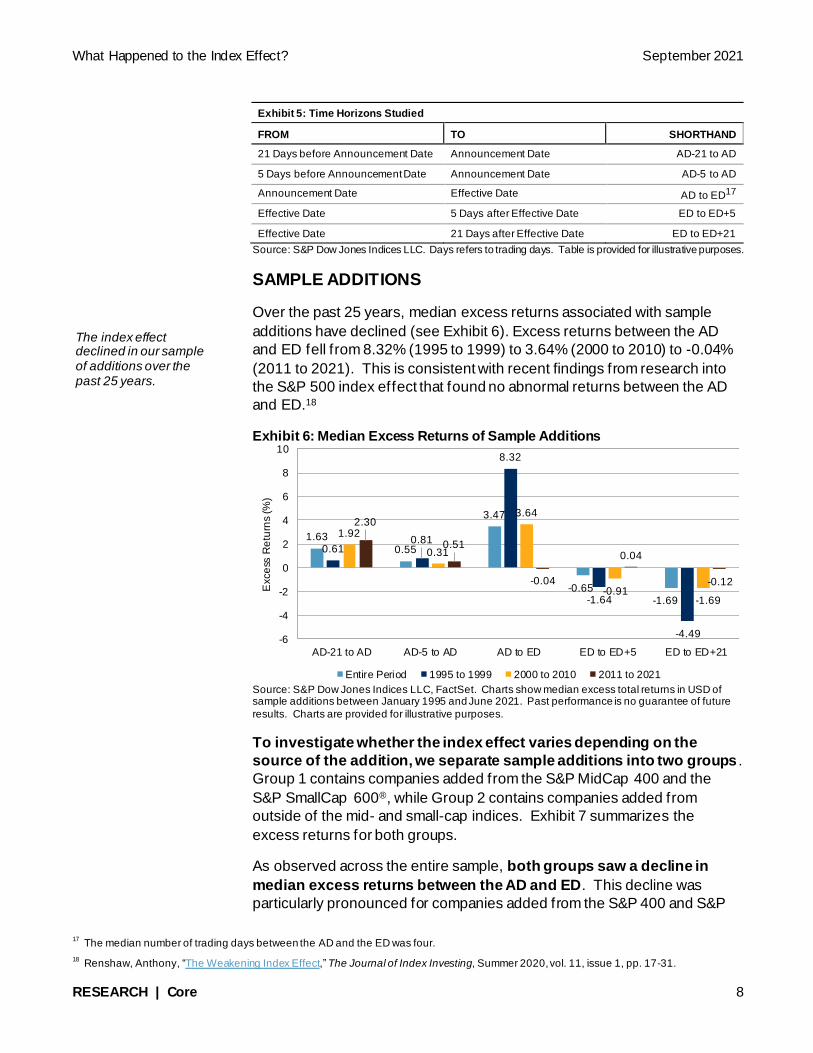
As observed across the entire sample, both groups saw a decline in
median excess returns between the AD and ED. This decline was
particularly pronounced for companies added from the S&P 400 and S&P
17
The median number of trading days between the AD and the ED was four.
18 Renshaw, Anthony, “The Weakening Index Effect,” The Journal of Index Investing, Summer 2020, vol. 11, issue 1, pp. 17-31.
1.63
0.55
3.47
-0.65-1.69
0.610.81
8.32
-1.64
-4.49
1.92
0.31
3.64
-0.91-1.69
2.30
0.51
-0.04
0.04
-0.12
-6
-4
-2
0
2
4
6
8
10
AD-21 to AD AD-5 to AD AD to ED ED to ED+5 ED to ED+21
Exce
ss R
etu
rns
(%)
Entire Period 1995 to 1999 2000 to 2010 2011 to 2021
The index effect declined in our sample of additions over the past 25 years.
What Happened to the Index Effect? September 2021
RESEARCH | Core 9
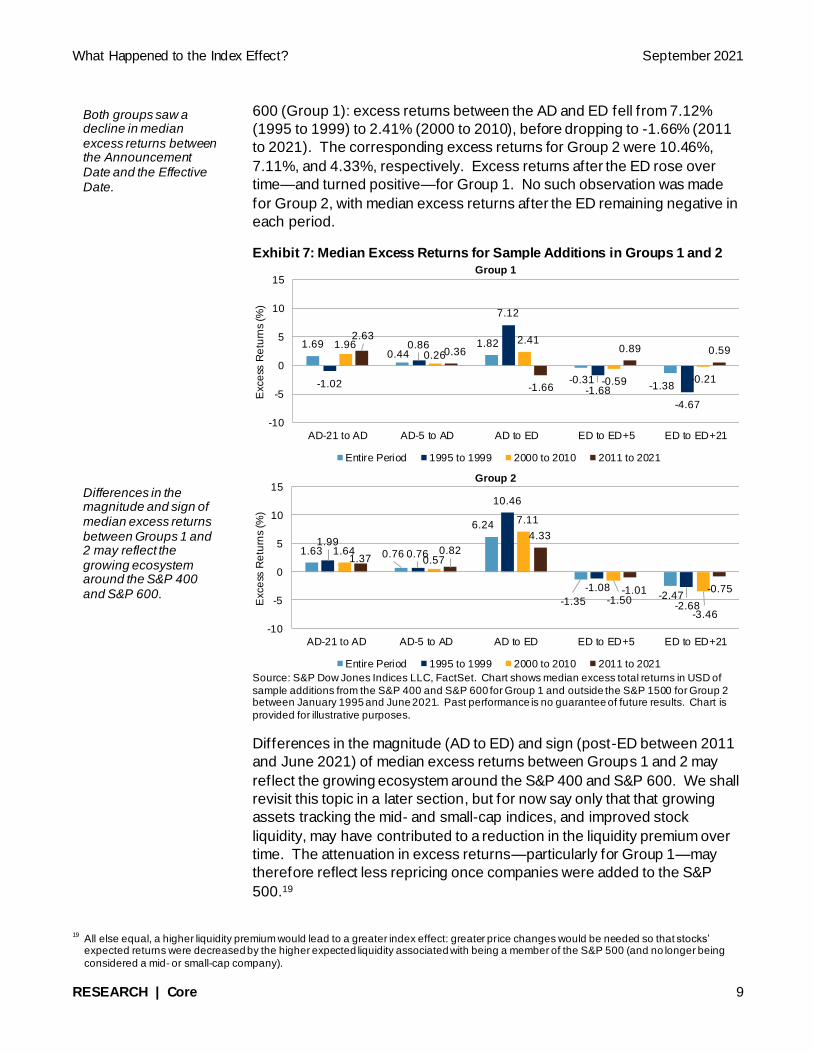
600 (Group 1): excess returns between the AD and ED fell from 7.12%
(1995 to 1999) to 2.41% (2000 to 2010), before dropping to -1.66% (2011
to 2021). The corresponding excess returns for Group 2 were 10.46%,
7.11%, and 4.33%, respectively. Excess returns after the ED rose over
time—and turned positive—for Group 1. No such observation was made
for Group 2, with median excess returns after the ED remaining negative in
each period.
Exhibit 7: Median Excess Returns for Sample Additions in Groups 1 and 2
Source: S&P Dow Jones Indices LLC, FactSet. Chart shows median excess total returns in USD of
sample additions from the S&P 400 and S&P 600 for Group 1 and outside the S&P 1500 for Group 2 between January 1995 and June 2021. Past performance is no guarantee of future results. Chart is
provided for illustrative purposes.
Differences in the magnitude (AD to ED) and sign (post-ED between 2011
and June 2021) of median excess returns between Groups 1 and 2 may
reflect the growing ecosystem around the S&P 400 and S&P 600. We shall
revisit this topic in a later section, but for now say only that that growing
assets tracking the mid- and small-cap indices, and improved stock
liquidity, may have contributed to a reduction in the liquidity premium over
time. The attenuation in excess returns—particularly for Group 1—may
therefore reflect less repricing once companies were added to the S&P
500.19
19
All else equal, a higher liquidity premium would lead to a greater index effect: greater price changes would be needed so that stocks’ expected returns were decreased by the higher expected liquidity associated with being a member of the S&P 500 (and no longer being
considered a mid- or small-cap company).
1.690.44
1.82
-0.31-1.38-1.02
0.86
7.12
-1.68
-4.67
1.960.26
2.41
-0.59 -0.21
2.63
0.36
-1.66
0.89 0.59
-10
-5
0
5
10
15
AD-21 to AD AD-5 to AD AD to ED ED to ED+5 ED to ED+21
Exce
ss R
etu
rns
(%)
Group 1
Entire Period 1995 to 1999 2000 to 2010 2011 to 2021
1.63 0.76
6.24
-1.35-2.47
1.990.76
10.46
-1.08
-2.68
1.640.57
7.11
-1.50
-3.46
1.370.82
4.33
-1.01 -0.75
-10
-5
0
5
10
15
AD-21 to AD AD-5 to AD AD to ED ED to ED+5 ED to ED+21
Exce
ss R
etu
rns
(%)
Group 2
Entire Period 1995 to 1999 2000 to 2010 2011 to 2021
Both groups saw a decline in median excess returns between the Announcement Date and the Effective Date. Differences in the magnitude and sign of median excess returns between Groups 1 and 2 may reflect the growing ecosystem around the S&P 400 and S&P 600.

What Happened to the Index Effect? September 2021
RESEARCH | Core 10
SAMPLE DELETIONS
When it comes to our analysis of sample deletions, it is important to recall
that our sample contains only 31% of all deletions between January 1995
and June 2021. Notwithstanding this caveat, Exhibit 8 summarizes median
excess returns for sample deletions since 1995. We observe the following.
• The index effect declined in our sample of deletions; the magnitude of
median excess returns between the AD and ED decreased over time.
• Median excess returns between the AD and ED were positive over the
past decade (0.06%). This compares with -9.58% and -6.99% for the
periods 1995 to 1999 and 2000 to 2010, respectively.
• Excess returns after the ED decreased over the past 25 years and
turned negative over the past decade.
Exhibit 8: Median Excess Returns of Sample Deletions
Source: S&P Dow Jones Indices LLC, FactSet. Chart shows median excess total returns in USD of
sample deletions between January 1995 and June 2021. Past performance is no guarantee of future results. Chart is provided for illustrative purposes.
Next, we separate sample deletions into two groups in order to assess
the impact of the destinations of deletions on the index effect. Group
3 contains companies that were dropped to the S&P 400 or S&P 600, while
Group 4 contains companies that were dropped to outside the S&P 1500.
Exhibit 9 provides a summary of the median excess returns for both
groups.
As observed for the sample of deletions, there was a clear reduction in
the magnitude of the index effect for both groups over the past 25
years. Indeed, Group 3’s median excess returns between the AD and ED
changed from -9.57% (1995 to 1999) to -3.48% (2000 to 2010) to 0.06%
(2011 to 2021). The corresponding figures for Group 4 were -11.86%,
-9.18%, and -2.44%, respectively.
-3.93
-1.60
-3.43
0.491.39
-0.99 -0.70
-9.58
3.19
6.31
-6.69
-2.34
-6.99
1.63
4.59
-1.76-1.14
0.06
-0.30
-2.15
-12
-10
-8
-6
-4
-2
0
2
4
6
8
AD-21 to AD AD-5 to AD AD to ED ED to ED+5 ED to ED+21
Exce
ss R
etu
rns
(%)
Entire Period 1995 to 1999 2000 to 2010 2011 to 2021
The index effect declined in our sample of deletions Median excess returns between the Announcement Date and the Effective Date were positive over the past decade.
What Happened to the Index Effect? September 2021
RESEARCH | Core 11
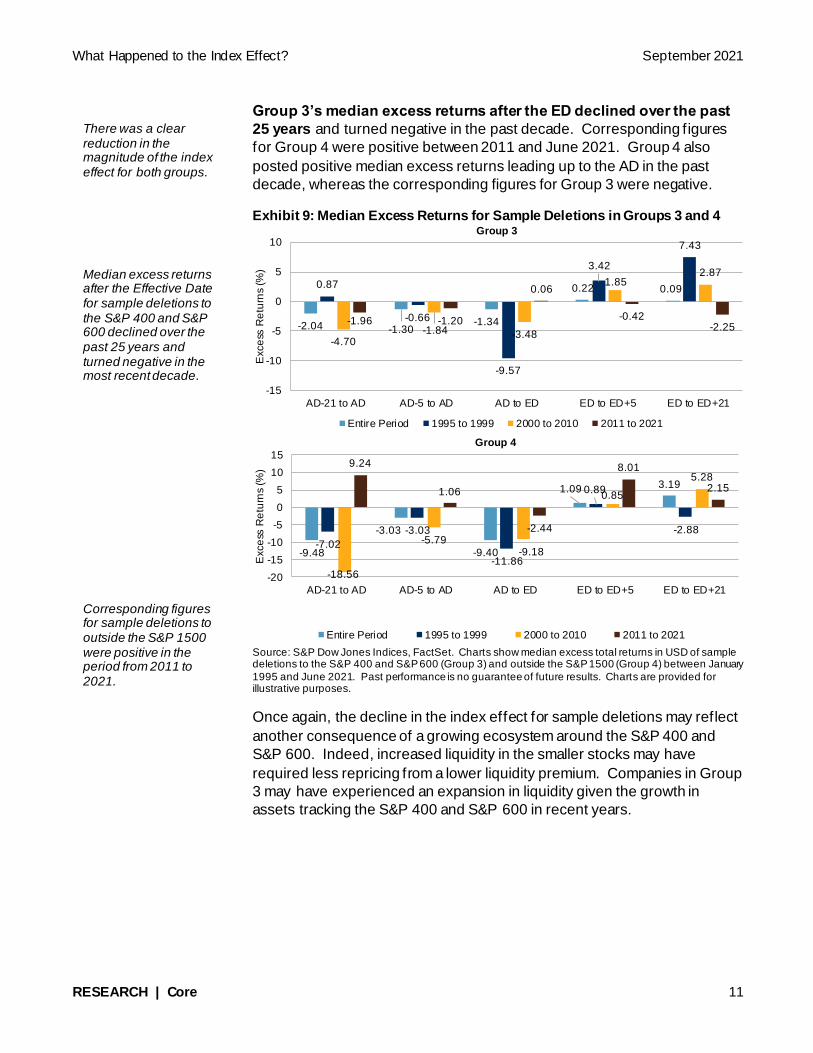
Group 3’s median excess returns after the ED declined over the past
25 years and turned negative in the past decade. Corresponding figures
for Group 4 were positive between 2011 and June 2021. Group 4 also
posted positive median excess returns leading up to the AD in the past
decade, whereas the corresponding figures for Group 3 were negative.
Exhibit 9: Median Excess Returns for Sample Deletions in Groups 3 and 4
Source: S&P Dow Jones Indices, FactSet. Charts show median excess total returns in USD of sample deletions to the S&P 400 and S&P 600 (Group 3) and outside the S&P 1500 (Group 4) between January
1995 and June 2021. Past performance is no guarantee of future results. Charts are provided for illustrative purposes.
Once again, the decline in the index effect for sample deletions may reflect
another consequence of a growing ecosystem around the S&P 400 and
S&P 600. Indeed, increased liquidity in the smaller stocks may have
required less repricing from a lower liquidity premium. Companies in Group
3 may have experienced an expansion in liquidity given the growth in
assets tracking the S&P 400 and S&P 600 in recent years.
-2.04 -1.30-1.34
0.22 0.090.87
-0.66
-9.57
3.42
7.43
-4.70-1.84 -3.48
1.852.87
-1.96 -1.20
0.06
-0.42-2.25
-15
-10
-5
0
5
10
AD-21 to AD AD-5 to AD AD to ED ED to ED+5 ED to ED+21
Exce
ss R
etu
rns
(%)
Group 3
Entire Period 1995 to 1999 2000 to 2010 2011 to 2021
-9.48
-3.03
-9.40
1.09 3.19
-7.02
-3.03
-11.86
0.89
-2.88
-18.56
-5.79-9.18
0.85
5.28
9.24
1.06
-2.44
8.01
2.15
-20
-15
-10
-5
0
5
10
15
AD-21 to AD AD-5 to AD AD to ED ED to ED+5 ED to ED+21
Exce
ss R
etu
rns
(%)
Group 4
Entire Period 1995 to 1999 2000 to 2010 2011 to 2021
There was a clear reduction in the magnitude of the index effect for both groups. Median excess returns after the Effective Date for sample deletions to the S&P 400 and S&P 600 declined over the past 25 years and turned negative in the most recent decade. Corresponding figures for sample deletions to outside the S&P 1500 were positive in the period from 2011 to 2021.

What Happened to the Index Effect? September 2021
RESEARCH | Core 12
Differences in excess returns post-ED may reflect the fact that Group 4
changes were typically caused by changes to companies’ index eligibility.
These companies’ returns were therefore relatively unchanged after the
ED, notwithstanding the impact between the AD and ED.
ROLE OF SECTOR MEMBERSHIP
We have thus far looked at the impact of S&P 500 membership on
companies’ excess returns. Our analysis now turns to the potential impacts
of sector membership on the index effect.
GICS is a widely recognized way to group companies. Based on revenues,
market perception, and earnings, companies are grouped into one of 158
possible sub-industries. Each sub-industry is then mapped to—in
decreasing order of granularity—one of 69 industries, one of 24 industry
groups, and one of 11 sectors.20
Incorporating revenues and earnings in GICS classifications means that
companies in the same sector are likely to have shared sensitivities to
certain trends and news flow. Since these sensitivities may be specific to a
sector, there may be times when sectoral membership plays a greater
role in determining company returns compared to membership of a
broader index.21
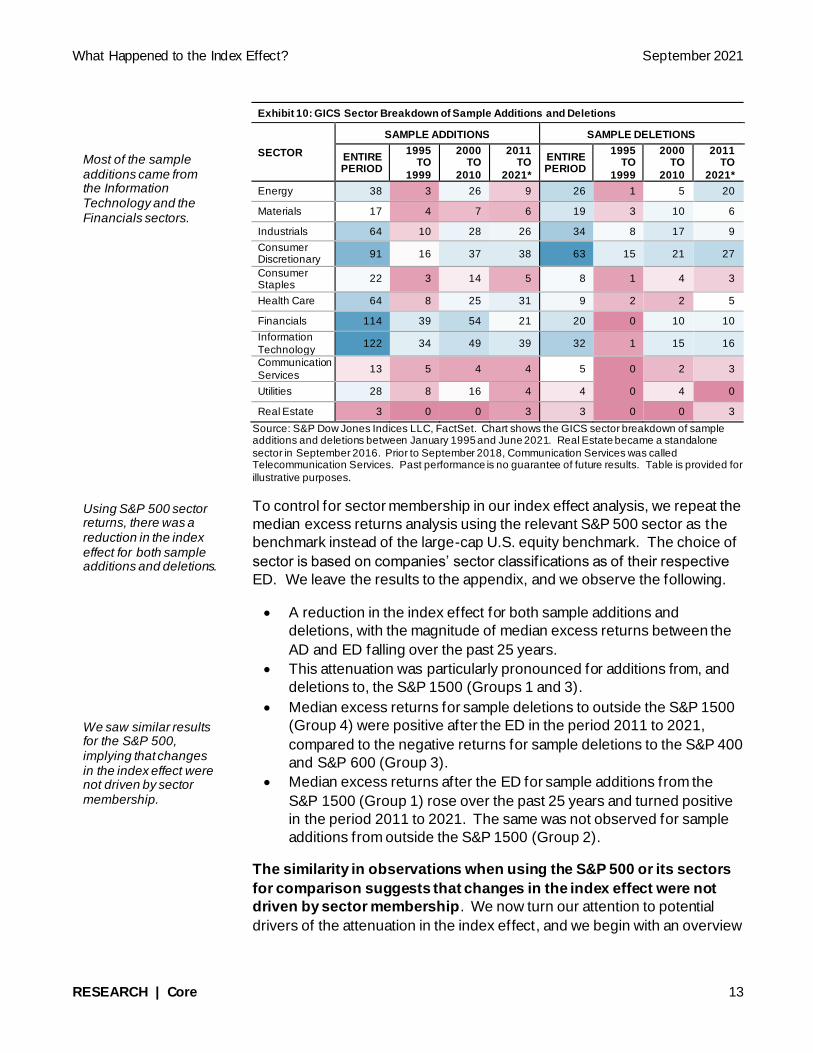
Exhibit 10 offers a breakdown of each company’s GICS sector
classification, as of the respective ED, for sample additions and deletions.
Most of the sample additions came from the Information Technology and
the Financials sectors. The Consumer Discretionary sector also accounted
for many sample additions and deletions.
20
See the GICS methodology.
21 For a discussion on the role of sector effects in the S&P 500, see Lazzara, Craig and Tim Edwards, “Sector Effects in the S&P 500,” S&P
Dow Jones Indices, March 2019.
Incorporating revenues and earnings in GICS classifications means that companies in the same sector are likely to have shared sensitivities to certain trends. There may be times when sectoral membership plays a greater role in determining company returns compared to membership of a broader index.
What Happened to the Index Effect? September 2021
RESEARCH | Core 13
Exhibit 10: GICS Sector Breakdown of Sample Additions and Deletions
SECTOR
SAMPLE ADDITIONS SAMPLE DELETIONS
ENTIRE PERIOD
1995 TO
1999
2000 TO
2010
2011 TO
2021*
ENTIRE PERIOD
1995 TO
1999
2000 TO
2010
2011 TO
2021*
Energy 38 3 26 9 26 1 5 20
Materials 17 4 7 6 19 3 10 6
Industrials 64 10 28 26 34 8 17 9
Consumer Discretionary
91 16 37 38 63 15 21 27
Consumer Staples
22 3 14 5 8 1 4 3
Health Care 64 8 25 31 9 2 2 5
Financials 114 39 54 21 20 0 10 10
Information
Technology 122 34 49 39 32 1 15 16
Communication
Services 13 5 4 4 5 0 2 3
Utilities 28 8 16 4 4 0 4 0
Real Estate 3 0 0 3 3 0 0 3
Source: S&P Dow Jones Indices LLC, FactSet. Chart shows the GICS sector breakdown of sample additions and deletions between January 1995 and June 2021. Real Estate became a standalone
sector in September 2016. Prior to September 2018, Communication Services was called Telecommunication Services. Past performance is no guarantee of future results. Table is provided for
illustrative purposes.
To control for sector membership in our index effect analysis, we repeat the
median excess returns analysis using the relevant S&P 500 sector as the
benchmark instead of the large-cap U.S. equity benchmark. The choice of
sector is based on companies’ sector classifications as of their respective
ED. We leave the results to the appendix, and we observe the following.
• A reduction in the index effect for both sample additions and
deletions, with the magnitude of median excess returns between the
AD and ED falling over the past 25 years.
• This attenuation was particularly pronounced for additions from, and
deletions to, the S&P 1500 (Groups 1 and 3).
• Median excess returns for sample deletions to outside the S&P 1500
(Group 4) were positive after the ED in the period 2011 to 2021,
compared to the negative returns for sample deletions to the S&P 400
and S&P 600 (Group 3).
• Median excess returns after the ED for sample additions from the
S&P 1500 (Group 1) rose over the past 25 years and turned positive
in the period 2011 to 2021. The same was not observed for sample
additions from outside the S&P 1500 (Group 2).
The similarity in observations when using the S&P 500 or its sectors
for comparison suggests that changes in the index effect were not
driven by sector membership. We now turn our attention to potential
drivers of the attenuation in the index effect, and we begin with an overview
Most of the sample additions came from the Information Technology and the Financials sectors. Using S&P 500 sector returns, there was a reduction in the index effect for both sample additions and deletions. We saw similar results for the S&P 500, implying that changes in the index effect were not driven by sector membership.

What Happened to the Index Effect? September 2021
RESEARCH | Core 14
of the growth in S&P 500, S&P 400, and S&P 600 indexed assets and the
higher liquidity of stocks over the past 25 years.
INDEXED ASSETS & LIQUIDITY
As one of the most widely followed and widely tracked indices in the world,
over USD 5.4 trillion was indexed to the S&P 500 as of the end of 2020
according to data from S&P DJI’s Annual Survey of Indexed Assets.22 This
compares with USD 577 billion at the end of 1996.
Exhibit 11: S&P 500 Indexed Assets
Source: S&P Dow Jones Indices LLC. Data as of Dec. 31, 2020. Past performance is no guarantee of future results. Chart is provided for illustrative purposes.
Additionally, assets tracking the S&P 400 and S&P 600 also grew since
1996, and at a quicker rate than their large-cap counterpart. Indeed, USD
207 billion and USD 99 billion was indexed to the S&P 400 and S&P 600,
respectively, at the end of 2020. These represented 12-fold and 90-fold
increases since the end of 1996, respectively, versus a 9-fold increase in
assets tracking the S&P 500.23
Accompanying the growth in assets tracking the S&P 500, S&P 400,
and S&P 600, and perhaps indicative of greater depth in the U.S.
equity market, S&P 500 additions and deletions became more liquid
over the past 25 years. One way to measure this is to compute the
median dollar value traded (MDVT) for each sample addition and deletion.24
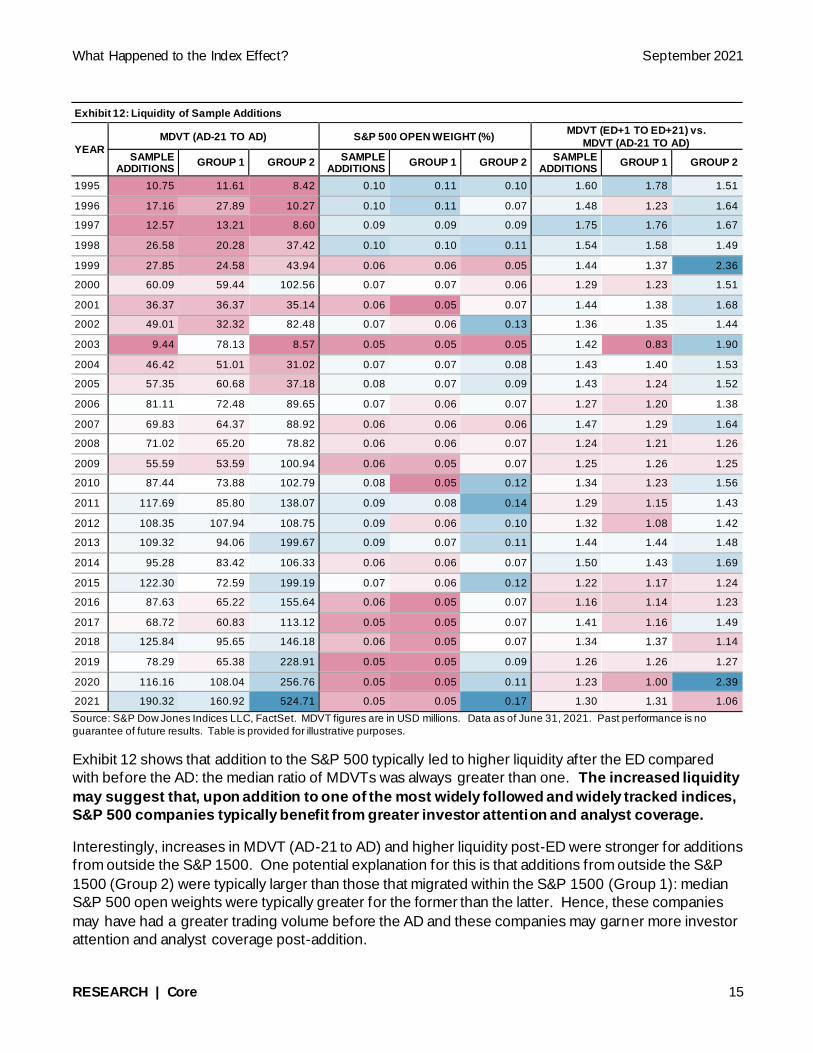
Exhibit 12 provides median figures for sample additions between 1995 and
2021, including: a) MDVT figures from AD-21 to AD; b) S&P 500 index
weights as of the open on the first trading day after the ED; and c) the ratio
of MDVT from ED+1 to ED+21 versus MDVT from AD-21 to AD.
22
“Survey of Indexed Assets,” S&P Dow Jones Indices, Dec. 31, 2020.
23 As of Dec. 31, 2020, S&P 500 indexed assets represented 17% of the free-float market capitalization of S&P 500 companies, compared
with 10% and 11% for the S&P 400 and S&P 600, respectively.
24 MDVT is computed by first calculating the dollar value traded by multiplying closing prices in USD and daily volumes. The MDVT figures
then equal the median value for each stock over the relevant period.
57
7
78
1
10
13
12
22
11
21
10
14
84
1
99
0
11
07
12
61
13
16
14
70
91
5
11
67
13
18
14
70
15
63
18
78
21
57
21
45
29
55
34
11
36
12
45
90
54
27
0
1,000
2,000
3,000
4,000
5,000
6,000
199
6
199
7
199
8
199
9
200
0
200
1
200
2
200
3
200
4
200
5
200
6
200
7
200
8
200
9
201
0
201
1
201
2
201
3
201
4
201
5
201
6
201
7
201
8
201
9
202
0
Ind
exe
d A
sse
ts (
US
D B
illi
on
s)
USD 5.4 trillion was indexed to the S&P 500 as of the end of 2020, up from USD 577 billion at the end of 1996. Assets tracking the S&P 400 and S&P 600 also grew since 1996, and at a quicker rate than their large-cap counterpart. S&P 500 additions and deletions became more liquid over the past 25 years.
What Happened to the Index Effect? September 2021
RESEARCH | Core 15
Exhibit 12: Liquidity of Sample Additions
YEAR
MDVT (AD-21 TO AD) S&P 500 OPEN WEIGHT (%) MDVT (ED+1 TO ED+21) vs.
MDVT (AD-21 TO AD)
SAMPLE ADDITIONS
GROUP 1 GROUP 2 SAMPLE
ADDITIONS GROUP 1 GROUP 2
SAMPLE ADDITIONS
GROUP 1 GROUP 2
1995 10.75 11.61 8.42 0.10 0.11 0.10 1.60 1.78 1.51
1996 17.16 27.89 10.27 0.10 0.11 0.07 1.48 1.23 1.64
1997 12.57 13.21 8.60 0.09 0.09 0.09 1.75 1.76 1.67
1998 26.58 20.28 37.42 0.10 0.10 0.11 1.54 1.58 1.49
1999 27.85 24.58 43.94 0.06 0.06 0.05 1.44 1.37 2.36
2000 60.09 59.44 102.56 0.07 0.07 0.06 1.29 1.23 1.51
2001 36.37 36.37 35.14 0.06 0.05 0.07 1.44 1.38 1.68
2002 49.01 32.32 82.48 0.07 0.06 0.13 1.36 1.35 1.44
2003 9.44 78.13 8.57 0.05 0.05 0.05 1.42 0.83 1.90
2004 46.42 51.01 31.02 0.07 0.07 0.08 1.43 1.40 1.53
2005 57.35 60.68 37.18 0.08 0.07 0.09 1.43 1.24 1.52
2006 81.11 72.48 89.65 0.07 0.06 0.07 1.27 1.20 1.38
2007 69.83 64.37 88.92 0.06 0.06 0.06 1.47 1.29 1.64
2008 71.02 65.20 78.82 0.06 0.06 0.07 1.24 1.21 1.26
2009 55.59 53.59 100.94 0.06 0.05 0.07 1.25 1.26 1.25
2010 87.44 73.88 102.79 0.08 0.05 0.12 1.34 1.23 1.56
2011 117.69 85.80 138.07 0.09 0.08 0.14 1.29 1.15 1.43
2012 108.35 107.94 108.75 0.09 0.06 0.10 1.32 1.08 1.42
2013 109.32 94.06 199.67 0.09 0.07 0.11 1.44 1.44 1.48
2014 95.28 83.42 106.33 0.06 0.06 0.07 1.50 1.43 1.69
2015 122.30 72.59 199.19 0.07 0.06 0.12 1.22 1.17 1.24
2016 87.63 65.22 155.64 0.06 0.05 0.07 1.16 1.14 1.23
2017 68.72 60.83 113.12 0.05 0.05 0.07 1.41 1.16 1.49
2018 125.84 95.65 146.18 0.06 0.05 0.07 1.34 1.37 1.14
2019 78.29 65.38 228.91 0.05 0.05 0.09 1.26 1.26 1.27
2020 116.16 108.04 256.76 0.05 0.05 0.11 1.23 1.00 2.39
2021 190.32 160.92 524.71 0.05 0.05 0.17 1.30 1.31 1.06
Source: S&P Dow Jones Indices LLC, FactSet. MDVT figures are in USD millions. Data as of June 31, 2021. Past performance is no
guarantee of future results. Table is provided for illustrative purposes.
Exhibit 12 shows that addition to the S&P 500 typically led to higher liquidity after the ED compared
with before the AD: the median ratio of MDVTs was always greater than one. The increased liquidity
may suggest that, upon addition to one of the most widely followed and widely tracked indices,
S&P 500 companies typically benefit from greater investor attention and analyst coverage.
Interestingly, increases in MDVT (AD-21 to AD) and higher liquidity post-ED were stronger for additions
from outside the S&P 1500. One potential explanation for this is that additions from outside the S&P
1500 (Group 2) were typically larger than those that migrated within the S&P 1500 (Group 1): median
S&P 500 open weights were typically greater for the former than the latter. Hence, these companies
may have had a greater trading volume before the AD and these companies may garner more investor
attention and analyst coverage post-addition.
What Happened to the Index Effect? September 2021
RESEARCH | Core 16
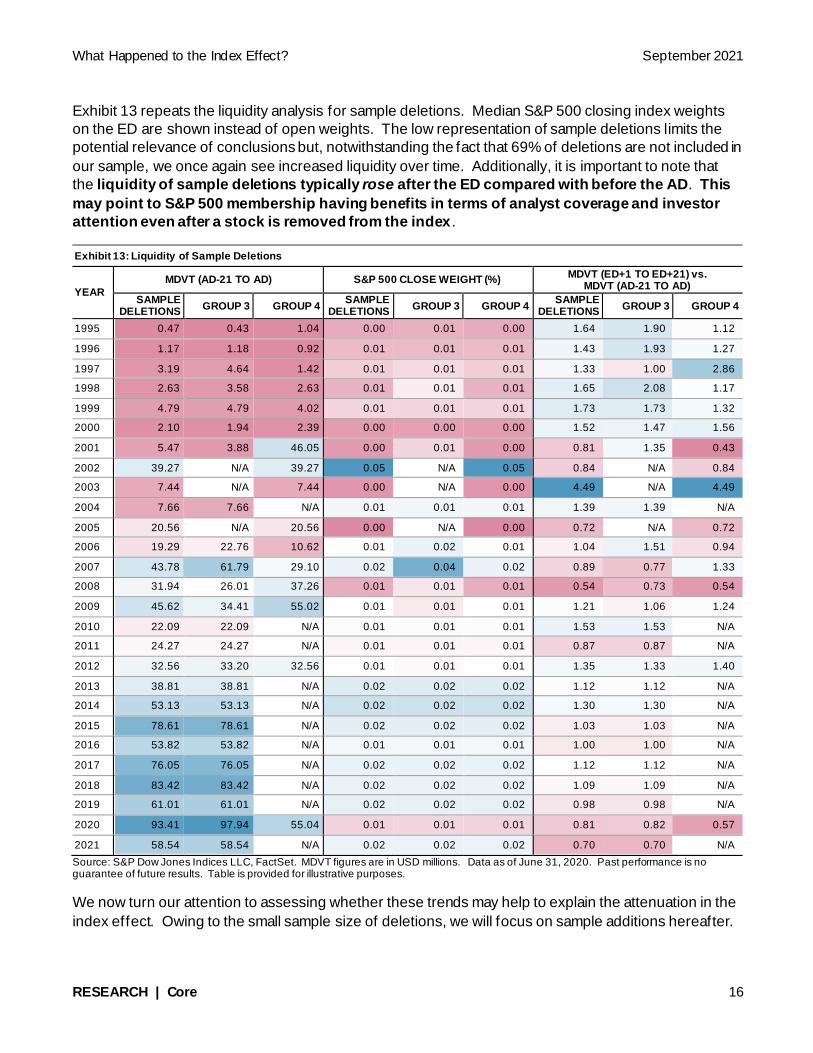
Exhibit 13 repeats the liquidity analysis for sample deletions. Median S&P 500 closing index weights
on the ED are shown instead of open weights. The low representation of sample deletions limits the
potential relevance of conclusions but, notwithstanding the fact that 69% of deletions are not included in
our sample, we once again see increased liquidity over time. Additionally, it is important to note that
the liquidity of sample deletions typically rose after the ED compared with before the AD. This
may point to S&P 500 membership having benefits in terms of analyst coverage and investor
attention even after a stock is removed from the index .
Exhibit 13: Liquidity of Sample Deletions
YEAR
MDVT (AD-21 TO AD) S&P 500 CLOSE WEIGHT (%) MDVT (ED+1 TO ED+21) vs.
MDVT (AD-21 TO AD)
SAMPLE DELETIONS
GROUP 3 GROUP 4 SAMPLE
DELETIONS GROUP 3 GROUP 4
SAMPLE DELETIONS
GROUP 3 GROUP 4
1995 0.47 0.43 1.04 0.00 0.01 0.00 1.64 1.90 1.12
1996 1.17 1.18 0.92 0.01 0.01 0.01 1.43 1.93 1.27
1997 3.19 4.64 1.42 0.01 0.01 0.01 1.33 1.00 2.86
1998 2.63 3.58 2.63 0.01 0.01 0.01 1.65 2.08 1.17
1999 4.79 4.79 4.02 0.01 0.01 0.01 1.73 1.73 1.32
2000 2.10 1.94 2.39 0.00 0.00 0.00 1.52 1.47 1.56
2001 5.47 3.88 46.05 0.00 0.01 0.00 0.81 1.35 0.43
2002 39.27 N/A 39.27 0.05 N/A 0.05 0.84 N/A 0.84
2003 7.44 N/A 7.44 0.00 N/A 0.00 4.49 N/A 4.49
2004 7.66 7.66 N/A 0.01 0.01 0.01 1.39 1.39 N/A
2005 20.56 N/A 20.56 0.00 N/A 0.00 0.72 N/A 0.72
2006 19.29 22.76 10.62 0.01 0.02 0.01 1.04 1.51 0.94
2007 43.78 61.79 29.10 0.02 0.04 0.02 0.89 0.77 1.33
2008 31.94 26.01 37.26 0.01 0.01 0.01 0.54 0.73 0.54
2009 45.62 34.41 55.02 0.01 0.01 0.01 1.21 1.06 1.24
2010 22.09 22.09 N/A 0.01 0.01 0.01 1.53 1.53 N/A
2011 24.27 24.27 N/A 0.01 0.01 0.01 0.87 0.87 N/A
2012 32.56 33.20 32.56 0.01 0.01 0.01 1.35 1.33 1.40
2013 38.81 38.81 N/A 0.02 0.02 0.02 1.12 1.12 N/A
2014 53.13 53.13 N/A 0.02 0.02 0.02 1.30 1.30 N/A
2015 78.61 78.61 N/A 0.02 0.02 0.02 1.03 1.03 N/A
2016 53.82 53.82 N/A 0.01 0.01 0.01 1.00 1.00 N/A
2017 76.05 76.05 N/A 0.02 0.02 0.02 1.12 1.12 N/A
2018 83.42 83.42 N/A 0.02 0.02 0.02 1.09 1.09 N/A
2019 61.01 61.01 N/A 0.02 0.02 0.02 0.98 0.98 N/A
2020 93.41 97.94 55.04 0.01 0.01 0.01 0.81 0.82 0.57
2021 58.54 58.54 N/A 0.02 0.02 0.02 0.70 0.70 N/A
Source: S&P Dow Jones Indices LLC, FactSet. MDVT figures are in USD millions. Data as of June 31, 2020. Past performance is no guarantee of future results. Table is provided for illustrative purposes.
We now turn our attention to assessing whether these trends may help to explain the attenuation in the
index effect. Owing to the small sample size of deletions, we will focus on sample additions hereafter.
What Happened to the Index Effect? September 2021
RESEARCH | Core 17
LIQUIDITY PREMIUM AND THE INDEX EFFECT
To gauge the potential impact of liquidity on the index effect, we consider
certain factors that may impact the cost of liquidity in the market.
The first factor we consider is the available pool of indexed assets
associated with an S&P 500 addition that comes from either the S&P 400
or S&P 600. This is because greater assets tracking mid caps and
small caps can offset some of the buying pressure on S&P 500
additions by matching some of the demand from investors tracking
the S&P 500. Indeed, once a company is added to the S&P 500, investors
tracking the index typically buy portions of the company to avoid tracking
error. At the same time and for the same reason, investors tracking the
S&P 400 and S&P 600 would be looking to sell their holdings in that same
company.
As a result, we compute the “incremental indexed assets” associated with a
sample S&P 500 addition in order to gauge buying pressure. Specifically,
for a particular ED, we take the total indexed assets tracking the S&P 500
at the end of the previous year and multiply this by the stock weight in the
S&P 500 prior to the open on the first trading date after the ED.25 This is
the aggregate amount that investors tracking the S&P 500 would have to
own of the stock to avoid tracking error against the index.
Next, we take the total indexed assets tracking the index of origin (IoO;
either the S&P 400 or S&P 600) at the end of the prior year, and multiply
this by the closing weight of the company in the index of origin as of the
ED. This is the aggregate amount that investors tracking the index of origin
would likely sell in the company to avoid tracking error. If a company was
added from outside the S&P 1500, we assume it had no indexed assets
prior to its addition to the S&P 500.
By taking the difference between these two figures, the incremental
indexed assets show S&P 500 indexed assets that would need to buy
an addition over and above indexed assets that would be selling at the
same time.26
Incremental Indexed Assets =
= (S&P 500 open weightED +1 ∗ S&P 500 indexed assets) − (IoO close weight ED
∗ IoO indexed assets )
25
Indexed assets are based on year-end 2020 figures from S&P DJI’s “Survey of Indexed Assets.”
26 For the purposes of this calculation, we assume that all indexed assets trade instantaneously at the close of the ED.
Once a company is added to the S&P 500, investors tracking the index typically buy portions of the company to avoid tracking error. At the same time and for the same reason, investors tracking the S&P 400 and S&P 600 would be looking to sell their holdings in that same company. If a company was added from outside the S&P 1500, we assume it had no indexed assets prior to its addition to the S&P 500.
What Happened to the Index Effect? September 2021
RESEARCH | Core 18
The next steps we take are: a) to multiply incremental indexed assets by
the range of the addition’s stock price from AD-21 to AD; and b) to divide by
the addition’s MDVT (AD-21 to AD). We defined the range as the
difference in maximum price minus the minimum price, divided by the
average price. This leaves us with an implicit cost measure defined as
follows.
Implicit Cost =Incremental Indexed Assets
MDVT (AD − 21 to AD)∗ Range
The implicit cost measure reflects the fact that market makers sit in
between buyers and sellers. While we assume trading happens
instantaneously, in practice market makers may have to hold inventory from
one side of a trade before the other side has completed. All else equal, the
risk of holding inventory increases when incremental indexed assets
represent a larger portion of the stock’s typical MDVT . A greater movement
in the addition’s stock price introduces greater risk for the market maker
that they are holding the stock when it falls. In each case, the market
maker may pass this risk onto investors as an additional cost for providing
liquidity.
Exhibit 14 shows the median excess returns of sample additions between
the AD and the ED in each year between 1997 and June 2021.27 The
exhibit also shows the corresponding median values of the implicit cost
measure. The left-hand chart shows a downward trend in both series, with
the right-hand chart showing the changes in the implicit cost measure
helped to explain more than 50% of the variation in median excess returns
between 1997 and 2021. In other words, an improvement in liquidity
appeared to help explain the attenuation in the index effect,
historically.
27
Median excess returns are relative to the S&P 500, and we begin in 1997 because S&P DJI’s data on indexed assets data begins in 1996.
We defined the range as the difference in maximum price minus the minimum price, divided by the average price. The implicit cost measure reflects the fact that market makers sit in between buyers and sellers. In each case, the market maker may pass this risk onto investors as an additional cost for providing liquidity.

What Happened to the Index Effect? September 2021
RESEARCH | Core 19
Exhibit 14: Implicit Cost Measure and the Index Effect – Sample Additions
Source: S&P Dow Jones Indices LLC, FactSet. Data as of June 31, 2021. Past performance is no guarantee of future results. Charts are provided for illustrative purposes.
Exhibit 15 repeats the analysis for sample additions from the S&P 400 and
S&P 600 (Group 1) and for sample additions from outside the S&P 1500
(Group 2). In both cases, changes in the median implicit cost measure
were positively correlated with changes in the index effect .
The implicit cost for Group 1 declined over the entire period, corresponding
to a decline in the index effect. This suggests that the growth in indexed
assets in the S&P 400 and S&P 600 improved the liquidity of these
additions, which in turn contributed to less of a price impact of index
addition.
Additionally, Group 1’s median implicit cost measure was always lower than
Group 2’s. This may help to explain why the median absolute value of the
index effect was always lower for Group 1 than Group 2, with the latter
group’s changes involving greater price impacts. Although Group 2’s
higher implicit cost measure may appear to contradict the observation that
it typically posted higher MDVT (AD-21 to AD), the assumed absence of
any indexed assets tracking Group 2 prior to their addition meant that the
median incremental indexed assets were far larger than for Group 1. The
median range was also typically higher for Group 2 than Group 1.
These observations also helped to explain the jump in Group 2’s implicit
cost measure in 2020: while the median MDVT figure also rose in 2020,
there was a greater increase in median incremental indexed assets and the
median range also rose. Overall, though, Group 2’s median implicit cost
measure declined since 1997.
0.0
0.5
1.0
1.5
2.0
2.5
3.0
3.5
4.0
4.5
5.0
-4
-2
0
2
4
6
8
10
12
199
7
199
9
200
1
200
3
200
5
200
7
200
9
201
1
201
3
201
5
201
7
201
9
202
1
Imp
licit C
ost
Me
asu
re
Me
dia
n E
xce
ss R
etu
rns
(AD
to
ED
)
Median Excess Returns (AD to ED)
Implicit Cost Measure
R² = 0.5221
-4
-2
0
2
4
6
8
10
12
0.0 1.0 2.0 3.0 4.0 5.0
Me
dia
n E
xce
ss R
etu
rns
(AD
to
ED
)
Implicit Cost Measure
Both the median excess returns (AD to ED) and the implicit cost measure had downward trends over time… …the changes in the implicit cost measure helped to explain more than 50% of the variation in median excess returns. An improvement in liquidity helped to explain the attenuation in the index effect, historically.

What Happened to the Index Effect? September 2021
RESEARCH | Core 20
Exhibit 15: Implicit Cost Measure and the Index Effect – Sample Additions from Groups 1 and 2 Group 1
Group 2
Source: S&P Dow Jones Indices LLC, FactSet. Data as of June 31, 2021. Past performance is no guarantee of future results. Chart s are provided for illustrative purposes.
0.0
0.5
1.0
1.5
2.0
2.5
3.0
3.5
4.0
-6
-4
-2
0
2
4
6
8
10
12
199
7
199
9
200
1
200
3
200
5
200
7
200
9
201
1
201
3
201
5
201
7
201
9
202
1
Imp
licit C
ost
Me
asu
re
Me
dia
n E
xce
ss R
etu
rns
(AD
to
ED
)
Median Excess Returns (AD to ED) Implicit Cost Measure
R² = 0.5149
-6
-4
-2
0
2
4
6
8
10
12
0.0 1.0 2.0 3.0 4.0
Me
dia
n E
xce
ss R
etu
rns
(AD
to
ED
)
Implicit Cost Measure
0.0
0.5
1.0
1.5
2.0
2.5
3.0
3.5
4.0
4.5
5.0
0
5
10
15
20
25
199
7
199
9
200
1
200
3
200
5
200
7
200
9
201
1
201
3
201
5
201
7
201
9
202
1
Imp
licit C
ost
Me
asu
re
Me
dia
n E
xce
ss R
etu
rns
(AD
to
ED
)
Median Excess Returns (AD to ED) Implicit Cost Measure
R² = 0.4554
0
5
10
15
20
25
0.0 1.0 2.0 3.0 4.0 5.0
Me
dia
n E
xce
ss R
etu
rns
(AD
to
ED
)
Implicit Cost Measure

What Happened to the Index Effect? September 2021
RESEARCH | Core 21
CONCLUSION
The growth of index-based passive investing in the past five decades has
coincided with greater attention on the impact of index membership on
stock prices and volumes. Focusing on a sample of S&P 500 additions and
deletions since 1995, this paper shows that the magnitude of median
excess returns between the Announcement Date and the Effective Date
declined since the 1990s.
For example, median excess returns of sample additions fell from 8.32%
(1995 to 1999) to -0.04% (2011 to 2021), while the magnitude of median
excess returns for sample deletions also fell, changing from -9.58% (1995
to 1999) to 0.06% (2011 to 2021). Similar trends were observed when
comparing stock returns to the S&P 500 or the appropriate S&P 500 sector
index.
One potential reason for the decline in the index effect is the increased
depth of the U.S. equity market. The growth of assets tracking the
S&P 400 and the S&P 600 since 1996 may have contributed to an
improved liquidity environment—especially for additions coming from the
S&P 1500—while additions from outside the S&P 1500 appeared to benefit
from a general improvement in stock liquidity.
Additionally, stocks added to the S&P 500 typically experienced an
increase in MDVT: over a one-month period after the Effective Date, the
MDVT was typically higher than for the one-month period before the
Announcement Date. This may suggest companies added to the S&P 500
typically benefitted from greater investor attention and analyst coverage.
These benefits appeared to remain after deletion from the index,
notwithstanding the relatively small sample size of sample deletions.
As a result, the decline of the index effect over the past 25 years appears to
reflect structural changes taking place in the financial industry and the
capital markets. From the rise of the ETF market makers to markets
becoming more efficient, the passive investing ecosystem is evolving, with
index rebalancing at the heart of it.
One potential reason for the decline in the index effect is the increased depth of the U.S. equity market. The decline of the index effect over the past 25 years appears to reflect structural changes taking place in the financial industry and the capital markets.

What Happened to the Index Effect? September 2021
RESEARCH | Core 22
APPENDIX
Sample Additions versus GICS
Exhibit 16: Median Excess Returns of Sample Additions
Source: S&P Dow Jones Indices LLC, FactSet. Chart shows median excess total returns in USD of all sample additions, those from the S&P
400 and S&P 600 (Group 1), and those from outside the S&P 1500 (Group 2) between January 1995 and June 2021. The S&P 500 Real Estate Sector was launched on Sept. 19, 2016, while the other 10 S&P 500 Sectors launched on June 28, 1996. All data prior to these launch
dates is back-tested. Prior to September 2018, Communication Services was called Telecommunication Services. Past performance is no guarantee of future results. Charts are provided for illustrative purposes and reflect hypothetical historical performance. Please see the
Performance Disclosure at the end of this document for more information regarding the inherent limitations associated with back-tested performance.
1.500.37
3.29
-0.60-1.44
0.13 0.59
7.82
-0.80
-5.09
1.92
0.42
3.51
-0.81-1.59
1.67
0.35 0.03 0.00 0.42
-6
-4
-2
0
2
4
6
8
10
AD-21 to AD AD-5 to AD AD to ED ED to ED+5 ED to ED+21
Exce
ss R
etu
rns
(%)
All Sample Additions
Entire Period 1995 to 1999
2000 to 2010 2011 to 2021
1.39
0.19
1.68
-0.03-0.97-0.67
0.86
6.93
-0.75
-5.11
1.88
0.10
2.71
-0.50-1.17
1.67
0.17
-1.80
0.90 0.58
-6
-4
-2
0
2
4
6
8
AD-21 to AD AD-5 to AD AD to ED ED to ED+5 ED to ED+21
Exce
ss R
etu
rns
(%)
Group 1
Entire Period 1995 to 1999
2000 to 2010 2011 to 2021
1.700.65
6.05
-1.10 -1.67
1.180.18
10.30
-0.86
-5.08
2.15
0.77
6.98
-1.36 -1.74
1.630.71
3.92
-1.14-0.26
-6
-4
-2
0
2
4
6
8
10
12
AD-21 to AD AD-5 to AD AD to ED ED to ED+5 ED to ED+21
Exce
ss R
etu
rns
(%)
Group 2
Entire Period 1995 to 1999
2000 to 2010 2011 to 2021

What Happened to the Index Effect? September 2021
RESEARCH | Core 23
Sample Deletions versus GICS
Exhibit 17: Median Excess Returns of Sample Deletions
Source: S&P Dow Jones Indices, FactSet. Chart shows median excess total returns in USD of all sample deletions, those to the S&P 400 and
S&P 600 (Group 3), and those to outside the S&P 1500 (Group 4) between January 1995 and June 2021. The S&P 500 Real Estate Sector was launched on Sept. 19, 2016, while the other 10 S&P 500 Sectors launched on June 28, 1996. All data prior to these launch dates is back -
tested. Prior to September 2018, Communication Services was called Telecommunication Services. Past performance is no guarantee of future results. Charts are provided for illustrative purposes and reflect hypothetical historical performance. Please see the Performance
Disclosure at the end of this document for more information regarding the inherent limitations associated with back-tested performance.
-3.53
-1.54
-3.57
0.171.39
-0.39-1.01
-10.27
2.08
6.27
-8.05
-2.98
-6.53
0.97
2.87
-1.91-0.83
-0.13 -0.42
-2.57
-12
-10
-8
-6
-4
-2
0
2
4
6
8
AD-21 to AD AD-5 to AD AD to ED ED to ED+5 ED to ED+21
Exce
ss R
etu
rns
(%)
All Sample Deletions
Entire Period 1995 to 1999
2000 to 2010 2011 to 2021
-1.89-1.11 -1.54
0.09 0.401.59
-0.86
-10.51
2.35
7.18
-3.94
-1.52
-3.48
1.512.83
-2.14-1.01
-0.13 -0.63
-2.65
-12
-10
-8
-6
-4
-2
0
2
4
6
8
10
AD-21 to AD AD-5 to AD AD to ED ED to ED+5 ED to ED+21
Exce
ss R
etu
rns
(%)
Group 3
Entire Period 1995 to 1999
2000 to 2010 2011 to 2021
-13.31
-3.99
-9.92
0.933.03
-5.33-3.03
-10.03
-0.42-2.37
-24.08
-7.04
-9.98
0.77
4.30
13.07
1.90
-2.29
9.16
3.76
-30
-25
-20
-15
-10
-5
0
5
10
15
AD-21 to AD AD-5 to AD AD to ED ED to ED+5 ED to ED+21
Exce
ss R
etu
rns
(%)
Group 4
Entire Period 1995 to 1999
2000 to 2010 2011 to 2021

What Happened to the Index Effect? September 2021
RESEARCH | Core 24
PERFORMANCE DISCLOSURE/BACK-TESTED DATA
The S&P 500 Consumer Discretionary, S&P 500 Consumer Staples, S&P 500 Energy, S&P 500 Materials, S&P 500 Industrials, S&P 500
Healthcare, S&P 500 Financials, S&P 500 Information Technology, S&P 500 Communication Services, and S&P 500 Utilities sector indices launched June 28, 1996. The S&P 500 Real Estate sector index was launched September 19, 2016. All information presented prior to an
index’s Launch Date is hypothetical (back-tested), not actual performance. The back-test calculations are based on the same methodology that was in effect on the index Launch Date. However, when creating back-tested history for periods of market anomalies or other periods that
do not reflect the general current market environment, index methodology rules may be relaxed to capture a large enough unive rse of securities to simulate the target market the index is designed to measure or strategy the index is designed to capture . For example, market
capitalization and liquidity thresholds may be reduced. Complete index methodology details are available at www.spglobal.com/spdji. Past performance of the Index is not an indication of future results. Back-tested performance reflects application of an index methodology and
selection of index constituents with the benefit of hindsight and knowledge of factors that may have positively affected its performance, cannot account for all financial risk that may affect results and may be considered to reflect survivor/look ahead bias. Actual returns may differ
significantly from, and be lower than, back-tested returns. Past performance is not an indication or guarantee of future results. Please refer to the methodology for the Index for more details about the index, including the manner in which it is rebalanced, the timing of such rebalancing,
criteria for additions and deletions, as well as all index calculations. Back-tested performance is for use with institutions only; not for use with retail investors.
S&P Dow Jones Indices defines various dates to assist our clients in providing transparency. The First Value Date is the firs t day for which
there is a calculated value (either live or back-tested) for a given index. The Base Date is the date at which the index is set to a fixed value for calculation purposes. The Launch Date designates the date when the values of an index are first considered live: index values provided for
any date or time period prior to the index’s Launch Date are considered back-tested. S&P Dow Jones Indices defines the Launch Date as the date by which the values of an index are known to have been released to the public, for example via the company’s public webs ite or its data
feed to external parties. For Dow Jones-branded indices introduced prior to May 31, 2013, the Launch Date (which prior to May 31, 2013, was termed “Date of introduction”) is set at a date upon which no further changes were permitted to be made t o the index methodology, but that
may have been prior to the Index’s public release date.
Typically, when S&P DJI creates back-tested index data, S&P DJI uses actual historical constituent-level data (e.g., historical price, market capitalization, and corporate action data) in its calculations. As ESG investing is still in early stages of development, certain datapoints used to
calculate S&P DJI’s ESG indices may not be available for the entire desired period of back -tested history. The same data availability issue could be true for other indices as well. In cases when actual data is not available for all relevant historical periods, S&P DJI may employ a
process of using “Backward Data Assumption” (or pulling back) of ESG data for the calculation of back -tested historical performance. “Backward Data Assumption” is a process that applies the earliest actual live data point available for an index constituent company to all prior
historical instances in the index performance. For example, Backward Data Assumption inherently assumes that companies currently not involved in a specific business activity (also known as “product involvement”) were never involved historically and similarly also assumes that companies currently involved in a specific business activity were involved historically too. The Backward Data Assumption allows the
hypothetical back-test to be extended over more historical years than would be feasible using only actual data. For more information on “Backward Data Assumption” please refer to the FAQ. The methodology and factsheets of any index that employs backward assumption in the
back-tested history will explicitly state so. The methodology will include an Appendix with a table setting forth the specific data points and relevant time period for which backward projected data was used.
Index returns shown do not represent the results of actual trading of investable assets/secu rities. S&P Dow Jones Indices maintains the index
and calculates the index levels and performance shown or discussed but does not manage actual assets. Index returns do not re flect payment of any sales charges or fees an investor may pay to purchase the securities underlying the Index or investment funds that are intended to
track the performance of the Index. The imposition of these fees and charges would cause actual and back-tested performance of the securities/fund to be lower than the Index performance shown. As a simple example, if an index returned 10% on a US $100,000 investment
for a 12-month period (or US $10,000) and an actual asset-based fee of 1.5% was imposed at the end of the period on the investment plus accrued interest (or US $1,650), the net return would be 8.35% (or US $8,350) for the year. Over a three-year period, an annual 1.5% fee
taken at year end with an assumed 10% return per year would result in a cumulative gross return of 33.10%, a total fee of US $5,375, and a cumulative net return of 27.2% (or US $27,200).

What Happened to the Index Effect? September 2021
RESEARCH | Core 25
GENERAL DISCLAIMER
© 2021 S&P Dow Jones Indices. All rights reserved. S&P, S&P 500, S&P 500 LOW VOLATILITY INDEX, S&P 100, S&P COMPOSITE 1500, S&P 400, S&P MIDCAP 400, S&P 600, S&P SMALLCAP 600, S&P GIVI, GLOBAL TITANS, DIVIDEND ARISTOCRATS, S&P TARGET
DATE INDICES, S&P PRISM, S&P STRIDE, GICS, SPIVA, SPDR and INDEXOLOGY are registered trademarks of S&P Global, Inc. (“S&P Global”) or its affiliates. DOW JONES, DJ, DJIA, THE DOW and DOW JONES INDUSTRIAL AVERAGE are registered trademarks of Dow
Jones Trademark Holdings LLC (“Dow Jones”). These trademarks together with others have been licensed to S&P Dow Jones Indices LLC. Redistribution or reproduction in whole or in part are prohibited without written permission of S&P Dow Jones Indices LLC. This document
does not constitute an offer of services in jurisdictions where S&P Dow Jones Indices LLC, S&P Global, Dow Jones or their respective affiliates (collectively “S&P Dow Jones Indices”) do not have the necessary licenses. Except for certain custom index calculation services, all
information provided by S&P Dow Jones Indices is impersonal and not tailored to the needs of any person, entity or group of p ersons. S&P Dow Jones Indices receives compensation in connection with licensing its indices to third parties and providing custom calculation services.
Past performance of an index is not an indication or guarantee of future results.
It is not possible to invest directly in an index. Exposure to an asset class represented by an index may be available through investable instruments based on that index. S&P Dow Jones Indices does not sponsor, endorse, sell, promote or manage any investme nt fund or other
investment vehicle that is offered by third parties and that seeks to provide an investment return based on the performance o f any index. S&P Dow Jones Indices makes no assurance that investment products based on the index will accurately track index performance or provide
positive investment returns. S&P Dow Jones Indices LLC is not an investment advisor, and S&P Dow Jones Indices makes no repre sentation regarding the advisability of investing in any such investment fund or other investment vehicle. A decision to invest in any such investment
fund or other investment vehicle should not be made in reliance on any of the statements set forth in this document. Prospect ive investors are advised to make an investment in any such fund or other vehicle only after carefully considering the risks associated with investing in such
funds, as detailed in an offering memorandum or similar document that is prepared by or on behalf of the issuer of the invest ment fund or other investment product or vehicle. S&P Dow Jones Indices LLC is not a tax advisor. A tax advisor should be consulted to evaluate the
impact of any tax-exempt securities on portfolios and the tax consequences of making any particular investment decision. Inclusion of a security within an index is not a recommendation by S&P Dow Jones Indices to buy, sell, or hold such security, nor is it considered to be
investment advice. Closing prices for S&P Dow Jones Indices’ US benchmark indices are calculated by S&P Dow Jones Indices based on the closing price of the individual constituents of the index as set by their primary exchange. Closing prices are received by S&P Dow Jones
Indices from one of its third party vendors and verified by comparing them with prices from an alternative vendor. The ven dors receive the closing price from the primary exchanges. Real-time intraday prices are calculated similarly without a second verification.
These materials have been prepared solely for informational purposes based upon information generally available to the public and from
sources believed to be reliable. No content contained in these materials (including index data, ratings, credit -related analyses and data, research, valuations, model, software or other application or output therefrom) or any part there of (“Content”) may be modified, reverse-
engineered, reproduced or distributed in any form or by any means, or stored in a database or retrieval system, without the p rior written permission of S&P Dow Jones Indices. The Content shall not be used for any unlawful or unauthorized purposes. S&P Dow Jones Indices and its third-party data providers and licensors (collectively “S&P Dow Jones Indices Parties”) do not guarantee the accuracy, completeness ,
timeliness or availability of the Content. S&P Dow Jones Indices Parties are not responsible for any errors or omissions, regardless of the cause, for the results obtained from the use of the Content. THE CONTENT IS PROVIDED ON AN “AS IS” BASIS. S&P DOW JONES
INDICES PARTIES DISCLAIM ANY AND ALL EXPRESS OR IMPLIED WARRANTIES, INCLUDING, BUT NOT LIMITED TO, ANY WARRANTIES OF MERCHANTABILITY OR FITNESS FOR A PARTICULAR PURPOSE OR USE, FREEDOM FROM BUGS, SOFTWARE
ERRORS OR DEFECTS, THAT THE CONTENT’S FUNCTIONING WILL BE UNINTERRUPTED OR THAT THE CONTENT WILL OPERATE WITH ANY SOFTWARE OR HARDWARE CONFIGURATION. In no event shall S&P Dow Jones Indices Parties be liable to any party for any
direct, indirect, incidental, exemplary, compensatory, punitive, special or consequential damages, costs, expenses, legal fee s, or losses (including, without limitation, lost income or lost profits and opportunity costs) in connection with any use of the Content even if advised of the
possibility of such damages.
S&P Global keeps certain activities of its various divisions and business un its separate from each other in order to preserve the independence and objectivity of their respective activities. As a result, certain divisions and business units of S&P Global may have info rmation that is not
available to other business units. S&P Global has established policies and procedures to maintain the confidentiality of certain non-public information received in connection with each analytical process.
In addition, S&P Dow Jones Indices provides a wide range of services to, or relating to, many o rganizations, including issuers of securities,
investment advisers, broker-dealers, investment banks, other financial institutions and financial intermediaries, and accordingly may receive fees or other economic benefits from those organizations, including organizations whose securities or services they may recommend, rate,
include in model portfolios, evaluate or otherwise address.
The Global Industry Classification Standard (GICS®) was developed by and is the exclusive property and a trademark of S&P and MSCI. Neither MSCI, S&P nor any other party involved in making or compiling any GICS classifications makes any express or implied warranties or
representations with respect to such standard or classification (or the results to be obtained by the use thereof), and all such parties hereby expressly disclaim all warranties of originality, accuracy, completeness, merchantability or fitness for a particular purpose with respect to any
of such standard or classification. Without limiting any of the foregoing, in no event shall MSCI, S&P, any of their affiliates or any third party involved in making or compiling any GICS classifications have any liability for any direct, indirect, special, punitive, consequential or any other
damages (including lost profits) even if notified of the possibility of such damages.