Embed Size (px)
Citation preview

2006-2015
MO IBRAHIM FOUNDATION
2016 IBRAHIM INDEX OF AFRICAN GOVERNANCE
INDEX REPORT
A DECADE OF AFRICAN GOVERNANCE
Over the past decade, the continental average score in Overall Governance has improved by one point.
Since 2006, 37 countries, hosting 70% of African citizens, have improved in Overall Governance.
The greatest improver at the Overall Governance level over the decade is Côte d’Ivoire (+13.1), followed by Togo (+9.7), Zimbabwe (+9.7), Liberia (+8.7) and Rwanda (+8.4).
Even if Ghana and South Africa feature in the top ten performing countries in Overall Governance in 2015, they are also the eighth and tenth most deteriorated over the decade.
At the Overall Governance level, the three highest scoring countries in 2015 are Mauritius, Botswana and Cabo Verde, and the three most improved over the decade are Côte d’Ivoire, Togo and Zimbabwe.
Safety & Rule of Law is the only category of the Index to register a negative trend over the decade, falling by -2.8 score points in the past ten years.
In 2015 almost two-thirds of African citizens live in a country where Safety & Rule of Law has deteriorated over the last ten years.
Accountability is the lowest scoring (35.1) of the 14 sub-categories in 2015.
The continental average score for the Corruption & Bureaucracy indicator has declined by -8.7 points over the last decade, with 33 countries registering deterioration, 24 of them falling to their worst ever score in 2015.
A large majority (78%) of African citizens live in a country that has improved in Participation & Human Rights over the past decade.
Progress over the decade in Participation and Human Rights (+2.4 points) has been driven by Gender (+4.3) and Participation (+3.0), while Rights (-0.2) registered a slight decline.
Six of the ten highest scoring countries in Rights have registered deterioration in the past ten years.
Two-thirds of the countries on the continent, representing 67% of the African population, have shown deterioration in Freedom of Expression over the past ten years.
2006-2015
MO IBRAHIM FOUNDATION
2016 IBRAHIM INDEX OF AFRICAN GOVERNANCE
INDEX REPORT
A DECADE OF AFRICAN GOVERNANCE


Contents
Foreword from Mo Ibrahim
The Ibrahim Index of African Governance: 2007-2016
General overview
Index evolution 2007-2016
SPOTLIGHT – Afrobarometer in the IIAG: a key data source
IIAG framework: Safety & Rule of Law and Participation & Human Rights in 2007
IIAG framework: Safety & Rule of Law and Participation & Human Rights in 2016
IIAG framework: Sustainable Economic Opportunity and Human Development in 2007
IIAG framework: Sustainable Economic Opportunity and Human Development in 2016
The Ibrahim Index of African Governance: Reading the Results
OVERALL GOVERNANCE
A Decade of African Governance: Overall Governance
Key findings
Ten-year country trends
Banding: from 2006 to 2015
Summary of African average scores & trends 2006-2015
2006-2015 average trend & score Overall Governance & category level
Three most improved & three most deteriorated countries 2006-2015
SAFETY & RULE OF LAW
A Decade of African Governance: Safety & Rule of Law
Key findings
Ten-year country trends
Banding: from 2006 to 2015
Personal Safety sub-category: key findings
SPOTLIGHT – Afrobarometer: citizen perceptions on Personal Safety
National Security sub-category: key findings
Accountability sub-category: key findings
SPOTLIGHT – Corruption: still a worrying trend
Rule of Law sub-category: key findings
SPOTLIGHT – Safety & Rule of Law and Sustainable Economic Opportunity: a strong correlation
PARTICIPATION & HUMAN RIGHTS
A Decade of African Governance: Participation & Human Rights
Key findings
Ten-year country trends
Banding: from 2006 to 2015
Participation sub-category: key findings
SPOTLIGHT – A better assessment of Participation
SPOTLIGHT – Measuring civil society space
Rights sub-category: key findings
Gender sub-category: key findings
SUSTAINABLE ECONOMIC OPPORTUNITY
A Decade of African Governance: Sustainable Economic Opportunity
Key findings
Ten-year country trends
Banding: from 2006 to 2015
Infrastructure sub-category: key findings
SPOTLIGHT – Electricity Infrastructure is holding back further progress in Infrastructure
Public Management sub-category: key findings
SPOTLIGHT – Oil exporters: a lost opportunity
Business Environment sub-category: key findings
SPOTLIGHT – Employment: diverging data
Rural Sector sub-category: key findings
HUMAN DEVELOPMENT
A Decade of African Governance: Human Development
Key findings
Ten-year country trends
Banding: from 2006 to 2015
Education sub-category: key findings
SPOTLIGHT – Afrobarometer: citizen perceptions on Education Provision and Basic Health Services
Health sub-category: key findings
Welfare sub-category: key findings
SPOTLIGHT – Afrobarometer: citizen perceptions on inequality
SPOTLIGHT – Measuring poverty
A Decade of African Governance: Regional Performance
TRAJECTORIES
Peak Performance
Is the best already behind us?
Balance
Balance is key
INDICATORS
Framework of the 2016 IIAG
Indicators: 2015 Scores & Trends 2006-2015
Indicators: Definitions & Sources
ANNEX
Methodology
Board of Directors
Research Team & Advisory Council
Notes
6
7
7
8
9
10
11
12
13
14
17
18
18
19
20
22
22
23
25
26
26
27
28
30
30
31
32
33
34
35
37
38
38
39
40
42
42
43
44
45
47
48
48
49
50
52
53
54
55
56
56
58
61
62
62
63
64
66
66
67
68
68
69
70
73
74
74
78
78
83
84
86
88
95
96
100
102
103
6
Foreword from Mo Ibrahim
Mo IbrahimFounder and Chair of the Mo Ibrahim Foundation (MIF)
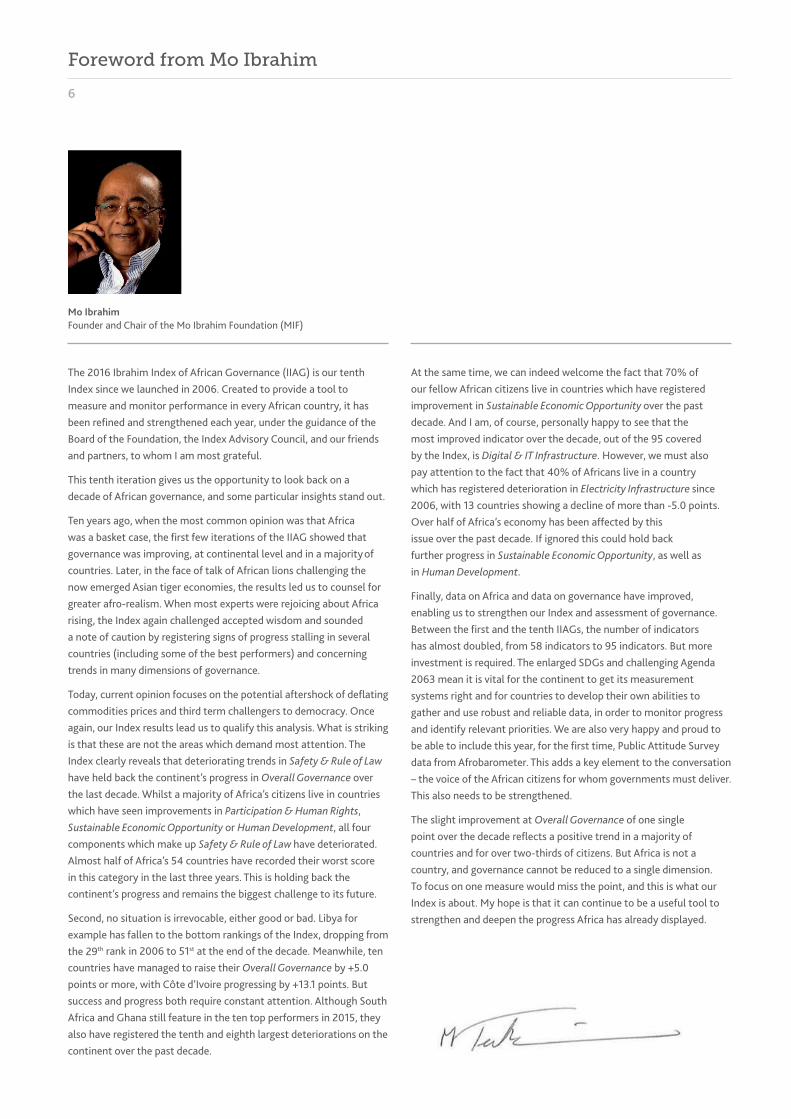
At the same time, we can indeed welcome the fact that 70% of our fellow African citizens live in countries which have registered improvement in Sustainable Economic Opportunity over the past decade. And I am, of course, personally happy to see that the most improved indicator over the decade, out of the 95 covered by the Index, is Digital & IT Infrastructure. However, we must also pay attention to the fact that 40% of Africans live in a country which has registered deterioration in Electricity Infrastructure since 2006, with 13 countries showing a decline of more than -5.0 points. Over half of Africa’s economy has been affected by this issue over the past decade. If ignored this could hold back further progress in Sustainable Economic Opportunity, as well as in Human Development.
Finally, data on Africa and data on governance have improved, enabling us to strengthen our Index and assessment of governance. Between the first and the tenth IIAGs, the number of indicators has almost doubled, from 58 indicators to 95 indicators. But more investment is required. The enlarged SDGs and challenging Agenda 2063 mean it is vital for the continent to get its measurement systems right and for countries to develop their own abilities to gather and use robust and reliable data, in order to monitor progress and identify relevant priorities. We are also very happy and proud to be able to include this year, for the first time, Public Attitude Survey data from Afrobarometer. This adds a key element to the conversation – the voice of the African citizens for whom governments must deliver. This also needs to be strengthened.
The slight improvement at Overall Governance of one single point over the decade reflects a positive trend in a majority of countries and for over two-thirds of citizens. But Africa is not a country, and governance cannot be reduced to a single dimension. To focus on one measure would miss the point, and this is what our Index is about. My hope is that it can continue to be a useful tool to strengthen and deepen the progress Africa has already displayed.
The 2016 Ibrahim Index of African Governance (IIAG) is our tenth Index since we launched in 2006. Created to provide a tool to measure and monitor performance in every African country, it has been refined and strengthened each year, under the guidance of the Board of the Foundation, the Index Advisory Council, and our friends and partners, to whom I am most grateful.
This tenth iteration gives us the opportunity to look back on a decade of African governance, and some particular insights stand out.
Ten years ago, when the most common opinion was that Africa was a basket case, the first few iterations of the IIAG showed that governance was improving, at continental level and in a majority of countries. Later, in the face of talk of African lions challenging the now emerged Asian tiger economies, the results led us to counsel for greater afro-realism. When most experts were rejoicing about Africa rising, the Index again challenged accepted wisdom and sounded a note of caution by registering signs of progress stalling in several countries (including some of the best performers) and concerning trends in many dimensions of governance.
Today, current opinion focuses on the potential aftershock of deflating commodities prices and third term challengers to democracy. Once again, our Index results lead us to qualify this analysis. What is striking is that these are not the areas which demand most attention. The Index clearly reveals that deteriorating trends in Safety & Rule of Law have held back the continent’s progress in Overall Governance over the last decade. Whilst a majority of Africa’s citizens live in countries which have seen improvements in Participation & Human Rights, Sustainable Economic Opportunity or Human Development, all four components which make up Safety & Rule of Law have deteriorated. Almost half of Africa’s 54 countries have recorded their worst score in this category in the last three years. This is holding back the continent’s progress and remains the biggest challenge to its future.
Second, no situation is irrevocable, either good or bad. Libya for example has fallen to the bottom rankings of the Index, dropping from the 29th rank in 2006 to 51st at the end of the decade. Meanwhile, ten countries have managed to raise their Overall Governance by +5.0 points or more, with CÔte d’Ivoire progressing by +13.1 points. But success and progress both require constant attention. Although South Africa and Ghana still feature in the ten top performers in 2015, they also have registered the tenth and eighth largest deteriorations on the continent over the past decade.

2016 IIAG: INDEX REPORT
7
The Ibrahim Index of African Governance: 2007-2016
Categories
Sub-
cate
gorie
s
OVERALLGOVERNANCE
SAFETY & RULE OF LAW
PARTICIPATION & HUMAN RIGHTS
SUSTAINABLE ECONOMIC OPPORTUNITY
HUMANDEVELOPMENT
Rule
of L
aw
Acc
ount
abili
ty
Pers
onal
Saf
ety
Nat
iona
l Sec
urit
y
Publ
ic M
anag
emen
t
Busi
ness
Env
ironm
ent
Infr
astr
uctu
re
Rura
l Sec
tor
Wel
fare
Educ
atio
n
Hea
lth
Part
icip
atio
n
Righ
ts
Gen
der
Published since 2007, the Ibrahim Index of African Governance (IIAG) was created to provide a quantifiable tool to measure and monitor governance performance in African countries, to assess its progress over time and to support the development of effective and responsive policy solutions. These aims remain the same and the IIAG now represents the most comprehensive collection of data on African governance. In order to provide a broad, documented and impartial picture of governance performance in every African country, the IIAG compiles a large amount of data issued by diverse sources.
The entire Index time series is updated on an annual basis to ensure that each new IIAG provides the most accurate data
available. This process ensures that the Index is the most robust and up-to-date dashboard of the state of governance in every African country.
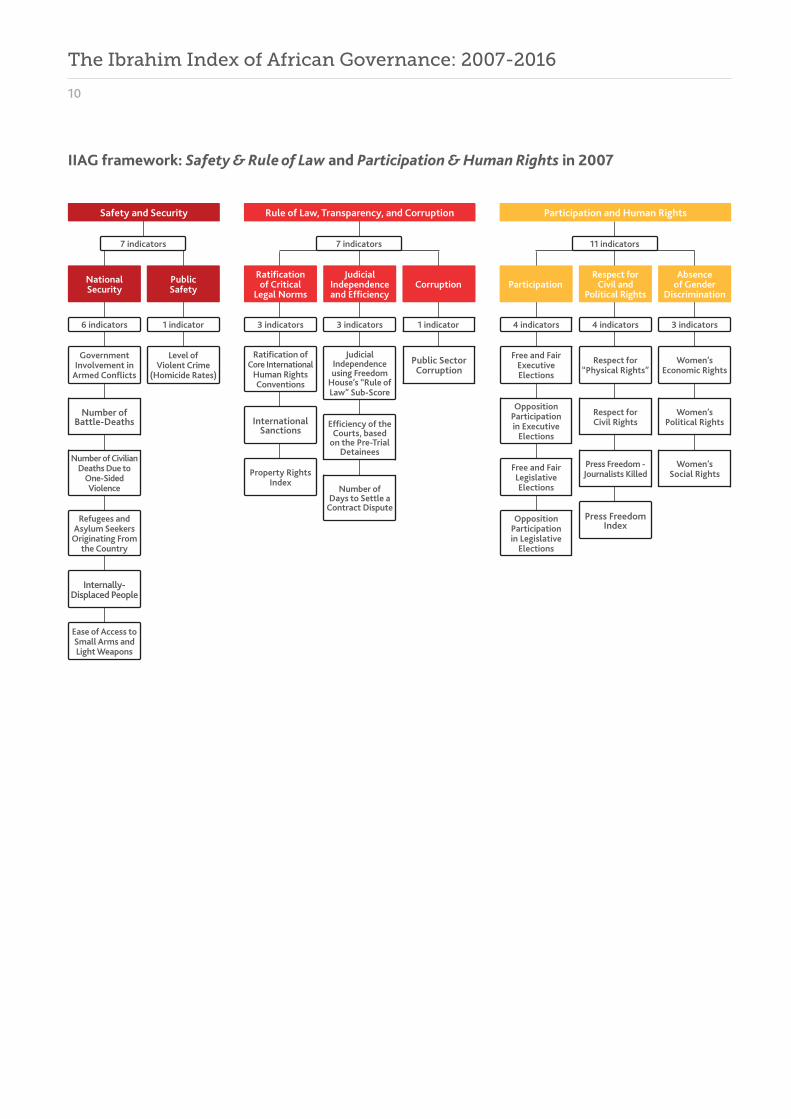
As assessed by the IIAG, governance is defined as the provision of the political, social and economic public goods and services that every citizen has the right to expect from their state, and that a state has the responsibility to deliver to its citizens. The IIAG focuses on measuring outputs and outcomes of policy, rather than declarations of intent, de jure statutes and levels of expenditure. This is reflected in the IIAG tree diagram below, which outlines the structure and issues covered by the Index.
General overview
8
2007 IIAG
54countries(entire continent)
0
54
Country coverage
2016 IIAG
Country coverage
48countries(sub-Saharan Africa)
0
54
Categories
5Indicators
58
Data types
Qualitative Assessment (QA)
Opinion Survey (OS)
Official Data (OD)
3
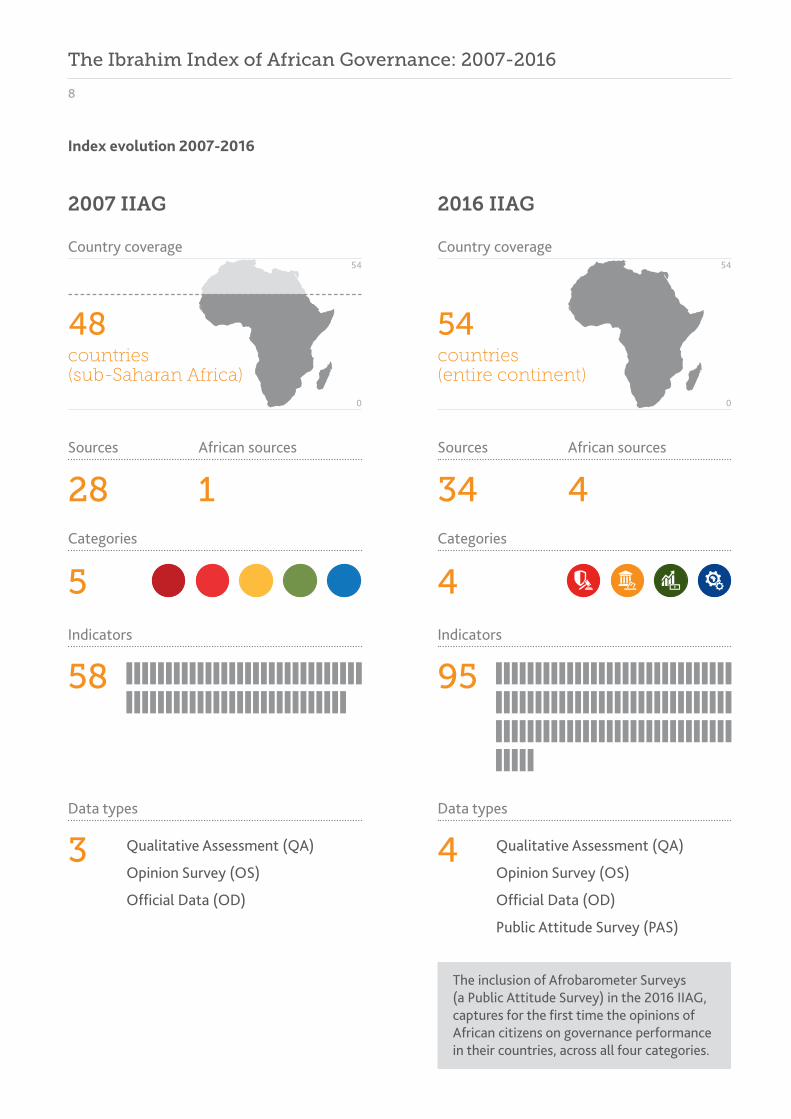
The inclusion of Afrobarometer Surveys (a Public Attitude Survey) in the 2016 IIAG, captures for the first time the opinions of African citizens on governance performance in their countries, across all four categories.
Qualitative Assessment (QA)
Opinion Survey (OS)
Official Data (OD)
Public Attitude Survey (PAS)
Data types
4
Sources African sources
28 1Categories
4Indicators
95
Sources African sources
34 4
Index evolution 2007-2016
The Ibrahim Index of African Governance: 2007-2016

2016 IIAG: INDEX REPORT
9
The 2016 IIAG is the tenth iteration of the Index. Since its inception in 2007, the Index has evolved to better measure governance on the continent. As the data landscape has evolved and strengthened over the decade, so has the Index, allowing a wider perspective on governance than was possible ten years ago. The number of indicators has almost doubled from 58 in the 2007 IIAG to 95 in the 2016 IIAG. Indicators have also been strengthened. Nearly half of the 95 indicators in the 2016 IIAG are clustered to incorporate different types of data from diverse sources to give a more nuanced and accurate perspective of governance issues.
The Index has also expanded to include key governance issues, and ensure that it reflects citizens’ perceptions of governance. For the first time, the 2016 IIAG incorporates the experiences and perspectives of citizens by using survey data from Afrobarometer. These Public Attitude Surveys constitute a fourth data type in the Index and provide a more holistic and citizen-centric assessment of governance. Moreover, the inclusion of Afrobarometer data (see Spotlight) covers citizen perception measures on poverty, inequality and employment, all being key governance issues for which expert data are still mostly missing. Together with the African Integrity Indicators, which were included in 2014, this means that just over 17% of data in the Index is now provided by African sources.
The tenth iteration of the IIAG provides a strengthened Participation sub-category. This assesses participation through more than the presence or regularity of executive elections, introducing greater nuance in how African citizens take part in political processes, alongside new measures of civil society.
Enhancing data quality on Africa is one of the Foundation’s core goals. To this end, the Foundation has supported two large-scale data collection projects over the past five years: Afrobarometer and Africa Integrity Indicators. Both projects collect data on the ground and seek to improve measures key to governance and everyday lives of African citizens, especially around issues of democracy, poverty and participation, which are still not captured well enough by traditional data.
The IIAG has also widened its geographical coverage, with the 2016 IIAG measuring governance in all 54 African countries, whereas ten years ago the 2007 IIAG only covered sub-Saharan Africa countries. In 2009, the Index was widened to include the entire continent. Following the split of South Sudan from Sudan in 2011, both countries were excluded for data availability reasons, and were reincluded as separate new countries in the 2015 IIAG.
The 2016 IIAG enables a better assessment and comparison of the scores and trends of the 54 African countries than ten years ago. With 16 years of data (available from the year 2000), it allows country and regional findings to be explored and is a valuable tool to assess and support complex policy decisions. The Foundation will continue to update and improve the IIAG to ensure its relevance.
Afrobarometer in the IIAG: a key data source
Afrobarometer is a pan-African research network, started in 1999, that conducts Public Attitude Surveys on democracy, governance, economic conditions and related issues in 37 countries1 in Africa. Led by Professor Gyimah-Boadi, Executive Director of the Ghana Center for Democratic Development and member of the IIAG Advisory Council, it is the world’s leading research project on issues that affect African citizens. Core donors have included the Swedish International Development Cooperation Agency (SIDA), the UK Department for International Development (DfID), the United States Agency for International Development (USAID) and the World Bank (WB).
Since 2011, the Mo Ibrahim Foundation has been partnering with Afrobarometer as part of our objective to strengthen the collection of Public Attitude Survey data in Africa. This partnership represents the Foundation’s biggest financial commitment to a data project to date, totalling $2.5 million.
For the first time since its inception, the 2016 IIAG is able to include Public Attitude Survey data from Afrobarometer. The IIAG threshold for inclusion requires that data cover at least 33 of the 54 countries on the continent and provide at least two years’ worth of data for these countries since 2000; these criteria were only met at the end of the most recent Afrobarometer survey round in 2015.
Public Attitude Survey data from Afrobarometer constitutes a new data type to the Index. They provide 18 of the 166 measures used to calculate the IIAG, and cover 13 indicators spread across all four categories of the Index. For the 37 African countries surveyed, these data provide a key insight into citizens’ perceptions of how effectively the government is delivering public goods and services, which is the basic aim of the IIAG.
Interestingly, in some Afrobarometer measures country results are diverging from scores registered by other data sources. The data also reveal interesting trends, particularly in governance dimensions that the IIAG has not previously been able to measure, such as crime in the home and neighbourhood, the quality of basic health services and income inequality.
1 Algeria, Benin, Botswana, Burkina Faso, Burundi, Cabo Verde, Cameroon, Côte d’Ivoire, Egypt, Ethiopia, Gabon, Ghana, Guinea, Kenya, Lesotho, Liberia, Madagascar, Malawi, Mali, Mauritius, Morocco, Mozambique, Namibia, Niger, Nigeria, São Tomé & Príncipe, Senegal, Sierra Leone, South Africa, Sudan, Swaziland, Tanzania, Togo, Tunisia, Uganda, Zambia and Zimbabwe.
SPOTLIGHT
10
IIAG framework: Safety & Rule of Law and Participation & Human Rights in 2007
Rule of Law, Transparency, and Corruption
7 indicators
Ratification of Critical
Legal Norms
Judicial Independence and Efficiency
Corruption
3 indicators 3 indicators 1 indicator
Public Sector Corruption
International Sanctions
Efficiency of the Courts, based
on the Pre-Trial Detainees
Number of Days to Settle a
Contract Dispute
Ratification of Core International
Human Rights Conventions
Judicial Independence using Freedom
House’s “Rule of Law” Sub-Score
Property Rights Index
Safety and Security
7 indicators
6 indicators 1 indicator
National Security
Government Involvement in
Armed Conflicts
Level of Violent Crime
(Homicide Rates)
Number of Battle-Deaths
Number of Civilian Deaths Due to
One-Sided Violence
Refugees and Asylum Seekers
Originating From the Country
Internally-Displaced People
Ease of Access to Small Arms and Light Weapons
Public Safety
Participation and Human Rights
11 indicators
ParticipationRespect for
Civil and Political Rights
Absence of Gender
Discrimination
4 indicators 4 indicators 3 indicators
Free and Fair Executive Elections
Women’s Economic Rights
Women’s Political Rights
Opposition Participation in Executive
Elections
Opposition Participation in Legislative
Elections
Free and Fair Legislative Elections
Women’s Social Rights
Press Freedom Index
Respect for “Physical Rights”
Respect for Civil Rights
Press Freedom - Journalists Killed
The Ibrahim Index of African Governance: 2007-2016

2016 IIAG: INDEX REPORT
11
IIAG framework: Safety & Rule of Law and Participation & Human Rights in 2016
SAFETY & RULE OF LAW PARTICIPATION & HUMAN RIGHTS
Rule of Law Accountability Personal Safety National Security Participation Rights Gender
25 indicators
8 indicators5 indicators 6 indicators 6 indicators 5 indicators 5 indicators
17 indicators
7 indicators
Safety of the Person. . . . . . . . . . . . . . . . . .Safety of the PersonEIUNeighbourhood SafetyAFR
Police Services. . . . . . . . . . . . . . . . . .Police ServicesWEFPolice Misconduct InvestigationGI
Social UnrestEIU
Crime. . . . . . . . . . . . . . . . . .Violent CrimeEIUResidential CrimeAFRCrime ReductionAFR
Political Violence. . . . . . . . . . . . . . . . . .Government Violence against CiviliansACLEDPolitical ViolencePTS
Human TraffickingUSDS
Government Involvement in Armed ConflictUCDP
Domestic Armed ConflictEIU
Violence by Non-state ActorsACLED
Cross-border TensionsEIU
Internally Displaced PeopleIDMC
Political RefugeesUNHCR
Political Participation. . . . . . . . . . . . . . . . . .Political ParticipationEIUPolitical PluralismFHPolitical Freedom*AFR
Civil Society Participation. . . . . . . . . . . . . . . . . .Civil Society ParticipationBSFreedom of NGOs*GI
Free & Fair Elections. . . . . . . . . . . . . . . . . .Free & Fair ElectionsBSFree & Fair Executive ElectionsCDDElectoral ProcessFH
Election Monitoring Agencies. . . . . . . . . . . . . . . . . .Election Monitoring Agency Independence GIElection Monitoring Agency ReportingGI
Legitimacy of Political ProcessBS
Gender Equality. . . . . . . . . . . . . . . . . .Gender EqualityAfDBGender EqualityWB
Women’s Political Participation. . . . . . . . . . . . . . . . . .Women in ParliamentIPUWomen in Ministerial Positions* GI/WB
Gender Balance in EducationUNESCO
Women’s Labour Force ParticipationWB
Workplace Gender EqualityGI
Women in the JudiciaryGI
Laws on Violence against WomenOECD
Freedom of Expression. . . . . . . . . . . . . . . . . .Freedom of ExpressionBSPress Freedom FHMedia Freedom RSFCensorship*GI
Freedom of Association & Assembly. . . . . . . . . . . . . . . . . .Freedom of Association & AssemblyBSFreedom of Association*GI
Civil Liberties. . . . . . . . . . . . . . . . . .Protection of Civil LibertiesBSCivil LibertiesFH
Human Rights ConventionsUNOLA/OHCHR
Human Rights ViolationsEIU
Access to Information. . . . . . . . . . . . . . . . . .Access to Public InformationGIAccess to Legislative InformationGI
Online ServicesUNDESA
Public Sector Accountability & Transparency. . . . . . . . . . . . . . . . . .Public Sector Accountability & Transparency AfDBPublic Sector Accountability & Transparency WB
Accountability of Public Officials. . . . . . . . . . . . . . . . . .Accountability of Public OfficialsEIUAbuse of OfficeBS
Corruption in Government & Public OfficialsEIU
Corruption & BureaucracyWB
Diversion of Public FundsWEF
Corruption Investigation. . . . . . . . . . . . . . . . . .Public Sector Corruption BodiesGICorruption InvestigationGIFighting CorruptionAFR
Judicial Independence. . . . . . . . . . . . . . . . . .Independent JudiciaryBSJudicial AutonomyWEFJudicial Independence*GI
Judicial Process. . . . . . . . . . . . . . . . . .Judicial ProcessEIUJudicial DecisionsGI
Property Rights. . . . . . . . . . . . . . . . . .Property Rights & RegulationsBSProperty FreedomHERProtection of Property RightsWEFProperty Rights*AfDB/WB
Transfers of PowerEIU
SanctionsCDD
* Sub-indicator: contains underlying variables
IndicatorSource acronym
Clustered indicator. . . . . . . . . . . . . . . . . . Sub-indicatorSource acronym
Key
12
Sustainable Economic Opportunity
12 indicators
Wealth Creation
Macroeconomic Stability and
Financial Integrity
The Arteries of Commerce
Environmental Sensitivity
2 indicators 4 indicators 5 indicators 1 indicator
GDP per capita (constant
2000 US$)
GDP per capita growth
(annual %)
Density of Road Network
(km/sq. km)
Pilot 2006 Environmental
Performance Index
Electricity Outages (number of
days per year)
Mobile Phone Subscribers per 100 Inhabitants
Computer Usage per 100
Inhabitants
Internet Usage per 100
Inhabitants
Reliability of Financial Institutions (Contract
Intensive Money)
Inflation
Deficits/Surplus as a % of GDP
Number of Days to Start
a Business
Human Development
21 indicators
Poverty Health and Sanitation Education
3 indicators 11 indicators 7 indicators
Poverty Rate at $1 per person
per day
Poverty Rate at National Poverty Line
Adult Literacy Rate
Adult Literacy Rate, Female
Pupil-Teacher Ratio, Primary
Progression to Secondary School (%)
Access to Doctors
(physicians, density per 1,000 people)
Immunization, measles (% of children ages
12-23 months)
Primary School Completion Rate
(% of relevant age group)
Primary Completion Rate,
Female (% of relevant age group)
Inequality (GINI Index)
Undernourishment (% of population)
Immunization, DPT (% of children ages
12-23 months)
People living with HIV, 15-49
years old (%)
Incidence of Tuberculosis
(per 100,000 people)
Access to Drinking Water (% of overall
population)
Access to Nurses (nurses, density per
1,000 people)
Life Expectancy at Birth (years)
Infant Mortality (per 1,000 live births)
Maternal Mortality (per 100,000
live births)
Ratio of Girls to Boys in Primary and Secondary Education (%)
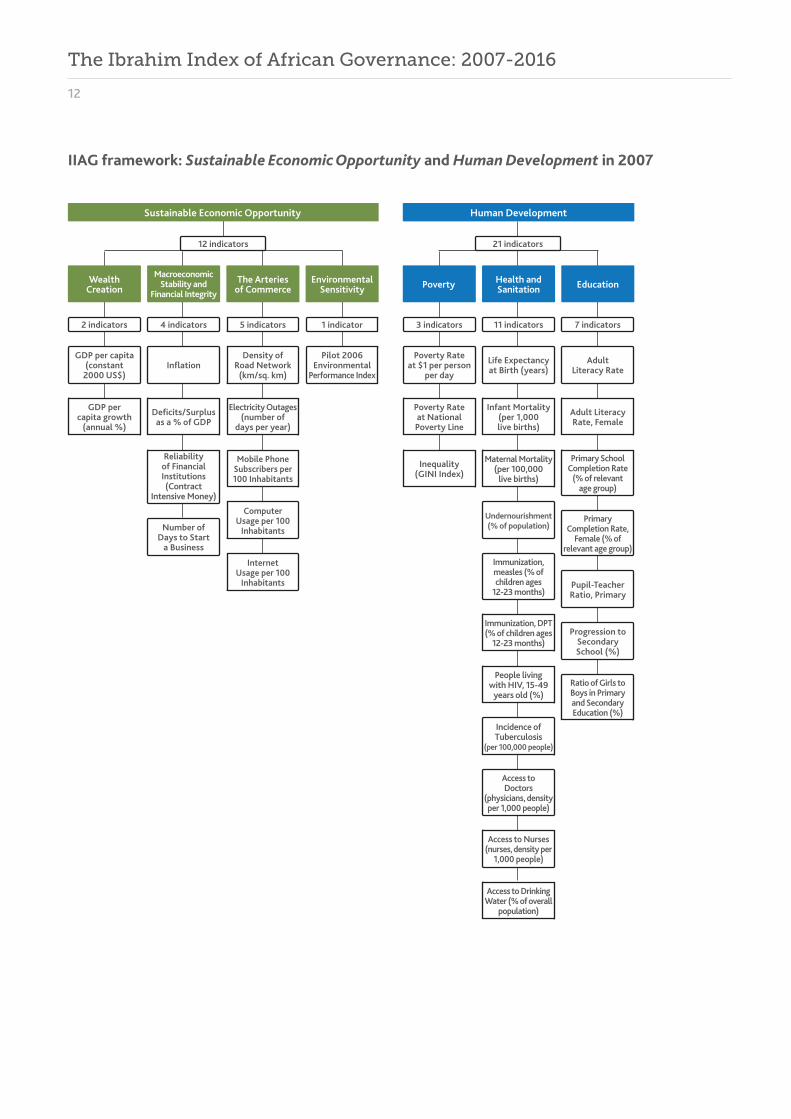
IIAG framework: Sustainable Economic Opportunity and Human Development in 2007
The Ibrahim Index of African Governance: 2007-2016

2016 IIAG: INDEX REPORT
13
HUMAN DEVELOPMENTSUSTAINABLE ECONOMIC OPPORTUNITY
Public Management Business Environment Infrastructure Rural Sector Welfare Education Health
8 indicators 6 indicators
27 indicators
5 indicators 8 indicators 9 indicators
26 indicators
8 indicators 9 indicators
Statistical CapacityWB
Public Administration. . . . . . . . . . . . . . . . . .Public AdministrationAfDBPublic AdministrationWB
DiversificationAfDB/OECD/UNDP
Budget Management. . . . . . . . . . . . . . . . . .Budget ManagementAfDBBudget ManagementWB
Ratio of Revenue to ExpenditureAfDB/AUC/UNECA
Fiscal Policy. . . . . . . . . . . . . . . . . .Fiscal PolicyAfDBFiscal PolicyWB
Revenue Mobilisation. . . . . . . . . . . . . . . . . .Taxation CapacityICTDRevenue Collection*AfDB/WB
Transparency of State-owned CompaniesGI
Investment Climate HER
Competition. . . . . . . . . . . . . . . . . .CompetitionBSTendering ProcessGICompetitive Environment*AfDB/WB
Bureaucracy & Red TapeEIU
Customs ProceduresWEF
Soundness of BanksWEF
Employment CreationAFR
Basic Health ServicesAFR
Public Health CampaignsGI
Child MortalityIGME
Maternal MortalityMMEIG
Access to Sanitation. . . . . . . . . . . . . . . . . .Access to Improved SanitationWHO/UNICEFOpen Defecation SanitationWHO/UNICEF
UndernourishmentWB
Disease. . . . . . . . . . . . . . . . . .MalariaWHOTuberculosisWHO
Immunisation. . . . . . . . . . . . . . . . . .Immunisation against MeaslesWBImmunisation against DPTWBImmunisation against Hepatitis BWHO
Anti-Retroviral Treatment (ART) Provision. . . . . . . . . . . . . . . . . .ART ProvisionUNAIDSART Provision for Pregnant WomenUNAIDS
Education ProvisionAFR
Education QualityBS
Educational System ManagementWEF
Human Resources in Primary SchoolsUNESCO
Primary School CompletionWB
Secondary School EnrolmentUNESCO
Tertiary Education EnrolmentUNESCO
LiteracyUNESCO
Welfare Services . . . . . . . . . . . . . . . . . .Welfare ServicesAfDBWelfare ServicesWB
Social Safety NetsBS
Social Protection & Labour. . . . . . . . . . . . . . . . . .Social Protection & LabourAfDBSocial Protection & LabourWB
Social ExclusionBS
Poverty. . . . . . . . . . . . . . . . . .Living ConditionsAFRFood DeprivationAFRWater DeprivationAFRCooking Fuel DeprivationAFR
Poverty Reduction Priorities. . . . . . . . . . . . . . . . . .Living Standards of the PoorAFREquity of Public Resource Use*AfDB/WB
Narrowing Income GapsAFR
Environmental PolicyBS
Environmental Sustainability. . . . . . . . . . . . . . . . . .Environmental SustainabilityAfDBEnvironmental SustainabilityWB
Rural Business Climate. . . . . . . . . . . . . . . . . .Investment Climate for Rural BusinessesIFADRural Financial Services DevelopmentIFADAgricultural Input & Produce MarketsIFAD
Rural Development ResourcesIFAD
Agricultural Support SystemIFAD
Agricultural Policy CostsWEF
Rural Land & Water. . . . . . . . . . . . . . . . . .Access to LandIFADAccess to Water for AgricultureIFAD
Engagement with Rural Organisations. . . . . . . . . . . . . . . . . .Framework for Rural OrganisationsIFADDialogue between Government & Rural OrganisationsIFAD
Equal Representation in Rural AreasIFAD
Rural Accountability & Transparency IFAD
Transport Infrastructure. . . . . . . . . . . . . . . . . .Road NetworkWEFRoad & Bridge MaintenanceAFRRail NetworkEIUAir Transport*WEF/GI
Electricity Infrastructure. . . . . . . . . . . . . . . . . .Electricity SupplyWEFReliable Electricity SupplyAFR
Digital & IT Infrastructure. . . . . . . . . . . . . . . . . .IT InfrastructureEIUMobile Phone SubscribersITUHousehold ComputersITUHousehold Internet AccessITU
Access to Water. . . . . . . . . . . . . . . . . .Access to Piped WaterWHO/UNICEFAccess to Improved WaterWHO/UNICEF
Water & Sanitation ServicesAFR
IIAG framework: Sustainable Economic Opportunity and Human Development in 2016
* Sub-indicator: contains underlying variables
IndicatorSource acronym
Clustered indicator. . . . . . . . . . . . . . . . . . Sub-indicatorSource acronym
Key

14
The Ibrahim Index of African Governance: Reading the Results
To construct the 2016 Ibrahim Index of African Governance (IIAG), the Foundation’s Research Team collected 166 variables that measure governance concepts from 34 sources. These have been combined to form 95 indicators, 14 sub-categories, four categories, and one Overall Governance score. In total, there are 237 different measures of governance in Africa in the 2016 IIAG. These cover all 54 African countries, with 16 years’ worth of data from 2000-2015 inclusive. This construction method provides the most comprehensive amount of robust data on African governance.
Structure and levels
In order to fully assess any country’s governance performance, it is vital to drill-down beyond the Overall Governance score to take into account country performance across the different governance dimensions encompassed by the categories, sub-categories and indicators of the IIAG. Country performances can vary across these. For example, Ethiopia’s score in 2015 is mainly driven by the impressive improvement of +13.9 score points in Human Development where it is the second most improved country in this category since 2006. However it has shown a slight deterioration in Sustainable Economic Opportunity over the past decade, driven by its decline in the sub-category Business Environment where it is one of the five most deteriorated countries declining by -16.4 score points. Meanwhile, Ethiopia improves in all the other constituent sub-categories of the Sustainable Economic Opportunity category.
Diverging trends can be found everywhere in the Index. Over the last ten years Togo is the only country to show improvement in Overall Governance, as well as all the categories and sub-categories. Yet at the indicator level Togo still registers deterioration since 2006 and varying performances in 2015, scoring 100.0 in two indicators and 0.0 in another two indicators.
Scores, ranks and trends
IIAG results can be classified into three main types: score, rank and trend. This year, in 2016, the tenth anniversary of the Index, we have focused on analysing the past decade of governance, from 2006 to 2015. Trends over time are available at all levels of the Index.
All three results must be considered when studying the Index, as each type of result gives context to the others.
For example, looking only at rank or score without considering the trends overlooks the important trajectories that countries show. In the 2016 IIAG, Côte d’Ivoire and Mozambique both score 52.3 (out of 100.0) for Overall Governance and rank joint 21st out of 54. However there is a large difference in their performance over time; Côte d’Ivoire is the most improved country in Overall Governance in the past ten years (up +13.1 score points), whereas Mozambique has declined by -1.8 score
For the first time, the 2016 IIAG introduces groups of countries based on their score. There are five groups which range from high to low performance: “High”, “Medium-High”, “Medium”, “Medium-Low” and “Low”.
These groups have been derived using k-means clustering analysis, which determines the banding thresholds within a given category. These cut-off points determine the band in which countries sit.
Each category has a different cut-off point as a result of the units of measurement being diverse and specific to the category. The Overall Governance bands are a simple aggregate of the category cut-off points.
The cut-off points for the bands are:
points. The trajectories of each country over the past ten years to reach the same rank in 2015 are markedly different, with Mozambique dropping from 19th, and Côte d’Ivoire rising up the ranks from 42nd.
In the same way that trends should be taken into account when looking at scores and ranks, when looking at trends it is important to take into account the level of score and rank. Zimbabwe for example is in the top ten most improved countries over the last ten years at the Overall Governance level (+9.7), yet its score of 44.3 in 2015 is still below the African average score of 50.0 and it ranks in the bottom half of the rankings (39 out of 54).
There are vast amounts of data and results and this report focuses on presenting the key findings of the 2016 IIAG for Overall Governance, the four categories and the 14 sub-categories, highlighting some key findings in selected indicators. The size and potential of the IIAG is much larger than this report covers. We therefore encourage users to explore all IIAG publications, including Country Insights, Methodology and online and offline Data Portals where the user of the IIAG can freely explore all the results.
Introducing banding in the 2016 IIAG
High 71.0 and above
77.0 and above
69.0 and above
63.0 and above
74.0 and above
Medium-High 54.0 - 70.9 60.0 - 76.9 54.0 - 68.9 48.0 - 62.9 56.0 - 73.9
Medium 41.0 - 53.9 45.0 - 59.9 37.0 - 53.9 37.0 - 47.9 45.0 - 55.9
Medium-Low 23.0 - 40.9 25.0 - 44.9 20.0 - 36.9 23.0 - 36.9 25.0 - 44.9
Low Below 23.0 Below 25.0 Below 20.0 Below 23.0 Below 25.0
OVERALL GOVERNANCE
SAFETY & RULE OF LAW
PARTICIPATION & HUMAN RIGHTS
HUMAN DEVELOPMENT
SUSTAINABLE ECONOMIC OPPORTUNITY


OVERALL GOVERNANCE
Safety & Rule of Law
Participation & Human Rights
Sustainable Economic Opportunity
Human Development

18
A Decade of African Governance: Overall Governance
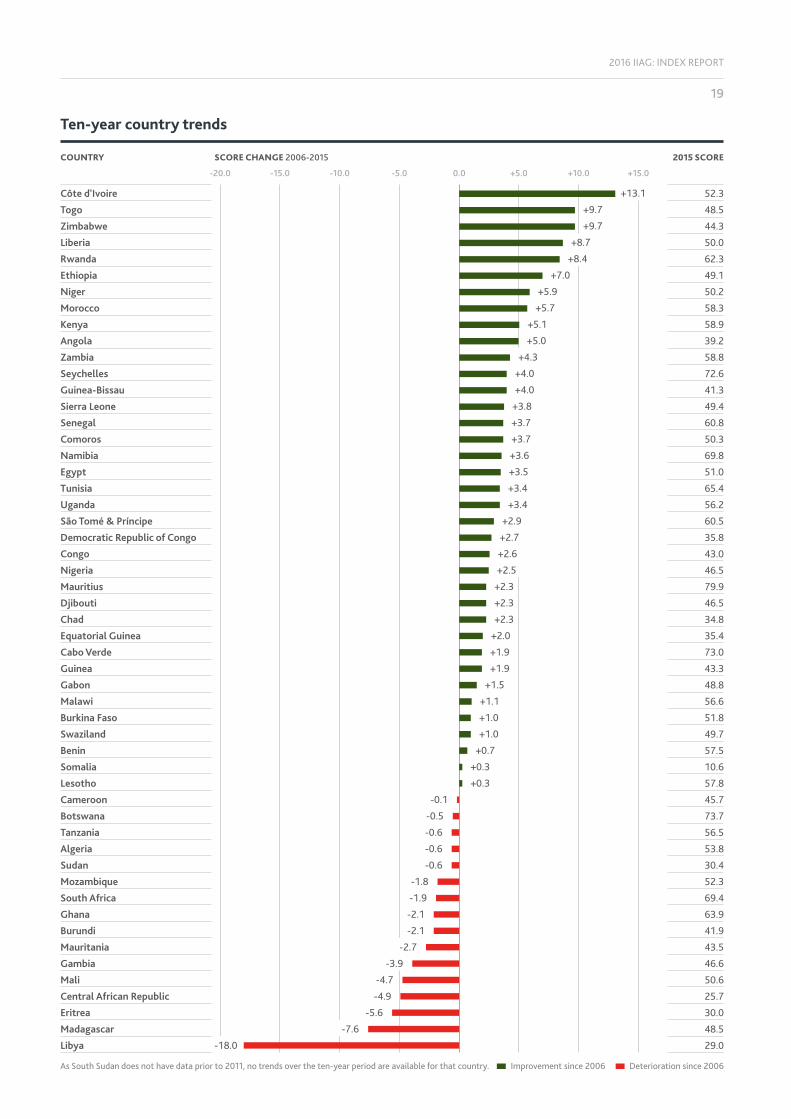
Over the past decade, a very slight improvement in Overall Governance performance has been registered at the continental level. The African average score of 50.0 in 2015, up one point from the score registered a decade earlier, reflects the trend of improvement seen across the majority of countries over the past ten years. In total, 37 countries out of 54 have shown improvement in Overall Governance since 2006, representing 70% of African citizens.
Of the 37 countries to have registered improvement in Overall Governance since 2006, nine have progressed by more than +5.0 points: Côte d’Ivoire (+13.1), Togo (+9.7), Zimbabwe (+9.7), Liberia (+8.7), Rwanda (+8.4), Ethiopia (+7.0), Niger (+5.9), Morocco (+5.7) and Kenya (+5.1). Of these nine, five already feature in the top half of the Overall Governance rankings in 2015. Of them, Rwanda is the only country to feature both among the ten highest scoring and the ten most improved countries over the past ten years.
Few countries however (13 out of the 37 improvers) have registered progress in each of the four dimensions of governance – Safety & Rule of Law, Participation & Human Rights, Sustainable Economic Opportunity and Human Development. Among those 13, seven also feature among the ten most improved countries over the decade, which underlines the value of balanced progress across all dimensions of governance. Togo is the only country to improve across all underlying 14 sub-categories.
Meanwhile, 16 countries register a negative trend in Overall Governance since 2006, with three falling by more than -5.0 points: Libya (-18.0), Madagascar (-7.6) and Eritrea (-5.6). All of them have declined in Safety & Rule of Law in the past ten years, and more than half show decline in either Participation & Human Rights or Sustainable Economic Opportunity.
These diverging trends over the decade have led to changes within the top ten and bottom ten groups between 2006 and 2015.
In the top ranking group, Lesotho (15th) and São Tomé & Príncipe (11th) have fallen out of the top ten, to be replaced by Rwanda (9th) and Senegal (10th). Mauritius remains the highest scoring country on the continent in 2015 at the Overall Governance level, and has consistently been the top ranked country over the past ten years. However, some concerning trends appear within that group that point to the potential fragility of these high-ranking positions. Indeed, over the last decade, Ghana (with -2.1 score points) and South Africa (with -1.9 score points) have registered the eighth and tenth largest deteriorations on the continent. Botswana has also shown a marginal deterioration of -0.5 points. Of the top ten performing countries, only three countries – Namibia, Rwanda and Senegal – manage to improve across all categories of the IIAG. The seven other countries have deteriorated in at least one of the four categories, with all of them showing decline in Safety & Rule of Law.
At the other end of the rankings, the composition of the ten lowest scoring countries in Overall Governance has also changed over the decade. Deterioration in Libya since 2006 has seen it fall from the middle of the rankings at 29th to 51st in 2015.
Diverging trends are also seen in this group, with five demonstrating improved performance and four registering deterioration. Particularly worrying trends are seen in Central African Republic, Eritrea and Libya, which all feature in the ten most deteriorated countries on the continent at the Overall Governance level in the past ten years, with Central African Republic and Eritrea declining across all four categories.
Key findings
2015 SCORE /100 TREND 2006-20152015 RANK /54
1st Mauritius 79.9 +2.32nd Botswana 73.7 -0.53rd Cabo Verde 73.0 +1.94th Seychelles 72.6 +4.05th Namibia 69.8 +3.66th South Africa 69.4 -1.97th Tunisia 65.4 +3.47th Ghana 63.9 -2.19th Rwanda 62.3 +8.410th Senegal 60.8 +3.711th São Tomé & Príncipe 60.5 +2.912th Kenya 58.9 +5.113th Zambia 58.8 +4.314th Morocco 58.3 +5.715th Lesotho 57.8 +0.316th Benin 57.5 +0.717th Malawi 56.6 +1.118th Tanzania 56.5 -0.619th Uganda 56.2 +3.420th Algeria 53.8 -0.621st Côte d'Ivoire 52.3 +13.121st Mozambique 52.3 -1.823rd Burkina Faso 51.8 +1.024th Egypt 51.0 +3.525th Mali 50.6 -4.726th Comoros 50.3 +3.727th Niger 50.2 +5.928th Liberia 50.0 +8.7 African average 50.0 +1.029th Swaziland 49.7 +1.030th Sierra Leone 49.4 +3.831st Ethiopia 49.1 +7.032nd Gabon 48.8 +1.533rd Madagascar 48.5 -7.633rd Togo 48.5 +9.735th Gambia 46.6 -3.936th Djibouti 46.5 +2.336th Nigeria 46.5 +2.538th Cameroon 45.7 -0.139th Zimbabwe 44.3 +9.740th Mauritania 43.5 -2.741st Guinea 43.3 +1.942nd Congo 43.0 +2.643rd Burundi 41.9 -2.144th Guinea-Bissau 41.3 +4.045th Angola 39.2 +5.046th Democratic Republic of Congo 35.8 +2.747th Equatorial Guinea 35.4 +2.048th Chad 34.8 +2.349th Sudan 30.4 -0.650th Eritrea 30.0 -5.651st Libya 29.0 -18.052nd Central African Republic 25.7 -4.953rd South Sudan 18.6 .54th Somalia 10.6 +0.3
2016 IIAG: INDEX REPORT
19
Ten-year country trends
As South Sudan does not have data prior to 2011, no trends over the ten-year period are available for that country. Improvement since 2006 Deterioration since 2006
Côte d'IvoireTogoZimbabweLiberiaRwandaEthiopiaNigerMoroccoKenyaAngolaZambiaSeychellesGuinea-BissauSierra LeoneSenegalComorosNamibiaEgyptTunisiaUgandaSão Tomé & PríncipeDemocratic Republic of CongoCongoNigeriaMauritiusDjiboutiChadEquatorial GuineaCabo VerdeGuineaGabonMalawiBurkina FasoSwazilandBeninSomaliaLesothoCameroonBotswanaTanzaniaAlgeriaSudanMozambiqueSouth AfricaGhanaBurundiMauritaniaGambiaMaliCentral African RepublicEritreaMadagascarLibya
52.348.544.350.062.349.150.258.358.939.258.872.641.349.460.850.369.851.065.456.260.535.843.046.579.946.534.835.473.043.348.856.651.849.757.510.657.845.773.756.553.830.452.369.463.941.943.546.650.625.730.048.529.0
COUNTRY SCORE CHANGE 2006-2015
-20.0 -15.0 +15.0-10.0 +10.0-5.0 +5.00.0
2015 SCORE
+13.1+9.7+9.7
+8.7+8.4
+7.0+5.9
+5.7+5.1+5.0
+4.3+4.0+4.0
+3.8+3.7+3.7+3.6+3.5+3.4+3.4
+2.9+2.7+2.6+2.5
+2.3+2.3+2.3
+2.0+1.9+1.9
+1.5+1.1+1.0+1.0
+0.7+0.3+0.3
-0.1-0.5-0.6-0.6-0.6
-1.8-1.9-2.1-2.1
-2.7-3.9
-4.7-4.9
-5.6-7.6
-18.0
20
Key: Overall Governance bands
High 71.0 and aboveMedium-High 54.0 - 70.9Medium 41.0 - 53.9Medium-Low 23.0 - 40.9Low Below 23.0
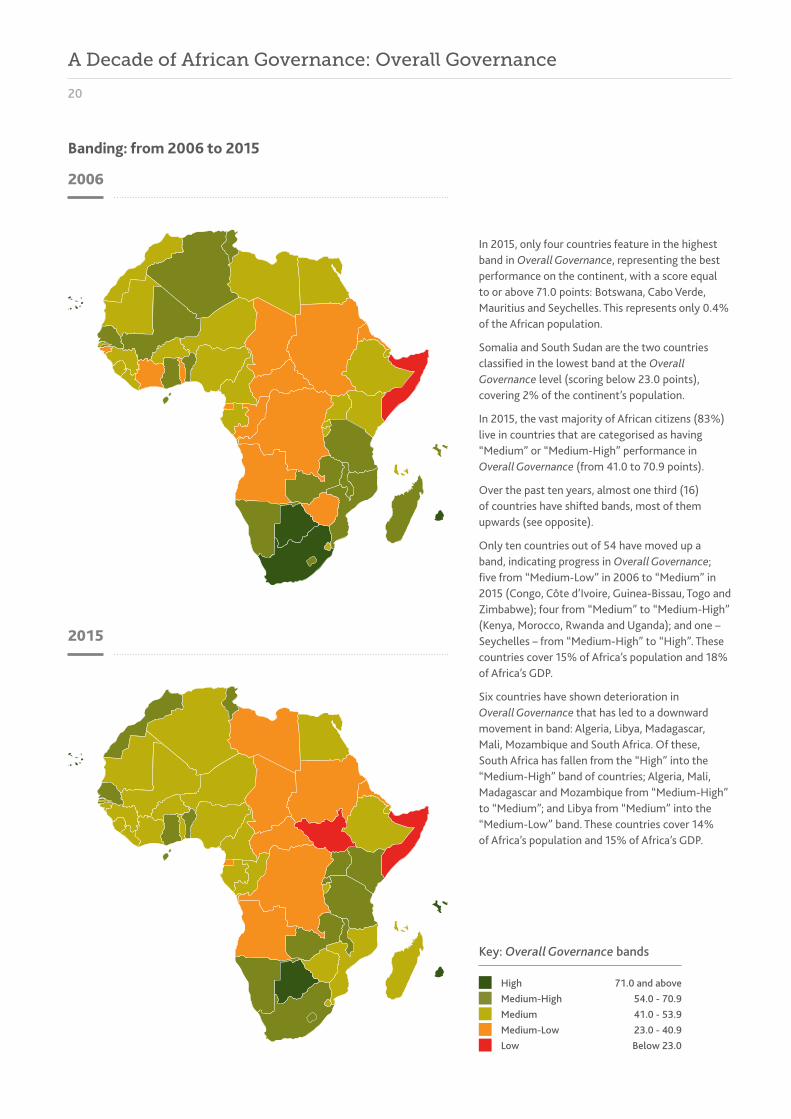
In 2015, only four countries feature in the highest band in Overall Governance, representing the best performance on the continent, with a score equal to or above 71.0 points: Botswana, Cabo Verde, Mauritius and Seychelles. This represents only 0.4% of the African population.
Somalia and South Sudan are the two countries classified in the lowest band at the Overall Governance level (scoring below 23.0 points), covering 2% of the continent’s population.
In 2015, the vast majority of African citizens (83%) live in countries that are categorised as having “Medium” or “Medium-High” performance in Overall Governance (from 41.0 to 70.9 points).
Over the past ten years, almost one third (16) of countries have shifted bands, most of them upwards (see opposite).
Only ten countries out of 54 have moved up a band, indicating progress in Overall Governance; five from “Medium-Low” in 2006 to “Medium” in 2015 (Congo, Côte d’Ivoire, Guinea-Bissau, Togo and Zimbabwe); four from “Medium” to “Medium-High” (Kenya, Morocco, Rwanda and Uganda); and one – Seychelles – from “Medium-High” to “High”. These countries cover 15% of Africa’s population and 18% of Africa’s GDP.
Six countries have shown deterioration in Overall Governance that has led to a downward movement in band: Algeria, Libya, Madagascar, Mali, Mozambique and South Africa. Of these, South Africa has fallen from the “High” into the “Medium-High” band of countries; Algeria, Mali, Madagascar and Mozambique from “Medium-High” to “Medium”; and Libya from “Medium” into the “Medium-Low” band. These countries cover 14% of Africa’s population and 15% of Africa’s GDP.
Banding: from 2006 to 2015
2006
2015
A Decade of African Governance: Overall Governance

2016 IIAG: INDEX REPORT
21
Key: Overall Governance
Country improves in bandingCountry deteriorates in bandingNo change
CongoCôte d’IvoireGuinea-Bissau
TogoZimbabwe
KenyaMorocco
RwandaUganda
South Africa
Seychelles
Libya
No countries move out of the bottom band.
No countries move into the bottom band.
AlgeriaMadagascar
MaliMozambique
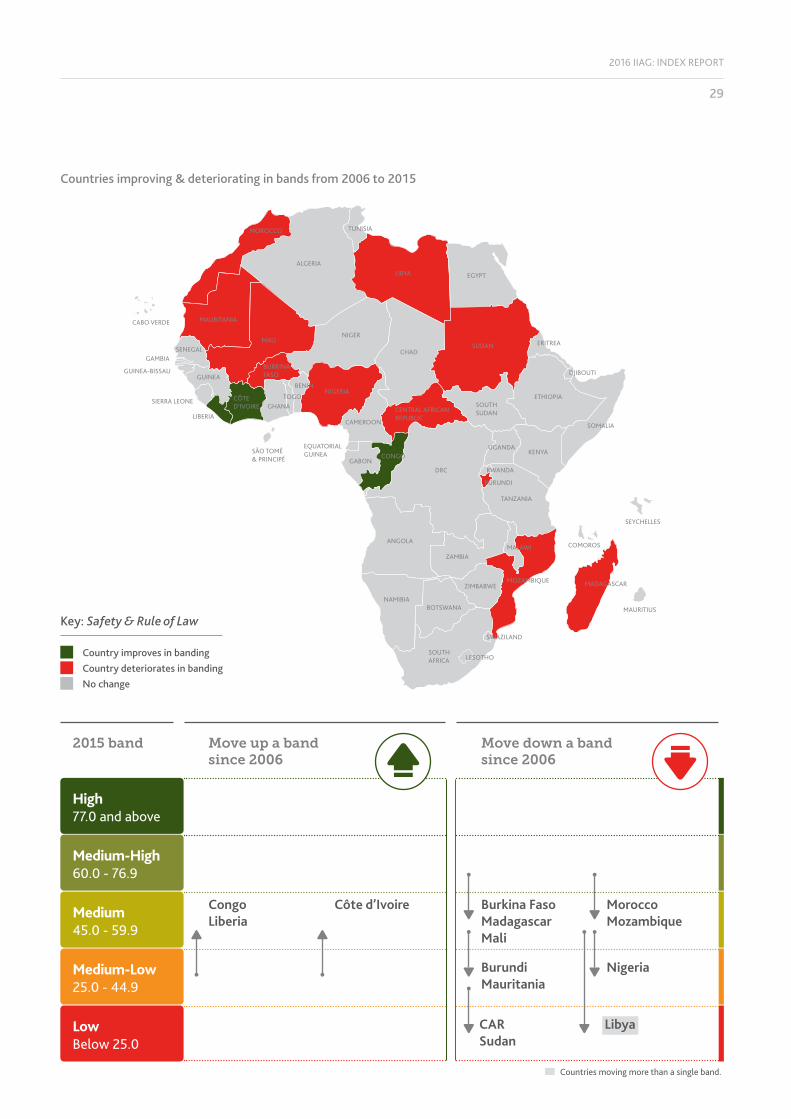
High71.0 and above
Medium-High54.0 - 70.9
Medium 41.0 - 53.9
Medium-Low23.0 - 40.9
LowBelow 23.0
Move up a band since 2006
2015 band Move down a band since 2006
Countries improving & deteriorating in bands from 2006 to 2015
22
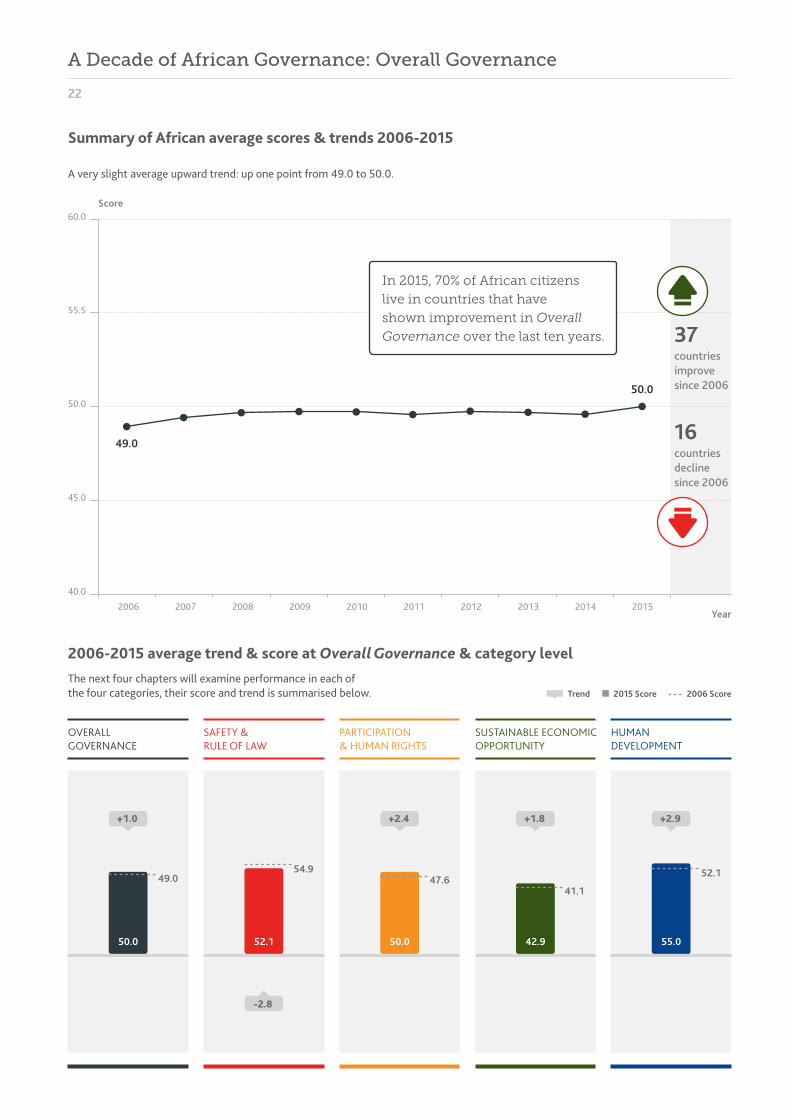
Summary of African average scores & trends 2006-2015
A very slight average upward trend: up one point from 49.0 to 50.0.
The next four chapters will examine performance in each of the four categories, their score and trend is summarised below.
2006-2015 average trend & score at Overall Governance & category level
OVERALL GOVERNANCE
+1.0
49.0
50.0
SAFETY & RULE OF LAW
-2.8
54.9
52.1
PARTICIPATION & HUMAN RIGHTS
+2.4
50.0
47.6
HUMAN DEVELOPMENT
+2.9
55.0
52.1
SUSTAINABLE ECONOMIC OPPORTUNITY
42.9
41.1
+1.8
2015 Score 2006 ScoreTrend
A Decade of African Governance: Overall Governance
45.0
40.0
49.0
50.050.0
55.5
60.0
2006 2007 2008 2009 2010 2011 2012 2013 2014 2015
Score
Year
countries improve since 2006
37
countries decline since 2006
16
In 2015, 70% of African citizens
live in countries that have
shown improvement in Overall
Governance over the last ten years.

2016 IIAG: INDEX REPORT
23
Three most improved & three most deteriorated countries 2006-2015
Côte d’Ivoire is the most improved country in Overall Governance over the decade, registering improvement across all four categories of the Index. Côte d’Ivoire’s impressive performance has been driven in particular by progress in Participation & Human Rights, and Safety & Rule of Law, in which it registers the largest improvement on the continent. At the sub-category level Côte d’Ivoire improves in 13 of the 14 sub-categories, registering only a marginal decline in Gender.
Togo is the only country to have shown consistently improved performance in Overall Governance over the decade, and to have registered progress in all 14 sub-categories of the IIAG. However, despite registering improvement of more than +10.0 points in Participation & Human Rights, Sustainable Economic Opportunity and Human Development since 2006, Togo remains in the bottom half of the Overall Governance rankings in 2015.
Zimbabwe registers progress across all four categories over the decade, pushing it out of the bottom ten countries in Overall Governance to rank 39th in 2015. Progress in Sustainable Economic Opportunity masks Zimbabwe’s diverging performance at sub-category level; it registers the largest improvement on the continent in Public Management and Rural Sector yet is one of the most deteriorated countries in Infrastructure.
Libya is the most deteriorated country in Overall Governance, registering a decline of more than -10.0 points over the decade. It has shown significant deterioration in Safety & Rule of Law as the most deteriorated country across all four constituent sub-categories, with a decline of more than -50.0 points in National Security. Libya also registers the largest deterioration on the continent in Sustainable Economic Opportunity and Human Development, driven by considerable declines in Public Management, Welfare and Education, in which it is the most deteriorated country.
Madagascar registers the second largest deterioration in Overall Governance over the decade, driven by falling scores in three of the four categories. It shows considerable decline in Sustainable Economic Opportunity and Human Development, as the second most deteriorated country after Libya. However, at the sub-category level Madagascar shows diverging performance, registering the largest deterioration on the continent in Business Environment and Health yet one of the largest improvements in Gender.
Eritrea, the fifth lowest scoring country in Overall Governance, registers the third largest deterioration on the continent over the decade. Alongside Central African Republic, Eritrea is one of two countries to decline in all four categories of the IIAG, it shows its largest deterioration in Safety & Rule of Law, driven by negative trends in Personal Safety, Rule of Law and Accountability. The only three sub-categories in which Eritrea has shown progress over the decade are National Security, Health and Education.
ZIMBABWE
44.3SCORE/100
+9.7
Three most improved countries Overall Governance (2006-2015)
Three most deteriorated countries Overall Governance (2006-2015)
CÔTE D’IVOIRE
52.3SCORE/100
+13.1
TOGO
48.5SCORE/100
+9.7
LIBYA
29.0SCORE/100
-18.0
MADAGASCAR
48.5SCORE/100
-7.6
ERITREA
30.0SCORE/100
-5.6Trends: 2006-2015
21stRANK/54
RANK/54 RANK/54
RANK/54 RANK/54 RANK/54
33rd 51st 33rd
39th 50th

SAFETY & RULE OF LAW
Rule of Law
Accountability
Personal Safety
National Security
26
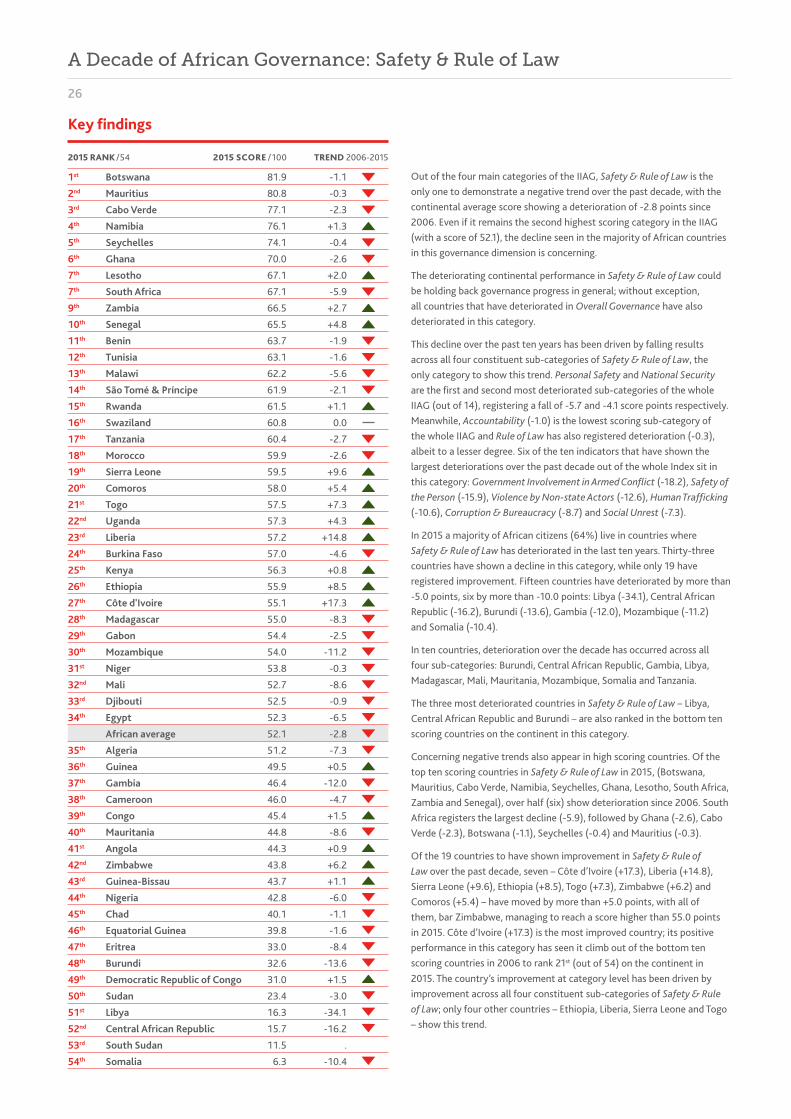
Out of the four main categories of the IIAG, Safety & Rule of Law is the only one to demonstrate a negative trend over the past decade, with the continental average score showing a deterioration of -2.8 points since 2006. Even if it remains the second highest scoring category in the IIAG (with a score of 52.1), the decline seen in the majority of African countries in this governance dimension is concerning.
The deteriorating continental performance in Safety & Rule of Law could be holding back governance progress in general; without exception, all countries that have deteriorated in Overall Governance have also deteriorated in this category.
This decline over the past ten years has been driven by falling results across all four constituent sub-categories of Safety & Rule of Law, the only category to show this trend. Personal Safety and National Security are the first and second most deteriorated sub-categories of the whole IIAG (out of 14), registering a fall of -5.7 and -4.1 score points respectively. Meanwhile, Accountability (-1.0) is the lowest scoring sub-category of the whole IIAG and Rule of Law has also registered deterioration (-0.3), albeit to a lesser degree. Six of the ten indicators that have shown the largest deteriorations over the past decade out of the whole Index sit in this category: Government Involvement in Armed Conflict (-18.2), Safety of the Person (-15.9), Violence by Non-state Actors (-12.6), Human Trafficking (-10.6), Corruption & Bureaucracy (-8.7) and Social Unrest (-7.3).
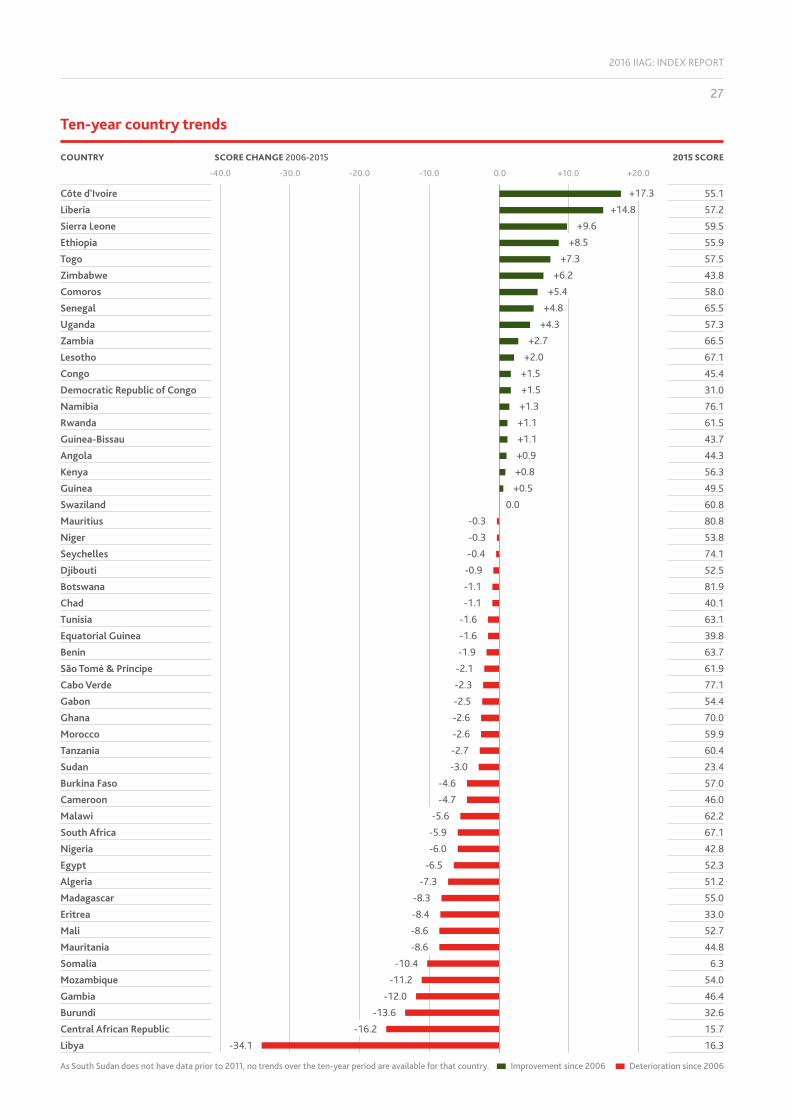
In 2015 a majority of African citizens (64%) live in countries where Safety & Rule of Law has deteriorated in the last ten years. Thirty-three countries have shown a decline in this category, while only 19 have registered improvement. Fifteen countries have deteriorated by more than -5.0 points, six by more than -10.0 points: Libya (-34.1), Central African Republic (-16.2), Burundi (-13.6), Gambia (-12.0), Mozambique (-11.2) and Somalia (-10.4).
In ten countries, deterioration over the decade has occurred across all four sub-categories: Burundi, Central African Republic, Gambia, Libya, Madagascar, Mali, Mauritania, Mozambique, Somalia and Tanzania.
The three most deteriorated countries in Safety & Rule of Law – Libya, Central African Republic and Burundi – are also ranked in the bottom ten scoring countries on the continent in this category.
Concerning negative trends also appear in high scoring countries. Of the top ten scoring countries in Safety & Rule of Law in 2015, (Botswana, Mauritius, Cabo Verde, Namibia, Seychelles, Ghana, Lesotho, South Africa, Zambia and Senegal), over half (six) show deterioration since 2006. South Africa registers the largest decline (-5.9), followed by Ghana (-2.6), Cabo Verde (-2.3), Botswana (-1.1), Seychelles (-0.4) and Mauritius (-0.3).
Of the 19 countries to have shown improvement in Safety & Rule of Law over the past decade, seven – Côte d’Ivoire (+17.3), Liberia (+14.8), Sierra Leone (+9.6), Ethiopia (+8.5), Togo (+7.3), Zimbabwe (+6.2) and Comoros (+5.4) – have moved by more than +5.0 points, with all of them, bar Zimbabwe, managing to reach a score higher than 55.0 points in 2015. Côte d’Ivoire (+17.3) is the most improved country; its positive performance in this category has seen it climb out of the bottom ten scoring countries in 2006 to rank 21st (out of 54) on the continent in 2015. The country’s improvement at category level has been driven by improvement across all four constituent sub-categories of Safety & Rule of Law; only four other countries – Ethiopia, Liberia, Sierra Leone and Togo – show this trend.
2015 SCORE /100 TREND 2006-20152015 RANK /54
1st Botswana 81.9 -1.12nd Mauritius 80.8 -0.33rd Cabo Verde 77.1 -2.34th Namibia 76.1 +1.35th Seychelles 74.1 -0.46th Ghana 70.0 -2.67th Lesotho 67.1 +2.07th South Africa 67.1 -5.99th Zambia 66.5 +2.710th Senegal 65.5 +4.811th Benin 63.7 -1.912th Tunisia 63.1 -1.613th Malawi 62.2 -5.614th São Tomé & Príncipe 61.9 -2.115th Rwanda 61.5 +1.116th Swaziland 60.8 0.017th Tanzania 60.4 -2.718th Morocco 59.9 -2.619th Sierra Leone 59.5 +9.620th Comoros 58.0 +5.421st Togo 57.5 +7.322nd Uganda 57.3 +4.323rd Liberia 57.2 +14.824th Burkina Faso 57.0 -4.625th Kenya 56.3 +0.826th Ethiopia 55.9 +8.527th Côte d'Ivoire 55.1 +17.328th Madagascar 55.0 -8.329th Gabon 54.4 -2.530th Mozambique 54.0 -11.231st Niger 53.8 -0.332nd Mali 52.7 -8.633rd Djibouti 52.5 -0.934th Egypt 52.3 -6.5 African average 52.1 -2.835th Algeria 51.2 -7.336th Guinea 49.5 +0.537th Gambia 46.4 -12.038th Cameroon 46.0 -4.739th Congo 45.4 +1.540th Mauritania 44.8 -8.641st Angola 44.3 +0.942nd Zimbabwe 43.8 +6.243rd Guinea-Bissau 43.7 +1.144th Nigeria 42.8 -6.045th Chad 40.1 -1.146th Equatorial Guinea 39.8 -1.647th Eritrea 33.0 -8.448th Burundi 32.6 -13.649th Democratic Republic of Congo 31.0 +1.550th Sudan 23.4 -3.051st Libya 16.3 -34.152nd Central African Republic 15.7 -16.253rd South Sudan 11.5 .54th Somalia 6.3 -10.4
A Decade of African Governance: Safety & Rule of Law
Key findings
2016 IIAG: INDEX REPORT
27
Ten-year country trends
Côte d'IvoireLiberiaSierra LeoneEthiopiaTogoZimbabweComorosSenegalUgandaZambiaLesothoCongoDemocratic Republic of CongoNamibiaRwandaGuinea-BissauAngolaKenyaGuineaSwazilandMauritiusNigerSeychellesDjiboutiBotswanaChadTunisiaEquatorial GuineaBeninSão Tomé & PríncipeCabo VerdeGabonGhanaMoroccoTanzaniaSudanBurkina FasoCameroonMalawiSouth AfricaNigeriaEgyptAlgeriaMadagascarEritreaMaliMauritaniaSomaliaMozambiqueGambiaBurundiCentral African RepublicLibya
55.157.259.555.957.543.858.065.557.366.567.145.431.076.161.543.744.356.349.560.880.853.874.152.581.940.163.139.863.761.977.154.470.059.960.423.457.046.062.267.142.852.351.255.033.052.744.8
6.354.046.432.615.716.3
COUNTRY SCORE CHANGE 2006-2015
-40.0 -30.0 +20.0-20.0 +10.0-10.0 0.0
2015 SCORE
+17.3+14.8
+9.6+8.5
+7.3+6.2
+5.4+4.8
+4.3+2.7
+2.0+1.5+1.5+1.3+1.1+1.1+0.9+0.8+0.5
0.0-0.3-0.3-0.4
-0.9-1.1-1.1
-1.6-1.6-1.9
-2.1-2.3-2.5-2.6-2.6-2.7-3.0
-4.6-4.7
-5.6-5.9-6.0
-6.5-7.3
-8.3-8.4-8.6-8.6
-10.4-11.2
-12.0-13.6
-16.2-34.1
As South Sudan does not have data prior to 2011, no trends over the ten-year period are available for that country. Improvement since 2006 Deterioration since 2006

28
Key: Safety & Rule of Law bands
High 77.0 and aboveMedium-High 60.0 - 76.9Medium 45.0 - 59.9Medium-Low 25.0 - 44.9Low Below 25.0
Only three countries figure in the highest band in 2015, achieving a score equal to or above 77.0: Botswana (81.9), Mauritius (80.8) and Cabo Verde (77.1). This equates to only 0.3% of Africa’s population.
Five countries are classified in the “Low” band in 2015, scoring below 25.0: Somalia (6.3), South Sudan (11.5), Central African Republic (15.7), Libya (16.3) and Sudan (23.4). These countries cover 6% of the continent’s population.
A total of 14 countries have changed band over the past decade. Only three countries – Congo, Côte d’Ivoire and Liberia – have moved up a band, from “Medium-Low” to “Medium”, whilst 11 countries now feature in a lower band. Four have moved down into the “Low” band (scoring below 25.0): Central African Republic, Nigeria and Sudan from the “Medium-Low” band and Libya from the “Medium” band.
This means that Libya is the only country to move more than a single band in Safety & Rule of Law over the decade.
2006
2015
A Decade of African Governance: Safety & Rule of Law
Banding: from 2006 to 2015
2016 IIAG: INDEX REPORT
29
Key: Safety & Rule of Law
Country improves in bandingCountry deteriorates in bandingNo change
CongoLiberia
Côte d’Ivoire
BurundiMauritania
Nigeria
CARSudan
Libya
Burkina FasoMadagascarMali
Morocco Mozambique
High77.0 and above
Medium-High60.0 - 76.9
Medium 45.0 - 59.9
Medium-Low25.0 - 44.9
LowBelow 25.0
Move up a band since 2006
2015 band Move down a band since 2006
Countries moving more than a single band.
Countries improving & deteriorating in bands from 2006 to 2015

30
Algeria 24 51.9 -5.4Angola 38 40.0 -5.2Benin 7 60.5 -1.0Botswana 3 62.6 +0.2Burkina Faso 34 42.4 -17.9Burundi 47 34.5 -21.1Cabo Verde 10 59.2 -3.8Cameroon 30 47.3 +3.6Central African Republic 52 8.3 -29.6Chad 37 40.3 -8.4Comoros 17 55.6 +5.6Congo 33 43.1 -6.5Côte d'Ivoire 18 54.9 +16.6Democratic Republic of Congo 50 15.6 -10.4Djibouti 16 56.4 -1.8Egypt 36 41.5 +0.4Equatorial Guinea 41 37.5 -4.2Eritrea 39 38.5 -17.6Ethiopia 23 52.3 +5.1Gabon 32 46.1 -5.9Gambia 35 42.0 -22.9Ghana 14 56.6 -6.6Guinea 41 37.5 -11.3Guinea-Bissau 41 37.5 -11.8Kenya 27 49.7 +11.2Lesotho 22 53.0 +2.0Liberia 26 50.4 +6.6Libya 51 12.6 -44.5Madagascar 40 37.8 -15.3Malawi 28 49.6 -13.5Mali 25 50.9 -5.9Mauritania 46 35.1 -6.8Mauritius 4 62.5 -2.5Morocco 21 53.2 -14.4Mozambique 29 48.9 -10.9Namibia 7 60.5 +1.4Niger 6 61.2 +3.1Nigeria 48 33.5 +2.5Rwanda 4 62.5 -0.8São Tomé & Príncipe 1 68.4 -3.3Senegal 13 57.1 +3.3Seychelles 2 67.7 -5.4Sierra Leone 9 60.2 +2.9Somalia 53 0.0 -26.1South Africa 44 37.2 -5.4South Sudan 53 0.0 .Sudan 49 27.5 +1.3Swaziland 19 54.8 +9.3Tanzania 20 54.3 -0.8Togo 11 58.0 +13.5Tunisia 31 46.5 -14.0Uganda 12 57.8 +3.1Zambia 15 56.5 +1.9Zimbabwe 45 36.1 +8.1African average 45.7 -5.7
2015 RANK/54
2015 SCORE /100
TREND2006-2015
A strong driver of the decline in the Safety & Rule of Law category, Personal Safety is the most deteriorated sub-category in the IIAG over the decade, registering a decline of -5.7 points.
This decline of the continental average has been driven by strong negative trends in three of its six underlying indicators: Safety of the Person (-15.9), Human Trafficking (-10.6) and Social Unrest (-7.3). These three indicators are also among the ten most deteriorated in the IIAG, with Safety of the Person showing the third largest deterioration since 2006. Political Violence has declined by -5.8 score points, whilst Crime has declined by -3.1 score points. Police Services (+8.6) is the only indicator in this sub-category to have improved over the last ten years.
Thirty-three countries have deteriorated in Personal Safety over the last ten years, five of them by more than -20.0 score points – Libya (-44.5), Central African Republic (-29.6), Somalia (-26.1), Gambia (-22.9) and Burundi (-21.1) – whilst a further ten countries have deteriorated by more than -10.0 score points: Burkina Faso (-17.9), Eritrea (-17.6), Madagascar (-15.3), Morocco (-14.4), Tunisia (-14.0), Malawi (-13.5), Guinea-Bissau (-11.8), Guinea (-11.3), Mozambique (-10.9) and Democratic Republic of Congo (-10.4).
Only 20 countries have shown progress, the lowest number of countries improving in any sub-category of the Index over the last ten years. Three countries have improved by more than +10.0 score points: Côte d’Ivoire (+16.6), Togo (+13.5) and Kenya (+11.2).
1 Afrobarometer has only conducted one survey in Ethiopia, Gabon, São Tomé & Príncipe; therefore there are no time series trends for these countries. In selected Afrobarometer questions, there are no time series data for Sudan.
Half of the constituent indicators of Personal Safety are in the top ten most deteriorated indicators in the IIAG.
Afrobarometer: citizen perceptions on Personal Safety
The Personal Safety sub-category contains two Afrobarometer measures of citizen perceptions of crime in the home and in the neighbourhood – Residential Crime and Neighbourhood Safety. These two measures demonstrate a positive trend over the past ten years that diverges from the negative overall trend found in the measures derived from qualitative assessments of safety on the continent taken from the Economist Intelligence Unit (EIU).
For example, 20 out of the 34 African countries with two or more Afrobarometer surveys1 register improvement in Residential Crime; this is equivalent to nearly half of African citizens surveyed feeling safer in their home in 2015 than ten years ago.
SPOTLIGHT
A Decade of African Governance: Safety & Rule of Law
Personal Safety sub-category: key findings
2016 IIAG: INDEX REPORT
31
Algeria 34 78.3 +2.0Angola 18 87.0 +5.0Benin 14 87.9 -7.9Botswana 4 99.9 -0.1Burkina Faso 25 83.4 -4.1Burundi 49 44.8 -7.4Cabo Verde 1 100.0 0.0Cameroon 41 62.8 -24.0Central African Republic 52 23.6 -23.7Chad 44 59.6 +0.6Comoros 8 94.6 +9.7Congo 27 81.6 +9.5Côte d'Ivoire 31 79.4 +14.3Democratic Republic of Congo 48 45.6 -2.9Djibouti 28 81.4 -9.9Egypt 42 62.4 -27.2Equatorial Guinea 10 91.6 +4.4Eritrea 39 66.2 +14.2Ethiopia 38 72.7 +8.3Gabon 10 91.6 0.0Gambia 35 77.8 -9.3Ghana 23 85.2 -6.2Guinea 19 86.7 +4.1Guinea-Bissau 24 85.1 +5.4Kenya 45 59.2 -17.3Lesotho 15 87.4 -4.1Liberia 21 85.9 +29.0Libya 50 31.0 -54.7Madagascar 20 86.4 -9.3Malawi 6 95.1 -0.7Mali 40 65.7 -10.3Mauritania 30 80.2 -2.9Mauritius 1 100.0 +5.0Morocco 29 81.2 -6.2Mozambique 17 87.3 -8.4Namibia 5 99.7 +8.3Niger 43 61.0 -9.6Nigeria 47 50.8 -28.6Rwanda 46 57.9 -11.4São Tomé & Príncipe 7 94.9 0.0Senegal 32 78.5 -2.7Seychelles 1 100.0 +0.3Sierra Leone 22 85.4 +10.2Somalia 54 17.1 -11.4South Africa 37 75.0 -8.0South Sudan 53 20.9 .Sudan 51 29.5 -12.5Swaziland 10 91.6 +4.2Tanzania 13 90.9 -0.7Togo 15 87.4 +2.0Tunisia 32 78.5 -13.0Uganda 26 82.0 +29.8Zambia 9 93.8 -1.6Zimbabwe 36 76.7 +6.7African average 75.2 -4.1
2015 RANK/54
2015 SCORE /100
TREND2006-2015
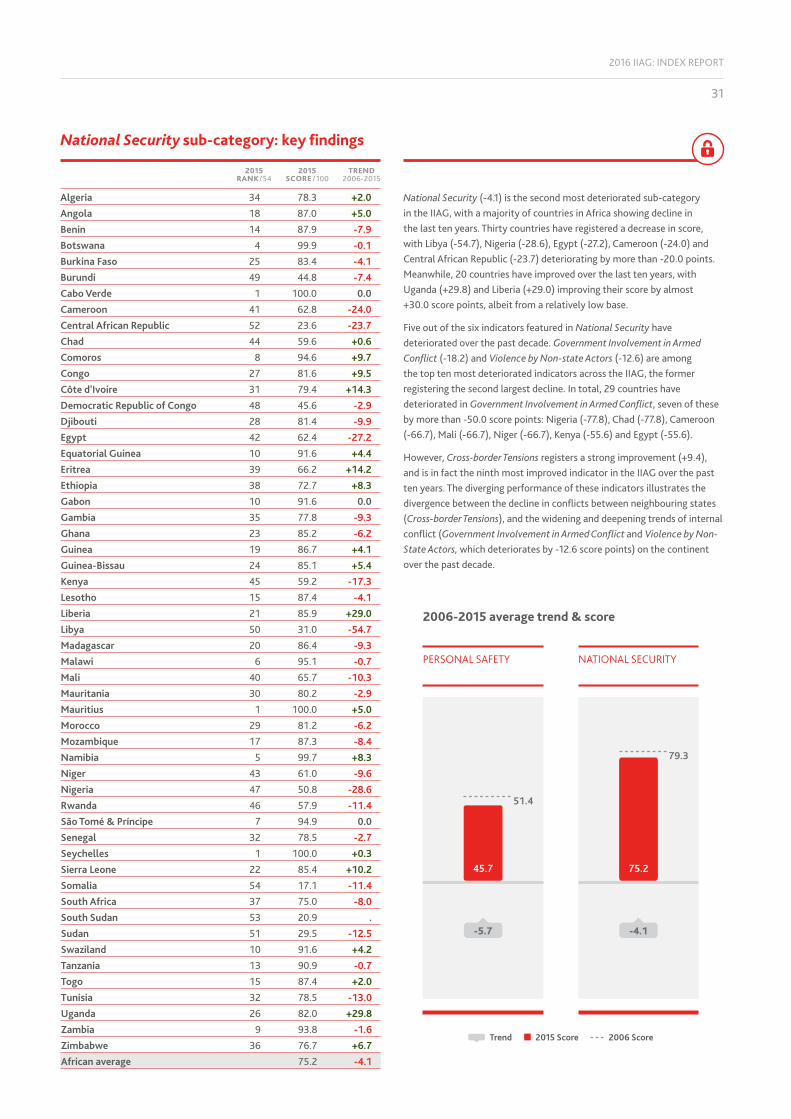
National Security (-4.1) is the second most deteriorated sub-category in the IIAG, with a majority of countries in Africa showing decline in the last ten years. Thirty countries have registered a decrease in score, with Libya (-54.7), Nigeria (-28.6), Egypt (-27.2), Cameroon (-24.0) and Central African Republic (-23.7) deteriorating by more than -20.0 points. Meanwhile, 20 countries have improved over the last ten years, with Uganda (+29.8) and Liberia (+29.0) improving their score by almost +30.0 score points, albeit from a relatively low base.
Five out of the six indicators featured in National Security have deteriorated over the past decade. Government Involvement in Armed Conflict (-18.2) and Violence by Non-state Actors (-12.6) are among the top ten most deteriorated indicators across the IIAG, the former registering the second largest decline. In total, 29 countries have deteriorated in Government Involvement in Armed Conflict, seven of these by more than -50.0 score points: Nigeria (-77.8), Chad (-77.8), Cameroon (-66.7), Mali (-66.7), Niger (-66.7), Kenya (-55.6) and Egypt (-55.6).
However, Cross-border Tensions registers a strong improvement (+9.4), and is in fact the ninth most improved indicator in the IIAG over the past ten years. The diverging performance of these indicators illustrates the divergence between the decline in conflicts between neighbouring states (Cross-border Tensions), and the widening and deepening trends of internal conflict (Government Involvement in Armed Conflict and Violence by Non-State Actors, which deteriorates by -12.6 score points) on the continent over the past decade.
2015 Score 2006 ScoreTrend
PERSONAL SAFETY
-5.7
45.7
51.4
NATIONAL SECURITY
-4.1
75.2
79.3
National Security sub-category: key findings
2006-2015 average trend & score

32
Algeria 30 31.9 -11.6Angola 46 16.0 +1.5Benin 21 39.0 +1.2Botswana 1 72.1 -1.8Burkina Faso 13 48.0 +0.3Burundi 42 20.9 -3.8Cabo Verde 6 60.5 -7.9Cameroon 33 30.9 +1.0Central African Republic 48 12.9 -1.8Chad 43 20.1 -1.6Comoros 31 31.7 -1.5Congo 44 19.0 +3.0Côte d'Ivoire 16 44.1 +25.0Democratic Republic of Congo 38 26.2 +13.1Djibouti 39 24.9 +3.4Egypt 18 41.9 -1.2Equatorial Guinea 53 4.2 -3.9Eritrea 50 12.3 -15.1Ethiopia 14 46.7 +16.9Gabon 35 28.8 -4.5Gambia 37 26.3 -8.9Ghana 11 50.2 -5.4Guinea 47 15.8 -7.9Guinea-Bissau 45 18.0 +8.0Kenya 15 44.7 +2.7Lesotho 8 59.8 +6.5Liberia 24 37.8 +9.0Libya 51 5.4 -15.3Madagascar 26 36.3 -8.3Malawi 34 29.4 -12.0Mali 20 39.4 -12.3Mauritania 40 24.2 -9.2Mauritius 3 65.6 -5.9Morocco 12 49.6 +10.0Mozambique 36 28.4 -13.5Namibia 7 60.4 -1.1Niger 23 38.4 +2.6Nigeria 28 33.6 +6.0Rwanda 2 69.1 +15.9São Tomé & Príncipe 22 38.8 +7.1Senegal 10 51.1 +6.3Seychelles 9 55.9 +4.2Sierra Leone 27 34.2 +4.8Somalia 54 0.9 -4.0South Africa 4 61.5 -13.1South Sudan 52 4.3 .Sudan 48 12.9 -4.3Swaziland 19 40.5 -7.9Tanzania 25 36.9 -8.3Togo 29 32.4 +11.4Tunisia 5 61.2 +6.6Uganda 32 31.1 -4.4Zambia 17 42.5 +8.7Zimbabwe 40 24.2 -0.9African average 35.1 -1.0
2015 RANK/54
2015 SCORE /100
TREND2006-2015
Accountability (35.1) is the lowest scoring sub-category, on average, of the IIAG, and has registered a slight deterioration (-1.0) over the last ten years.
Twenty-nine countries have deteriorated in Accountability since 2006, while 24 have improved. As with the other sub-categories within Safety & Rule of Law, Libya (-15.3) is the most deteriorated country, with six other countries registering declines of more than -10.0 points over the last ten years: Eritrea (-15.1), Mozambique (-13.5), South Africa (-13.1), Mali (-12.3), Malawi (-12.0) and Algeria (-11.6).
Côte d’Ivoire (+25.0) has shown the largest improvement in Accountability on the continent, and is the only country to have improved its score every year since 2006. Ethiopia (+16.9), Rwanda (+15.9), Democratic Republic of Congo (+13.1), Togo (+11.4) and Morocco (+10.0) have also shown notably positive trends in this sub-category over the past ten years.
The decline in Accountability seen on the continent over the past decade has been driven by deterioration in five of the eight constituent indicators of this sub-category: Corruption & Bureaucracy (-8.7), Corruption in Government & Public Officials (-2.8), Corruption Investigation (-1.9), Accountability of Public Officials (-1.1) and Diversion of Public Funds (-0.3).
Whilst the indicators Online Services (+5.8), Access to Information (+1.3) and Public Sector Accountability & Transparency (+0.5) have shown improvement since 2006, their scores remain relatively low (29.0, 30.2 and 52.2 respectively). On average, Accountability indicators rank among the lowest scoring in the IIAG, with seven of the eight constituent indicators of this sub-category placed in the bottom 20 scoring indicators of the IIAG.
A Decade of African Governance: Safety & Rule of Law
Accountability sub-category: key findings
ACCOUNTABILITY
-1.0
35.1
36.1
2015 Score 2006 ScoreTrend
2006-2015 average trend & score

2016 IIAG: INDEX REPORT
33
SPOTLIGHT
Corruption: still a worrying trend
The issue of corruption cuts across all dimensions of the Index. Indicators such as Judicial Independence and Property Rights, both in the Rule of Law sub-category for example, partly assess the impact of corruption while measures in other categories such as Transparency of State-owned Companies in Sustainable Economic Opportunity touch upon the subject. Measuring aspects of corruption is however a main focus in Accountability.
Accountability shows, on average, some negative trends over the decade in the state of corruption on the continent.
The decline of the continental average score for the indicator Corruption & Bureaucracy (-8.7) is especially concerning. This indicator, which is provided by the World Bank, assesses the intrusiveness of bureaucracy and the amount of red tape likely to be encountered, as well as the likelihood of encountering corrupt public officials and other groups. The African average score for this indicator is only 36.6 and in 2015 24 countries have arrived at their worst ever score. This is almost half of the continent. Thirty-three countries show deterioration over the last decade in this indicator and almost half of these (15) decline by more than -20.0 score points. Four countries score 0.0 in 2015 (Central African Republic, Equatorial Guinea, Libya and Somalia).
Other declining Accountability indicators that measure aspects of corruption highlight further concerns at the country level. In Corruption in Government & Public Officials, for example, an indicator from the Economist Intelligence Unit that assesses levels of cronyism and the degree to which public officials are involved in corrupt practices, 13 countries score 0.0 in 2015 (Angola, Burundi, Chad, Congo, Democratic Republic of Congo, Equatorial Guinea, Guinea, Guinea-Bissau, Malawi, Somalia, South Sudan, Sudan and Zimbabwe) and only 11 countries have managed to improve their score in the last ten years.
The highest scoring indicator in Accountability (at the continental level) is Public Sector Accountability & Transparency (52.2). Provided by the African Development Bank and World Bank, this indicator, which captures the extent to which the executive and public employees can be held to account by the electorate, legislative and judiciary, does show a minor average continental improvement since 2006 (+0.5) but under half (26) of countries have improved in the last ten years. All of the other indicators score below 40.0, and the majority are showing negative trends.
The introduction of Fighting Corruption from Afrobarometer in the 2016 IIAG includes for the first time a measure in Accountability which adds citizens’ perceptions of corruption on the continent. This underlying measure of the Corruption Investigation indicator (which declines
on average by -1.9 score points) assesses the extent to which the public are satisfied with how the government is handling fighting corruption in government. The African average score for this measure is only 36.3 and shows a sizeable average decline of -14.4 score points since 2006. Of the 33 countries which Afrobarometer has surveyed for this measure and for which there is a ten-year trend available, 22 have declined in the last ten years and 12 of these by more than -20.0 score points. Large declines of -40.0 points or more are seen in Madagascar (-78.1), Sierra Leone (-63.0), Ghana (-51.1), Malawi (-48.3), South Africa (-44.0), Tanzania (-42.9) and Liberia (-42.0).
Even if Afrobarometer has only surveyed 37 of 54 countries for this measure, with a ten-year trend available for only 33 of these, the average results are representative of the opinions of 73% of the continent’s population.
Fifteen countries have declined by more than -20.0 score points in the indicator Corruption & Bureaucracy over the last decade.

34
Algeria 36 42.8 -14.2Angola 45 34.2 +2.3Benin 13 67.5 +0.2Botswana 3 93.0 -2.6Burkina Faso 27 54.2 +3.4Burundi 47 30.4 -21.9Cabo Verde 4 88.7 +2.5Cameroon 36 42.8 +0.3Central African Republic 51 17.9 -9.9Chad 39 40.3 +4.8Comoros 33 50.3 +8.2Congo 43 37.9 +0.1Côte d'Ivoire 38 42.1 +13.5Democratic Republic of Congo 44 36.4 +6.0Djibouti 34 47.2 +4.5Egypt 15 63.6 +2.2Equatorial Guinea 48 25.7 -2.9Eritrea 53 14.9 -15.2Ethiopia 30 52.0 +3.7Gabon 32 51.2 +0.6Gambia 41 39.6 -7.1Ghana 5 88.0 +8.0Guinea 19 58.0 +17.2Guinea-Bissau 46 34.0 +2.5Kenya 11 71.6 +6.5Lesotho 12 68.4 +3.6Liberia 24 54.6 +14.5Libya 52 16.1 -22.1Madagascar 16 59.4 -0.7Malawi 8 74.8 +4.0Mali 24 54.6 -6.1Mauritania 40 39.9 -15.3Mauritius 1 94.9 +1.8Morocco 23 55.8 +0.5Mozambique 31 51.6 -11.8Namibia 6 83.9 -3.2Niger 24 54.6 +2.8Nigeria 28 53.4 -3.9Rwanda 21 56.6 +0.8São Tomé & Príncipe 35 45.5 -12.2Senegal 7 75.4 +12.5Seychelles 10 72.7 -1.0Sierra Leone 20 57.9 +20.0Somalia 54 7.0 -0.2South Africa 2 94.6 +2.8South Sudan 50 20.9 .Sudan 49 23.5 +3.2Swaziland 22 56.4 -5.5Tanzania 16 59.4 -1.2Togo 29 52.3 +2.4Tunisia 14 66.1 +13.8Uganda 18 58.2 -11.4Zambia 9 73.1 +1.8Zimbabwe 42 38.3 +11.1African average 52.7 -0.3
2015 RANK/54
2015 SCORE /100
TREND2006-2015
Rule of Law is the fourth highest scoring sub-category of the IIAG (out of 14), achieving a continental average score of 52.7 in 2015. However, it is also one of the seven sub-categories to show deterioration (-0.3) over the decade, albeit marginal.
Thirty-three countries have registered improvement in Rule of Law since 2006; it is the only sub-category within Safety & Rule of Law in which a majority of countries have shown positive trends over the last ten years. Whilst seven countries show an improvement of more than +10.0 points – Sierra Leone (+20.0), Guinea (+17.2), Liberia (+14.5), Tunisia (+13.8), Côte d’Ivoire (+13.5), Senegal (+12.5) and Zimbabwe (+11.1) – eight of the 20 countries to have deteriorated register declines in excess of -10.0 points: Libya (-22.1), Burundi (-21.9), Mauritania (-15.3), Eritrea (-15.2), Algeria (-14.2), São Tomé & Príncipe (-12.2), Mozambique (-11.8) and Uganda (-11.4).
Diverging performance at the country level is also reflected in the diversity of country scores in 2015; Rule of Law has the largest range of scores between the highest scoring country (Mauritius, 94.9) and the lowest scoring country (Somalia, 7.0) of all 14 sub-categories, with a range of 87.9 between them.
At the indicator level, deteriorations in Sanctions (-5.5), Transfers of Power (-3.7) and Property Rights (-2.3) have driven the marginal decline of Rule of Law since 2006. The two other indicators, Judicial Process (+5.3) and Judicial Independence (+4.3), register positive trends over the last ten years. Thirty-four countries have improved in Judicial Independence, although country scores remain fairly low on average. Mauritius (94.6), South Africa (93.9) and Namibia (92.9) show particularly strong performances in Judicial Independence, as both high ranking (1st, 2nd and 3rd on the continent) and improving countries.
A Decade of African Governance: Safety & Rule of Law
Rule of Law sub-category: key findings
RULE OF LAW
2015 Score 2006 ScoreTrend
-0.3
52.7
53.0
2006-2015 average trend & score

2016 IIAG: INDEX REPORT
35
SPOTLIGHT
Safety & Rule of Law and Sustainable Economic Opportunity: a strong correlation
There is a close relationship between Safety & Rule of Law and Sustainable Economic Opportunity: countries which score highly in one of these dimensions tend to perform well in the other. Over the past ten years, these categories have a high correlation (r = 0.85), the highest between any two categories within the 2016 IIAG.
At the sub-category level, the strongest correlations with Sustainable Economic Opportunity are Accountability and Rule of Law (r=0.88 and 0.84 respectively). This would imply that there is a link between a country’s level of accountability and the degree to which rule of law exists and the extent to which the state has capacity to create economic opportunities for its citizens. The other two sub-categories in Safety & Rule of Law – Personal Safety and National Security – show less of a correlation with Sustainable Economic Opportunity (0.65 and 0.58 respectively).
100
75
50
25
00 25 50 75 100
Safety & Rule of Law
Sustainable Economic Opportunity
Somalia
South Sudan
Sudan
CARLibya
BurundiEritreaDRC
Equatorial Guinea
Guinea Bissau
Guinea
Congo
DjiboutiGabon
Nigeria
Gambia
ZimbabweMauritaniaCameroon
Angola
AlgeriaMaliEgypt
Tunisia
Kenya
MozambiqueEthiopia
Burkina Faso UgandaMadagascar
São Tomé & Príncipe
Ghana
TogoComorosTanzania
LiberiaSwaziland
BeninSenegal
ZambiaLesotho
Cabo Verde
RwandaMorocco
South Africa
SeychellesNamibia
Botswana Mauritius
CÔte d’Ivoire
Sierra Leone
Chad
Safety & Rule of Law 0.85
Rule of Law 0.84
Accountability 0.88
Personal Safety 0.65
National Security 0.58
Sustainable Economic Opportunity
Correlations

PARTICIPATION & HUMAN RIGHTS
Participation
Rights
Gender

38
Performance in Participation & Human Rights has improved on the continent in the past ten years, registering an increase of +2.4 score points since 2006 to reach a score of 50.0 in 2015. Progress has been driven by the Gender (+4.3) and Participation (+3.0) sub-categories, while Rights (-0.2) registered a marginal deterioration over the period.
The majority (37) of countries have seen progress in Participation & Human Rights over the past decade; 78% of African citizens live in a country that has improved in this governance dimension. The largest improvement has been seen in Tunisia (+22.4), with five other countries registering a score increase of more than +10.0 points: Côte d’Ivoire (+18.6), Zimbabwe (+14.7), Gabon (+11.5), Togo (+10.7) and Guinea-Bissau (+10.3). Côte d’Ivoire shows a particularly notable positive trend; it is the only country to have shown consistently improved performance in this category every year since 2006.
Seventeen countries have progressed across all three sub-categories of Participation & Human Rights. Although the majority of these feature in the bottom half of the category rankings (Algeria, Angola, Chad, Djibouti, Gabon, Guinea-Bissau, Rwanda, Somalia, Togo and Zimbabwe), already high scoring countries such as Namibia (76.1) and Tunisia (71.4) also show this trend.
Despite this overall trend of improvement, 15 countries register deterioration, with Mali (-12.4) and Gambia (-11.8) registering the largest declines of over -10.0 points, driven by dramatic falls in the Participation sub-category (-17.3 and -16.6 points respectively). Seven countries register deterioration across all three sub-categories: Botswana, Eritrea, Gambia, Mali, Mauritania, South Africa and Swaziland.
Comparing the results of this category with political transitions that have occurred in Africa in the past decade, nearly 70% of African citizens live in a country that has had a change of head of state and seen improvement in Participation & Human Rights during this period. On the other hand, seven countries, who have kept the same head of state for the past ten years, have registered decline: Burundi (-0.3), Cameroon (-2.4), Democratic Republic of Congo (-0.5), Eritrea (-4.5), Gambia (-11.8), Lesotho (-0.1) and Swaziland (-4.5). Apart from Lesotho (14th), Liberia (20th) and Uganda (19th), all countries that have had the same leader since 2006 feature in the bottom half of the rankings in this category.
2015 SCORE /100 TREND 2006-20152015 RANK /54
1st Cabo Verde 82.0 +0.62nd Namibia 76.1 +6.03rd Mauritius 76.0 +0.84th Ghana 73.1 +0.15th South Africa 71.4 -1.25th Tunisia 71.4 +22.47th Senegal 69.8 +0.98th Botswana 69.3 -4.19th Benin 68.6 0.010th Seychelles 67.1 +4.011th Malawi 65.8 +5.812th São Tomé & Príncipe 65.1 -2.813th Madagascar 64.7 +1.014th Lesotho 64.6 -0.115th Tanzania 63.5 +1.016th Zambia 61.4 +3.817th Kenya 60.6 +3.618th Sierra Leone 59.9 +4.719th Uganda 59.6 +4.120th Liberia 58.9 +7.021st Mozambique 58.3 -1.322nd Burkina Faso 57.6 +1.523rd Niger 55.2 +5.324th Comoros 54.4 -1.325th Côte d'Ivoire 54.3 +18.626th Nigeria 53.1 +6.127th Mali 52.5 -12.428th Rwanda 51.6 +8.829th Guinea-Bissau 50.6 +10.3 African average 50.0 +2.430th Gabon 49.0 +11.531st Togo 48.3 +10.732nd Guinea 47.6 +7.033rd Algeria 45.6 +6.934th Zimbabwe 45.1 +14.735th Burundi 44.0 -0.336th Morocco 43.2 +7.437th Central African Republic 38.8 -1.138th Congo 38.7 +3.739th Cameroon 37.9 -2.439th Ethiopia 37.9 +6.141st Djibouti 37.4 +3.142nd Democratic Republic of Congo 36.2 -0.543rd Mauritania 35.8 -7.644th Angola 35.5 +4.545th Chad 32.6 +2.446th Egypt 32.2 +5.647th Gambia 30.1 -11.848th Swaziland 27.6 -4.549th South Sudan 24.4 .50th Libya 22.5 +0.351st Sudan 21.8 +2.652nd Equatorial Guinea 19.8 +0.953rd Eritrea 19.7 -4.554th Somalia 13.7 +4.7
Key findings
A Decade of African Governance: Participation & Human Rights
78% of African citizens live in a country whose performance in Participation & Human Rights has improved over the past decade.
Nearly 70% of African citizens live in a country that has had a change of head of state and seen improvement in Participation & Human Rights over the past decade.

2016 IIAG: INDEX REPORT
39
Ten-year country trends
-15.0 -10.0 -5.0 +25.00.0 +20.0+5.0 +10.0 +15.0
TunisiaCôte d'IvoireZimbabweGabonTogoGuinea-BissauRwandaMoroccoLiberiaGuineaAlgeriaNigeriaEthiopiaNamibiaMalawiEgyptNigerSomaliaSierra LeoneAngolaUgandaSeychellesZambiaCongoKenyaDjiboutiSudanChadBurkina FasoMadagascarTanzaniaEquatorial GuineaSenegalMauritiusCabo VerdeLibyaGhanaBeninLesothoBurundiDemocratic Republic of CongoCentral African RepublicSouth AfricaMozambiqueComorosCameroonSão Tomé & PríncipeBotswanaSwazilandEritreaMauritaniaGambiaMali
71.454.345.149.048.350.651.643.258.947.645.653.137.976.165.832.255.213.759.935.559.667.161.438.760.637.421.832.657.664.763.519.869.876.082.022.573.168.664.644.036.238.871.458.354.437.965.169.327.619.735.830.152.5
COUNTRY SCORE CHANGE 2006-2015 2015 SCORE
-0.1-0.3-0.5
-1.1-1.2-1.3-1.3
-2.4-2.8
-4.1-4.5-4.5
-7.6-11.8
-12.4
+22.4+18.6
+14.7+11.5
+10.7+10.3
+8.8+7.4
+7.0+7.0+6.9
+6.1+6.1+6.0+5.8+5.6
+5.3+4.7+4.7
+4.5+4.1+4.0+3.8+3.7+3.6
+3.1+2.6
+2.4+1.5
+1.0+1.0+0.9+0.9+0.8+0.6+0.3+0.1
0.0
As South Sudan does not have data prior to 2011, no trends over the ten-year period are available for that country. Improvement since 2006 Deterioration since 2006
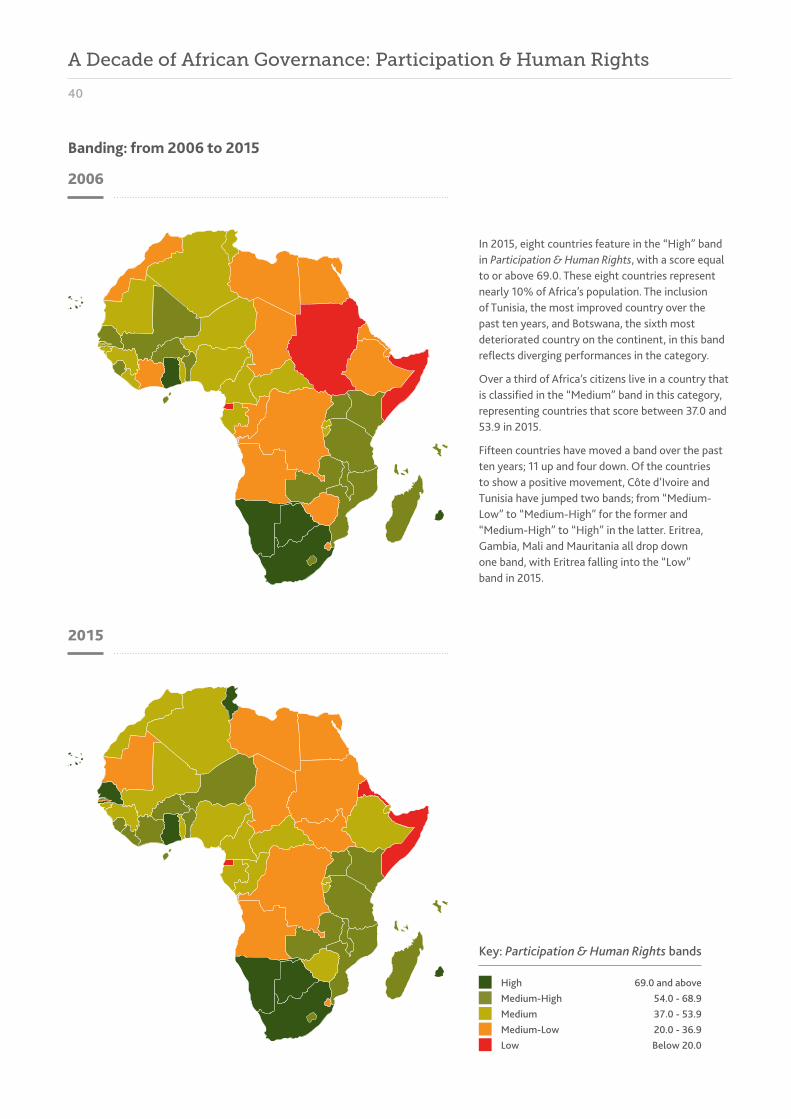
40
Key: Participation & Human Rights bands
High 69.0 and aboveMedium-High 54.0 - 68.9Medium 37.0 - 53.9Medium-Low 20.0 - 36.9Low Below 20.0
In 2015, eight countries feature in the “High” band in Participation & Human Rights, with a score equal to or above 69.0. These eight countries represent nearly 10% of Africa’s population. The inclusion of Tunisia, the most improved country over the past ten years, and Botswana, the sixth most deteriorated country on the continent, in this band reflects diverging performances in the category.
Over a third of Africa’s citizens live in a country that is classified in the “Medium” band in this category, representing countries that score between 37.0 and 53.9 in 2015.
Fifteen countries have moved a band over the past ten years; 11 up and four down. Of the countries to show a positive movement, Côte d’Ivoire and Tunisia have jumped two bands; from “Medium-Low” to “Medium-High” for the former and “Medium-High” to “High” in the latter. Eritrea, Gambia, Mali and Mauritania all drop down one band, with Eritrea falling into the “Low” band in 2015.
2006
2015
Banding: from 2006 to 2015
A Decade of African Governance: Participation & Human Rights

2016 IIAG: INDEX REPORT
41
Key: Participation & Human Rights
Country improves in bandingCountry deteriorates in bandingNo change
CongoDjiboutiEthiopia
MoroccoZimbabwe
LiberiaNiger
Côte d’Ivoire
Senegal Tunisia
GambiaMauritania
Eritrea
Mali
Sudan
High69.0 and above
Medium-High54.0 - 68.9
Medium 37.0 - 53.9
Medium-Low20.0 - 36.9
LowBelow 20.0
Move up a band since 2006
2015 band Move down a band since 2006
Countries moving more than a single band.
Countries improving & deteriorating in bands from 2006 to 2015
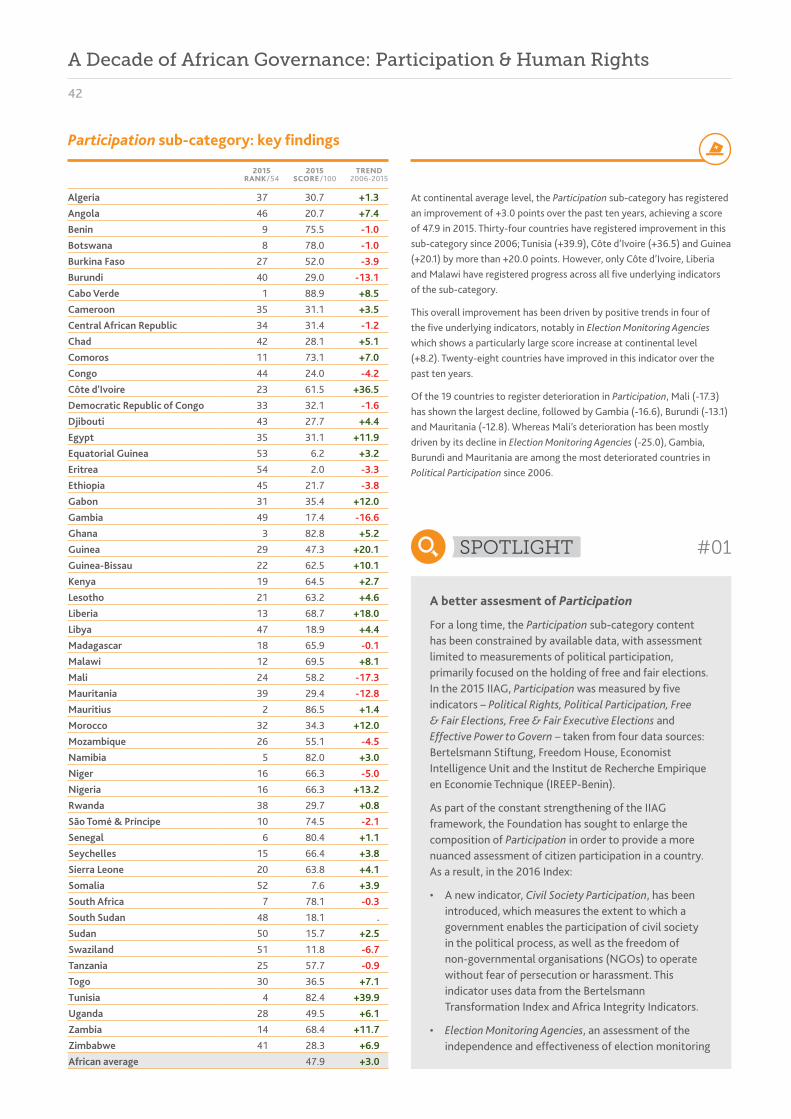
42
Algeria 37 30.7 +1.3Angola 46 20.7 +7.4Benin 9 75.5 -1.0Botswana 8 78.0 -1.0Burkina Faso 27 52.0 -3.9Burundi 40 29.0 -13.1Cabo Verde 1 88.9 +8.5Cameroon 35 31.1 +3.5Central African Republic 34 31.4 -1.2Chad 42 28.1 +5.1Comoros 11 73.1 +7.0Congo 44 24.0 -4.2Côte d'Ivoire 23 61.5 +36.5Democratic Republic of Congo 33 32.1 -1.6Djibouti 43 27.7 +4.4Egypt 35 31.1 +11.9Equatorial Guinea 53 6.2 +3.2Eritrea 54 2.0 -3.3Ethiopia 45 21.7 -3.8Gabon 31 35.4 +12.0Gambia 49 17.4 -16.6Ghana 3 82.8 +5.2Guinea 29 47.3 +20.1Guinea-Bissau 22 62.5 +10.1Kenya 19 64.5 +2.7Lesotho 21 63.2 +4.6Liberia 13 68.7 +18.0Libya 47 18.9 +4.4Madagascar 18 65.9 -0.1Malawi 12 69.5 +8.1Mali 24 58.2 -17.3Mauritania 39 29.4 -12.8Mauritius 2 86.5 +1.4Morocco 32 34.3 +12.0Mozambique 26 55.1 -4.5Namibia 5 82.0 +3.0Niger 16 66.3 -5.0Nigeria 16 66.3 +13.2Rwanda 38 29.7 +0.8São Tomé & Príncipe 10 74.5 -2.1Senegal 6 80.4 +1.1Seychelles 15 66.4 +3.8Sierra Leone 20 63.8 +4.1Somalia 52 7.6 +3.9South Africa 7 78.1 -0.3South Sudan 48 18.1 .Sudan 50 15.7 +2.5Swaziland 51 11.8 -6.7Tanzania 25 57.7 -0.9Togo 30 36.5 +7.1Tunisia 4 82.4 +39.9Uganda 28 49.5 +6.1Zambia 14 68.4 +11.7Zimbabwe 41 28.3 +6.9African average 47.9 +3.0
2015 RANK/54
2015 SCORE /100
TREND2006-2015
At continental average level, the Participation sub-category has registered an improvement of +3.0 points over the past ten years, achieving a score of 47.9 in 2015. Thirty-four countries have registered improvement in this sub-category since 2006; Tunisia (+39.9), Côte d’Ivoire (+36.5) and Guinea (+20.1) by more than +20.0 points. However, only Côte d’Ivoire, Liberia and Malawi have registered progress across all five underlying indicators of the sub-category.
This overall improvement has been driven by positive trends in four of the five underlying indicators, notably in Election Monitoring Agencies which shows a particularly large score increase at continental level (+8.2). Twenty-eight countries have improved in this indicator over the past ten years.
Of the 19 countries to register deterioration in Participation, Mali (-17.3) has shown the largest decline, followed by Gambia (-16.6), Burundi (-13.1) and Mauritania (-12.8). Whereas Mali’s deterioration has been mostly driven by its decline in Election Monitoring Agencies (-25.0), Gambia, Burundi and Mauritania are among the most deteriorated countries in Political Participation since 2006.
A better assesment of Participation
For a long time, the Participation sub-category content has been constrained by available data, with assessment limited to measurements of political participation, primarily focused on the holding of free and fair elections. In the 2015 IIAG, Participation was measured by five indicators – Political Rights, Political Participation, Free & Fair Elections, Free & Fair Executive Elections and Effective Power to Govern – taken from four data sources: Bertelsmann Stiftung, Freedom House, Economist Intelligence Unit and the Institut de Recherche Empirique en Economie Technique (IREEP-Benin).
As part of the constant strengthening of the IIAG framework, the Foundation has sought to enlarge the composition of Participation in order to provide a more nuanced assessment of citizen participation in a country. As a result, in the 2016 Index:
• A new indicator, Civil Society Participation, has been introduced, which measures the extent to which a government enables the participation of civil society in the political process, as well as the freedom of non-governmental organisations (NGOs) to operate without fear of persecution or harassment. This indicator uses data from the Bertelsmann Transformation Index and Africa Integrity Indicators.
• Election Monitoring Agencies, an assessment of the independence and effectiveness of election monitoring
SPOTLIGHT #01
Participation sub-category: key findings
A Decade of African Governance: Participation & Human Rights

2016 IIAG: INDEX REPORT
43
agencies from Africa Integrity Indicators, has been added as a new indicator.
• Political Participation has been strengthened by the inclusion of Political Freedom, a measure from Afrobarometer assessing the freedom of citizens to join a political organisation and to vote, alongside existing measures from the Economist Intelligence Unit (EIU) and Freedom House (FH).
• Interestingly, in the Afrobarometer measure, 22 of the 33 African countries surveyed show diverging trends to those seen in the EIU and FH data. The majority (14) of these countries register a decline in Political Freedom, as opposed to improvements seen in the non-Afrobarometer measures.
Still, for the most part, the indicators included in this sub-category remain focused on electoral participation. Assessments of democracy in Africa continue to be driven by indicators based on the outcomes of elections, with few alternative measures available. The Mo Ibrahim Foundation looks forward to the strengthening and extension of indicators measuring participation, particularly in the civil society space, for inclusion in future iterations of the Index.
Measuring civil society space
In previous iterations of the IIAG the assessment of civil society has been limited to indicators in the Rights sub-category that measure citizens’ freedoms of expression, association and assembly.
For the first time, the 2016 IIAG includes a specific indicator that explicitly measures civil society, featured in the Participation sub-category. Compiled using data from the Bertelsmann Transformation Index (BTI) and the Africa Integrity Indicators (AII), it captures the extent to which civil society actors are allowed to participate in the political process, as well as the freedom of non-governmental organisations (NGOs) to operate without fear of persecution or harassment.
Over the past ten years, the indicator Civil Society Participation has registered a marginal improvement (+0.5) at the continental level. However, looking beyond the African average, diverse trends can be found at the country level. Twenty-five countries have seen an
improvement in this measure since 2006, representing almost 40% of the African population, with the largest increases in score found in Guinea-Bissau (+33.3), Zimbabwe (+26.2) and Côte d’Ivoire (+22.0). Zimbabwe’s performance in this indicator drives to a large extent its improvement in Participation at the sub-category level. On the other hand, nearly half of the African population live in a country that has deteriorated in Civil Society Participation, with six countries registering a decline of more than -15.0 points: Mali (-23.9), Ethiopia (-18.4), Niger (-17.9), Angola (-17.8), Gambia (-16.7) and Burundi (-16.0).
Looking at the underlying data of this indicator, the measure from BTI that assesses the participation of civil society in the political process has shown an average improvement of +2.0 points over the past ten years. On the other hand, Freedom of NGOs (-1.7), compiled using three measures from AII, has shown an overall decline since 2006. All three measures have seen deterioration at the continental level in the last decade, with particular decline found in the measurement of harassment of NGOs by the government.
The sub-category Rights contains two indicators that can be used as additional proxies for an assessment of the civil society space in Africa. Freedom of Expression and Freedom of Association & Assembly have both shown an overall decline in score since 2006, of -2.7 points and -4.4 points respectively. Two-thirds of the countries on the continent, representing 67% of the African population, have shown deterioration in Freedom of Expression in the past ten years; Kenya shows the largest decline (-16.5). In Freedom of Association & Assembly, eight countries have declined by more than -20.0 score points, including high scoring countries such as Mauritius (-21.5) and South Africa (-20.1).
Eleven countries, covering over a quarter (27%) of the continent’s population, have declined across all three civil society measures – Civil Society Participation, Freedom of Expression and Freedom of Association & Assembly – in the past ten years, pointing at a restriction of the civil society space: Angola, Benin, Burundi, Congo, Ethiopia, Kenya, Mali, Mauritania, Sierra Leone, Sudan and Tanzania.
SPOTLIGHT #02
Eleven countries, covering over a quarter (27%) of the continent’s population, have declined across all three civil society measures.

44
Algeria 22 52.2 +5.9Angola 42 30.7 +1.2Benin 7 68.0 -9.3Botswana 8 66.8 -1.4Burkina Faso 9 65.8 +7.8Burundi 46 28.6 -10.6Cabo Verde 1 81.5 -8.7Cameroon 38 34.0 -9.0Central African Republic 41 31.0 -5.2Chad 47 28.3 +0.2Comoros 31 49.3 -10.0Congo 35 36.7 +0.3Côte d'Ivoire 30 49.5 +19.3Democratic Republic of Congo 39 33.1 -0.4Djibouti 44 29.7 +3.4Egypt 43 29.8 -5.2Equatorial Guinea 53 9.7 -5.3Eritrea 53 9.7 -1.8Ethiopia 40 32.0 +3.6Gabon 27 50.9 +7.3Gambia 48 22.1 -4.8Ghana 4 71.9 -3.1Guinea 34 44.9 +9.6Guinea-Bissau 20 54.5 +14.8Kenya 28 50.7 +0.4Lesotho 14 61.0 -1.6Liberia 25 51.5 +4.0Libya 49 21.7 -1.9Madagascar 21 52.5 -10.7Malawi 9 65.8 +8.6Mali 15 60.6 -13.9Mauritania 33 45.1 -8.3Mauritius 2 76.5 -0.3Morocco 29 50.4 +5.7Mozambique 19 55.2 -12.9Namibia 3 72.5 +0.3Niger 12 63.6 +10.7Nigeria 32 45.8 +2.4Rwanda 36 34.7 +0.9São Tomé & Príncipe 13 62.8 -6.5Senegal 5 70.9 +4.1Seychelles 17 59.0 -0.1Sierra Leone 18 55.5 +3.4Somalia 52 10.7 +1.4South Africa 6 68.2 -1.3South Sudan 50 19.4 .Sudan 51 17.3 -0.9Swaziland 45 29.5 -3.2Tanzania 16 59.4 -0.9Togo 23 51.9 +12.5Tunisia 11 65.7 +26.3Uganda 23 51.9 -3.8Zambia 26 51.2 -10.8Zimbabwe 36 34.7 +16.3African average 46.8 -0.2
2015 RANK/54
2015 SCORE /100
TREND2006-2015
Rights is the only sub-category in Participation & Human Rights to register a marginal decline (-0.2) over the decade. Twenty-eight countries have deteriorated in Rights since 2006, with five showing a decline of more than -10.0 points: Mali (-13.9), Mozambique (-12.9), Zambia (-10.8), Madagascar (-10.7) and Burundi (-10.6).
Moreover, and rather concerningly, six of the ten highest scoring countries in Rights have seen deterioration in the past ten years: Benin (-9.3), Cabo Verde (-8.7), Ghana (-3.1), Botswana (-1.4), South Africa (-1.3) and Mauritius (-0.3).
Driving this overall negative trend, four of the five underlying indicators have shown, on average, important deteriorations since 2006: Civil Liberties (-5.1), Freedom of Association & Assembly (-4.4), Human Rights Violations (-4.3) and Freedom of Expression (-2.7).
However, some countries register striking progress, even if they remain low scoring in general. Tunisia (+26.3) is the most improved country, followed by Côte d’Ivoire (+19.3), Zimbabwe (+16.3), Guinea-Bissau (+14.8), Togo (+12.5) and Niger (+10.7).
Rights sub-category: key findings
A Decade of African Governance: Participation & Human Rights
2015 Score 2006 ScoreTrend
RIGHTS
-0.2
46.8
47.0
PARTICIPATION
47.9
44.9
+3.0
2006-2015 average trend & score

2016 IIAG: INDEX REPORT
45
Algeria 32 53.8 +13.4Angola 29 55.2 +5.0Benin 19 62.2 +10.1Botswana 18 63.2 -9.8Burkina Faso 30 55.1 +0.7Burundi 6 74.5 +22.7Cabo Verde 4 75.7 +2.1Cameroon 37 48.7 -1.5Central African Republic 32 53.8 +3.0Chad 43 41.4 +1.9Comoros 45 40.9 -1.0Congo 28 55.3 +14.8Côte d'Ivoire 34 51.8 -0.2Democratic Republic of Congo 42 43.5 +0.6Djibouti 31 54.8 +1.5Egypt 48 35.8 +10.2Equatorial Guinea 41 43.6 +4.7Eritrea 38 47.4 -8.5Ethiopia 23 60.0 +18.4Gabon 21 60.8 +15.2Gambia 36 50.7 -14.0Ghana 15 64.7 -1.7Guinea 35 50.8 -8.3Guinea-Bissau 50 34.9 +6.2Kenya 12 66.7 +7.8Lesotho 10 69.8 -2.9Liberia 26 56.6 -0.8Libya 53 26.9 -1.7Madagascar 4 75.7 +13.9Malawi 20 62.1 +0.6Mali 46 38.8 -6.0Mauritania 51 32.8 -1.9Mauritius 14 65.0 +1.4Morocco 40 45.0 +4.5Mozambique 16 64.6 +13.5Namibia 7 73.9 +14.9Niger 49 35.7 +10.2Nigeria 39 47.3 +2.6Rwanda 1 90.3 +24.6São Tomé & Príncipe 25 58.1 +0.3Senegal 24 58.2 -2.5Seychelles 3 76.0 +8.3Sierra Leone 22 60.5 +6.6Somalia 54 22.9 +8.8South Africa 11 67.8 -2.2South Sudan 47 35.9 .Sudan 52 32.4 +6.3Swaziland 43 41.4 -3.8Tanzania 8 73.2 +4.7Togo 26 56.6 +12.7Tunisia 13 66.1 +0.9Uganda 2 77.4 +10.0Zambia 16 64.6 +10.7Zimbabwe 9 72.4 +20.9African average 55.4 +4.3
2015 RANK/54
2015 SCORE /100
TREND2006-2015
The continental average score in Gender is 55.4, making it the third highest scoring sub-category of the IIAG in 2015. Gender has also seen an overall positive trend in the past decade, improving by +4.3 points since 2006.
The majority of the countries on the continent (37) have shown progress in this sub-category. Rwanda in particular has shown notable improvement in the past ten years, as both the highest scoring (90.3), and most improved (+24.6) country in Gender on the continent.
The positive trend at the continental level in Gender has been driven by the improvement of six of the seven indicators of the sub-category; in particular, Workplace Gender Equality (+11.5) and Laws on Violence against Women (+9.5) show the fourth and eighth largest improvement, on average, of all indicators in the IIAG over the past ten years.
Gender sub-category: key findings
Rwanda is both the highest scoring, and most improved country in Gender.
GENDER
2015 Score 2006 ScoreTrend
55.4
51.1
+4.3
2006-2015 average trend & score

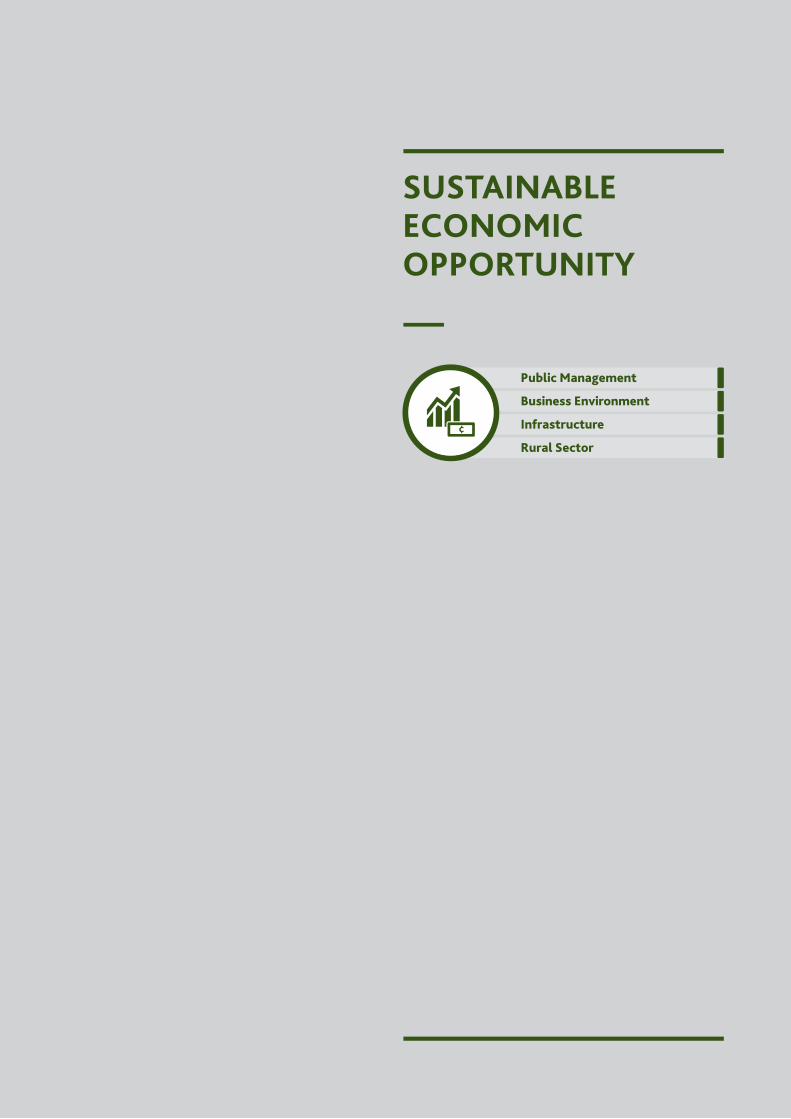
SUSTAINABLEECONOMIC OPPORTUNITY
Public Management
Business Environment
Infrastructure
Rural Sector

48
2015 SCORE /100 TREND 2006-20152015 RANK /54
1st Mauritius 79.0 +9.32nd South Africa 68.4 +1.83rd Morocco 67.4 +13.04th Botswana 65.2 -0.75th Rwanda 65.1 +9.46th Seychelles 64.8 +7.27th Namibia 62.2 +5.78th Cabo Verde 60.4 +7.59th Egypt 57.3 +10.710th Tunisia 56.7 -3.011th Kenya 54.8 +7.812th Senegal 51.4 +3.213th Swaziland 49.7 +5.514th Uganda 49.1 +0.915th Côte d'Ivoire 48.4 +8.715th Gambia 48.4 +6.215th Ghana 48.4 -4.218th Algeria 48.1 -5.219th Mozambique 47.3 +3.620th Tanzania 46.8 -2.621st Zambia 46.4 +1.022nd Mali 46.3 +1.323rd Ethiopia 46.0 -0.623rd São Tomé & Príncipe 46.0 +6.525th Lesotho 45.6 -0.326th Niger 45.3 +10.827th Burkina Faso 44.8 +0.328th Benin 44.7 +0.129th Malawi 44.1 -0.5 African average 42.9 +1.830th Djibouti 42.5 +2.531st Cameroon 41.2 +0.831st Mauritania 41.2 +1.233rd Gabon 40.7 +3.134th Nigeria 39.5 +5.135th Liberia 37.7 +7.936th Congo 36.0 +3.237th Burundi 35.4 +0.337th Togo 35.4 +10.639th Zimbabwe 34.6 +10.540th Sierra Leone 34.5 +0.241st Madagascar 33.1 -9.842nd Sudan 31.7 -2.443rd Guinea 30.8 -2.344th Comoros 30.5 +2.945th Angola 30.4 +3.346th Chad 29.3 +1.747th Democratic Republic of Congo 29.0 +4.448th Equatorial Guinea 27.6 +3.349th Guinea-Bissau 23.2 -0.650th Eritrea 23.0 -5.651st Central African Republic 21.6 -1.052nd Libya 19.0 -22.453rd South Sudan 14.1 .54th Somalia 7.0 +4.0
Over the past decade, there has been a slight improvement in Sustainable Economic Opportunity (+1.8). However, it remains the lowest scoring category in 2015, achieving an African average score of 42.9 points. The continental improvement since 2006 has largely been driven by Infrastructure (+6.5), the most improved sub-category of the IIAG, and to a lesser extent by Rural Sector (+2.6). In contrast, Business Environment (-0.8) and Public Management (-1.1) show a slight average decline.
A majority of countries (38) have shown improvement in Sustainable Economic Opportunity over the past ten years. While Morocco (+13.0) is the most improved country, Niger (+10.8), Egypt (+10.7), Togo (+10.6) and Zimbabwe (+10.5) all show notable improvements of over +10.0 points since 2006. A majority of African citizens (70%) live in countries which have seen an improvement in Sustainable Economic Opportunity in the past decade, and account for almost three-quarters (73%) of continental Gross Domestic Product (GDP).
However, only ten countries have managed to improve across all four constituent sub-categories of Sustainable Economic Opportunity: Côte d’Ivoire, Democratic Republic of Congo, Kenya, Liberia, Morocco, Namibia, Niger, Nigeria, Rwanda and Togo.
Fifteen countries have declined in Sustainable Economic Opportunity over the past ten years. Of these, Libya shows the largest deterioration (-22.4), followed by Madagascar (-9.8), Eritrea (-5.6), Algeria (-5.2) and Ghana (-4.2). Four of these countries (Algeria, Eritrea, Libya and Madagascar) show widespread deterioration, declining across all four constituent sub-categories.
Key findings
A Decade of African Governance: Sustainable Economic Opportunity
70% of African citizens live in countries which have seen an improvement in Sustainable Economic Opportunity in the past decade and account for 73% of continental GDP.

2016 IIAG: INDEX REPORT
49
Ten-year country trends
-25.0 -15.0 +15.0-20.0 +10.0+5.0-5.0-10.0 0.0
MoroccoNigerEgyptTogoZimbabweRwandaMauritiusCôte d'IvoireLiberiaKenyaCabo VerdeSeychellesSão Tomé & PríncipeGambiaNamibiaSwazilandNigeriaDemocratic Republic of CongoSomaliaMozambiqueEquatorial GuineaAngolaCongoSenegalGabonComorosDjiboutiSouth AfricaChadMaliMauritaniaZambiaUgandaCameroonBurkina FasoBurundiSierra LeoneBeninLesothoMalawiEthiopiaGuinea-BissauBotswanaCentral African RepublicGuineaSudanTanzaniaTunisiaGhanaAlgeriaEritreaMadagascarLibya
67.445.357.335.434.665.179.048.437.754.860.464.846.048.462.249.739.529.0
7.047.327.630.436.051.440.730.542.568.429.346.341.246.449.141.244.835.434.544.745.644.146.023.265.221.630.831.746.856.748.448.123.033.119.0
COUNTRY SCORE CHANGE 2006-2015 2015 SCORE
+13.0+10.8+10.7+10.6+10.5
+9.4+9.3
+8.7+7.9+7.8
+7.5+7.2
+6.5+6.2
+5.7+5.5
+5.1+4.4
+4.0+3.6
+3.3+3.3+3.2+3.2+3.1
+2.9+2.5
+1.8+1.7
+1.3+1.2+1.0+0.9+0.8
+0.3+0.3+0.2+0.1
-0.3-0.5-0.6-0.6-0.7
-1.0-2.3-2.4-2.6
-3.0-4.2
-5.2-5.6
-9.8-22.4
As South Sudan does not have data prior to 2011, no trends over the ten-year period are available for that country. Improvement since 2006 Deterioration since 2006
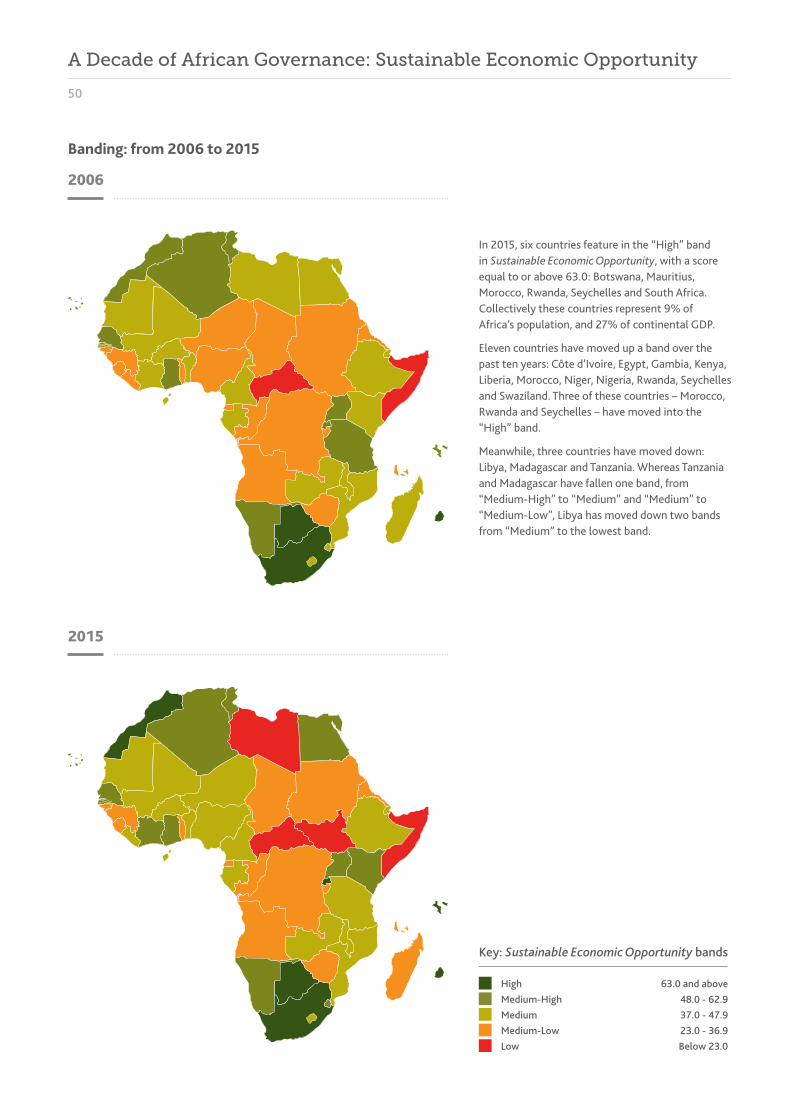
50
Key: Sustainable Economic Opportunity bands
High 63.0 and aboveMedium-High 48.0 - 62.9Medium 37.0 - 47.9Medium-Low 23.0 - 36.9Low Below 23.0
In 2015, six countries feature in the “High” band in Sustainable Economic Opportunity, with a score equal to or above 63.0: Botswana, Mauritius, Morocco, Rwanda, Seychelles and South Africa. Collectively these countries represent 9% of Africa’s population, and 27% of continental GDP.
Eleven countries have moved up a band over the past ten years: Côte d’Ivoire, Egypt, Gambia, Kenya, Liberia, Morocco, Niger, Nigeria, Rwanda, Seychelles and Swaziland. Three of these countries – Morocco, Rwanda and Seychelles – have moved into the “High” band.
Meanwhile, three countries have moved down: Libya, Madagascar and Tanzania. Whereas Tanzania and Madagascar have fallen one band, from “Medium-High” to “Medium” and “Medium” to “Medium-Low”, Libya has moved down two bands from “Medium” to the lowest band.
2006
2015
Banding: from 2006 to 2015
A Decade of African Governance: Sustainable Economic Opportunity
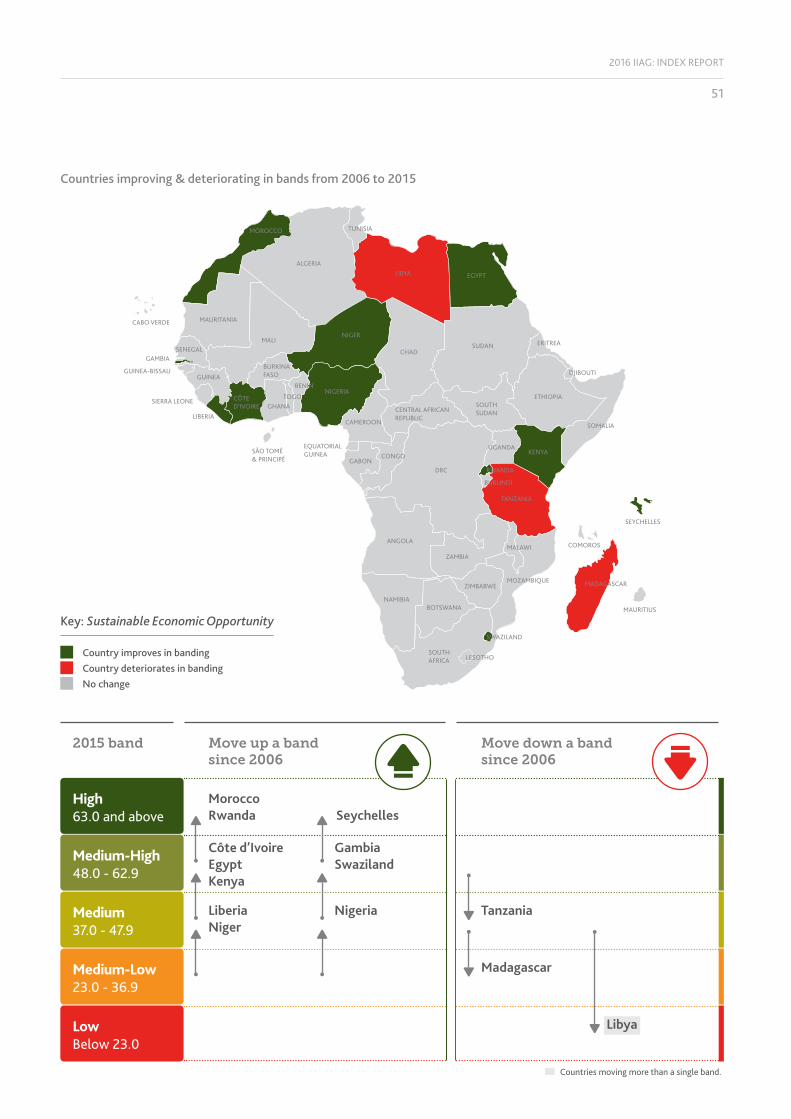
2016 IIAG: INDEX REPORT
51
Key: Sustainable Economic Opportunity
Country improves in bandingCountry deteriorates in bandingNo change
LiberiaNiger
Nigeria
Côte d’IvoireEgyptKenya
Gambia Swaziland
Morocco Rwanda Seychelles
Madagascar
Libya
Tanzania
High63.0 and above
Medium-High48.0 - 62.9
Medium 37.0 - 47.9
Medium-Low23.0 - 36.9
LowBelow 23.0
Move up a band since 2006
2015 band Move down a band since 2006
Countries moving more than a single band.
Countries improving & deteriorating in bands from 2006 to 2015

52
Algeria 9 62.1 -2.5Angola 43 24.4 +5.2Benin 37 30.8 +5.6Botswana 8 64.0 -0.2Burkina Faso 42 24.6 -2.3Burundi 37 30.8 +2.7Cabo Verde 10 58.6 +18.7Cameroon 29 36.0 +16.2Central African Republic 53 12.1 -2.1Chad 50 16.2 +9.7Comoros 31 35.4 +6.6Congo 26 37.3 +9.9Côte d'Ivoire 11 53.5 +11.6Democratic Republic of Congo 51 15.0 +3.0Djibouti 16 43.5 +5.8Egypt 5 65.1 +20.3Equatorial Guinea 45 21.9 +8.4Eritrea 47 18.3 -0.7Ethiopia 21 38.6 +7.3Gabon 25 37.4 +3.0Gambia 15 45.5 +15.1Ghana 20 39.1 -6.9Guinea 46 19.9 +3.4Guinea-Bissau 44 24.0 +13.9Kenya 14 48.0 +17.8Lesotho 24 37.5 +6.8Liberia 40 28.0 +4.5Libya 19 40.6 -7.9Madagascar 49 16.6 -7.1Malawi 22 38.3 +0.7Mali 27 37.1 +9.4Mauritania 32 35.3 +11.6Mauritius 1 92.3 +14.3Morocco 4 67.0 +21.2Mozambique 33 34.2 +1.2Namibia 3 69.9 +12.9Niger 39 28.6 +13.1Nigeria 41 26.3 +8.0Rwanda 18 42.2 +3.6São Tomé & Príncipe 12 53.1 +19.4Senegal 17 42.3 +10.7Seychelles 2 85.5 +9.0Sierra Leone 48 17.4 -13.8Somalia 54 9.8 +5.3South Africa 6 65.0 +3.7South Sudan 52 13.6 .Sudan 30 35.8 +10.6Swaziland 13 53.0 +10.7Tanzania 36 31.9 +4.2Togo 35 32.4 +14.4Tunisia 7 64.3 +15.4Uganda 27 37.1 +13.2Zambia 23 38.0 +6.6Zimbabwe 34 34.1 -2.1African average 39.1 +6.5
2015 RANK/54
2015 SCORE /100
TREND2006-2015
Infrastructure is the most improved sub-category of the IIAG, registering strong progress of +6.5 points over the past decade. Even though still achieving a relatively low score of 39.1 it is no longer the lowest scoring sub-category.
Forty-three out of 54 countries register progress, 19 of them by more than +10.0 points. Morocco (+21.2) registers the largest improvement over the past ten years, followed by Egypt (+20.3) and São Tomé & Príncipe (+19.4). Morocco is one of seven countries to show year-on-year improvement since 2006, with Cabo Verde, Comoros, Djibouti, Kenya, Niger and Swaziland.
Meanwhile, only ten countries register deterioration in Infrastructure since 2006: Sierra Leone (-13.8), Libya (-7.9), Madagascar (-7.1), Ghana (-6.9), Algeria (-2.5), Burkina Faso (-2.3), Central African Republic (-2.1), Zimbabwe (-2.1), Eritrea (-0.7) and Botswana (-0.2).
Progress in Infrastructure over the last decade has been mainly driven by considerable improvement in Digital & IT Infrastructure (+23.6), the most improved indicator of the IIAG over the decade. Fifty countries out of 54 have improved in this indicator, with 35 countries registering a year-on-year improvement. Morocco (+51.8) is the most improved country, followed by Seychelles (+47.7), Cabo Verde (+47.5), Algeria (+47.4) and Ghana (+46.6).
Transport Infrastructure (+2.8), which covers road, rail and air transport, also shows a positive trend, with 34 countries showing improvement over the past ten years. Togo (+23.4) shows the largest improvement, followed by Kenya (+23.2) and Morocco (+20.6). However, Electricity Infrastructure has shown a marginal decline (-0.4) over the past decade, with 19 countries registering deterioration.
Infrastructure sub-category: key findings
A Decade of African Governance: Sustainable Economic Opportunity
INFRASTRUCTURE
2015 Score 2006 ScoreTrend
+6.5
32.6
39.1
2006-2015 average trend & score
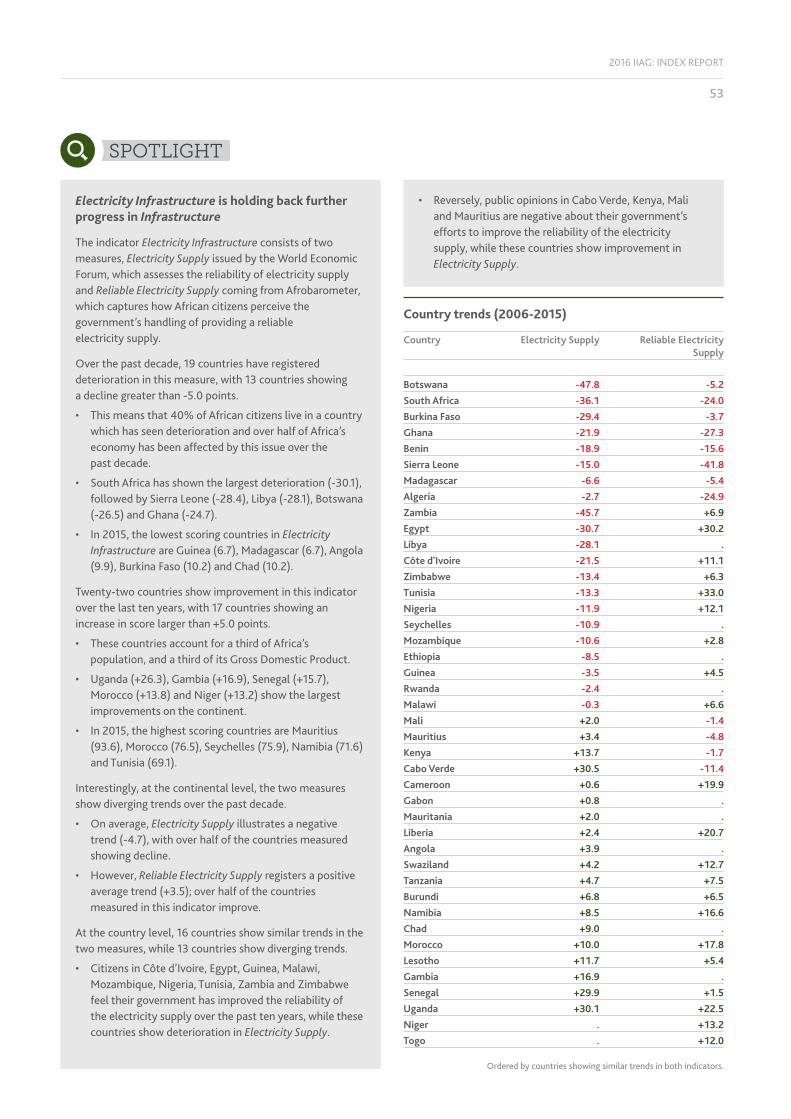
2016 IIAG: INDEX REPORT
53
Ordered by countries showing similar trends in both indicators.
SPOTLIGHT
Electricity Infrastructure is holding back further progress in Infrastructure
The indicator Electricity Infrastructure consists of two measures, Electricity Supply issued by the World Economic Forum, which assesses the reliability of electricity supply and Reliable Electricity Supply coming from Afrobarometer, which captures how African citizens perceive the government’s handling of providing a reliable electricity supply.
Over the past decade, 19 countries have registered deterioration in this measure, with 13 countries showing a decline greater than -5.0 points.
• This means that 40% of African citizens live in a country which has seen deterioration and over half of Africa’s economy has been affected by this issue over the past decade.
• South Africa has shown the largest deterioration (-30.1), followed by Sierra Leone (-28.4), Libya (-28.1), Botswana (-26.5) and Ghana (-24.7).
• In 2015, the lowest scoring countries in Electricity Infrastructure are Guinea (6.7), Madagascar (6.7), Angola (9.9), Burkina Faso (10.2) and Chad (10.2).
Twenty-two countries show improvement in this indicator over the last ten years, with 17 countries showing an increase in score larger than +5.0 points.
• These countries account for a third of Africa’s population, and a third of its Gross Domestic Product.
• Uganda (+26.3), Gambia (+16.9), Senegal (+15.7), Morocco (+13.8) and Niger (+13.2) show the largest improvements on the continent.
• In 2015, the highest scoring countries are Mauritius (93.6), Morocco (76.5), Seychelles (75.9), Namibia (71.6) and Tunisia (69.1).
Interestingly, at the continental level, the two measures show diverging trends over the past decade.
• On average, Electricity Supply illustrates a negative trend (-4.7), with over half of the countries measured showing decline.
• However, Reliable Electricity Supply registers a positive average trend (+3.5); over half of the countries measured in this indicator improve.
At the country level, 16 countries show similar trends in the two measures, while 13 countries show diverging trends.
• Citizens in Côte d’Ivoire, Egypt, Guinea, Malawi, Mozambique, Nigeria, Tunisia, Zambia and Zimbabwe feel their government has improved the reliability of the electricity supply over the past ten years, while these countries show deterioration in Electricity Supply.
• Reversely, public opinions in Cabo Verde, Kenya, Mali and Mauritius are negative about their government’s efforts to improve the reliability of the electricity supply, while these countries show improvement in Electricity Supply.
Country trends (2006-2015)
Country Electricity Supply Reliable Electricity Supply
Botswana -47.8 -5.2South Africa -36.1 -24.0Burkina Faso -29.4 -3.7Ghana -21.9 -27.3Benin -18.9 -15.6Sierra Leone -15.0 -41.8Madagascar -6.6 -5.4Algeria -2.7 -24.9Zambia -45.7 +6.9Egypt -30.7 +30.2Libya -28.1 .Côte d'Ivoire -21.5 +11.1Zimbabwe -13.4 +6.3Tunisia -13.3 +33.0Nigeria -11.9 +12.1Seychelles -10.9 .Mozambique -10.6 +2.8Ethiopia -8.5 .Guinea -3.5 +4.5Rwanda -2.4 .Malawi -0.3 +6.6Mali +2.0 -1.4Mauritius +3.4 -4.8Kenya +13.7 -1.7Cabo Verde +30.5 -11.4Cameroon +0.6 +19.9Gabon +0.8 .Mauritania +2.0 .Liberia +2.4 +20.7Angola +3.9 .Swaziland +4.2 +12.7Tanzania +4.7 +7.5Burundi +6.8 +6.5Namibia +8.5 +16.6Chad +9.0 .Morocco +10.0 +17.8Lesotho +11.7 +5.4Gambia +16.9 .Senegal +29.9 +1.5Uganda +30.1 +22.5Niger . +13.2Togo . +12.0
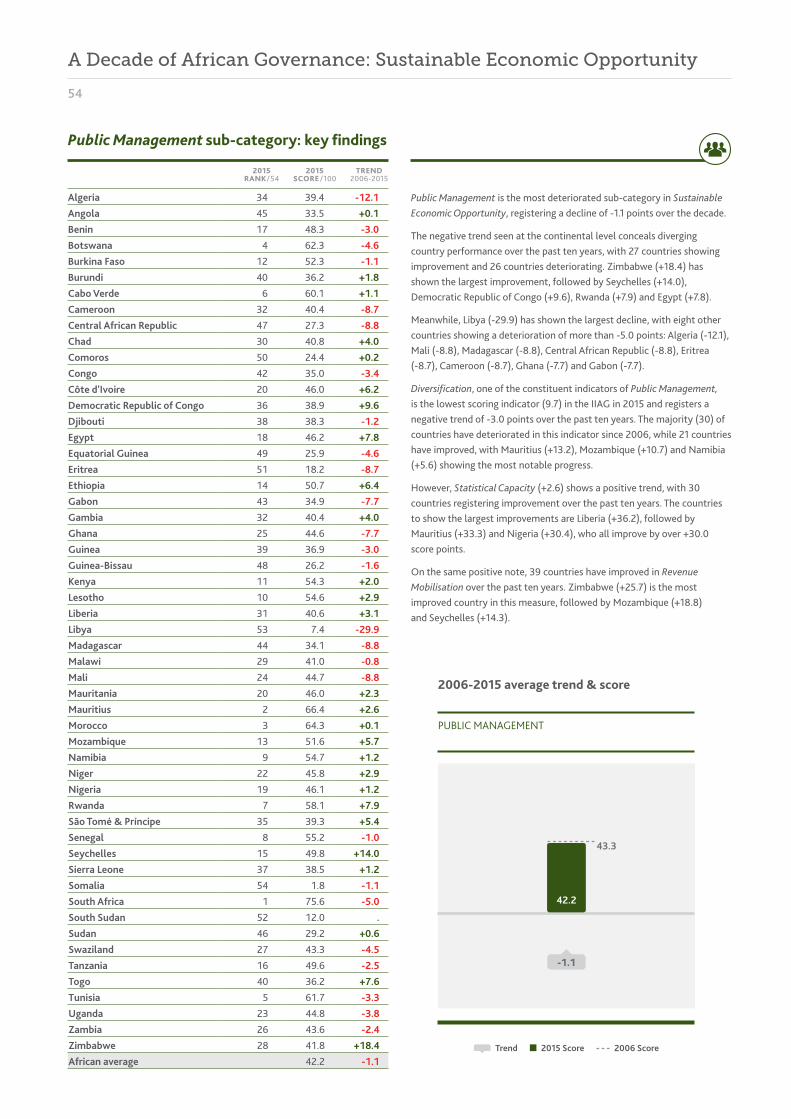
54
Algeria 34 39.4 -12.1Angola 45 33.5 +0.1Benin 17 48.3 -3.0Botswana 4 62.3 -4.6Burkina Faso 12 52.3 -1.1Burundi 40 36.2 +1.8Cabo Verde 6 60.1 +1.1Cameroon 32 40.4 -8.7Central African Republic 47 27.3 -8.8Chad 30 40.8 +4.0Comoros 50 24.4 +0.2Congo 42 35.0 -3.4Côte d'Ivoire 20 46.0 +6.2Democratic Republic of Congo 36 38.9 +9.6Djibouti 38 38.3 -1.2Egypt 18 46.2 +7.8Equatorial Guinea 49 25.9 -4.6Eritrea 51 18.2 -8.7Ethiopia 14 50.7 +6.4Gabon 43 34.9 -7.7Gambia 32 40.4 +4.0Ghana 25 44.6 -7.7Guinea 39 36.9 -3.0Guinea-Bissau 48 26.2 -1.6Kenya 11 54.3 +2.0Lesotho 10 54.6 +2.9Liberia 31 40.6 +3.1Libya 53 7.4 -29.9Madagascar 44 34.1 -8.8Malawi 29 41.0 -0.8Mali 24 44.7 -8.8Mauritania 20 46.0 +2.3Mauritius 2 66.4 +2.6Morocco 3 64.3 +0.1Mozambique 13 51.6 +5.7Namibia 9 54.7 +1.2Niger 22 45.8 +2.9Nigeria 19 46.1 +1.2Rwanda 7 58.1 +7.9São Tomé & Príncipe 35 39.3 +5.4Senegal 8 55.2 -1.0Seychelles 15 49.8 +14.0Sierra Leone 37 38.5 +1.2Somalia 54 1.8 -1.1South Africa 1 75.6 -5.0South Sudan 52 12.0 .Sudan 46 29.2 +0.6Swaziland 27 43.3 -4.5Tanzania 16 49.6 -2.5Togo 40 36.2 +7.6Tunisia 5 61.7 -3.3Uganda 23 44.8 -3.8Zambia 26 43.6 -2.4Zimbabwe 28 41.8 +18.4African average 42.2 -1.1
2015 RANK/54
2015 SCORE /100
TREND2006-2015
Public Management is the most deteriorated sub-category in Sustainable Economic Opportunity, registering a decline of -1.1 points over the decade.
The negative trend seen at the continental level conceals diverging country performance over the past ten years, with 27 countries showing improvement and 26 countries deteriorating. Zimbabwe (+18.4) has shown the largest improvement, followed by Seychelles (+14.0), Democratic Republic of Congo (+9.6), Rwanda (+7.9) and Egypt (+7.8).
Meanwhile, Libya (-29.9) has shown the largest decline, with eight other countries showing a deterioration of more than -5.0 points: Algeria (-12.1), Mali (-8.8), Madagascar (-8.8), Central African Republic (-8.8), Eritrea (-8.7), Cameroon (-8.7), Ghana (-7.7) and Gabon (-7.7).
Diversification, one of the constituent indicators of Public Management, is the lowest scoring indicator (9.7) in the IIAG in 2015 and registers a negative trend of -3.0 points over the past ten years. The majority (30) of countries have deteriorated in this indicator since 2006, while 21 countries have improved, with Mauritius (+13.2), Mozambique (+10.7) and Namibia (+5.6) showing the most notable progress.
However, Statistical Capacity (+2.6) shows a positive trend, with 30 countries registering improvement over the past ten years. The countries to show the largest improvements are Liberia (+36.2), followed by Mauritius (+33.3) and Nigeria (+30.4), who all improve by over +30.0 score points.
On the same positive note, 39 countries have improved in Revenue Mobilisation over the past ten years. Zimbabwe (+25.7) is the most improved country in this measure, followed by Mozambique (+18.8) and Seychelles (+14.3).
Public Management sub-category: key findings
A Decade of African Governance: Sustainable Economic Opportunity
PUBLIC MANAGEMENT
2015 Score 2006 ScoreTrend
-1.1
42.2
43.3
2006-2015 average trend & score
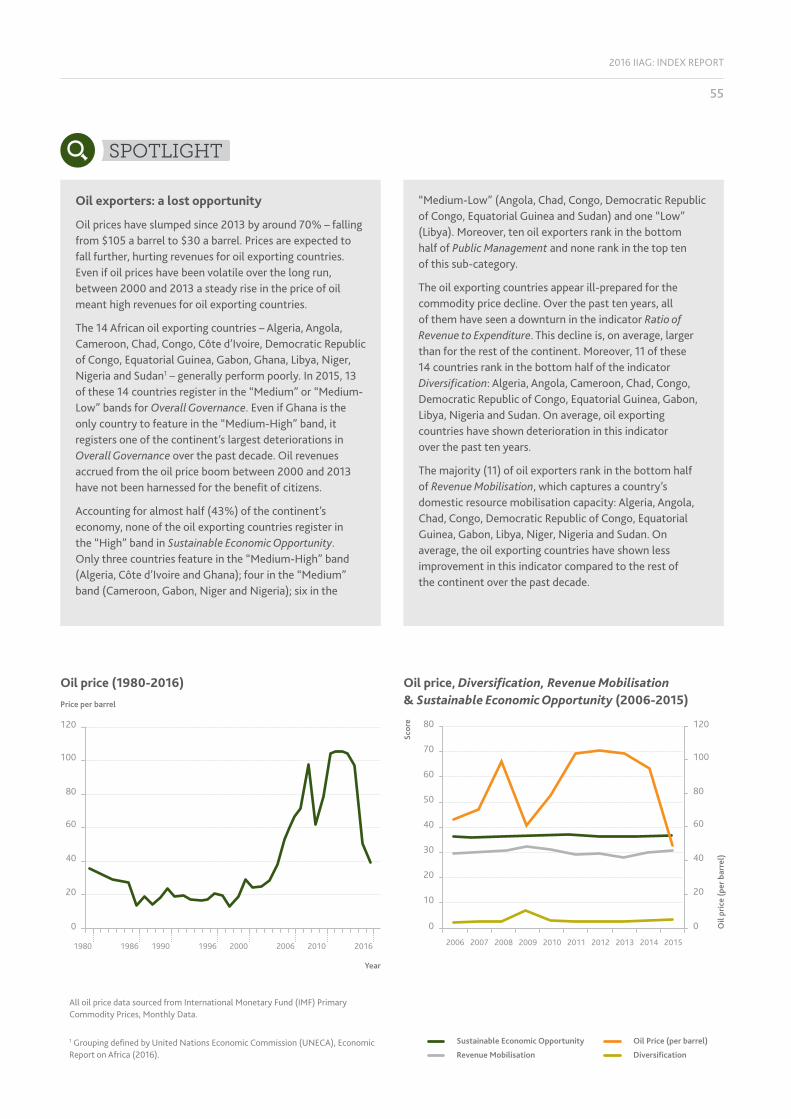
2016 IIAG: INDEX REPORT
55
SPOTLIGHT
Oil exporters: a lost opportunity
Oil prices have slumped since 2013 by around 70% – falling from $105 a barrel to $30 a barrel. Prices are expected to fall further, hurting revenues for oil exporting countries. Even if oil prices have been volatile over the long run, between 2000 and 2013 a steady rise in the price of oil meant high revenues for oil exporting countries.
The 14 African oil exporting countries – Algeria, Angola, Cameroon, Chad, Congo, Côte d’Ivoire, Democratic Republic of Congo, Equatorial Guinea, Gabon, Ghana, Libya, Niger, Nigeria and Sudan1 – generally perform poorly. In 2015, 13 of these 14 countries register in the “Medium” or “Medium-Low” bands for Overall Governance. Even if Ghana is the only country to feature in the “Medium-High” band, it registers one of the continent’s largest deteriorations in Overall Governance over the past decade. Oil revenues accrued from the oil price boom between 2000 and 2013 have not been harnessed for the benefit of citizens.
Accounting for almost half (43%) of the continent’s economy, none of the oil exporting countries register in the “High” band in Sustainable Economic Opportunity. Only three countries feature in the “Medium-High” band (Algeria, Côte d’Ivoire and Ghana); four in the “Medium” band (Cameroon, Gabon, Niger and Nigeria); six in the
“Medium-Low” (Angola, Chad, Congo, Democratic Republic of Congo, Equatorial Guinea and Sudan) and one “Low” (Libya). Moreover, ten oil exporters rank in the bottom half of Public Management and none rank in the top ten of this sub-category.
The oil exporting countries appear ill-prepared for the commodity price decline. Over the past ten years, all of them have seen a downturn in the indicator Ratio of Revenue to Expenditure. This decline is, on average, larger than for the rest of the continent. Moreover, 11 of these 14 countries rank in the bottom half of the indicator Diversification: Algeria, Angola, Cameroon, Chad, Congo, Democratic Republic of Congo, Equatorial Guinea, Gabon, Libya, Nigeria and Sudan. On average, oil exporting countries have shown deterioration in this indicator over the past ten years.
The majority (11) of oil exporters rank in the bottom half of Revenue Mobilisation, which captures a country’s domestic resource mobilisation capacity: Algeria, Angola, Chad, Congo, Democratic Republic of Congo, Equatorial Guinea, Gabon, Libya, Niger, Nigeria and Sudan. On average, the oil exporting countries have shown less improvement in this indicator compared to the rest of the continent over the past decade.
Oil price, Diversification, Revenue Mobilisation & Sustainable Economic Opportunity (2006-2015)
Year
20
0
40
60
80
100
120
1980 1986 1990 1996 2000 2006 2010 2016
Price per barrel
Oil price (1980-2016)
1 Grouping defined by United Nations Economic Commission (UNECA), Economic Report on Africa (2016).
All oil price data sourced from International Monetary Fund (IMF) Primary Commodity Prices, Monthly Data.
DiversificationRevenue Mobilisation
Oil Price (per barrel)Sustainable Economic Opportunity
10
0
20
30
40
50
70
60
80
20
0
40
60
80
100
120
2006 2007 2008 2009 2010 2011 2012 2013 2014 2015
Scor
e
Oil
pric
e (p
er b
arre
l)
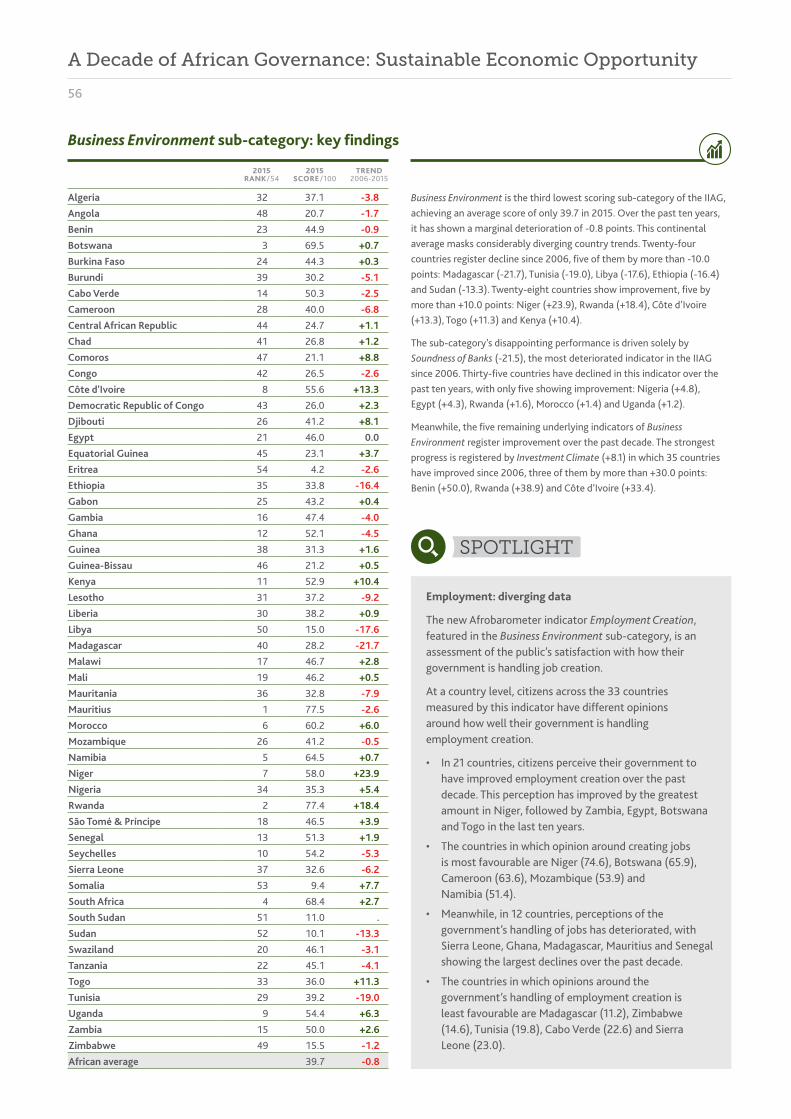
56
Algeria 32 37.1 -3.8Angola 48 20.7 -1.7Benin 23 44.9 -0.9Botswana 3 69.5 +0.7Burkina Faso 24 44.3 +0.3Burundi 39 30.2 -5.1Cabo Verde 14 50.3 -2.5Cameroon 28 40.0 -6.8Central African Republic 44 24.7 +1.1Chad 41 26.8 +1.2Comoros 47 21.1 +8.8Congo 42 26.5 -2.6Côte d'Ivoire 8 55.6 +13.3Democratic Republic of Congo 43 26.0 +2.3Djibouti 26 41.2 +8.1Egypt 21 46.0 0.0Equatorial Guinea 45 23.1 +3.7Eritrea 54 4.2 -2.6Ethiopia 35 33.8 -16.4Gabon 25 43.2 +0.4Gambia 16 47.4 -4.0Ghana 12 52.1 -4.5Guinea 38 31.3 +1.6Guinea-Bissau 46 21.2 +0.5Kenya 11 52.9 +10.4Lesotho 31 37.2 -9.2Liberia 30 38.2 +0.9Libya 50 15.0 -17.6Madagascar 40 28.2 -21.7Malawi 17 46.7 +2.8Mali 19 46.2 +0.5Mauritania 36 32.8 -7.9Mauritius 1 77.5 -2.6Morocco 6 60.2 +6.0Mozambique 26 41.2 -0.5Namibia 5 64.5 +0.7Niger 7 58.0 +23.9Nigeria 34 35.3 +5.4Rwanda 2 77.4 +18.4São Tomé & Príncipe 18 46.5 +3.9Senegal 13 51.3 +1.9Seychelles 10 54.2 -5.3Sierra Leone 37 32.6 -6.2Somalia 53 9.4 +7.7South Africa 4 68.4 +2.7South Sudan 51 11.0 .Sudan 52 10.1 -13.3Swaziland 20 46.1 -3.1Tanzania 22 45.1 -4.1Togo 33 36.0 +11.3Tunisia 29 39.2 -19.0Uganda 9 54.4 +6.3Zambia 15 50.0 +2.6Zimbabwe 49 15.5 -1.2African average 39.7 -0.8
2015 RANK/54
2015 SCORE /100
TREND2006-2015
Business Environment is the third lowest scoring sub-category of the IIAG, achieving an average score of only 39.7 in 2015. Over the past ten years, it has shown a marginal deterioration of -0.8 points. This continental average masks considerably diverging country trends. Twenty-four countries register decline since 2006, five of them by more than -10.0 points: Madagascar (-21.7), Tunisia (-19.0), Libya (-17.6), Ethiopia (-16.4) and Sudan (-13.3). Twenty-eight countries show improvement, five by more than +10.0 points: Niger (+23.9), Rwanda (+18.4), Côte d’Ivoire (+13.3), Togo (+11.3) and Kenya (+10.4).
The sub-category’s disappointing performance is driven solely by Soundness of Banks (-21.5), the most deteriorated indicator in the IIAG since 2006. Thirty-five countries have declined in this indicator over the past ten years, with only five showing improvement: Nigeria (+4.8), Egypt (+4.3), Rwanda (+1.6), Morocco (+1.4) and Uganda (+1.2).
Meanwhile, the five remaining underlying indicators of Business Environment register improvement over the past decade. The strongest progress is registered by Investment Climate (+8.1) in which 35 countries have improved since 2006, three of them by more than +30.0 points: Benin (+50.0), Rwanda (+38.9) and Côte d’Ivoire (+33.4).
SPOTLIGHT
Employment: diverging data
The new Afrobarometer indicator Employment Creation, featured in the Business Environment sub-category, is an assessment of the public’s satisfaction with how their government is handling job creation.
At a country level, citizens across the 33 countries measured by this indicator have different opinions around how well their government is handling employment creation.
• In 21 countries, citizens perceive their government to have improved employment creation over the past decade. This perception has improved by the greatest amount in Niger, followed by Zambia, Egypt, Botswana and Togo in the last ten years.
• The countries in which opinion around creating jobs is most favourable are Niger (74.6), Botswana (65.9), Cameroon (63.6), Mozambique (53.9) and Namibia (51.4).
• Meanwhile, in 12 countries, perceptions of the government’s handling of jobs has deteriorated, with Sierra Leone, Ghana, Madagascar, Mauritius and Senegal showing the largest declines over the past decade.
• The countries in which opinions around the government’s handling of employment creation is least favourable are Madagascar (11.2), Zimbabwe (14.6), Tunisia (19.8), Cabo Verde (22.6) and Sierra Leone (23.0).
Business Environment sub-category: key findings
A Decade of African Governance: Sustainable Economic Opportunity

2016 IIAG: INDEX REPORT
57
Over the past ten years, the continental average for Employment Creation has increased by +1.0 points, while the unemployment rate1 has fallen slightly by -0.4%.
Interestingly, the results recorded by this new indicator reveal a discrepancy between the trends in unemployment rates, as recorded by the World Bank and the perceptions, by African citizens, of their government policy on employment at the country level.
In over half of the countries measured, trends in public opinion around employment creation diverge from the unemployment rate over the past decade.
• Citizens in Botswana, Cameroon, Egypt, Morocco, Uganda and Zimbabwe have favourable views of their government tackling employment creation, even if the recorded unemployment rate has risen over the past ten years in these countries.
• Reversely, public opinions in Ghana, Madagascar, Mali, Mauritius, Namibia, Sierra Leone, Swaziland and Tanzania are negative of the government’s handling of job creation, while unemployment rates have fallen over the past ten years.
• The unemployment rate in Mozambique, Niger and Senegal has remained stable, while opinion around the government’s handling of job creation has become more favourable in Mozambique and Niger; but less so in Senegal.
African average trends: Employment Creation and unemployment rate (2006-2015)
1 Unemployment rate data is an ILO estimate, taken from the World Bank, World Development Indicators. Ten-year period refers to 2006-2014 due to data availability.
Country trends (2006-2015)
Country Employment creation Unemployment rate
Burkina Faso -6.7 +0.8%Tunisia -4.8 +0.8%South Africa -3.4 +2.5%Sierra Leone -49.9 -0.1%Ghana -36.5 -1.2%Madagascar -31.4 -0.3%Mauritius -15.1 -1.4%Senegal -13.4 0.0%Namibia -12.6 -3.1%Swaziland -8.9 -0.6%Mali -4.4 -0.2%Tanzania -2.7 -1.2%Morocco +2.5 +0.5%Zimbabwe +2.8 +0.3%Mozambique +3.4 0.0%Cameroon +4.4 +0.2%Uganda +10.5 +0.2%Botswana +22.0 +0.6%Egypt +28.8 +2.6%Niger +42.6 0.0%Liberia +0.6 -0.3%Cabo Verde +1.3 -0.3%Guinea +2.6 -0.2%Burundi +3.2 -0.3%Benin +3.7 -0.1%Algeria +4.3 -2.8%Lesotho +5.8 -6.3%Nigeria +6.9 -0.1%Kenya +8.4 -0.3%Côte d'Ivoire +10.6 -0.1%Malawi +12.2 -0.3%Togo +16.4 -0.2%Zambia +32.4 -2.3%
Unemployment rate Employment Creation
5
4
6
7
8
9
10
11
12
30
25
35
40
45
50
2006 2007 2008 2009 2010 2011 2012 2013 2014 2015
Une
mpl
oym
ent (
% to
tal l
abou
r for
ce)
Empl
oym
ent C
reat
ion
Year
BUSINESS ENVIRONMENT
2015 Score 2006 ScoreTrend
-0.8
40.5
39.7
Ordered by countries showing similar trends in both indicators.
2006-2015 average trend & score

58
Algeria 24 53.7 -2.6Angola 42 42.9 +9.4Benin 22 55.0 -1.3Botswana 7 64.9 +1.3Burkina Faso 17 58.1 +4.3Burundi 40 44.5 +2.1Cabo Verde 4 72.7 +12.7Cameroon 34 48.3 +2.6Central African Republic 50 22.5 +6.0Chad 49 33.3 -8.3Comoros 43 40.9 -4.2Congo 38 45.1 +8.7Côte d'Ivoire 45 38.5 +3.6Democratic Republic of Congo 47 36.3 +2.9Djibouti 36 47.1 -2.8Egypt 5 72.0 +14.8Equatorial Guinea 44 39.6 +5.8Eritrea 28 51.2 -10.5Ethiopia 12 61.0 +0.3Gabon 35 47.3 +16.6Gambia 14 60.1 +9.6Ghana 18 57.8 +2.1Guinea 48 35.1 -11.2Guinea-Bissau 51 21.6 -15.0Kenya 9 63.9 +1.0Lesotho 26 53.0 -1.9Liberia 41 43.9 +22.8Libya 53 13.2 -34.1Madagascar 25 53.6 -1.3Malawi 30 50.4 -4.5Mali 19 57.1 +4.0Mauritania 29 50.6 -1.2Mauritius 2 80.0 +23.2Morocco 3 78.1 +24.5Mozambique 10 62.1 +7.8Namibia 16 59.8 +7.8Niger 33 48.8 +3.4Nigeria 31 50.3 +5.7Rwanda 1 82.7 +7.5São Tomé & Príncipe 39 44.9 -2.7Senegal 20 56.6 +1.1Seychelles 6 69.8 +11.0Sierra Leone 32 49.4 +19.5Somalia . . .South Africa 8 64.6 +5.6South Sudan 52 19.7 .Sudan 27 51.6 -7.4Swaziland 21 56.5 +19.2Tanzania 13 60.7 -7.7Togo 46 37.1 +9.2Tunisia 11 61.8 -4.9Uganda 15 60.0 -12.1Zambia 23 54.1 -2.8Zimbabwe 37 47.0 +26.8African average 51.5 +2.6
2015 RANK/54
2015 SCORE /100
TREND2006-2015
Reaching a score of 51.5 in 2015, the Rural Sector sub-category has registered an improvement in score of +2.6 points over the past ten years with a majority (33) of countries showing progress.
This positive trend is driven by six of the eight underlying indicators of the sub-category. Indeed, three of the ten most improved indicators in the IIAG over the decade sit in Rural Sector: Agricultural Support System (+11.1), Rural Land & Water (+9.9) and Engagement with Rural Organisations (+9.4). Thirty-six countries have shown improvement in Agricultural Support System over the past ten years, with ten countries registering score increases of more than +30.0 points: Rwanda (+41.9), Morocco (+39.7), Democratic Republic of Congo (+34.9), Mauritius (+34.9), Liberia (+32.7), Mozambique (+32.7), Gambia (+32.2), Sierra Leone (+31.6), Namibia (+30.2) and Swaziland (+30.2).
The remaining two indicators register deterioration: Equal Representation in Rural Areas (-4.0) and Agricultural Policy Costs (-3.8). In the latter, 26 countries show deterioration over the past ten years, with Malawi (-36.9), Zambia (-36.7), Libya (-34.1) and Tunisia (-31.2) registering declines of more than -30.0 points.
Rural Sector sub-category: key findings
A Decade of African Governance: Sustainable Economic Opportunity
Three of the ten most improved indicators in the IIAG over the past decade sit in Rural Sector.
RURAL SECTOR
2015 Score 2006 ScoreTrend
+2.6
48.9
51.5
2006-2015 average trend & score


HUMANDEVELOPMENT
Welfare
Education
Health

62
2015 SCORE /100 TREND 2006-20152015 RANK /54
1st Seychelles 84.2 +5.22nd Mauritius 83.7 -0.83rd Botswana 78.5 +3.94th Cabo Verde 72.5 +1.95th Rwanda 71.2 +14.46th South Africa 70.6 -2.37th Algeria 70.5 +3.38th Tunisia 70.4 -4.39th São Tomé & Príncipe 69.0 +9.910th Namibia 64.7 +1.111th Ghana 64.2 -1.612th Kenya 63.8 +8.013th Morocco 62.8 +4.914th Egypt 61.9 +4.015th Gambia 61.6 +2.216th Zambia 61.0 +9.717th Swaziland 60.7 +3.018th Uganda 58.9 +4.219th Comoros 58.1 +7.419th Libya 58.1 -15.721st Cameroon 57.7 +6.022nd Senegal 56.6 +6.123rd Ethiopia 56.5 +13.924th Burundi 55.7 +5.325th Tanzania 55.5 +2.1 African average 55.0 +2.926th Equatorial Guinea 54.6 +5.527th Malawi 54.3 +4.628th Lesotho 53.8 -0.628th Zimbabwe 53.8 +7.430th Djibouti 53.7 +4.631st Benin 52.9 +4.531st Togo 52.9 +10.533rd Mauritania 52.3 +4.234th Congo 52.0 +2.035th Côte d'Ivoire 51.4 +7.836th Gabon 51.2 -5.937th Mali 50.8 +0.638th Nigeria 50.7 +5.039th Mozambique 49.5 +1.640th Guinea-Bissau 47.9 +5.541st Burkina Faso 47.8 +6.742nd Democratic Republic of Congo 47.0 +5.443rd Angola 46.7 +11.244th Niger 46.4 +7.845th Liberia 46.3 +5.146th Guinea 45.3 +2.447th Sudan 44.6 +0.348th Eritrea 44.5 -3.849th Sierra Leone 43.8 +1.050th Madagascar 41.1 -13.551st Chad 37.1 +6.152nd Central African Republic 26.8 -1.253rd South Sudan 24.4 .54th Somalia 15.3 +3.0
Human Development is the best performing category of the IIAG, achieving the highest average score in 2015 (55.0) and the largest improvement (+2.9) at continental level over the decade. It is the only category in which each of the three constituent sub-categories has improved over the past decade: Education (+4.2), Health (+2.2) and Welfare (+2.1).
Forty-three countries have registered improvement in Human Development, the largest number of countries to do so in any category over the decade, representing 87% of the African population. Rwanda, the highest scoring country in Human Development (71.2), is also the most improved (+14.4); three other countries also register a score increase of more than +10.0 points: Ethiopia (+13.9), Angola (+11.2) and Togo (+10.5).
Of the ten countries to show negative trends in Human Development, Libya registers the largest decline (-15.7), followed by Madagascar (-13.5), the only two countries to decline by more than -10.0 score points since 2006.
Key findings
A Decade of African Governance: Human Development
Forty-three countries have registered improvement in Human Development, the largest number of countries to do so in any category over the decade.
In 2015, 87% of African citizens live in countries that have improved in Human Development over the last ten years.
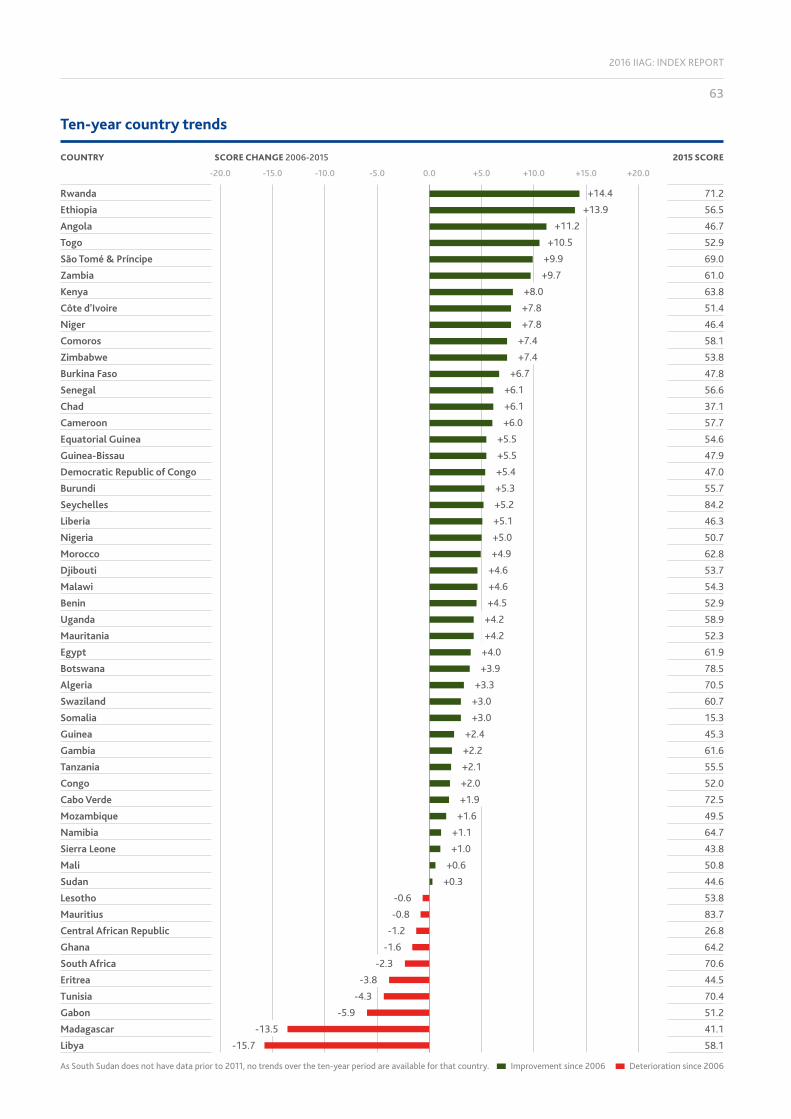
2016 IIAG: INDEX REPORT
63
Ten-year country trends
-20.0 -15.0 +20.0+15.0-5.0 +10.0+5.00.0-10.0
RwandaEthiopiaAngolaTogoSão Tomé & PríncipeZambiaKenyaCôte d'IvoireNigerComorosZimbabweBurkina FasoSenegalChadCameroonEquatorial GuineaGuinea-BissauDemocratic Republic of CongoBurundiSeychellesLiberiaNigeriaMoroccoDjiboutiMalawiBeninUgandaMauritaniaEgyptBotswanaAlgeriaSwazilandSomaliaGuineaGambiaTanzaniaCongoCabo VerdeMozambiqueNamibiaSierra LeoneMaliSudanLesothoMauritiusCentral African RepublicGhanaSouth AfricaEritreaTunisiaGabonMadagascarLibya
71.256.546.752.969.061.063.851.446.458.153.847.856.637.157.754.647.947.055.784.246.350.762.853.754.352.958.952.361.978.570.560.715.345.361.655.552.072.549.564.743.850.844.653.883.726.864.270.644.570.451.241.158.1
COUNTRY SCORE CHANGE 2006-2015 2015 SCORE
+14.4+13.9
+11.2+10.5
+9.9+9.7
+8.0+7.8+7.8
+7.4+7.4
+6.7+6.1+6.1+6.0
+5.5+5.5+5.4+5.3+5.2+5.1+5.0+4.9
+4.6+4.6+4.5
+4.2+4.2
+4.0+3.9
+3.3+3.0+3.0
+2.4+2.2+2.1+2.0+1.9
+1.6+1.1+1.0
+0.6+0.3
-0.6-0.8
-1.2-1.6
-2.3-3.8
-4.3-5.9
-13.5-15.7
As South Sudan does not have data prior to 2011, no trends over the ten-year period are available for that country. Improvement since 2006 Deterioration since 2006
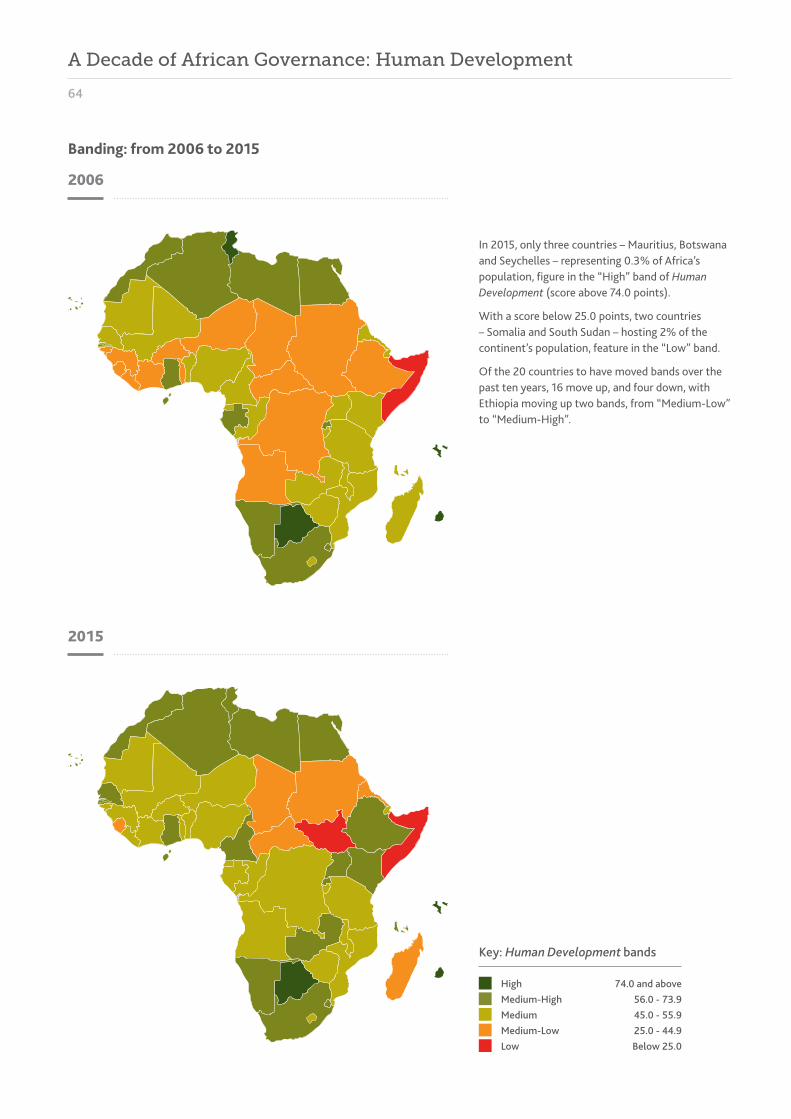
64
Key: Human Development bands
High 74.0 and aboveMedium-High 56.0 - 73.9Medium 45.0 - 55.9Medium-Low 25.0 - 44.9Low Below 25.0
In 2015, only three countries – Mauritius, Botswana and Seychelles – representing 0.3% of Africa’s population, figure in the “High” band of Human Development (score above 74.0 points).
With a score below 25.0 points, two countries – Somalia and South Sudan – hosting 2% of the continent’s population, feature in the “Low” band.
Of the 20 countries to have moved bands over the past ten years, 16 move up, and four down, with Ethiopia moving up two bands, from “Medium-Low” to “Medium-High”.
2006
2015
Banding: from 2006 to 2015
A Decade of African Governance: Human Development

2016 IIAG: INDEX REPORT
65
Key: Human Development
Country improves in bandingCountry deteriorates in bandingNo change
Angola Burkina Faso Côte d’Ivoire
LiberiaNigerTogo
DRC Guinea Guinea-Bissau
Cameroon Comoros Kenya
SenegalUgandaZambia
Ethiopia
EritreaMadagascar
Tunisia
Gabon
High74.0 and above
Medium-High56.0 - 73.9
Medium 45.0 - 55.9
Medium-Low25.0 - 44.9
LowBelow 25.0
2015 band Move up a band since 2006
Move down a band since 2006
Countries moving more than a single band.
Countries improving & deteriorating in bands from 2006 to 2015

66
Algeria 6 68.3 +8.4Angola 44 35.6 +7.1Benin 35 42.6 +10.6Botswana 3 73.6 +1.6Burkina Faso 48 31.1 +7.3Burundi 28 45.5 +5.6Cabo Verde 4 71.9 +8.3Cameroon 20 53.4 +10.9Central African Republic 52 15.7 -0.2Chad 51 25.0 +10.4Comoros 17 57.1 +8.7Congo 27 47.0 +3.5Côte d'Ivoire 29 45.1 +11.1Democratic Republic of Congo 31 44.4 +8.2Djibouti 34 43.1 +13.9Egypt 16 58.2 +7.5Equatorial Guinea 15 60.1 +3.8Eritrea 46 35.3 +1.7Ethiopia 40 38.2 +11.4Gabon 25 47.8 -2.4Gambia 24 50.3 +6.0Ghana 13 61.0 +7.3Guinea 50 29.7 -1.5Guinea-Bissau 42 37.5 +8.0Kenya 12 61.8 +2.8Lesotho 22 51.9 -1.9Liberia 30 44.9 +1.4Libya 8 64.4 -9.7Madagascar 39 38.4 -3.5Malawi 37 41.9 +6.4Mali 45 35.5 +5.2Mauritania 43 36.7 +6.6Mauritius 1 83.9 +6.3Morocco 19 55.8 +9.3Mozambique 47 34.4 +3.2Namibia 10 63.5 +6.2Niger 49 31.0 +8.9Nigeria 36 42.1 -2.8Rwanda 21 52.1 +14.0São Tomé & Príncipe 5 68.9 +17.3Senegal 38 41.3 +5.3Seychelles 2 74.5 +1.6Sierra Leone 41 37.8 0.0Somalia 54 0.0 0.0South Africa 11 63.3 -5.0South Sudan 53 10.9 .Sudan 33 43.4 +2.5Swaziland 14 60.6 +5.6Tanzania 32 44.1 -0.7Togo 23 51.5 +9.9Tunisia 7 66.9 -6.0Uganda 26 47.2 +2.4Zambia 9 64.0 +11.0Zimbabwe 18 56.7 +5.2African average 47.9 +4.2
2015 RANK/54
2015 SCORE /100
TREND2006-2015
The Education sub-category has shown considerable progress over the past decade, registering a +4.2 point score increase since 2006. Improvement at the country level has been widespread, with 41 countries improving in this sub-category and three countries showing year-on-year improvement since 2006: Comoros, Djibouti and Guinea-Bissau.
Strengthened performance at the continental level has been underpinned by improvement in seven of the eight indicators. Education Provision (-12.4), which assesses public satisfaction with how the government is handling addressing educational needs, is the only indicator to decline in this sub-category since 2006, registering the sixth largest deterioration of the IIAG. This contrasts with the positive trend seen in Secondary School Enrolment (+9.8), the seventh most improved indicator over this period, and points to a concerning mismatch between inputs of education and public satisfaction with the outcomes.
Afrobarometer: citizen perceptions on Education Provision and Basic Health Services
Where Afrobarometer data have been included as two standalone indicators in the Education and Health sub-categories, they provide a new and insightful additional assessment to the other pre-existing indicators.
The Afrobarometer indicators Education Provision and Basic Health Services are the only indicators within Education and Health to have shown decline at the continental level in the past ten years, of -12.4 points and -9.8 points respectively. This data on citizen perceptions of how the government is handling addressing educational needs and improving basic health services contrasts with the improvement registered by the other indicators derived from official data and expert assessments.
SPOTLIGHT
Education sub-category: key findings
A Decade of African Governance: Human Development
In Education 41 countries have improved over the decade and three countries show year-on-year improvement since 2006: Comoros, Djibouti and Guinea-Bissau.

2016 IIAG: INDEX REPORT
67
Algeria 8 81.6 -6.5Angola 41 63.5 +16.4Benin 29 69.1 +0.6Botswana 3 85.1 +2.3Burkina Faso 39 65.6 +10.4Burundi 12 77.6 +0.4Cabo Verde 5 84.0 +1.1Cameroon 21 71.5 +0.6Central African Republic 53 44.6 -0.4Chad 50 51.6 +6.2Comoros 15 75.3 +10.3Congo 38 65.8 -3.5Côte d'Ivoire 28 69.2 +0.5Democratic Republic of Congo 43 62.4 +1.4Djibouti 35 66.6 +1.5Egypt 13 76.1 -2.8Equatorial Guinea 32 68.2 +0.5Eritrea 19 73.8 +3.8Ethiopia 23 70.9 +20.5Gabon 30 69.0 -5.3Gambia 11 77.8 -3.5Ghana 24 70.7 -7.3Guinea 43 62.4 +0.8Guinea-Bissau 22 71.1 +14.9Kenya 18 74.5 +9.2Lesotho 42 63.4 -1.0Liberia 49 55.8 +3.7Libya 4 84.8 -1.0Madagascar 51 49.6 -20.5Malawi 20 71.6 +3.7Mali 26 69.9 -3.3Mauritania 36 66.4 +4.9Mauritius 2 90.6 -8.1Morocco 14 75.4 -1.5Mozambique 40 65.3 +6.1Namibia 33 67.9 +1.6Niger 47 59.5 +1.7Nigeria 46 61.7 +11.3Rwanda 7 82.2 +8.3São Tomé & Príncipe 9 81.5 +2.2Senegal 17 74.9 +6.2Seychelles 1 99.9 +5.2Sierra Leone 48 57.0 +8.1Somalia 54 44.5 +7.5South Africa 10 79.1 +0.8South Sudan 52 45.3 .Sudan 45 61.8 -3.0Swaziland 15 75.3 +1.7Tanzania 31 68.8 +2.8Togo 37 66.1 +7.7Tunisia 6 83.0 -3.9Uganda 27 69.7 +6.3Zambia 25 70.6 +13.0Zimbabwe 34 66.8 +8.8African average 69.6 +2.2
2015 RANK/54
2015 SCORE /100
TREND2006-2015
Health, the highest scoring sub-category in Human Development (69.6), contains five of the top ten scoring indicators of the IIAG: Maternal Mortality (83.7), Disease (79.3), Immunisation (78.9), Undernourishment (76.2) and Child Mortality (74.8). The improvement registered at the continental level (+2.2 points) is also widespread at the country level; 38 countries have shown improvement over the past ten years, seven by more than +10.0 score points: Ethiopia (+20.5), Angola (+16.4), Guinea-Bissau (+14.9), Zambia (+13.0), Nigeria (+11.3), Burkina Faso (+10.4) and Comoros (+10.3).
Seven of the nine underlying indicators in Health have shown progress since 2006, with Child Mortality (+14.2) showing notable improvement as the third most improved indicator in IIAG and one in which all countries progress.
However, the strong deterioration of the indicator Basic Health Services (-9.8), showing the eighth largest deterioration in the IIAG, illustrates that public satisfaction with health services represents a challenge.
Health sub-category: key findings
Basic Health Services registers the eighth largest indicator deterioration in the IIAG.
EDUCATION
47.9
+4.2
43.7
HEALTH
+2.2
67.4
69.6
2015 Score 2006 ScoreTrend
2006-2015 average trend & score

68
Algeria 8 61.6 +8.1Angola 38 41.0 +10.3Benin 29 46.9 +2.1Botswana 3 76.8 +7.7Burkina Faso 30 46.7 +2.5Burundi 33 44.1 +9.8Cabo Verde 7 61.7 -3.6Cameroon 26 48.3 +6.4Central African Republic 52 20.2 -3.1Chad 47 34.7 +1.8Comoros 36 41.8 +3.0Congo 35 43.1 +6.0Côte d'Ivoire 39 40.0 +12.1Democratic Republic of Congo 48 34.2 +6.6Djibouti 21 51.2 -1.8Egypt 20 51.5 +7.4Equatorial Guinea 44 35.4 +12.0Eritrea 51 24.3 -17.1Ethiopia 11 60.4 +10.0Gabon 42 36.7 -10.0Gambia 15 56.6 +4.1Ghana 10 61.1 -4.6Guinea 34 43.8 +7.8Guinea-Bissau 46 35.1 -6.3Kenya 16 55.1 +11.9Lesotho 32 46.1 +1.2Liberia 40 38.3 +10.3Libya 50 25.2 -36.3Madagascar 45 35.3 -16.5Malawi 22 49.5 +3.9Mali 28 47.1 +0.1Mauritania 17 53.8 +0.9Mauritius 4 76.5 -0.8Morocco 13 57.2 +7.0Mozambique 23 48.9 -4.3Namibia 6 62.7 -4.4Niger 24 48.8 +12.8Nigeria 27 48.2 +6.3Rwanda 1 79.2 +20.7São Tomé & Príncipe 14 56.7 +10.4Senegal 18 53.7 +7.0Seychelles 2 78.2 +8.6Sierra Leone 42 36.7 -5.0Somalia 54 1.5 +1.5South Africa 5 69.3 -2.9South Sudan 53 17.0 .Sudan 49 28.7 +1.6Swaziland 31 46.3 +1.9Tanzania 19 53.5 +4.1Togo 37 41.2 +14.0Tunisia 9 61.5 -2.9Uganda 12 59.7 +3.8Zambia 25 48.4 +5.2Zimbabwe 41 38.0 +8.3African average 47.4 +2.1
2015 RANK/54
2015 SCORE /100
TREND2006-2015
Welfare is both the lowest scoring (47.4) sub-category in Human Development in 2015, and the least improved (+2.1) over the past decade. This trend is seen in both high and low scoring countries. More than half (six) of the top ten and half of the bottom ten register deterioration.
Thirty-eight countries improve since 2006, nine by more than +10.0 points: Rwanda (+20.7), Togo (+14.0), Niger (+12.8), Côte d’Ivoire (+12.1), Equatorial Guinea (+12.0), Kenya (+11.9), São Tomé & Príncipe (+10.4), Angola (+10.3) and Liberia (+10.3). Rwanda’s performance stands out as the highest scoring country as well as the largest improver.
The progress registered in Welfare at the continental level is driven by improvement in six out of its nine indicators over the past ten years: Poverty (+7.2), Environmental Sustainability (+6.9), Welfare Services (+6.0), Social Safety Nets (+2.8), Social Protection & Labour (+1.6) and Narrowing Income Gaps (+0.5).
However, attention must be given to the deterioration registered in Social Exclusion (-2.1), Poverty Reduction Priorities (-1.3) and Environmental Policy (-0.8), even if it does not hold back the overall progress of this sub-category.
#01
Afrobarometer: citizen perceptions on inequality
The Afrobarometer indicator Narrowing Income Gaps is an assessment of how satisfied the public is with how their government is handling addressing inequality, the only available measure of inequality to be included in the IIAG. On average, the indicator has registered marginal improvement (+0.5) over the past decade. However, in 13 countries, covering nearly a quarter (24%) of the continent’s population, citizens consider that government action in this matter has declined since 2006.
SPOTLIGHT
Welfare sub-category: key findings
A Decade of African Governance: Human Development
WELFARE
2015 Score 2006 ScoreTrend
45.3
47.4
+2.1
2006-2015 average trend & score

2016 IIAG: INDEX REPORT
69
perceptions of Living Standards of the Poor decline and the measure derived from qualitative assessments, Equity of Public Resource Use, registers an improvement (+1.0). This divergence is also seen at the country level with a majority of countries (18 out of 33) showing opposing trajectories.
Measuring poverty
In Africa, poverty alleviation is one of the main expectations citizens have of their governments. However, data on poverty is severely limited. Only 39 African countries have collected data on “income poverty level” (people who live on $1.90 a day), out of which only nine countries have two or more data points in the past decade, with the latest data year being in 20121. Household surveys used by countries to produce poverty statistics are conducted every three to ten years and often published at least a full year or two after data collection is finished2. Due to this data scarcity previous iterations of the IIAG could only use the clustered indicator Equity of Public Resource Use from the World Bank and African Development Bank as a proxy to measure poverty.
For the first time, the 2016 IIAG includes measures on the lived experience of poverty. Poverty is now captured through two indicators. A new clustered indicator from Afrobarometer, Poverty, consists of four underlying measures that capture the quality of living conditions of the public, and the extent to which the public have gone without enough food to eat, clean water for home use and fuel to cook food in the past year. A strengthened indicator, Poverty Reduction Priorities, which includes a new measure Living Standards of the Poor from Afrobarometer, alongside the existing measures on the Equity of Public Resource Use captures the level of public satisfaction with how the government is improving the living standards of the poor, and the extent to which public expenditure and revenue collection affects poor populations and is consistent with national poverty reduction priorities.
Over the past ten years, the indicator Poverty, on average, has shown the largest improvement (+7.2) of the Welfare sub-category. Twenty-nine (out of 34 assessed) countries register improvements, accounting for 67% of the continent’s population and 76% of the African GDP. Of these 29 countries, more than half (15) increase by more than +10.0 score points with the largest improvement seen in Egypt (+31.4). Further, 14 countries register improvement across all four underlying measures.
On the other hand, the Poverty Reduction Priorities indicator registers, on average, a decline of -1.3 score points over the past ten years. This decline at continental level is driven by deteriorations in the underlying measure Living Standards of the Poor (-2.5). Some drops in country scores are as large as -75.0 score points (Libya). Twenty-three countries, hosting 45% of Africans register decline in this indicator, with over half (12) of these countries falling by a magnitude of more than -10.0 score points.
On average, the results of the underlying measures of the Poverty Reduction Priorities indicator reveal diverging results, both at average and country level; citizens’
SPOTLIGHT #02
1 Alkire Sabina, “Towards Frequent and Accurate Poverty Data” http://unsdsn.org/wp-content/uploads/2014/09/Towards-Frequent-and-Accurate-Poverty-Data-WEB.pdf. 2 Ferreira Francisco, “The international poverty line has just been raised to $1.90 a day, but global poverty is basically unchanged. How is that even possible?” http://blogs.worldbank.org/developmenttalk/international-poverty-line-has-just-been-raised-190-day-global-poverty-basically-unchanged-how-even.
Poverty Reduction Priorities since 2006
Country Living Standards of the Poor (AFR)
Equity of Public Resource Use (AfDB/WB)
Ghana -43.3 -0.9Madagascar -21.1 -21.7Malawi -32.9 -6.2Mozambique -21.8 -15.5South Africa -17.9 0.0Benin -18.1 +11.3Burundi -5.8 +18.4Lesotho -1.3 +4.2Liberia -17.4 +2.9Mauritius -13.2 +12.5Nigeria -9.8 +4.1Sierra Leone -55.1 +11.3Tanzania -0.8 +6.2Zimbabwe -55.4 +29.8Namibia +0.7 0.0Swaziland +0.8 0.0Burkina Faso +2.6 -2.1Cabo Verde +5.6 -20.6Mali +8.2 -4.2Morocco +8.6 -12.5Tunisia +1.6 -12.5Zambia +23.0 -8.3Algeria +18.8 +12.5Botswana +7.4 +12.5Cameroon +5.5 +6.3Côte d'Ivoire +12.3 +36.1Egypt +34.4 +25.0Guinea +6.2 +6.2Kenya +18.1 +13.4Niger +32.1 +11.3Senegal +28.7 +10.4Togo +12.8 +29.8Uganda +17.7 +1.1
Ordered by countries showing similar trends in both indicators.

70
A Decade of African Governance: Regional Performance
PARTICIPATION & HUMAN RIGHTS
SAFETY & RULE OF LAW SUSTAINABLE ECONOMIC OPPORTUNITY
5th39.82015 RANK2015 SCORE
3rd42.72015 RANK2015 SCORE
4th41.82015 RANK2015 SCORE
1st
2nd
59.7
57.4
2015 RANK
2015 RANK
2015 SCORE
2015 SCORE
41.8 5th
CENTRAL AFRICA
2015 SCORE 2015 RANK
44.8 4th
EAST AFRICA
2015 SCORE 2015 RANK
47.9 3rd
NORTH AFRICA
2015 SCORE 2015 RANK
63.3
56.8
1st
2nd
SOUTHERN AFRICA
WEST AFRICA
2015 SCORE
2015 SCORE
2015 RANK
2015 RANK
5th33.92015 RANK2015 SCORE
4th39.32015 RANK2015 SCORE
2nd48.32015 RANK2015 SCORE
1st
3rd
50.5
42.6
2015 RANK
2015 RANK
2015 SCORE
2015 SCORE
5th49.42015 RANK2015 SCORE
3rd52.82015 RANK2015 SCORE
1st62.72015 RANK2015 SCORE
2nd
4th
59.9
52.7
2015 RANK
2015 RANK
2015 SCORE
2015 SCORE
HUMAN DEVELOPMENT
OVERALL GOVERNANCE
41.2 +1.15th
CENTRAL AFRICA
2015 SCORE 2015 RANK CHANGE SINCE 2006
44.9 -0.14th
EAST AFRICA
2015 SCORE 2015 RANK CHANGE SINCE 2006
50.2 -1.43rd
NORTH AFRICA
2015 SCORE 2015 RANK CHANGE SINCE 2006
58.3
52.4
+1.3
+3.1
1st
2nd
SOUTHERN AFRICA
WEST AFRICA
2015 SCORE
2015 SCORE
2015 RANK
2015 RANK
CHANGE SINCE 2006
CHANGE SINCE 2006

2016 IIAG: INDEX REPORT
71
Reaching a regional score of 58.3 in 2015, Southern Africa remains the highest scoring region in Overall Governance, hosting four of the top ten scoring countries. Over the decade, it has improved on average by +1.3 points. It is also the best performing region with the highest average regional score in all categories but Human Development. Southern Africa has shown average improvement in all categories except Safety & Rule of Law where it shows a slight deterioration of -1.6 score points. Accountability has declined in Southern Africa by -4.0 score points since 2006 and this is the main driver behind the decline in score in Safety & Rule of Law. The regional average score of 44.7 in 2015 is in fact the worst ever score Southern Africa has received for Accountability across the entire IIAG time series.
Over the last decade, West Africa (52.4) is the second best performing region, having registered the largest increase in its average score of Overall Governance, driven by improvement of 12 out of its 15 countries. West Africa is the most improved region in Human Development (+4.3) and in Sustainable Economic Opportunity (+3.6), where 12 out of the 15 countries show improvement, with Niger (+10.8), Togo (+10.6) and Côte d’Ivoire (+8.7) leading the pack. West Africa is also the only region not to show deterioration in Safety & Rule of Law over the decade, improving by +1.2 points. However this average improvement is partly driven by the large gains managed by Côte d’Ivoire (+17.3) and Liberia (+14.8), while more than half the region’s countries (eight out of 15) are deteriorating, including Nigeria, which accounts for over half (52%) of the regional population. Moreover, looking at West Africa’s average performance at indicator level, Government Involvement in Armed Conflicts appears the most deteriorated, declining by -31.8 score points.
In 2015, North Africa reaches an average regional score of 50.2 in Overall Governance, having registered the largest deterioration (-1.4) of all regions, driven in particular by decline in Libya (-18.0). The region has gone through a considerable decline (-10.2) in Safety & Rule of Law over the decade, driven by deteriorating performance across all four sub-categories, but particularly so in Personal Safety (-14.2) and National Security (-17.0). All six North African countries decline in Safety & Rule of Law, with the largest deterioration seen in Libya (-34.1), the most deteriorated country on the continent. Despite remaining the highest scoring region in Human Development the region registers a slight decline (-0.6) in the past ten years in this category. It also registers a decline in Sustainable Economic Opportunity (-0.9), and now ranks as the 2nd highest performing region with a score of 48.3 (it ranked 1st in this category in 2006). The only category in which North Africa has improved over the last decade is Participation & Human Rights, by a strong +5.8 points.
East Africa has registered a marginal decline in Overall Governance (-0.1), and ranks 4th with an average score of 44.9 points. It is also the only region, with North Africa, to
register a decline, albeit slight (-0.1), in Sustainable Economic Opportunity. In this category, the regional average masks diverging country trends over the decade. While Eritrea (-5.6), Tanzania (-2.6), Sudan (-2.4) and Ethiopia (-0.6) all show deterioration over the past decade, Rwanda (+9.4), Kenya (+7.8) and Seychelles (+7.2) all improve by more than +5.0 points. East Africa is also the only region to register an average deterioration, even if slight (-0.6), in the Participation sub-category, from an already quite low average score of 35.6. Even if the majority of the region’s countries (eight out of 13) do improve, some large deteriorations, especially in Burundi (-13.1), are driving the negative average trend.
Central Africa reaches an average regional score of 41.2 points at Overall Governance level, having improved by +1.1 points. It is the lowest scoring region, on average, in all four categories of the IIAG, although it does register improvement in each category except Safety & Rule of Law. Central Africa’s Safety & Rule of Law score (41.8) in 2015 is its lowest across the IIAG time series. Average improvement in Participation & Human Rights is somewhat tempered by the fact that the region has arrived at its worst ever average score for the sub-category Rights in 2015 (35.8). Central Africa’s improvement in Sustainable Economic Opportunity (+2.7), though from a low base (31.2 points in 2006), is driven by the fact that all countries except the Central African Republic have improved in this category over the last decade.
Central Africa Cameroon, Central African Republic (CAR), Chad, Congo, Democratic Republic of Congo (DRC), Equatorial Guinea, Gabon, São Tomé & Príncipe
East Africa Burundi, Comoros, Djibouti, Eritrea, Ethiopia, Kenya, Rwanda, Seychelles, Somalia, South Sudan, Sudan, Tanzania, Uganda
North Africa Algeria, Egypt, Libya, Mauritania, Morocco, Tunisia
Southern Africa Angola, Botswana, Lesotho, Madagascar, Malawi, Mauritius, Mozambique, Namibia, South Africa, Swaziland, Zambia, Zimbabwe
West Africa Benin, Burkina Faso, Cabo Verde, Côte d’Ivoire, Gambia, Ghana, Guinea, Guinea-Bissau, Liberia, Mali, Niger, Nigeria, Senegal, Sierra Leone, Togo
Source: African Economic Outlook (AEO) 2016 (AfDB/OECD/UNDP)
Regions


TRAJECTORIES
Peak Performance
Balance

74
Peak Performance
In the final chapter of this report we examine the diverse governance trajectories followed by African countries over the decade. One way of doing this is to look at which year a country saw its best or “peak” performance over the decade at any given level of the Index.
Within the decade, a majority of African countries (32) reached their best performance at Overall Governance level at some point before 2015, and then fell behind again, whilst only 20 countries achieve their peak performance in 2015.
This means that in 2015 nearly half of Africa’s people (49%) live in a country whose final score has fallen behind a peak performance, reached sometime within the last decade.
Is the best already behind us?
Number of countries reaching their best Overall Governance score by year
15
10
5
20
4 4
1
3
6
8
2
20
4
0
25
02006 2007 2008 2009 2010 2011 2012 2013 2014 2015 Year

2016 IIAG: INDEX REPORT
75
Group B, composed of Egypt, Kenya and Zimbabwe, fell to their lowest score in Overall Governance at some point in the past ten years, but have shown considerable improvement since to achieve their best performance in 2015. Egypt has recovered from its fall in Overall Governance between 2010 and 2013, to bounce back and achieve the same score in 2015 as it did in 2009 (51.0). Kenya and Zimbabwe, on the other hand, have improved by more than +5.0 points since their year of worst performance (2009 and 2008, respectively) to register their highest ever score in 2015.
Group C contains three countries which have stalled in Overall Governance since reaching their peak performance in the past five years: Angola, Ethiopia and Zambia. The change in score between the year of peak performance in these countries and their score in 2015 is less than +/- 1.0 points, indicating a lack of governance progress in recent years. Whilst Zambia is in the “Medium-High” band for Overall Governance, Ethiopia features in the “Medium” band and Angola in the “Medium-Low” band.
An analysis of peak performance in Overall Governance at the country level reveals three key trends across three groups of countries, reflecting the divergence in country performance over the past ten years
In Group A, Gambia, Libya, Mali and Mozambique, achieved their peak performance in the last ten years and have shown a sharp decline since to register their lowest Overall Governance score over the decade in 2014 or 2015. Three of these four countries have also moved down a band in score over the past ten years; Mali and Mozambique dropped from “Medium-High” to “Medium” and Libya from “Medium” to “Medium-Low”.
Group A: Decline since peak performance
Gambia MaliLibya Mozambique
Peak Perfomance Lowest Performance
EthiopiaAngola Zambia Peak Perfomance
Egypt ZimbabweKenya
Peak Perfomance Lowest Performance
Group B: Bouncing back from worst performance
Score
30.0
35.0
40.0
45.0
50.0
55.0
60.0
2006 2007 2008 2009 2010 2011 2012 2013 2014 2015
Group C: Stalled since peak performance
20.0
30.0
40.0
50.0
70.0
60.0
2006 2007 2008 2009 2010 2011 2012 2013 2014 2015
Score
Year
20.0
30.0
40.0
50.0
70.0
60.0
2006 2007 2008 2009 2010 2011 2012 2013 2014 2015
Score
Year
Year

76
This peak performance analysis can be extended to the category level of the Index.
In Sustainable Economic Opportunity and Human Development the majority of countries achieve their best score in the last three years, a trend that is comparable with that seen in Overall Governance. In Participation & Human Rights 18 countries achieve their best score in 2015 whilst in Human Development 21 countries achieve their peak performance in 2015. In Sustainable Economic Opportunity, although 17 countries achieve their peak performance in 2015, almost half of the countries (26) reach their best score before 2013.This mixed picture in Sustainable Economic Opportunity is replicated at the sub-category level. Only six countries register their highest score in Public Management in 2015: Chad, Côte d’Ivoire, Ethiopia, Rwanda, Seychelles and Zimbabwe, meaning that 48 countries score lower than they have done previously. However, reflecting the strongly positive trend seen over the decade in Infrastructure, the majority of countries (28 out of 54) achieve their best decade score in Infrastructure in 2015.
However the most striking results appear in the Safety & Rule of Law category where the best performance appears to be in the past for a majority of countries. The year in which the most countries achieve their highest score is 2008 (nine countries) as opposed to 2015 for Overall Governance and the other three categories. In addition to this a greater number of countries achieve their highest score in the first half of the decade (20 countries over 2006-2010 compared to 18 countries over 2011-2015). From 2000-2005, prior to the time
period analysed in this report, 16 countries achieved their best score - the largest number of countries out of any category.
A total of 26 countries register their worst ever score within the last three years. This is almost half of all countries on the continent, accounting for 64% of the continent’s population. Twelve countries registered their worst ever Safety & Rule of Law score in 2015 (Algeria, Botswana, Burundi, Eritrea, Gabon, Gambia, Ghana, Libya, Malawi, Mauritius, Mozambique, South Sudan), five more in 2014 (Burkina Faso, Cameroon, Morocco, Nigeria, Somalia) and a further nine countries in 2013 (Benin, Central African Republic, Democratic Republic of Congo, Djibouti, Egypt, Guinea-Bissau, Kenya, Sudan, Tanzania).
This declining performance is seen at the sub-category level as well. Only five countries (Cameroon, Kenya, Niger, Swaziland and Togo) achieved their best score in Personal Safety in 2015, meaning that almost all African countries - 49 out of 54 - have declined from a best score reached at some point during the decade. A similar situation is seen in Accountability where 44 countries registered a lower score in 2015 than in previous years. Only ten countries achieved their best performance in this sub-category in 2015: Congo, Côte d’Ivoire, Democratic Republic of Congo, Guinea-Bissau, Lesotho, Morocco, Rwanda, São Tomé & Príncipe, Seychelles and Togo.
This continental trajectory is concerning. Let us hope that the peak performance in Safety & Rule of Law is not past history.
Countries’ peak performance by category (2006-2015)
Num
ber o
f cou
ntrie
s
15
10
5
20
25
0
Year
SAFETY & RULE OF LAW
PARTICIPATION & HUMAN RIGHTS
SUSTAINABLE ECONOMIC OPPORTUNITY
HUMAN DEVELOPMENT
2
2006
2007
2008
2009
2010
2011
2012
2013
2014
2015
7
9
20
43 3
2
6
2006
2007
2008
2009
2010
2011
2012
2013
2014
2015
1 0
7
4 4
6
2
65
17
2006
2007
2008
2009
2010
2011
2012
2013
2014
2015
4 4
23 3
0
6 6
21
3
2006
2007
2008
2009
2010
2011
2012
2013
2014
2015
0
6
21 1
76
54
18
4
Peak Performance


78
Balance
Since the first Index, the Mo Ibrahim Foundation has chosen to give equal weight to the four dimensions of governance assessed by the IIAG: Safety & Rule of Law, Participation & Human Rights, Sustainable Economic Opportunity and Human Development. Despite covering a wide range of public goods and services, every government is responsible for delivering these to their citizens, and every citizen is equally entitled to them.
Governments are faced with a wide range of challenges, with differences existing between and within countries, which lead to prioritising one dimension over another. In the long run, the resulting imbalance can prove unsustainable.
Looking at the category scores in 2009, before the Arab Spring, Egypt, Libya and Tunisia, all illustrated a widening imbalance between their category results, even if scores in Overall Governance were relatively high.
We use the bandings outlined in this Index Report to identify three types of country performance: balanced, slightly imbalanced and imbalanced.
In 2015 only seven countries are balanced, i.e. their score places them in the same band across all four categories. Two countries achieve balance in the “High” band (71.0 points and above): Mauritius and Botswana. Five countries achieve balance but at a lower level. Mali, Gabon and Djibouti register in the “Medium” band (score between 41.0 and 53.9 points), Chad registers in the “Medium-Low” band (score between 23.0 and 40.9 points) and Somalia sits in the “Low” band (below 23.0 points).
Balance should not be considered in isolation from score level.
Balance is key
Balance in 2015
Imbalance in Egypt, Libya and Tunisia in 2009 (scores)
LibyaEgypt Tunisia
100
100
100100
Safety & Rule of Law
Participation & H
uman Rights
Sustainable Economic Opportunity
Hum
an D
evel
opm
ent
Hig
hM
ediu
m-H
igh
Med
ium
M
ediu
m-L
owLo
w20
15 B
and
Mauritius Mauritius Mauritius Mauritius
Botswana Botswana Botswana Botswana
Mali Mali Mali Mali
Gabon Gabon Gabon Gabon
Djibouti Djibouti Djibouti Djibouti
Chad Chad Chad Chad
Somalia Somalia Somalia Somalia
High: 71.0 and above
Medium-High: 54.0 to 70.9
Medium: 41.0 to 53.9
Medium-Low: 23.0 to 40.9
Low: Below 23.0
KEY
Safety & Rule of Law
Participation & Human RightsSustainable Economic Opportunity
Human Development
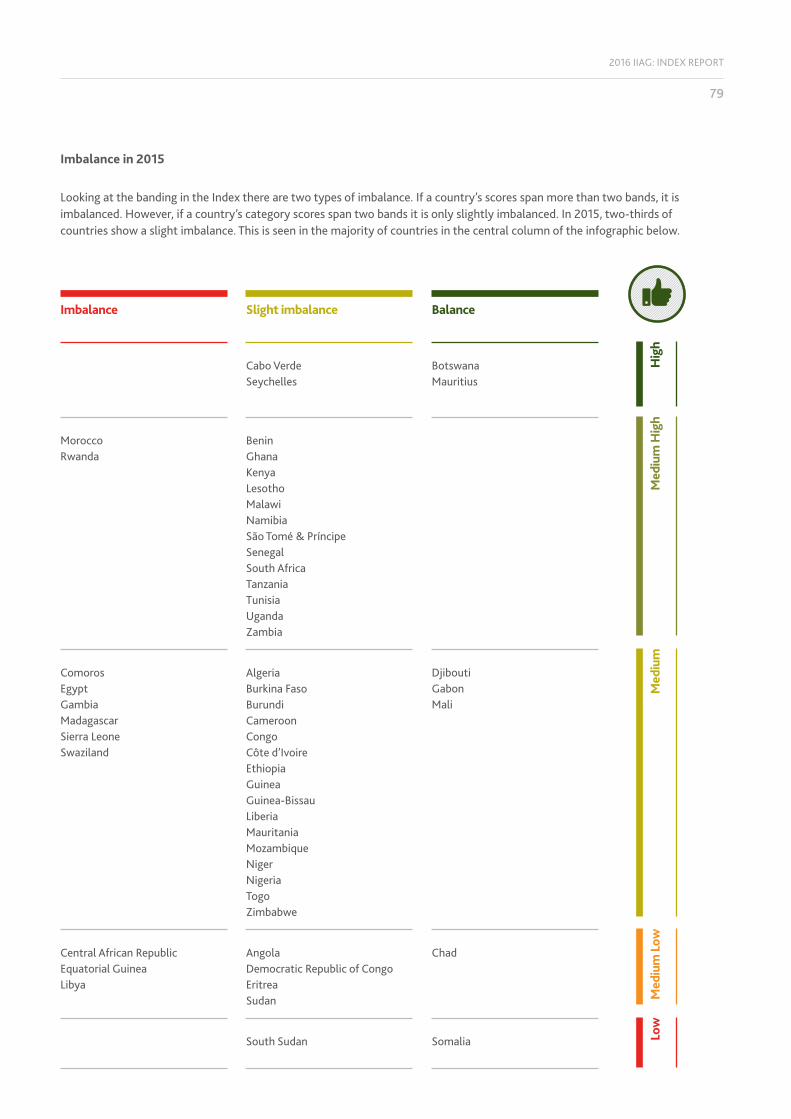
2016 IIAG: INDEX REPORT
79
Imbalance in 2015
Looking at the banding in the Index there are two types of imbalance. If a country’s scores span more than two bands, it is imbalanced. However, if a country’s category scores span two bands it is only slightly imbalanced. In 2015, two-thirds of countries show a slight imbalance. This is seen in the majority of countries in the central column of the infographic below.
BeninGhanaKenyaLesothoMalawiNamibiaSão Tomé & PríncipeSenegalSouth AfricaTanzaniaTunisiaUgandaZambia
MoroccoRwanda
Cabo VerdeSeychelles
BotswanaMauritius
AlgeriaBurkina FasoBurundiCameroonCongoCôte d’IvoireEthiopiaGuineaGuinea-BissauLiberiaMauritaniaMozambiqueNigerNigeriaTogoZimbabwe
ComorosEgyptGambiaMadagascarSierra LeoneSwaziland
DjiboutiGabonMali
AngolaDemocratic Republic of CongoEritreaSudan
Central African RepublicEquatorial GuineaLibya
Chad
South Sudan Somalia
Imbalance Slight imbalance Balance
Hig
hM
ediu
m H
igh
Med
ium
Low
Low
Med
ium

80
Over time a change in banding at the category level can have an impact on a country’s balance. An improvement in a band in a category can leave a country more imbalanced that it was, especially if it is accompanied by a decrease in another category band.
“Balanced improvement” is achieved where changes in banding do not create or increase imbalance between governance categories. Congo, Côte d’Ivoire and Liberia manage this over the decade.
It is also possible for governance to demonstrate “imbalanced change” where improvements and deterioration in different bands can disrupt balance as seen in the case of Gambia over the decade.
This can demonstrate the tensions between improving the socio-economic aspects of governance (Sustainable Economic Opportunity and Human Development) and the institutional and political dimensions of governance (Safety & Rule of Law and Participation & Human Rights).
Countries showing balanced improvement (2006-2015) Countries showing imbalanced change (2006-2015)
Trends in balance over the decade
Hig
h
Côte d’Ivoire
Côte d’Ivoire Côte d’Ivoire
Congo
Liberia
Liberia Congo
Congo
CongoLiberia
Liberia
Côte d’Ivoire
Med
ium
-Hig
hM
ediu
m
Med
ium
-Low
Low
2015
Ban
d
No change of band
Hig
h
Gambia
Gambia
Gambia
Gambia
Med
ium
-Hig
hM
ediu
m
Med
ium
-Low
Low
2015
Ban
d
No change of band
High: 71.0 and above
Medium-High: 54.0 to 70.9
Medium: 41.0 to 53.9
Medium-Low: 23.0 to 40.9
Low: Below 23.0
KEY Safety & Rule of Law
Participation & Human Rights
Sustainable Economic Opportunity
Human Development
Balance


INDICATORS
Framework of the 2016 IIAG
Indicators: 2015 Scores & Trends 2006-2015
Indicators: Definitions & Sources
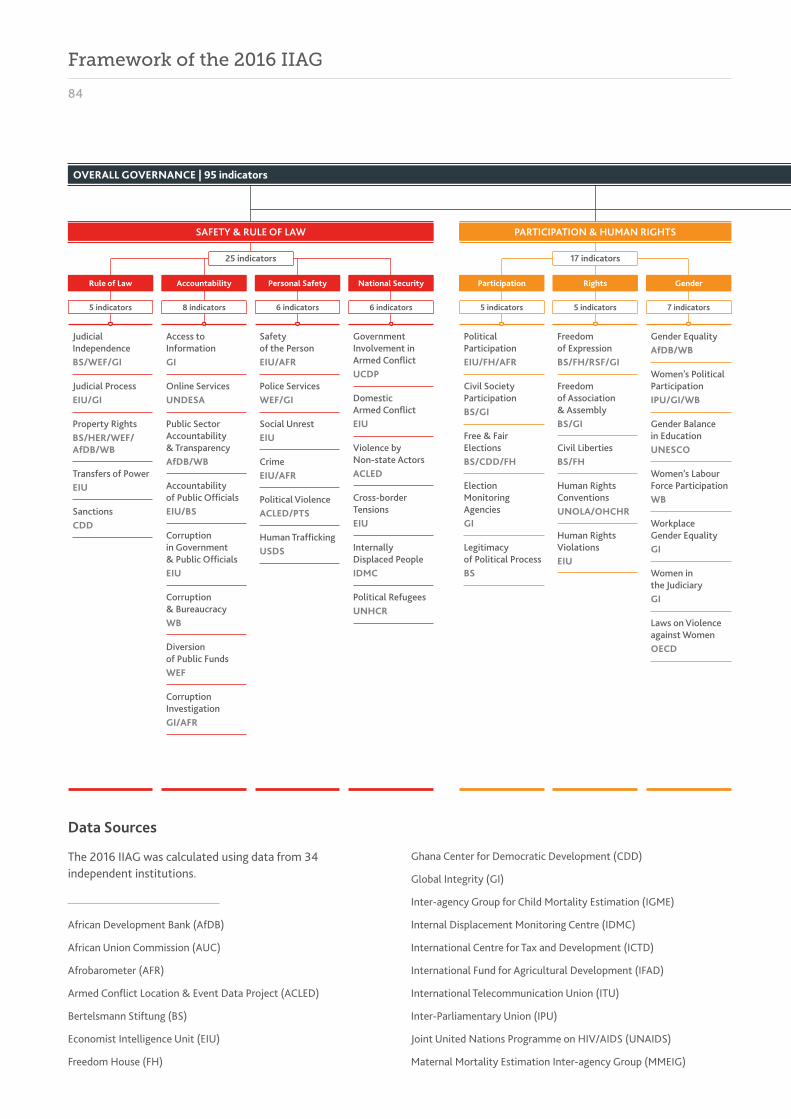
84
Framework of the 2016 IIAG
The 2016 IIAG was calculated using data from 34 independent institutions.
African Development Bank (AfDB)
African Union Commission (AUC)
Afrobarometer (AFR)
Armed Conflict Location & Event Data Project (ACLED)
Bertelsmann Stiftung (BS)
Economist Intelligence Unit (EIU)
Freedom House (FH)
Ghana Center for Democratic Development (CDD)
Global Integrity (GI)
Inter-agency Group for Child Mortality Estimation (IGME)
Internal Displacement Monitoring Centre (IDMC)
International Centre for Tax and Development (ICTD)
International Fund for Agricultural Development (IFAD)
International Telecommunication Union (ITU)
Inter-Parliamentary Union (IPU)
Joint United Nations Programme on HIV/AIDS (UNAIDS)
Maternal Mortality Estimation Inter-agency Group (MMEIG)
Data Sources
SAFETY & RULE OF LAW PARTICIPATION & HUMAN RIGHTS
OVERALL GOVERNANCE | 95 indicators
Rule of Law Accountability Personal Safety National Security Participation Rights Gender
25 indicators
8 indicators5 indicators 6 indicators 6 indicators 5 indicators 5 indicators
17 indicators
7 indicators
Safety of the PersonEIU/AFR
Police ServicesWEF/GI
Social UnrestEIU
CrimeEIU/AFR
Political ViolenceACLED/PTS
Human TraffickingUSDS
Government Involvement in Armed ConflictUCDP
Domestic Armed ConflictEIU
Violence by Non-state ActorsACLED
Cross-border TensionsEIU
Internally Displaced PeopleIDMC
Political RefugeesUNHCR
Political ParticipationEIU/FH/AFR
Civil Society ParticipationBS/GI
Free & Fair ElectionsBS/CDD/FH
Election Monitoring AgenciesGI
Legitimacy of Political ProcessBS
Gender EqualityAfDB/WB
Women’s Political ParticipationIPU/GI/WB
Gender Balance in EducationUNESCO
Women’s Labour Force ParticipationWB
Workplace Gender EqualityGI
Women in the JudiciaryGI
Laws on Violence against WomenOECD
Freedom of ExpressionBS/FH/RSF/GI
Freedom of Association & AssemblyBS/GI
Civil LibertiesBS/FH
Human Rights ConventionsUNOLA/OHCHR
Human Rights ViolationsEIU
Access to InformationGI
Online ServicesUNDESA
Public Sector Accountability & TransparencyAfDB/WB
Accountability of Public OfficialsEIU/BS
Corruption in Government & Public OfficialsEIU
Corruption & BureaucracyWB
Diversion of Public FundsWEF
Corruption InvestigationGI/AFR
Judicial IndependenceBS/WEF/GI
Judicial ProcessEIU/GI
Property RightsBS/HER/WEF/AfDB/WB
Transfers of PowerEIU
SanctionsCDD

2016 IIAG: INDEX REPORT
85
HUMAN DEVELOPMENTSUSTAINABLE ECONOMIC OPPORTUNITY
Public Management Business Environment Infrastructure Rural Sector Welfare Education Health
8 indicators 6 indicators
27 indicators
5 indicators 8 indicators 9 indicators
26 indicators
8 indicators 9 indicators
Statistical CapacityWB
Public AdministrationAfDB/WB
DiversificationAfDB/OECD/UNDP
Budget ManagementAfDB/WB
Ratio of Revenue to ExpenditureAfDB/AUC/UNECA
Fiscal PolicyAfDB/WB
Revenue MobilisationICTD/AfDB/WB
Transparency of State-owned CompaniesGI
Investment Climate HER
CompetitionBS/GI/AfDB/WB
Bureaucracy & Red TapeEIU
Customs ProceduresWEF
Soundness of BanksWEF
Employment CreationAFR
Basic Health ServicesAFR
Public Health CampaignsGI
Child MortalityIGME
Maternal MortalityMMEIG
Access to SanitationWHO/UNICEF
UndernourishmentWB
DiseaseWHO
ImmunisationWB/WHO
Anti-Retroviral Treatment (ART) ProvisionUNAIDS
Education ProvisionAFR
Education QualityBS
Educational System ManagementWEF
Human Resources in Primary SchoolsUNESCO
Primary School CompletionWB
Secondary School EnrolmentUNESCO
Tertiary Education EnrolmentUNESCO
LiteracyUNESCO
Welfare Services AfDB/WB
Social Safety NetsBS
Social Protection & LabourAfDB/WB
Social ExclusionBS
PovertyAFR
Poverty Reduction PrioritiesAFR/AfDB/WB
Narrowing Income GapsAFR
Environmental PolicyBS
Environmental SustainabilityAfDB/WB
Rural Business ClimateIFAD
Rural Development ResourcesIFAD
Agricultural Support SystemIFAD
Agricultural Policy CostsWEF
Rural Land & WaterIFAD
Engagement with Rural OrganisationsIFAD
Equal Representation in Rural AreasIFAD
Rural Accountability & Transparency IFAD
Transport InfrastructureWEF/AFR/EIU/GI
Electricity InfrastructureWEF/AFR
Digital & IT InfrastructureEIU/ITU
Access to WaterWHO/UNICEF
Water & Sanitation ServicesAFR
Office of the High Commissioner for Human Rights (OHCHR)
Office of the United Nations High Commissioner for Refugees (UNHCR)
Organisation for Economic Co-operation and Development (OECD)
Political Terror Scale (PTS)
Reporters sans frontières (RSF)
The Heritage Foundation (HER)
United Nations Children’s Fund (UNICEF)
United Nations Department of Economic and Social Affairs (UNDESA)
United Nations Development Programme (UNDP)
United Nations Economic Commission for Africa (UNECA)
United Nations Educational, Scientific and Cultural Organization (UNESCO)
United Nations Office of Legal Affairs (UNOLA)
United States Department of State - Office to Monitor and Combat Trafficking in Persons (USDS)
Uppsala University, Department of Peace and Conflict Research - Uppsala Conflict Data Programme (UCDP)
World Bank (WB)
World Economic Forum (WEF)
World Health Organization (WHO)
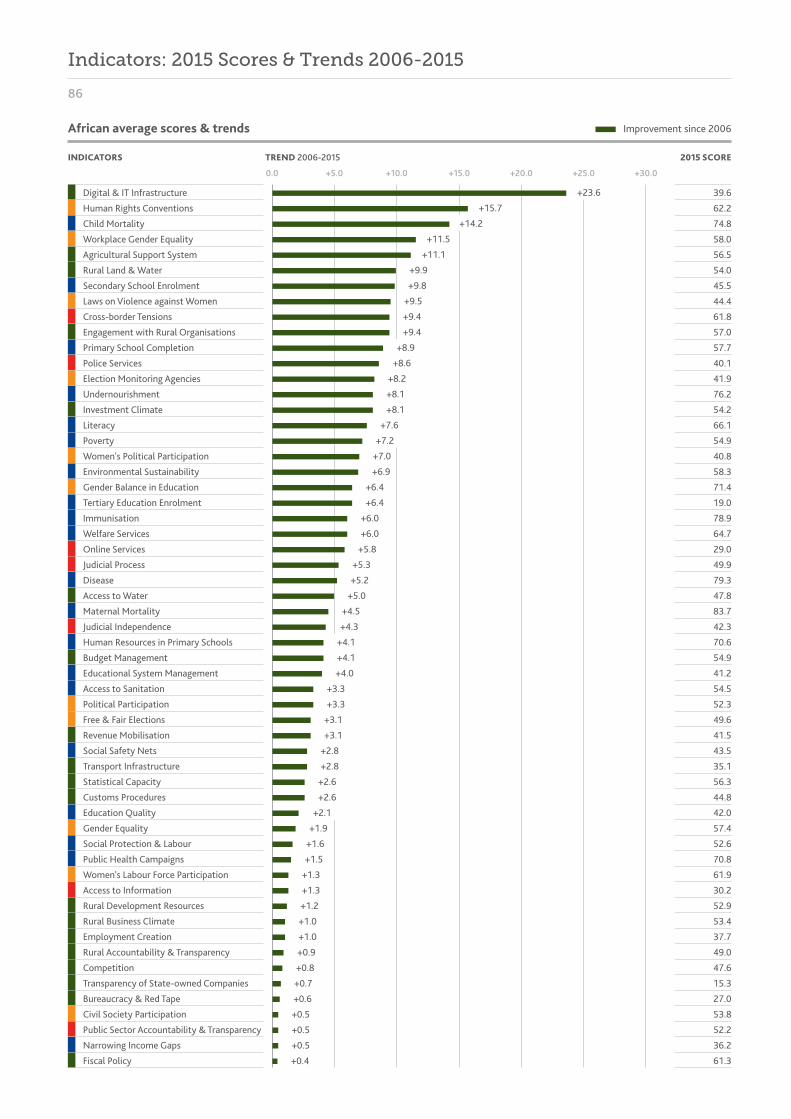
86
Indicators: 2015 Scores & Trends 2006-2015
African average scores & trends
0.0 +30.0+25.0+20.0+15.0+10.0+5.0
Digital & IT Infrastructure
Human Rights Conventions
Child Mortality
Workplace Gender Equality
Agricultural Support System
Rural Land & Water
Secondary School Enrolment
Laws on Violence against Women
Cross-border Tensions
Engagement with Rural Organisations
Primary School Completion
Police Services
Election Monitoring Agencies
Undernourishment
Investment Climate
Literacy
Poverty
Women's Political Participation
Environmental Sustainability
Gender Balance in Education
Tertiary Education Enrolment
Immunisation
Welfare Services
Online Services
Judicial Process
Disease
Access to Water
Maternal Mortality
Judicial Independence
Human Resources in Primary Schools
Budget Management
Educational System Management
Access to Sanitation
Political Participation
Free & Fair Elections
Revenue Mobilisation
Social Safety Nets
Transport Infrastructure
Statistical Capacity
Customs Procedures
Education Quality
Gender Equality
Social Protection & Labour
Public Health Campaigns
Women's Labour Force Participation
Access to Information
Rural Development Resources
Rural Business Climate
Employment Creation
Rural Accountability & Transparency
Competition
Transparency of State-owned Companies
Bureaucracy & Red Tape
Civil Society Participation
Public Sector Accountability & Transparency
Narrowing Income Gaps
Fiscal Policy
39.6
62.2
74.8
58.0
56.5
54.0
45.5
44.4
61.8
57.0
57.7
40.1
41.9
76.2
54.2
66.1
54.9
40.8
58.3
71.4
19.0
78.9
64.7
29.0
49.9
79.3
47.8
83.7
42.3
70.6
54.9
41.2
54.5
52.3
49.6
41.5
43.5
35.1
56.3
44.8
42.0
57.4
52.6
70.8
61.9
30.2
52.9
53.4
37.7
49.0
47.6
15.3
27.0
53.8
52.2
36.2
61.3
INDICATORS TREND 2006-2015 2015 SCORE
Improvement since 2006
+23.6
+15.7
+14.2
+9.9
+8.9
+7.6
+9.8
+8.6
+7.2
+9.5
+8.2
+7.0
+11.5
+9.4
+8.1
+11.1
+9.4
+8.1
+6.4
+4.1
+1.5
+5.2
+3.1
+1.0
+6.0
+4.0
+1.3
+5.0
+2.8
+0.9
+6.0
+3.3
+1.3
+4.5
+2.1
+2.8
+0.8
+0.5
+5.8
+3.3
+1.2
+6.9
+4.3
+1.9
+2.6
+0.7
+0.5
+5.3
+3.1
+1.0
+6.4
+4.1
+1.6
+2.6
+0.6
+0.5
+0.4

2016 IIAG: INDEX REPORT
87
KEY
Safety & Rule of Law
Participation & Human Rights
Sustainable Economic Opportunity
Human Development
No ten-year trend (2006-2015) is available for the Antiretroviral Treatment (ART) Provision indicator.
Deterioration since 2006
-4.0
-10.6
-5.7
-18.2
-4.3
-12.4
-5.8
-21.5
-4.4
-12.6
-7.3
-5.1
-15.5
-8.7
-5.5
-15.9
-0.1
-0.8
-2.1
-3.0
-0.2
-1.1
-2.3
-3.0
-0.3
-1.3
-2.5
-3.1
-0.4
-1.5
-2.7
-3.7
-0.8
-1.9
-2.8
-3.8
-9.8
-30.0 0.0-5.0-10.0-15.0-20.0-25.0
Legitimacy of Political Process
Political Refugees
Diversion of Public Funds
Electricity Infrastructure
Public Administration
Environmental Policy
Accountability of Public Officials
Poverty Reduction Priorities
Internally Displaced People
Corruption Investigation
Social Exclusion
Property Rights
Water & Sanitation Services
Freedom of Expression
Corruption in Government & Public Officials
Domestic Armed Conflict
Diversification
Crime
Transfers of Power
Agricultural Policy Costs
Equal Representation in Rural Areas
Human Rights Violations
Freedom of Association & Assembly
Civil Liberties
Sanctions
Women in the Judiciary
Political Violence
Social Unrest
Corruption & Bureaucracy
Basic Health Services
Human Trafficking
Education Provision
Violence by Non-state Actors
Ratio of Revenue to Expenditure
Safety of the Person
Government Involvement in Armed Conflict
Soundness of Banks
Antiretroviral Treatment (ART) Provision
41.2
86.9
36.2
38.2
57.1
40.9
36.4
49.8
87.6
32.1
20.8
44.8
40.7
51.1
32.6
56.0
9.7
48.0
39.3
52.3
45.6
30.4
46.0
44.3
87.0
55.6
66.4
43.9
36.6
52.0
30.8
47.2
80.4
42.9
44.8
77.4
40.8
47.4
INDICATORS TREND 2006-2015 2015 SCORE

88
Indicators: Definitions & Sources
Safety & Rule of Law
Rule of Law
1 Judicial Independence (BS/WEF/GI)
Independence of the judiciary from the influence of external actors; whether the judiciary has the ability and autonomy to interpret and review existing laws, legislation and policy; and the integrity of the process of appointing and removing national-level judges. It consists of three sub-indicators.
2 Judicial Process (EIU/GI) Extent to which the legal process is free from interference, and the existence of formal judicial reasoning. It consists of two sub-indicators.
3 Property Rights (BS/HER/WEF/AfDB/WB)
Extent to which the government protects and enforces private property and contract rights. It consists of four sub-indicators.
4 Transfers of Power (EIU) Degree to which constitutional mechanisms are clear, established and accepted for the orderly transfer of power from one government to the next.
5 Sanctions (CDD) Imposition of sanctions by the United Nations and/or the African Union on a state and/or governmental and/or non-governmental actors.
Accountability
1 Access to Information (GI) Extent to which public and legislative records are accessible. It consists of two sub-indicators.
2 Online Services (UNDESA) Extent to which the government uses ICT to deliver public services at national level.
3 Public Sector Accountability & Transparency (AfDB/WB)
Extent to which the executive and public employees can be held to account by the electorate, legislative and judiciary. It consists of two sub-indicators.
4 Accountability of Public Officials (EIU/BS)
Extent of accountability of public officials and degree to which there are penalties if they abuse their positions. It consists of two sub-indicators.
5 Corruption in Government & Public Officials (EIU)
Level of vested interest/cronyism and corruption in the public sector.
6 Corruption & Bureaucracy (WB)
Degree of intrusiveness of bureaucracy, amount of red tape likely to be encountered and likelihood of encountering corruption among officials and other groups.
7 Diversion of Public Funds (WEF)
Prevalence of the diversion of public funds to companies, individuals or groups due to corruption.
8 Corruption Investigation (GI/AFR)
Extent to which allegations of corruption in the public sector and the executive are investigated by an independent body, and extent to which the public are satisfied with how the government is fighting corruption. It consists of three sub-indicators.
Personal Safety
1 Safety of the Person (EIU/AFR)
Perceived level of criminality, and public perceptions of neighbourhood safety. It consists of two sub-indicators.
2 Police Services (WEF/GI) Reliability of the police and the extent to which allegations of police misconduct and abuse of force are investigated. It consists of two sub-indicators.
3 Social Unrest (EIU) Prevalence of violent social unrest.
4 Crime (EIU/AFR) Prevalence of violence crime; public perception of violent crime; and degree to which the public are satisfied with how the government is reducing crime. It consists of three sub-indicators.
5 Political Violence (ACLED/PTS)
Level of violence and violations of physical integrity rights committed against civilians by the state. It consists of two sub-indicators.
6 Human Trafficking (USDS) Nature and scope of trafficking in persons and government actions to confront and eliminate it.
National Security
1 Government Involvement in Armed Conflict (UCDP)
Degree of direct or indirect involvement of the government in an armed conflict which results in at least 25 annual battle-related deaths.
2 Domestic Armed Conflict (EIU) Level of internal conflict and/or civil war, or the likelihood of conflict developing in the near future.
3 Violence by Non-state Actors (ACLED)
Degree of violence against civilians perpetrated by rebel groups, political militias and identity militias.

2016 IIAG: INDEX REPORT
89
4 Cross-border Tensions (EIU) Level of potential threats to economic and political stability due to international disputes or tensions.
5 Internally Displaced People (IDMC)
People displaced within a country due to violence, conflict and violations of human rights.
6 Political Refugees (UNHCR) People fleeing the country due to fear of persecution.
Participation & Human Rights
Participation
1 Political Participation (EIU/FH/AFR)
Extent to which citizens are free to participate in the political process, join a political organisation and choose who to vote for without feeling pressured. It consists of three sub-indicators.
2 Civil Society Participation (BS/GI)
Extent to which the government enables the participation of civil society in the political process; allows NGOs to organise freely; and does not persecute or harass NGO employees. It consists of two sub-indicators.
3 Free & Fair Elections (BS/CDD/FH)
Extent to which executive and legislative elections are free and fair, including impartiality of the electoral laws and framework. It consists of three sub-indicators.
4 Election Monitoring Agencies (GI)
Extent to which the agencies mandated to organise and monitor national elections are protected from political interference and make public reports available before and after a national election. It consists of two sub-indicators.
5 Legitimacy of Political Process (BS)
Extent to which democratically elected political representatives have effective power to govern or to which there are veto powers and political enclaves.
Rights
1 Freedom of Expression (BS/FH/RSF/GI)
Extent to which citizens and organisations can express opinions freely; the degree of print, broadcast and internet freedom; and the existence of media and citizen self-censorship. It consists of four sub-indicators.
2 Freedom of Association & Assembly (BS/GI)
Extent to which citizens can associate freely in public and participate in civic and political organisations, and workers can organise into trade unions. It consists of two sub-indicators.
3 Civil Liberties (BS/FH) Extent to which citizens enjoy civil liberties and can seek redress for violations of these rights. It consists of two sub-indicators.
4 Human Rights Conventions (UNOLA/OHCHR)
Ratification of the nine core international human rights conventions, and two optional protocols on children, and the submission of reports to the relevant bodies.
5 Human Rights Violations (EIU) Likelihood of a state being accused of serious human rights violations.
Gender
1 Gender Equality (AfDB/WB) Extent to which the government promotes equal access for men and women to human capital development opportunities and productive and economic resources, and provides equal status and protection under the law. It consists of two sub-indicators.
2 Women's Political Participation (IPU/GI/WB)
Extent to which women are represented in the legislative and executive. It consists of two sub-indicators.
3 Gender Balance in Education (UNESCO)
Ratio of girls to boys enrolled at primary and lower secondary levels in public and private schools.
4 Women's Labour Force Participation (WB)
Female population, 15 and older, that is economically active.
5 Workplace Gender Equality (GI)
Extent to which women receive equal pay and benefits to men for performing the same job, have equal opportunities to be hired or promoted and are not discriminated against as a result of pregnancy.
6 Women in the Judiciary (GI) Extent to which at least a third of the members of the highest branch of the judiciary are women.
7 Laws on Violence against Women (OECD)
Existence of women's legal protection from rape, assault and sexual harassment.

90
Sustainable Economic Opportunity
Public Management
1 Statistical Capacity (WB) Capacity of national statistical systems in terms of methodology, data sources, periodicity and timeliness.
2 Public Administration (AfDB/WB)
Effectiveness of the civilian central government in designing and implementing policy, delivering public services and managing human resources. It consists of two sub-indicators.
3 Diversification (AfDB/OECD/UNDP)
Extent to which exports are diversified.
4 Budget Management (AfDB/WB)
Extent to which there is a comprehensive and credible budget linked to policy priorities, effective financial management and fiscal reporting. It consists of two sub-indicators.
5 Ratio of Revenue to Expenditure (AfDB/AUC/UNECA)
Total budget revenue as a proportion of total budget expenditure.
6 Fiscal Policy (AfDB/WB) Quality and sustainability of fiscal policy. It consists of two sub-indicators.
7 Revenue Mobilisation (ICTD/AfDB/WB)
Overall pattern of domestic resource mobilisation. It consists of two sub-indicators.
8 Transparency of State-owned Companies (GI)
Extent to which the financial records of state-owned companies are available online or offline to journalists, auditors and citizens in a timely and cost-efficient manner.
Business Environment
1 Investment Climate (HER) Degree of economic freedom based on constraints on the flow of investment capital.
2 Competition (BS/GI/AfDB/WB)
Business regulatory environment; the level of market-based competition; and the quality of the competitive bidding process. It consists of three sub-indicators.
3 Bureaucracy & Red Tape (EIU) Extent of red tape, including bureaucratic delay and complexity in obtaining the appropriate documentation or authorisation to engage in business activities.
4 Customs Procedures (WEF) Level of efficiency of customs procedures relating to the entry and exit of merchandise.
5 Soundness of Banks (WEF) Soundness of banks, ranging from the requirement of recapitalisation to being generally healthy with sound balance sheets.
6 Employment Creation (AFR) Extent to which the public are satisfied with how the government is handling creating jobs.
Infrastructure
1 Transport Infrastructure (WEF/AFR/EIU/GI)
Extent to which the public are satisfied with government maintenance of roads and bridges, the adequacy of the rail network for business needs; and quality of air transport and aviation safety. It consists of four sub-indicators.
2 Electricity Infrastructure (WEF/AFR)
Quality of the electricity supply and level of public satisfaction with the provision of a reliable electricity supply by the government. It consists of two sub-indicators.
3 Digital & IT Infrastructure (EIU/ITU)
Extent to which IT infrastructure is adequate for business needs; subscriptions to a mobile telephone service; households with a computer; and household access to Internet. It consists of four sub-indicators.
4 Access to Water (WHO/UNICEF)
Population with access to piped drinking water, and population with access to an improved drinking water source. It consists of two sub-indicators.
5 Water & Sanitation Services (AFR)
Extent to which the public are satisfied with government provision of water and sanitation services.
Rural Sector
1 Rural Business Climate (IFAD) Extent to which the policy and institutional framework supports the development of private rural businesses and commercially-based agricultural and rural finance markets. It consists of three sub-indicators.
2 Rural Development Resources (IFAD)
Government policies, strategies and investment programmes for the agricultural and rural development sector, and the efficiency, consistency and transparency with which resources are allocated, managed and accounted for.
Indicators: Definitions & Sources
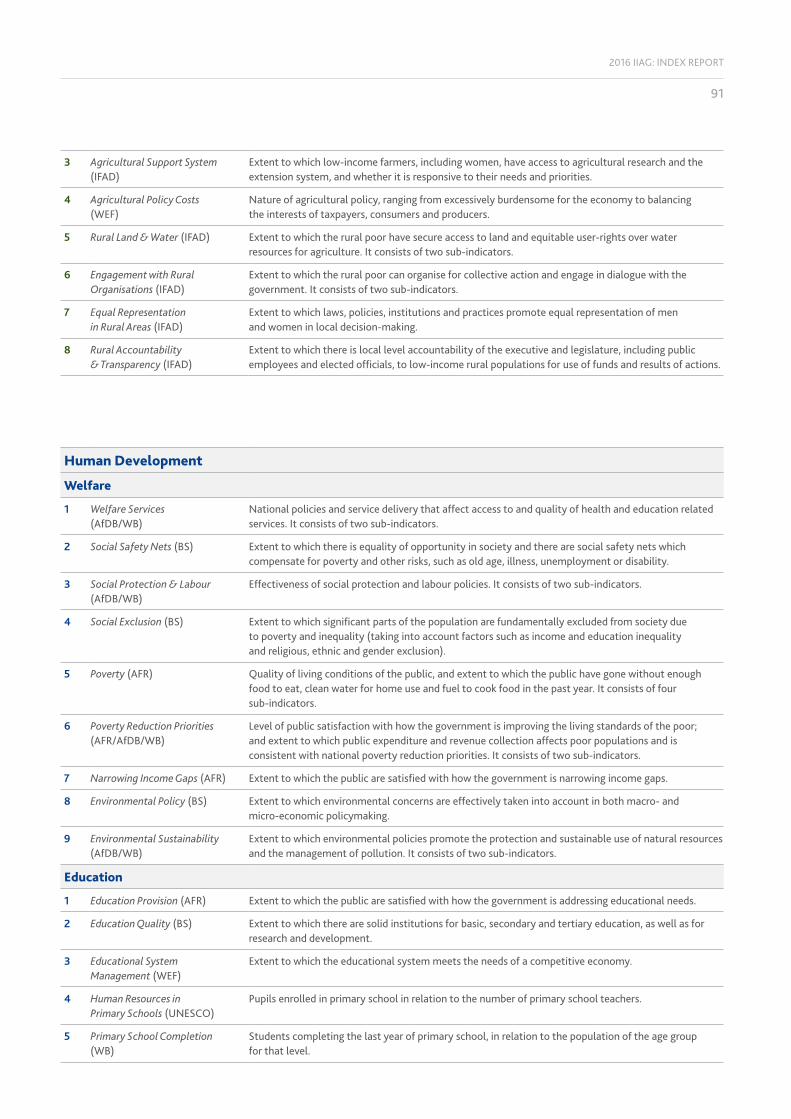
2016 IIAG: INDEX REPORT
91
3 Agricultural Support System (IFAD)
Extent to which low-income farmers, including women, have access to agricultural research and the extension system, and whether it is responsive to their needs and priorities.
4 Agricultural Policy Costs (WEF)
Nature of agricultural policy, ranging from excessively burdensome for the economy to balancing the interests of taxpayers, consumers and producers.
5 Rural Land & Water (IFAD) Extent to which the rural poor have secure access to land and equitable user-rights over water resources for agriculture. It consists of two sub-indicators.
6 Engagement with Rural Organisations (IFAD)
Extent to which the rural poor can organise for collective action and engage in dialogue with the government. It consists of two sub-indicators.
7 Equal Representation in Rural Areas (IFAD)
Extent to which laws, policies, institutions and practices promote equal representation of men and women in local decision-making.
8 Rural Accountability & Transparency (IFAD)
Extent to which there is local level accountability of the executive and legislature, including public employees and elected officials, to low-income rural populations for use of funds and results of actions.
Human Development
Welfare
1 Welfare Services (AfDB/WB)
National policies and service delivery that affect access to and quality of health and education related services. It consists of two sub-indicators.
2 Social Safety Nets (BS) Extent to which there is equality of opportunity in society and there are social safety nets which compensate for poverty and other risks, such as old age, illness, unemployment or disability.
3 Social Protection & Labour (AfDB/WB)
Effectiveness of social protection and labour policies. It consists of two sub-indicators.
4 Social Exclusion (BS) Extent to which significant parts of the population are fundamentally excluded from society due to poverty and inequality (taking into account factors such as income and education inequality and religious, ethnic and gender exclusion).
5 Poverty (AFR) Quality of living conditions of the public, and extent to which the public have gone without enough food to eat, clean water for home use and fuel to cook food in the past year. It consists of four sub-indicators.
6 Poverty Reduction Priorities (AFR/AfDB/WB)
Level of public satisfaction with how the government is improving the living standards of the poor; and extent to which public expenditure and revenue collection affects poor populations and is consistent with national poverty reduction priorities. It consists of two sub-indicators.
7 Narrowing Income Gaps (AFR) Extent to which the public are satisfied with how the government is narrowing income gaps.
8 Environmental Policy (BS) Extent to which environmental concerns are effectively taken into account in both macro- and micro-economic policymaking.
9 Environmental Sustainability (AfDB/WB)
Extent to which environmental policies promote the protection and sustainable use of natural resources and the management of pollution. It consists of two sub-indicators.
Education
1 Education Provision (AFR) Extent to which the public are satisfied with how the government is addressing educational needs.
2 Education Quality (BS) Extent to which there are solid institutions for basic, secondary and tertiary education, as well as for research and development.
3 Educational System Management (WEF)
Extent to which the educational system meets the needs of a competitive economy.
4 Human Resources in Primary Schools (UNESCO)
Pupils enrolled in primary school in relation to the number of primary school teachers.
5 Primary School Completion (WB)
Students completing the last year of primary school, in relation to the population of the age group for that level.
92
6 Secondary School Enrolment (UNESCO)
Enrolment in secondary education, regardless of age, in relation to the population of the age group for that level.
7 Tertiary Education Enrolment (UNESCO)
Enrolment in tertiary education, regardless of age, in relation to the population of the age group for that level.
8 Literacy (UNESCO) Population aged 15 or over who can both read and write a short simple statement on their everyday life.
Health
1 Basic Health Services (AFR) Extent to which the public are satisfied with how the government is improving basic health services.
2 Public Health Campaigns (GI) Extent to which all citizens can find information and guidelines on common illnesses, and public health hazards such as epidemics trigger awareness campaigns.
3 Child Mortality (IGME) Probability of a child dying between birth and five years of age, if subject to current age-specific mortality rates.
4 Maternal Mortality (MMEIG) Female deaths from any cause related to, or aggravated by, pregnancy or its management (excluding accidental or incidental causes).
5 Access to Sanitation (WHO/UNICEF)
Population with access to an improved sanitation facility, and the population served with open defecation sanitation. It consists of two sub-indicators.
6 Undernourishment (WB) Population whose food intake is insufficient to meet dietary energy requirements continuously.
7 Disease (WHO) Prevalence of deaths from malaria and tuberculosis. It consists of two sub-indicators.
8 Immunisation (WB/WHO) Children that have received vaccinations against measles, DPT and hepatitis B. It consists of three sub-indicators.
9 Antiretroviral Treatment (ART) Provision (UNAIDS)
Eligible adults and children receiving antiretroviral treatment therapy, and HIV-positive pregnant women who receive antiretrovirals to prevent mother-to-child transmission. It consists of two sub-indicators.
Indicators: Definitions & Sources


ANNEX
Methodology
Research Team & Advisory Council
Notes
Board of Directors

96
Methodology
This section contains an overview of the framework and construction of the Ibrahim Index of African Governance (IIAG). For more information please see a more detailed technical methodology via our website at mo.ibrahim.foundation/iiag/downloads/ or contact the IIAG Research Team at [email protected].
The Ibrahim Index of African Governance (IIAG) measures the quality of governance in every African country on an annual basis. It does this by compiling data from diverse sources to build an accurate and detailed picture of governance performance in every African country.
The broad aim of the IIAG is to better inform and sustain the debate on African governance by providing a transparent and user-friendly resource to:
• support citizens, governments, institutions and the private sector to accurately assess the delivery of public goods and services and policy outcomes.
• encourage data-driven narratives on governance issues.
• help determine, debate and strengthen government performance.
The IIAG was launched in 2007 and has evolved to be the most comprehensive assessment on African governance. The 2016 IIAG is the tenth iteration and builds on the work of the previous nine years. The IIAG is conceptually driven by the Mo Ibrahim Foundation (MIF) Board and the IIAG Advisory Council and is refined on an annual basis, offering a continually improving assessment of governance in Africa.
This annual refinement means that the IIAG data set is updated when practical improvements are identified. When new historical data are made available, or the structure of the IIAG is strengthened, the entire data set is updated back to 2000. Users of the Index should therefore always reference the most recent version of the IIAG data set.
Measuring Governance
MIF defines governance as the provision of the political, social and economic public goods and services that every citizen has the right to expect from their state, and that a state has the responsibility to deliver to its citizens. The IIAG focuses on outputs and outcomes of policy, rather than declarations of intent, de jure statutes and levels of expenditure.
The governance framework has four overarching categories: Safety & Rule of Law, Participation & Human Rights, Sustainable Economic Opportunity and Human Development. These categories are made up of a total of 14 sub-categories.
These four overarching dimensions and the constituent sub-categories provide a citizen-centric governance framework around which to organise underlying data and construct the IIAG.
The 14 sub-categories are populated with a number of indicators which measure a narrow governance concept. Each of these indicators captures an aspect of the sub-category topic.
This framework allows the user to analyse governance performance within both distinctive and broad governance concepts by different results tiers – at the Overall Governance level, category and sub-category level, and indicator level.
HOW WE CONSTRUCT THE INDEX
1. INTRODUCTION
2. FRAMEWORK OF THE IIAG

2016 IIAG: INDEX REPORT
97
3.1 Criteria for Data Inclusion
As governance is not measurable directly it is necessary to determine the most suitable set of proxy indicators. The IIAG takes into account potentially diverse viewpoints by making use of a variety of data sources and indicators.
The Foundation does not collect primary data, but rather collates data provided by respected external sources. The 2016 IIAG consists of 95 indicators from 34 data providers. A distinctive characteristic of the IIAG is that it is based on the aggregation of multiple types of data, utilising Official Data (OD), Qualitative Assessments (QA), Opinion Surveys (OS) and Public Attitude Surveys (PAS).
In order to be included in the IIAG, a measure has to be a suitable governance proxy. The data are required to cover at least 33 of the 54 countries on the continent and provide at least two years’ worth of data for these countries since 2000. Further, the most recent data for these 33 countries can be no more than three years old.
When a measure meets these criteria for inclusion it is assigned to the sub-category in which it sits best conceptually. Assigning an indicator to one of the 14 sub-categories is not straightforward as the dimensions of governance are not independent.
3. CONSTRUCTION OF THE IIAG
Categories
Sub-
cate
gorie
s
OVERALLGOVERNANCE
SAFETY & RULE OF LAW
PARTICIPATION & HUMAN RIGHTS
SUSTAINABLE ECONOMIC OPPORTUNITY
HUMANDEVELOPMENT
Rule
of L
aw
Acc
ount
abili
ty
Pers
onal
Saf
ety
Nat
iona
l Sec
urit
y
Publ
ic M
anag
emen
t
Busi
ness
Env
ironm
ent
Infr
astr
uctu
re
Rura
l Sec
tor
Wel
fare
Educ
atio
n
Hea
lth
Part
icip
atio
n
Righ
ts
Gen
der

98
Methodology
Clustered Indicators
Indicators measuring a specific governance concept are sometimes available from multiple sources. For example, data measuring political violence are available from two different data providers: Armed Conflict Location & Event Data Project and Political Terror Scale. To improve the accuracy of the indicator measurement and avoid double counting, these measures are combined into a single clustered indicator, which is the average of its underlying sub-indicators.
Further, some indicators measure a governance concept which is too narrow for inclusion as a stand-alone indicator. For example, the measures IT Infrastructure from the Economist Intelligence Unit, Mobile Phone Subscribers, Household Computers and Household Internet Access, all taken from the International Telecommunications Union, are clustered together to become sub-indicators of the indicator Digital & IT Infrastructure.
The same inclusion criteria are applied to sub-indicators and stand-alone indicators.
Political Violence. . . . . . . . . . . . . . . . . . . . . . . . Government Violence against Civilians ACLEDPolitical Violence PTS
Clustered indicator
Sub-indicators
Institution acronyms
Clustered indicator
Sub-indicators Institution acronyms
Digital Connectivity. . . . . . . . . . . . . . . . . . . . . . . . . . . .Mobile Phone Subscribers ITUHousehold Computers ITUInternet Subscribers ITU
3.2 Handling Missing Data
Most indicators included in the IIAG have missing data points over the time series. As this can have an effect on a country’s aggregate scores, estimates are provided for missing data, following a statistical process called imputation. According to this process, if data is missing outside the time series, it is replaced by an existing data point. When data is missing inside the time series, these are replaced with numbers incrementally higher or lower than the neighbouring data points.
Country A Year 1 Year 2 Year 3 Year 4 Year 5 Year 6
Raw data from source 85.1 84.8 82.8
Between data points 85.1 84.8 84.1 83.5 82.8
Outside data points 85.1 85.1 84.8 84.1 83.5 82.8

2016 IIAG: INDEX REPORT
99
3.3 Normalisation
Given that the data utilised in the construction of the IIAG come from 34 separate data providers that present their data on different scales, it is necessary to standardise all data. This is done through a statistical process called normalisation whereby raw data for each indicator are transformed by the min-max normalisation method. This process allows all scores to be published in common units and within the same bounds of 0-100, where 100 is always the best possible score.
The application of this normalisation method means that a score of 100 relates to the best possible score within the group of 54 African countries between 2000 and the latest data year.
3.4 Data Aggregation
The IIAG uses a transparent, simple and replicable method of data aggregation. A simple average is calculated using the structure of the Index to arrive at the Overall Governance scores.
The Foundation publishes standard errors and confidence intervals alongside the composite IIAG and category scores to reflect degrees of uncertainty, which are available on the Foundation’s website.
The standard errors and confidence intervals allow users of the IIAG to discriminate, to a certain degree, between changes in the values of the IIAG that can be confidently treated as actual changes in the state of governance and changes that might be due to noise, or are at least insufficiently sizeable to be able to ascribe a high likelihood to such change being significant. This allows users of the IIAG to make more sophisticated use of the governance information provided by the IIAG.
4. ANALYSIS OF THE INDEX: MEASUREMENT ERRORS & UNCERTAINTY
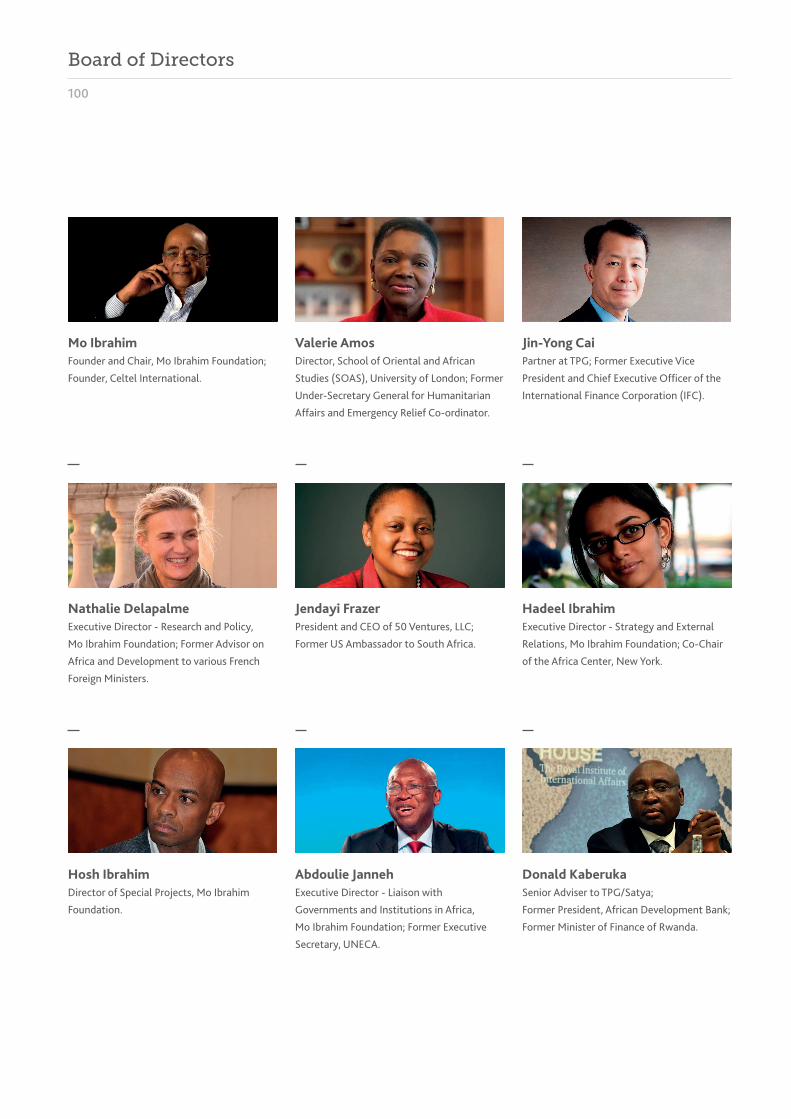
100
Board of Directors
Nathalie Delapalme Executive Director - Research and Policy, Mo Ibrahim Foundation; Former Advisor on Africa and Development to various French Foreign Ministers.
Abdoulie Janneh Executive Director - Liaison with Governments and Institutions in Africa, Mo Ibrahim Foundation; Former Executive Secretary, UNECA.
Hosh Ibrahim Director of Special Projects, Mo Ibrahim Foundation.
Jendayi Frazer President and CEO of 50 Ventures, LLC; Former US Ambassador to South Africa.
Jin-Yong Cai Partner at TPG; Former Executive Vice President and Chief Executive Officer of the International Finance Corporation (IFC).
Mo Ibrahim Founder and Chair, Mo Ibrahim Foundation; Founder, Celtel International.
Donald Kaberuka Senior Adviser to TPG/Satya; Former President, African Development Bank; Former Minister of Finance of Rwanda.
Valerie Amos Director, School of Oriental and African Studies (SOAS), University of London; Former Under-Secretary General for Humanitarian Affairs and Emergency Relief Co-ordinator.
Hadeel Ibrahim Executive Director - Strategy and External Relations, Mo Ibrahim Foundation; Co-Chair of the Africa Center, New York.
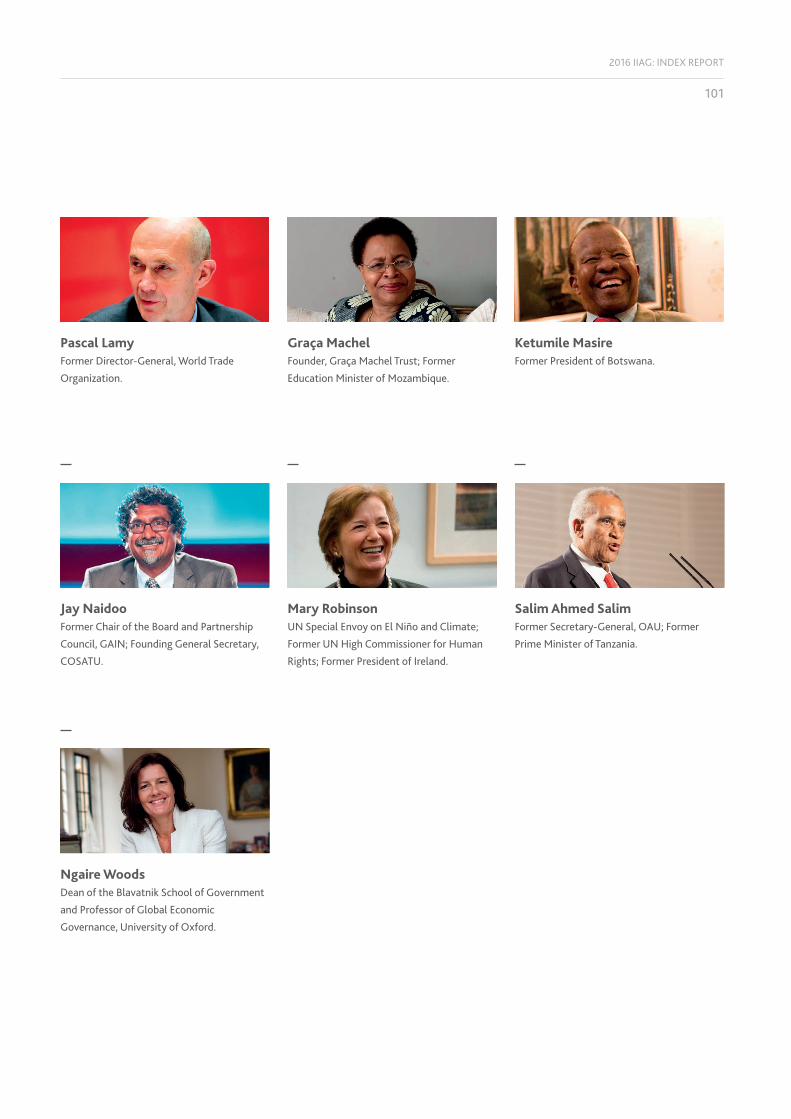
2016 IIAG: INDEX REPORT
101
Mary Robinson UN Special Envoy on El Niño and Climate; Former UN High Commissioner for Human Rights; Former President of Ireland.
Salim Ahmed Salim Former Secretary-General, OAU; Former Prime Minister of Tanzania.
Ngaire Woods Dean of the Blavatnik School of Government and Professor of Global Economic Governance, University of Oxford.
Ketumile Masire Former President of Botswana.
Jay Naidoo Former Chair of the Board and Partnership Council, GAIN; Founding General Secretary, COSATU.
Pascal Lamy Former Director-General, World Trade Organization.
Graça Machel Founder, Graça Machel Trust; Former Education Minister of Mozambique.

102
Research Team & Advisory Council
Advisory Council
Name Organisation
Dr Abdalla Hamdok (Chair) United Nations Economic Commission for Africa (UNECA)
Abdulaziz Al Yaqout Meysan Partners
Dr Maurice Enguéléguélé Africa Governance Institute (AGI)
Hazel Feigenblatt Global Initiative for Fiscal Transparency (GIFT)
Dr E. Gyimah-Boadi* Ghana Centre for Democratic Development (CDD-Ghana)
Dr Ali Hadi The American University in Cairo (AUC)
Dr Daniel Kaufmann Natural Resource Governance Institute (NRGI)
'Jide Olanrewaju TPG Growth
Dr Joy Phumaphi African Leaders Malaria Alliance (ALMA)
Dr Vera Songwe International Finance Corporation (IFC)
Dr Piero Stanig Bocconi University
Dr Daniel Zovatto International Institute for Democracy and Electoral Assistance (IDEA)
Research Team
Foundation Design Team
IIAG Project Team
Name Title
Nathalie Delapalme Executive Director - Research and Policy
Elizabeth McGrath Director of the IIAG (until 31 July 2016)
Ayat Abdelaziz Research Intern
Chloé Bailey Programme Officer
Sif Heide-Ottosen Analyst
Richard Murray Acting Head of Research
Christina Nelson Senior Programme Manager
Zainab Umar Operations Officer
Yannick Vuylsteke Programme Manager
Name Title
Styliani Orkopoulou Junior Graphic Designer
Maria Tsirodimitri Graphic Designer
*Observer
The Foundation would like to extend a special thank you to Elizabeth McGrath, former Director of the Ibrahim Index of African Governance, for her contribution not only to the 2016 IIAG but for leading the team from January 2012 until July 2016.

2016 IIAG: INDEX REPORT
103
Notes
The 2016 IIAG covers a 16-year data period from 2000 to 2015. The full IIAG data set, including underlying raw data and normalised scores, as calculated for the express purposes of the Index, is available online at: http://mo.ibrahim.foundation/iiag/downloads/.
All figures on IIAG outputs are displayed to one decimal place. The calculation method to arrive at these scores is as follows:
• Country scores are calculated on full-precision raw data values (using the exact values as they are collected from source). All scores are then rounded to one decimal place.
• Group averages are calculated on the rounded, one decimal place country scores.
• Both trends over time and ranks are calculated on the scores to one decimal place.
Forty-one indicators were formed by clustering together a number of underlying sub-indicators which each measure the same dimension or similar concept. For each indicator the sub-indicators may come from the same or multiple sources. The value of a clustered indicator is the average of the underlying sub-indicators.
Analysis of trends over time (improvements and deteriorations) take into consideration a ten-year period: 2006-2015 (unless otherwise stated). References to the last ten years or the last decade refer to this time period.
The 2016 IIAG does not include data for South Sudan prior to secession in 2011. Due to the lack of data, ten-year trends have not been calculated for this country. The absence of South Sudan scores prior to 2011 means that 53 countries are ranked in 2000 to 2010 inclusive and 54 countries are ranked in 2011 to 2015 inclusive. This should be taken into account when looking at rank change over time. Similarly, averages calculated for groups which include South Sudan exclude the country in pre-secession years.
Data for Sudan prior to 2011 (Former Sudan) have been used in the 2016 IIAG. Despite Sudan being a new country post-secession of South Sudan, pre-2011 data for ‘Former Sudan’ are deemed a suitable proxy for governance in Sudan.
Somalia has no underlying raw data for all indicators in the Rural Sector sub-category (2000-2015). In this instance South Sudan does not receive a score or rank. For this instance and the years where South Sudan does not receive a rank and score (2000-2010) this is indicated by “.”.
Where reference is made to population statistics, these were obtained from the United Nations, Department of Economic and Social Affairs, Population Division (2015): World Population Prospects: The 2015 Revision. Data were downloaded on 11 July 2016. Where reference is made to Gross Domestic Product (GDP) statistics, these were obtained from the World Economic Outlook Database. Data were downloaded on 08 August 2016. For both these, data for South Sudan are included in totals or percentages post-2011.
The Mo Ibrahim Foundation (MIF) is aware that some sources update their data sets after our documentation is sent to print. IIAG raw data are correct as per the data “last accessed”, which is stated for each indicator within the Data Portal (downloadable via our website).
Join the discussion on Twitter, Facebook or Instagram:
@Mo_IbrahimFdn #IIAG /MoIbrahimFoundationmoibrahimfoundation

2016 Ibrahim Index of African Governance
A Decade of African Governance 2006-2015
Published October 2016
Copyright © Mo Ibrahim Foundation
The Mo Ibrahim Foundation (MIF) is committed to making data on the
quality of governance in Africa freely available and accessible to all citizens
of the continent and interested stakeholders. We welcome and encourage
any accurate reproduction, translation and dissemination of this material.
The material must be attributed to the Mo Ibrahim Foundation, but not in
any way that suggests that MIF endorses you or your use of the material.
To request additional copies of this or other publications, to provide
feedback or to discuss use of the Ibrahim Index of African Governance
(IIAG) please email [email protected].
For a list of any errors or omissions found subsequent to printing, please
visit mo.ibrahim.foundation/iiag.


Eleven countries, covering over a quarter (27%) of the continent’s population, have declined across all three civil society measures – Civil Society Participation, Freedom of Expression and Freedom of Association & Assembly – over the decade.
In 2015 more than two-thirds of African citizens (70%) live in countries where Sustainable Economic Opportunity has improved in the last ten years.
Digital & IT Infrastructure is the most improved indicator (out of 95) of the IIAG over the decade.
Diversification is the lowest scoring indicator in the IIAG, and shows deterioration over the past ten years.
40% of Africans live in a country which has registered deterioration in Electricity Infrastructure over the decade, with over half of Africa’s economy affected by this issue.
The marginal deterioration of -0.8 points over the decade registered in Business Environment masks considerably diverging trends, with 24 countries declining, five by more than -10.0 points, and 28 countries progressing, five by more than +10.0 points.
Niger, Rwanda, Côte d’Ivoire, Togo and Kenya have progressed by more than +10.0 points in Business Environment over the decade.
Forty-three countries, hosting more than four-fifths (87%) of the African population, have registered improvement in Human Development over the decade.
Rwanda, Ethiopia, Angola, and Togo have increased by more than +10.0 points in Human Development over the decade.
All 54 countries have registered progress in Child Mortality over the decade.
Over the last ten years, the Poverty indicator has registered improvement (+7.2 points), with 29 countries, accounting for 67% of Africa’s population and 76% of Africa’s GDP, improving.
However, the Poverty Reduction Priorities indicator has registered an average decline of -1.3 points, with 23 countries, hosting 45% of Africa’s population, declining.

MO IBRAHIM FOUNDATION
mo.ibrahim.foundation
@Mo_IbrahimFdn
/MoIbrahimFoundation
moibrahimfoundation