Embed Size (px)
Citation preview

ARTICLE
What factors determine cyclic amplitude in the snowshoe hare(Lepus americanus) cycle?Charles J. Krebs, John Bryant, Knut Kielland, Mark O’Donoghue, Frank Doyle, Suzanne Carriere,Donna DiFolco, Nathan Berg, Rudy Boonstra, Stan Boutin, Alice J. Kenney, Donald G. Reid,Karin Bodony, Judy Putera, Henry K. Timm, Toby Burke, Julie A.K. Maier, and Howard Golden
Abstract: Snowshoe hares (Lepus americanus Erxleben, 1777) fluctuate in 9–10 year cycles throughout much of their NorthAmerican range. These cycles show large variations in cyclic amplitude and we ask what factors could cause amplitudevariation. We gathered data from 1976 to 2012 on hare numbers in the boreal forest of Alaska, Yukon, Northwest Territories,and northern British Columbia to describe the amplitude of hare fluctuations and to evaluate four possible causes. First,weather could cause variation in amplitude via hare reproduction or survival, but this mechanism does not fit our data.Second, bottom-up processes involving forest succession could explain amplitude variation through changes in winterforage availability, but succession is too slow a variable in our study areas. Third, plant defenses entrained by hareover-browsing in one cycle can produce variation in plant quality and quantity in subsequent cycles. A mathematical modelsuggests this is a possible explanation. Fourth, predator recovery following the cyclic low is inversely related to hare cyclicamplitude, and the existing data are consistent with this mechanism. A standardized regional monitoring program isneeded to improve our understanding of cyclic amplitude variation in hares and the possible role of predators and winterfoods in affecting amplitude.
Key words: snowshoe hare, Lepus americanus, 10 year cycle, boreal forest, predation, Canada lynx, Lynx canadensis, succession,secondary chemicals, weather.
Résumé : L’abondance des lièvres d’Amérique (Lepus americanus Erxleben, 1777) fluctue selon des cycles de 9–10 ans dans unebonne partie de l’aire de répartition nord-américaine de l’espèce. Ces cycles présentent de grandes variations d’amplitude,et nous nous penchons sur les facteurs qui pourraient causer ces variations. Nous avons recueilli des données de 1976 a 2012sur le nombre de lièvres dans la forêt boréale de l’Alaska, du Yukon, des Territoires-du-Nord-Ouest et du nord de laColombie-Britannique afin de décrire l’amplitude des fluctuations des lièvres et d’évaluer quatre causes possibles. Pre-mièrement, si la météo peut causer des variations d’amplitude en agissant sur la reproduction ou la survie des lièvres, cemécanisme ne concorde pas avec les données. Deuxièmement, des processus ascendants associés a la succession forestièrepourraient expliquer les variations d’amplitude par des variations de la disponibilité de nourriture durant l’hiver, mais lasuccession est une variable qui évolue trop lentement dans les zones étudiées. Troisièmement, les mécanismes de défensedes plantes induits par le surbroutement des lièvres durant un cycle peuvent produire des variations de la qualité et de laquantité des plantes durant les cycles subséquents. Un modèle mathématique suggère qu’il s’agit d’une explicationpossible. Quatrièmement, le rétablissement de prédateurs suivant le creux d’un cycle est inversement relié a l’amplitudedu cycle des lièvres, et les données concordent avec ce mécanisme. Un programme de surveillance régionale normalisé estnécessaire pour améliorer la compréhension des variations de l’amplitude des cycles des lièvres et de l’effet éventuel desprédateurs et de la nourriture hivernale sur cette amplitude. [Traduit par la Rédaction]
Mots-clés : lièvre d’Amérique, Lepus americanus, cycle décennal, forêt boréale, prédation, lynx du Canada, Lynx canadensis, succession,substances chimiques secondaires, météo.
Received 9 June 2014. Accepted 29 October 2014.
C.J. Krebs and A.J. Kenney. Department of Zoology, The University of British Columbia, 6270 University Boulevard, Vancouver, BC V6T 1Z4, Canada.J. Bryant and K. Kielland. Department of Biology and Wildlife, Institute of Arctic Biology, University of Alaska, Fairbanks, AK 99775, USA.M. O’Donoghue. Yukon Fish and Wildlife Branch, Box 310, Mayo, YT Y0B 1M0, Canada.F. Doyle. Wildlife Dynamics Consulting, Box 3596, Smithers, BC V0J 2N0, Canada.S. Carriere. Environment and Natural Resources, Government of Northwest Territories, Box 1320, Yellowknife, NWT X1A 2L9, Canada.D. DiFolco. US National Park Service, Gates of the Arctic National Park, 4175 Geist Road, Fairbanks, AK 99709, USA.N. Berg and H.K. Timm. US Fish and Wildlife Service, Tetlin National Wildlife Refuge, Tok, AK 99780, USA.R. Boonstra. Department of Biological Sciences, University of Toronto Scarborough, 1265 Military Trail, Toronto, ON M1C 1A4, Canada.S. Boutin. Department of Biological Sciences, University of Alberta, Edmonton, AB T6G 2E9, Canada.D.G. Reid. Wildlife Conservation Society Canada, P.O. Box 31127, Whitehorse, YT Y1A 5P7, Canada.K. Bodony. US Fish and Wildlife Service, Koyukuk/Nowitna National Wildlife Refuge, P.O. Box 287, Galena, AK 99741, USA.J. Putera. US National Park Service, Wrangell–St. Elias National Park and Preserve, P.O. Box 439, Copper Center, AK 99573, USA.T. Burke. US Fish and Wildlife Service, Kenai National Wildlife Refuge, P.O. Box 2139, Soldotna, AK 99669, USA.J.A.K. Maier. Institute of Arctic Biology, University of Alaska, Fairbanks, AK 99775, USA.H. Golden. Alaska Department of Fish and Game, Division of Wildlife Conservation, 333 Raspberry Road, Anchorage, AK 99518, USA.Corresponding author: Charles Krebs (e-mail: [email protected]).
1039
Can. J. Zool. 92: 1039–1048 (2014) dx.doi.org/10.1139/cjz-2014-0159 Published at www.nrcresearchpress.com/cjz on 29 October 2014.
Can
. J. Z
ool.
Dow
nloa
ded
from
ww
w.n
rcre
sear
chpr
ess.
com
by
Uni
vers
ity o
f B
ritis
h C
olum
bia
on 1
1/17
/14
For
pers
onal
use
onl
y.

IntroductionSnowshoe hares are a classic textbook example of animals with
relatively regular population cycles (Elton and Nicholson 1942;Krebs 2009, p. 203). Three key questions arise from these cycles:first, what causes the changes in population growth rates; second,what causes regional synchrony; third, what produces variationsin amplitude of cyclic peaks? In the past much interest has fo-cused on the causes of hare population fluctuations, and bothpredation and food supplies have been manipulated to delimit thecausal nexus (Keith 1990; Krebs et al. 1995; Boonstra et al. 1998;Sheriff et al. 2010). Regional synchrony and asynchrony have beenaddressed less, and both regional weather and predator move-ments have been suggested as the cause of synchronized dynam-ics (Ranta et al. 2006; Krebs et al. 2013). The question of whatfactors cause variation in cyclic amplitude has not been addresseddirectly, and the implicit assumption has been that the answerlies either in plant–herbivore interactions, in predator recoveryrates from the cyclic low, or both (Blasius et al. 1999).
Much of the discussions of amplitude variations in hare cycleshave centered on the fur return data of Canada lynx (Lynx canadensisKerr, 1792), a specialist snowshoe hare predator (Ranta et al. 1997;Haydon and Greenwood 2000). Moran (1953) pointed out veryearly that the period between lynx cyclic peaks was remarkablyconstant, but the amplitude varied greatly. Analyses of fur returndata have led to the development of a series of lynx dynamicsmodels including chaotic food-web models that describe how syn-chrony can be maintained in coupled populations along withlarge variations in cyclic amplitude (Schaffer 1984; Blasius et al.1999). The ecological mechanisms driving the amplitude varia-tions in these models are not clear.
Limited long-term monitoring of snowshoe hares has been con-ducted at various locations throughout the north, but these datahave never been collectively analysed to explore the variability ofcyclic amplitudes and how they differ locally and regionally. Usingdata on snowshoe hare abundance from Alaska, Yukon, NorthwestTerritories, and British Columbia covering the period 1976–2012, wetest four hypotheses that attempt to explain the variation in the harecycle’s amplitude.
We begin with three assumptions about snowshoe hare popu-lation cycles. First, we assume that a major factor affecting popu-lation increase and decline is predation by a suite of predators,typically Canada lynx, coyotes (Canis latrans Say, 1823), red foxes(Vulpes vulpes (L., 1758)), Northern Goshawks (Accipiter gentilis(L., 1758)), and Great-horned Owls (Bubo virginianus (Gmelin, 1788))(O’Donoghue et al. 1997, 1998). Second, we assume that weatherhas some modifying effect on hare cycles, possibly by affectingearly summer survival of juveniles (Kielland et al. 2010). Third, weassume that hares, like all herbivores, are strongly affected by theavailability and quality of their forage plants, and that browsingmay have delayed effects on vegetation condition. All hypothesesassume that sufficient quantities of good-quality food are neces-sary for the hares to increase in abundance.
Given these assumptions, we consider four hypotheses thatcould cause variations in hare cyclic amplitude:
1. Weather hypothesis: variations in weather, particularly Maytemperature and precipitation, affect juvenile hare mortalityor reproduction directly and thus cause amplitude variationsto be positively correlated spatially and temporally. This hy-pothesis predicts that nearby sites with the same weather willshow the same amplitude sequence over time.
2. Forest succession hypothesis: the abundance of good winterfood that occurs in the early to mid-stages of forest successionreleases hares from food limitation allowing their numbers toincrease. During forest succession, good winter food is re-placed by poor winter food resulting in increasing food limi-tation that causes the cycle’s amplitude to decline as forestsuccession proceeds.
3. Plant defense hypothesis: severe browsing by hares in the win-ter of a high amplitude peak increases the toxicity of hares’preferred winter food resulting in the next hare cycle of re-duced amplitude because of higher plant chemical defensecompounds.
4. Predator hypothesis: the abundance of predators during thecyclic low determines the time lag before predation mortalityexceeds hare reproductive rates, and thus the cyclic peak den-sity. This hypothesis predicts that a low amplitude cycle willbe preceded by relatively high predator abundance in the pre-vious low phase so that cyclic amplitude is negatively corre-lated with the minimum of predator abundance.
Figures 1a–1c gives a schematic illustration of the patterns ex-pected from hypotheses 2, 3, and 4. Hypothesis 1 is not illustratedbut would be expected to create a series of cycles of varying am-plitudes that correlate with local weather conditions. More com-plex models involving two or all of these mechanisms could bepostulated, but it seems difficult enough at present to evaluate thefour simple models. Our analysis is based upon estimated hareabundance, amplitudes of hare cycles, and lynx population trends, aswell as a mathematical model of plant defense, to demonstratethe possibility of hypothesis 3.
The limitations of the questions we are asking and the data wehave available should be kept very clear in the evaluation thatfollows. We are asking about the amplitude of the hare cycle atthe local scale within a study area (our measurement units) andthe variation in amplitude over short periods of time of the orderof two to four hare cycles within that study area. We cannotaddress here global issues of landscape ecology because we do nothave data on a landscape scale, nor can we address the very long-term changes that might be associated with climate change overhundreds of years.
Materials and methodsWe have relied on three methods to estimate the abundance of
hare populations. The most accurate method is mark–recaptureestimation with at least two samples per year (Kluane Lake, Yukon,and Bonanza Creek, Alaska). The details of these mark–recapturemethods are provided by Krebs et al. (2001b) and Kielland et al.(2010). This method is at a small spatial scale and very labor inten-sive. The majority of our hare data come from annual counts ofhare pellets on fixed plots, following the standardized protocoldescribed in Krebs et al. (2001a). This method is relatively quickand can be done over a large spatial scale. Pellets are cleared offthese plots each year so the annual deposition of pellets is mea-sured. These pellet counts have been transformed to absolute haredensity by the use of the regression given for Kluane Lake in Krebset al. (2001a). There is a large assumption built into this conver-sion, i.e., that the regression obtained for Kluane Lake will applyelsewhere in the boreal forests of northwestern North America.Present evidence suggests that this assumption is correct for otherareas (Mills et al. 2005). Some limited data are based on road counts,which are the numbers of hares sighted along a standardizedlength of highway (Arthur and Prugh 2010) or the number of haresobserved per field day (McIntyre and Schmidt 2012). These data arereliable for estimating population peaks and troughs if the den-sity changes are sufficiently large and they have the advantage oflarge spatial scale. They produce data highly correlated with thoseobtained by pellet counts (Arthur and Prugh 2010).
We estimate the amplitude of the hare cycle in two ways. First,we estimate amplitude in the traditional manner as the ratio ofpeak density to low density. Cyclic peak density is the largestabundance estimate obtained and typically occurs in the autumnsampling. The cyclic low density is typically obtained in the springsampling period. One difficulty with this ratio measure is thatabundance in the low phase is difficult to estimate accurately. Weuse the ratio of the hare peak abundance to the abundance of
1040 Can. J. Zool. Vol. 92, 2014
Published by NRC Research Press
Can
. J. Z
ool.
Dow
nloa
ded
from
ww
w.n
rcre
sear
chpr
ess.
com
by
Uni
vers
ity o
f B
ritis
h C
olum
bia
on 1
1/17
/14
For
pers
onal
use
onl
y.

hares in the previous low as the first measure of amplitude. Asecond method is simply to use measures of peak abundance as anindex of amplitude. This index is reliable only if the density in thelow phase is nearly equal in all areas studied or in all cycles stud-ied on the same study area.
Lynx population numbers are available for the Kluane Lake site,and they were obtained from snow tracking data along a fixed25 km trail counted as often as possible within 1–2 days of freshsnowfall during the winter months (O’Donoghue et al. 2001). Forall other sites, we use an index of lynx abundance based on thenumber of lynx trapped per lynx trapper per winter. Because furtrapping is often prohibited or trappers choose not to trap inYukon and Alaska when lynx are in low abundance, we cannotmeasure the abundance of lynx at their lowest density via furreturns. Instead, we use an estimate of lynx population growthfrom a log-linear regression of fur returns over time for the3–5 years of the hare cycle increase. Lynx fur trapping indices mapdirectly to the hare cycle but are not an absolute measure of lynxdensities (McKelvey et al. 2000).
Statistical analyses of correlations, ANOVA, and simple linearregressions were carried out in NCSS version 8 (NCSS, LLC, Kaysville,Utah, USA; http://www.ncss.com/). All snowshoe hare abundanceestimates used here are given in the Supplementary material inKrebs et al. (2013).
Results
General observations of geographic variation in hare cycleamplitude
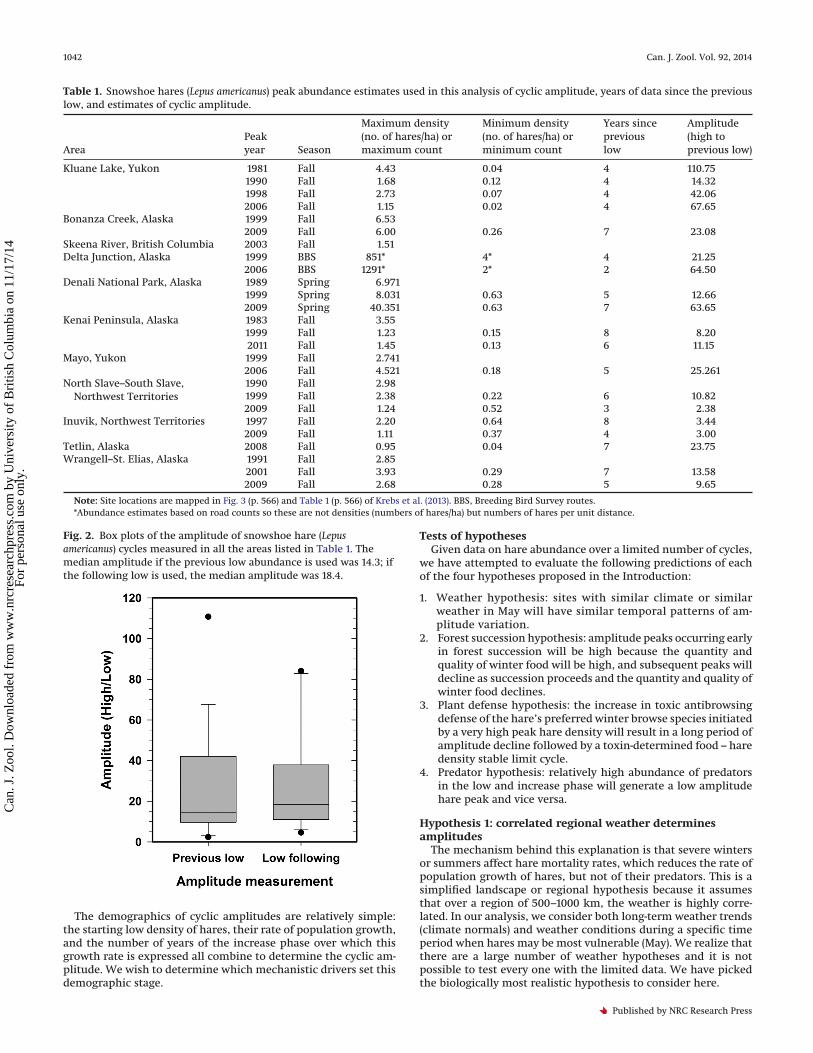
Peak densities of snowshoe hares vary from one cycle to thenext, and Table 1 summarizes this information for all our sites.Figure 2 illustrates box plots for the two possible measures ofcyclic amplitude (high/low) depending on whether the previous
low is used or the following low. There is no significant differencebetween these amplitude estimates with median values of 14 and18 (Mann–Whitney U test, p = 0.5, n = 19) and mean values of 28 and29. There are a low number of replicated estimates of amplitude.Seven areas have two to four estimates of amplitude (Kluane, DeltaJunction, Denali, Kenai, North Slave – South Slave, Inuvik, andWrangell–St. Elias). We could detect no differences in amplitudes(high/previous low) among these seven areas (ANOVA, F[6,10] = 0.74,p = 0.6). We conclude that over this geographic area, cyclic ampli-tudes (high/low) are about 20- to 30-fold, on average, with a rangefrom 2- to 3-fold up to about 100-fold but with most cycles showingan amplitude of 10- to 50-fold.
If cyclic amplitude is measured simply by the density of haresat the peak of the cycle, our data fall into two groups. BonanzaCreek in Alaska forms one group, with a mean peak density of6.3 hares/ha (n = 2 cycles), and all the seven other areas with morethan two estimates of peak density form a second group with amean peak density of 2.2 hares/ha. We note that this measure ofamplitude is poorly correlated with the other two more conven-tional measures that utilize peak/low abundance (r = 0.32, n = 15for both measures). We think, following McKelvey et al. (2000),that the intuitive idea that amplitude should be measured simplyby the cyclic peak abundance is less informative than the mea-surements of amplitude that use the ratio of cyclic peak to cycliclow hare abundance. The main reason for this is that the cycliclow density is highly variable so that not all cycles start from thesame baseline. The coefficient of variation of peak hare densitiesin our data are 63%, while the coefficient of variation of low den-sities is 83%. Whatever measure of cyclic amplitude is used, ourresults are based on relatively few hare peaks and further data onall sites would be desirable.
Fig. 1. Schematic representation of the predictions of three single-factor hypotheses to explain variations in snowshoe hare (Lepus americanus)cyclic amplitude. Hare cycles are highly simplified. (a) The arrow in the forest succession diagram indicates a fire or other disturbance afterwhich there is a time lag before shrub regrowth provides adequate cover for hares. (b) The symbol in the plant defense diagram represents avery high peak year (a “super peak”) in which hares severely browsed the winter vegetation. We do not know how quickly vegetation recoversfrom severe browsing in the boreal forest, so this sequence is hypothetical. (c) Arrows in the predator diagram indicate low and increasephases in which either predators survived the low phase in moderate abundance or immigrant predators arrived in a local area from distantpopulations so that predator populations start increasing from relatively high levels. The time scale is indicative rather than absolute.
Haredensity
Years0 10 20 30 40 50 60
(b) Plant Defense Hypothesis
Haredensity
Years0 10 20 30 40 50 60
(a) Forest Succession HypothesisHaredensity
Years0 10 20 30 40 50 60
(c) Predator Hypothesis
fire
Krebs et al. 1041
Published by NRC Research Press
Can
. J. Z
ool.
Dow
nloa
ded
from
ww
w.n
rcre
sear
chpr
ess.
com
by
Uni
vers
ity o
f B
ritis
h C
olum
bia
on 1
1/17
/14
For
pers
onal
use
onl
y.
The demographics of cyclic amplitudes are relatively simple:the starting low density of hares, their rate of population growth,and the number of years of the increase phase over which thisgrowth rate is expressed all combine to determine the cyclic am-plitude. We wish to determine which mechanistic drivers set thisdemographic stage.
Tests of hypothesesGiven data on hare abundance over a limited number of cycles,
we have attempted to evaluate the following predictions of eachof the four hypotheses proposed in the Introduction:
1. Weather hypothesis: sites with similar climate or similarweather in May will have similar temporal patterns of am-plitude variation.
2. Forest succession hypothesis: amplitude peaks occurring earlyin forest succession will be high because the quantity andquality of winter food will be high, and subsequent peaks willdecline as succession proceeds and the quantity and quality ofwinter food declines.
3. Plant defense hypothesis: the increase in toxic antibrowsingdefense of the hare’s preferred winter browse species initiatedby a very high peak hare density will result in a long period ofamplitude decline followed by a toxin-determined food – haredensity stable limit cycle.
4. Predator hypothesis: relatively high abundance of predatorsin the low and increase phase will generate a low amplitudehare peak and vice versa.
Hypothesis 1: correlated regional weather determinesamplitudes
The mechanism behind this explanation is that severe wintersor summers affect hare mortality rates, which reduces the rate ofpopulation growth of hares, but not of their predators. This is asimplified landscape or regional hypothesis because it assumesthat over a region of 500–1000 km, the weather is highly corre-lated. In our analysis, we consider both long-term weather trends(climate normals) and weather conditions during a specific timeperiod when hares may be most vulnerable (May). We realize thatthere are a large number of weather hypotheses and it is notpossible to test every one with the limited data. We have pickedthe biologically most realistic hypothesis to consider here.
Table 1. Snowshoe hares (Lepus americanus) peak abundance estimates used in this analysis of cyclic amplitude, years of data since the previouslow, and estimates of cyclic amplitude.
AreaPeakyear Season
Maximum density(no. of hares/ha) ormaximum count
Minimum density(no. of hares/ha) orminimum count
Years sincepreviouslow
Amplitude(high toprevious low)
Kluane Lake, Yukon 1981 Fall 4.43 0.04 4 110.751990 Fall 1.68 0.12 4 14.321998 Fall 2.73 0.07 4 42.062006 Fall 1.15 0.02 4 67.65
Bonanza Creek, Alaska 1999 Fall 6.532009 Fall 6.00 0.26 7 23.08
Skeena River, British Columbia 2003 Fall 1.51Delta Junction, Alaska 1999 BBS 851* 4* 4 21.25
2006 BBS 1291* 2* 2 64.50Denali National Park, Alaska 1989 Spring 6.971
1999 Spring 8.031 0.63 5 12.662009 Spring 40.351 0.63 7 63.65
Kenai Peninsula, Alaska 1983 Fall 3.551999 Fall 1.23 0.15 8 8.202011 Fall 1.45 0.13 6 11.15
Mayo, Yukon 1999 Fall 2.7412006 Fall 4.521 0.18 5 25.261
North Slave–South Slave,Northwest Territories
1990 Fall 2.981999 Fall 2.38 0.22 6 10.822009 Fall 1.24 0.52 3 2.38
Inuvik, Northwest Territories 1997 Fall 2.20 0.64 8 3.442009 Fall 1.11 0.37 4 3.00
Tetlin, Alaska 2008 Fall 0.95 0.04 7 23.75Wrangell–St. Elias, Alaska 1991 Fall 2.85
2001 Fall 3.93 0.29 7 13.582009 Fall 2.68 0.28 5 9.65
Note: Site locations are mapped in Fig. 3 (p. 566) and Table 1 (p. 566) of Krebs et al. (2013). BBS, Breeding Bird Survey routes.*Abundance estimates based on road counts so these are not densities (numbers of hares/ha) but numbers of hares per unit distance.
Fig. 2. Box plots of the amplitude of snowshoe hare (Lepusamericanus) cycles measured in all the areas listed in Table 1. Themedian amplitude if the previous low abundance is used was 14.3; ifthe following low is used, the median amplitude was 18.4.
1042 Can. J. Zool. Vol. 92, 2014
Published by NRC Research Press
Can
. J. Z
ool.
Dow
nloa
ded
from
ww
w.n
rcre
sear
chpr
ess.
com
by
Uni
vers
ity o
f B
ritis
h C
olum
bia
on 1
1/17
/14
For
pers
onal
use
onl
y.

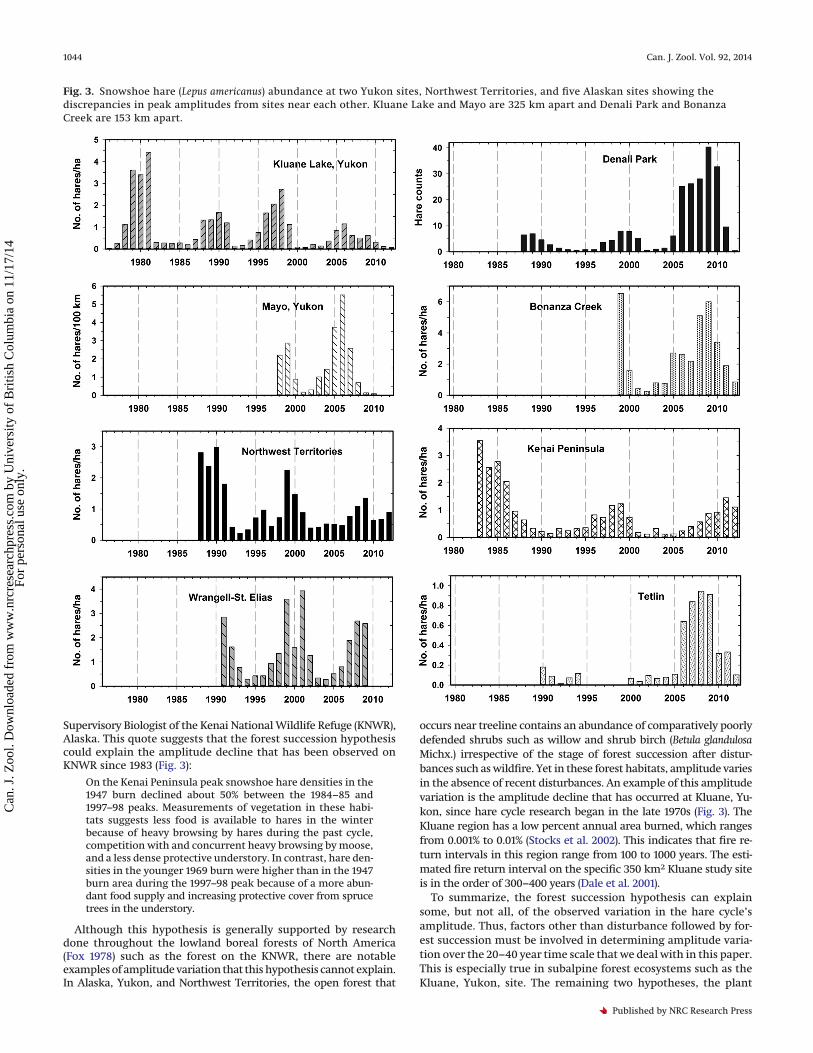
Our observations reveal that no clear trend in cyclic amplitudeis common to all sites (Tables 1, 2). This observation suggests thatregional weather does not affect the cycle’s amplitude, thusthrowing doubt on hypothesis 1. The regional weather hypothesiscan be tested more rigorously by comparing pairs of sites locatedwithin a few hundred kilometres of each other (Kluane Lake,Yukon, versus Mayo, Yukon; Bonanza Creek, Alaska, versus DenaliPark, Alaska). The Kluane site is located about 325 km south of theMayo site, while the Bonanza Creek site is located about 130 kmnorth of the Denali site.
The climate normals (30 year averages of temperature (°C), totalprecipitation (mm), and snowfall (cm); Supplementary Table S11)of these four sites used to test hypothesis 1 do not differ greatly: allpairwise correlations exceed 0.82 (Supplementary Table S2).1 Theweather hypothesis would, therefore, predict no great differencesin the temporal variation in cycle amplitude existing among thesefour locations. However, variation in amplitude among these fourlocations after the very high hare peak of the early 1970s (J. Bryantand C.J. Krebs, personal observations) has been significant (Fig. 3;Tables 1, 2). Kluane Lake hare peaks have declined in the 1990s and2000s to much lower levels than they were in the 1970s and 1980s(Fig. 3), and while the Kluane hare peak in 2007 was the lowestobserved, Mayo (325 km away) had a moderate hare peak at thattime. Similarly, Bonanza Creek had very high hare peaks in both1999 and 2009 at the same time that Denali Park (153 km away)had a low hare peak in 1999 and a much higher peak in 2009.Analyses of hare population data in interior Alaska from 1999 to2008 indicate that the amplitudes of hare cycles in this area wereonly moderately affected by variation in common weather param-eters such as precipitation and temperature (Kielland et al. 2010).
We conclude that at each site in Yukon and Alaska, the am-plitudes of hare cycles vary greatly over time and space. On a localscale of 100–200 km, amplitudes match, but on spatial scalesgreater than about 400 km, amplitudes do not match even thoughweather does (McCabe et al. 2012). These observations are incon-sistent with the hypothesis that correlated weather determinescyclic amplitudes in this region of the snowshoe hare’s range.
However, the possibility remains that variations in weather of acritical month in the hare’s life cycle may influence regional vari-ation in the cycle’s amplitude. May is the most likely month inwhich regional differences in weather could result in regionaldifferences in the cycle’s amplitude. For example, a cold and wetMay could reduce survival of the hare’s first litter of leverets, thusaffecting the amplitude of the hare cycle. However, the data pre-
sented in Supplementary Fig. S11 strongly suggest that variation inMay temperature and precipitation is unrelated to the amplitudevariation occurring among these four sites. Since hares have twoto four litters during the summer, there is ample opportunity forcompensatory survival of later litters if the May litter is affectedby weather. O’Donoghue (1994) found that predation was the mostcommon cause of death of juvenile hares during their first 30 daysof life and weather was rarely a factor causing juvenile losses. Itseems unlikely that weather will affect juvenile survival after thesnow has melted in May in these northern localities.
To summarize, because we found no relationship between re-gional variation in the cycle’s amplitude and regional variation inweather either at the level of climate normals or May temperatureand precipitation, we have tentatively rejected the weather hypoth-esis as an explanation of amplitude variation in the hare cycle.
Hypothesis 2: forest succession hypothesisThis hypothesis is based upon the widespread observation that
both the quantity and the quality of the snowshoe hare’s pre-ferred winter browse, which is primarily the twigs of rapidly growingdeciduous woody species such as willows (genus Salix L.) andbirches (genus Betula L.), peaks relatively early in forest successionand then declines as these preferred browse species are replacedby slowly growing species such as evergreen spruces (genus PiceaA. Dietr.) that are poor winter food for hares (Fox 1978; Bryant andKuropat 1980; Bryant et al. 1983; Sinclair et al. 1988). Extensivework in eastern North America has shown that the initial stages ofsuccession after logging are not preferred by hares and it is onlyafter 10–35 years that optimal hare habitat is achieved in thesouthern part of the hare’s range (de Bellefeuille et al. 2001; Homyacket al. 2007). High amplitude hare peaks that often occur relativelyearly in forest succession after disturbances such as wildfire orlogging are generally followed by a period of amplitude declineduring subsequent forest succession (e.g., Grange 1949, 1965;Bookhout 1965; Fox 1978; Bryant et al. 1983). The three most likelycauses of declining amplitude are (1) increasing toxicity to snow-shoe hares of slowly growing late-successional species such asspruce (Bryant and Kuropat 1980; Bryant et al. 1983); (2) decliningquantity of suitable and accessible browse as the forest matures;and (3) decreasing horizontal cover in the form of dense thicketsof tall deciduous shrubs and spruce saplings that snowshoe haresuse to evade predators (Wolff 1980).
The following quote was taken from a “Refuge Notebook” writ-ten for the Peninsula Clarion newspaper by Ted Bailey, retired
1Supplementary text, Tables S1 and S2, and Fig. S1 are available with the article through the journal Web site at http://nrcresearchpress.com/doi/suppl/10.1139/cjz-2014-0159.
Table 2. Relative peak density of snowshoe hares (Lepus americanus) in 12 areas of northwestern NorthAmerica.
Location 1970s 1980s 1990s 2000s
Central British Columbia HighCentral Northwest Territories Very high High Moderate LowInuvik, Northwest Territories High LowKluane Lake, Yukon Very high? High Moderate LowMayo, Yukon Low–moderate ModerateTetlin National Wildlife Refuge, Alaska Very high Low? HighWrangell–St. Elias National Park, Alaska Very high High? High ModerateBonanza Creek, Alaska Very high* Moderate? High HighDenali National Park, Alaska Very high Low Low HighDelta Junction, Alaska Very high Moderate HighKoyukuk National Wildlife Refuge, Alaska Very high Low High ModerateKenai Peninsula, Alaska Very high High Low Low
Note: Peaks are classified within the decade in which they occurred. The very high or “super peaks” of the 1970s weremostly qualitative natural-history observations.
*Documented by Wolff (1980).
Krebs et al. 1043
Published by NRC Research Press
Can
. J. Z
ool.
Dow
nloa
ded
from
ww
w.n
rcre
sear
chpr
ess.
com
by
Uni
vers
ity o
f B
ritis
h C
olum
bia
on 1
1/17
/14
For
pers
onal
use
onl
y.
Supervisory Biologist of the Kenai National Wildlife Refuge (KNWR),Alaska. This quote suggests that the forest succession hypothesiscould explain the amplitude decline that has been observed onKNWR since 1983 (Fig. 3):
On the Kenai Peninsula peak snowshoe hare densities in the1947 burn declined about 50% between the 1984–85 and1997–98 peaks. Measurements of vegetation in these habi-tats suggests less food is available to hares in the winterbecause of heavy browsing by hares during the past cycle,competition with and concurrent heavy browsing by moose,and a less dense protective understory. In contrast, hare den-sities in the younger 1969 burn were higher than in the 1947burn area during the 1997–98 peak because of a more abun-dant food supply and increasing protective cover from sprucetrees in the understory.
Although this hypothesis is generally supported by researchdone throughout the lowland boreal forests of North America(Fox 1978) such as the forest on the KNWR, there are notableexamples of amplitude variation that this hypothesis cannot explain.In Alaska, Yukon, and Northwest Territories, the open forest that
occurs near treeline contains an abundance of comparatively poorlydefended shrubs such as willow and shrub birch (Betula glandulosaMichx.) irrespective of the stage of forest succession after distur-bances such as wildfire. Yet in these forest habitats, amplitude variesin the absence of recent disturbances. An example of this amplitudevariation is the amplitude decline that has occurred at Kluane, Yu-kon, since hare cycle research began in the late 1970s (Fig. 3). TheKluane region has a low percent annual area burned, which rangesfrom 0.001% to 0.01% (Stocks et al. 2002). This indicates that fire re-turn intervals in this region range from 100 to 1000 years. The esti-mated fire return interval on the specific 350 km2 Kluane study siteis in the order of 300–400 years (Dale et al. 2001).
To summarize, the forest succession hypothesis can explainsome, but not all, of the observed variation in the hare cycle’samplitude. Thus, factors other than disturbance followed by for-est succession must be involved in determining amplitude varia-tion over the 20–40 year time scale that we deal with in this paper.This is especially true in subalpine forest ecosystems such as theKluane, Yukon, site. The remaining two hypotheses, the plant
Fig. 3. Snowshoe hare (Lepus americanus) abundance at two Yukon sites, Northwest Territories, and five Alaskan sites showing thediscrepancies in peak amplitudes from sites near each other. Kluane Lake and Mayo are 325 km apart and Denali Park and BonanzaCreek are 153 km apart.
1044 Can. J. Zool. Vol. 92, 2014
Published by NRC Research Press
Can
. J. Z
ool.
Dow
nloa
ded
from
ww
w.n
rcre
sear
chpr
ess.
com
by
Uni
vers
ity o
f B
ritis
h C
olum
bia
on 1
1/17
/14
For
pers
onal
use
onl
y.

defense hypothesis and the predator hypothesis suggest two suchfactors.
Hypothesis 3: plant defense hypothesisThe biological basis of this hypothesis is that if, at the start of a
cycle, the hare’s favored food plants have minimal plant defenses,a super peak will be produced because the hares’ nutritional con-dition will be optimal, improving both reproduction and survival.The physiological foundation of this hypothesis is the process ofwoody plant aging and the reversal of aging by pruning (Kozlowski1971, chapter 4). Aging and its reversal by pruning (e.g., harebrowsing) affect the toxic antibrowsing defenses of the snowshoehare’s preferred winter foods, the twigs of rapidly growing decid-uous species such as willow and birch. The biological basis for thiseffect is given in Liu et al. (2012). The problem with evaluating thishypothesis is that we do not yet have replicated field studies ofhare population dynamics and food-plant chemical defensesthroughout several hare cycles in different parts of the geographicrange of hares. Here we consider only the physiological basis ofsuch a mechanism for variable cyclic amplitude.
Rongsong Liu (University of Wyoming, Mathematics Department)has used the simpler version of her model (Liu et al. 2012) to predictqualitatively how severe browsing by snowshoe hares in the win-ter of a very high hare peak should affect the amplitude of thehare cycle during subsequent cycles. Betula glandulosa was selectedfor the simulation because its twigs are a highly preferred winterfood of snowshoe hares (Grange 1965; Pease et al. 1979; Smith et al.1988; Krebs et al. 2001b) and the dammarane triterpenes that de-fend birch B. glandulosa twigs against hare browsing in winterhave been chemically identified (Reichardt 1981; Reichardt et al.1987; Williams et al. 1992). In the simulation, the duration oftoxicity was set to 3 years, which is the period of time that thetwigs of B. glandulosa growing near Fairbanks remain unpalatableto snowshoe hares after a severe browsing event (Fox and Bryant1984) and is also the period of time that the concentration ofdammarane triterpenes in the smaller diameter segments foundat the tip of a B. glandulosa twig remains high (P.B. Reichardt,unpublished data). The twig’s maximum diameter was set to3 mm because at Kluane, Yukon, during the winters of the cycliclow and the early increase phase, the diameter at which snowshoehares bite off B. glandulosa twigs ranges from about 2 to 4 mm(Smith et al. 1988). This also is the diameter at the point of clippingobserved during the cyclic low in interior Alaska (Wolff 1980) andin northern Alberta (Pease et al. 1979). Neither predation nor anydisturbance such as wildfire has yet been included in this model.
The prediction of the Liu et al. (2012) model that is relevant toamplitude variation is the following: severe browsing in winter byhares on B. glandulosa such as that observed at Kluane, Yukon, bySmith et al. (1988) in the winters of 1980–1981 and 1981–1982 willresult in a hare cycle with declining amplitude. This prediction isqualitatively supported by the dampening of the hare cycle thathas been observed at Kluane, Yukon, since the hare peak thatoccurred in the winters of 1980–1981 and 1981–1982 (Fig. 3). How-ever, since B. glandulosa does not occur at all of the sampling plotsat Kluane, this simulation, which used B. glandulosa as the browsespecies of interest, is insufficient to totally account for the ampli-tude decline observed at Kluane. But, as noted by Smith et al. (1988),browsing by the snowshoe hare on its second most preferredbrowse species, the grayleaf willow (Salix glauca L.), resulted in agrowth response similar to that of B. glandulosa. This observationindicates that if S. glauca uses toxins for antibrowsing defense,then the explanatory value of the Liu et al. (2012, 2013) model atKluane will increase. The chemical identification of the specificsecondary metabolites that defend S. glauca against hare browsingand their mode of action need to be determined before a robusttest of the Liu et al. (2012, 2013) hypothesis can be done at Kluane.
The Alaska paper birch (Betula neoalaskana Sarg.) (previouslyBetula papyrifera Marshall) is the most important winter food of
snowshoe hares and moose (Alces alces (L., 1758)) living on the KenaiNational Wildlife Refuge (KNWR) (Oldemeyer 1983). The twigs ofthe B. neoalaskana saplings are defended against snowshoe harebrowsing in winter by papyriferic acid (PA), which as mentionedabove, both deters feeding by the snowshoe hare (Reichardt et al.1984) and is also toxic to the snowshoe hare (Forbey et al. 2011). Theduration of time that the segments of the twigs of B. neoalaskanasaplings growing on the KNWR produce enough PA to deter harebrowsing is about the amount of time required by the Liu et al.(2012) model to generate the hare cycle that occurs on the KNWR(Fig. 3). Thus, this model may also partially explain the amplitudedecline that has been documented at the KNWR (Fig. 3).
The hare cycle that has occurred at Denali National Park, Alaska,clearly does not support the first prediction of Liu et al.’s (2012)simulation. After the spectacular high hare peak that occurred atDenali in the winters of 1970–1971 and 1971–1972 (J. Bryant, per-sonal observation), the amplitude of the cyclic peak did decline(C. McIntyre, unpublished data) as predicted by the Liu et al. (2012)model. However, the occurrence of another very high amplitudehare peak at Denali in the winter of 2009 (Fig. 3) is clearly incon-sistent with Liu et al.’s (2012) prediction of a long period of ampli-tude decline followed by the emergence of a stable limit cycledriven by toxic defense against hares. Thus, other factors must beaffecting amplitude variation at Denali.
Hypothesis 4: predator hypothesisIf predators are the chief determinant of the amplitude of any
particular cycle, it should be possible to predict the peak haredensity from the density and rate of increase of all hare predatorsfrom the previous low phase. This prediction would assume thatthe initial density and rate of growth of predator populations isvariable rather than constant, and that the growth rate of the harepopulation is controlled by mortality caused by predation. Ourindex of hare predators is the lynx. The lynx population of a localarea could increase because of reproduction or immigration or both.Figure 4 illustrates the data available from Kluane Lake to test thisprediction, and Figs. 5a–5d show similar data from Northwest Terri-tories, Kenai Peninsula, Wrangell–St. Elias, and Denali National Park.In three hare cycles from Kluane Lake and two cycles in NorthwestTerritories (NWT), the Kenai, Wrangell–St. Elias, and Denali, there isa consistent negative correlation between hare cyclic amplitude(peak/low) and lynx population rate of increase from the previous
Fig. 4. Amplitude of the snowshoe hare (Lepus americanus) cycleat Kluane Lake, Yukon, over three cycles in relation to theinstantaneous rate of increase of Canada lynx (Lynx canadensis)during the hare population increase phase. Lynx abundance wasestimated by snow tracking counts. The amplitude of the hare cycleis measured as the peak hare density/previous low hare density.Error bars are 1 SE.
Krebs et al. 1045
Published by NRC Research Press
Can
. J. Z
ool.
Dow
nloa
ded
from
ww
w.n
rcre
sear
chpr
ess.
com
by
Uni
vers
ity o
f B
ritis
h C
olum
bia
on 1
1/17
/14
For
pers
onal
use
onl
y.
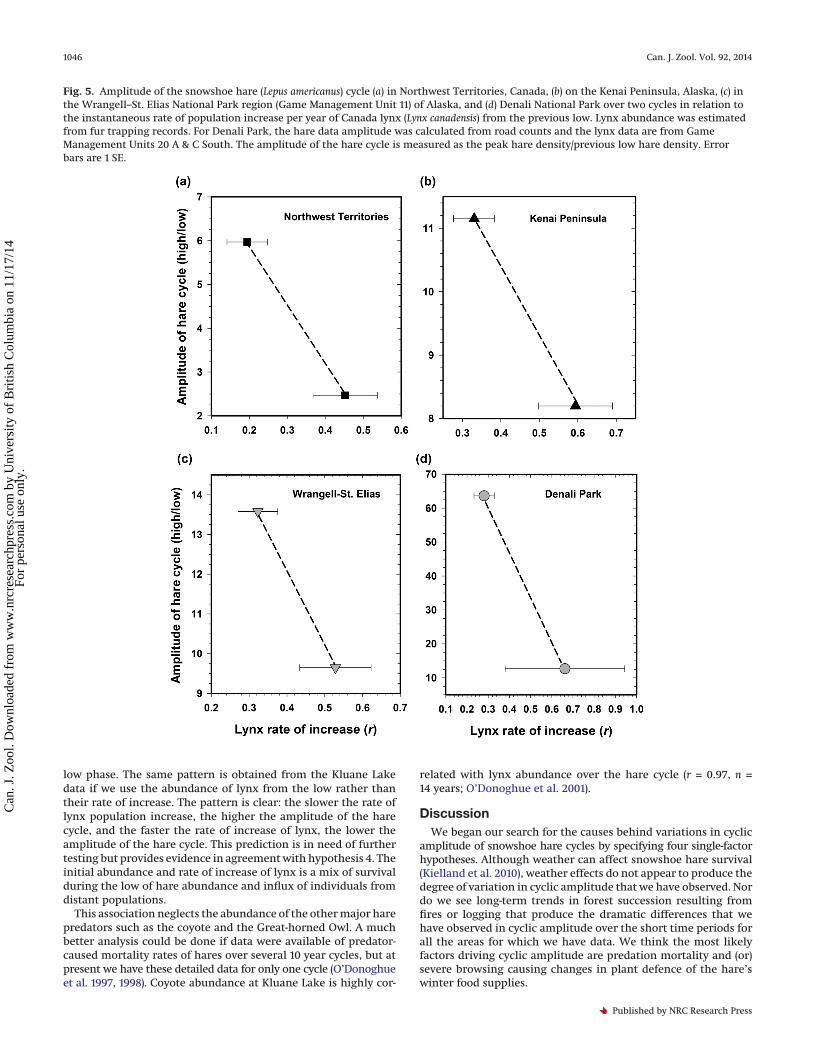
low phase. The same pattern is obtained from the Kluane Lakedata if we use the abundance of lynx from the low rather thantheir rate of increase. The pattern is clear: the slower the rate oflynx population increase, the higher the amplitude of the harecycle, and the faster the rate of increase of lynx, the lower theamplitude of the hare cycle. This prediction is in need of furthertesting but provides evidence in agreement with hypothesis 4. Theinitial abundance and rate of increase of lynx is a mix of survivalduring the low of hare abundance and influx of individuals fromdistant populations.
This association neglects the abundance of the other major harepredators such as the coyote and the Great-horned Owl. A muchbetter analysis could be done if data were available of predator-caused mortality rates of hares over several 10 year cycles, but atpresent we have these detailed data for only one cycle (O’Donoghueet al. 1997, 1998). Coyote abundance at Kluane Lake is highly cor-
related with lynx abundance over the hare cycle (r = 0.97, n =14 years; O’Donoghue et al. 2001).
DiscussionWe began our search for the causes behind variations in cyclic
amplitude of snowshoe hare cycles by specifying four single-factorhypotheses. Although weather can affect snowshoe hare survival(Kielland et al. 2010), weather effects do not appear to produce thedegree of variation in cyclic amplitude that we have observed. Nordo we see long-term trends in forest succession resulting fromfires or logging that produce the dramatic differences that wehave observed in cyclic amplitude over the short time periods forall the areas for which we have data. We think the most likelyfactors driving cyclic amplitude are predation mortality and (or)severe browsing causing changes in plant defence of the hare’swinter food supplies.
Fig. 5. Amplitude of the snowshoe hare (Lepus americanus) cycle (a) in Northwest Territories, Canada, (b) on the Kenai Peninsula, Alaska, (c) inthe Wrangell–St. Elias National Park region (Game Management Unit 11) of Alaska, and (d) Denali National Park over two cycles in relation tothe instantaneous rate of population increase per year of Canada lynx (Lynx canadensis) from the previous low. Lynx abundance was estimatedfrom fur trapping records. For Denali Park, the hare data amplitude was calculated from road counts and the lynx data are from GameManagement Units 20 A & C South. The amplitude of the hare cycle is measured as the peak hare density/previous low hare density. Errorbars are 1 SE.
1046 Can. J. Zool. Vol. 92, 2014
Published by NRC Research Press
Can
. J. Z
ool.
Dow
nloa
ded
from
ww
w.n
rcre
sear
chpr
ess.
com
by
Uni
vers
ity o
f B
ritis
h C
olum
bia
on 1
1/17
/14
For
pers
onal
use
onl
y.

Additional hypotheses can be generated by using two or moreof these factors acting in concert. We prefer not to speculate aboutmultifactor hypotheses until we have more understanding of thesingle-factor explanations that are most likely. We have tenta-tively rejected hypotheses 1 (correlated climatic variation) andhypothesis 2 (plant succession) for most areas for the variations inamplitude that we have described over the 20–40 year time scale.The Kenai Peninsula is an exception, which supports hypothesis 2,but its data are also consistent with hypothesis 4. Additional datawill be most useful for this site and for Tetlin, since they are twoof four sites currently being sampled (two also at Mayo) that havehad recent fires in areas with records of hare numbers. We viewthe role of fire and plant succession as slow variables that affecthare cyclic amplitudes in the long term (50–200+ years) and overbroad landscapes, and we have concentrated here on trying toexplain the short-term variation shown over 20–40 years. It ispossible that a two-factor explanation of predation pressure andbrowsing impacts will be needed to understand the details of whycycles vary so much in amplitude, or even a three-factor explana-tion of predation, browsing, and succession could be required. Forthe present we recommend two foci for study:
1. Movement of predators from regions with an increasing am-plitude cycle to regions with a dampening one is a plausibleexplanation for amplitude dampening. Thus, we suggest theprimary focus should be a major landscape study of predatordensity, survival, and movements through at least two harecycles to determine where lynx, Great-horned Owls, coyotes,American marten (Martes americana (Turton, 1806)), and othermajor predators go when hares decline. Radio-collaring meth-ods with satellite collars have now made these studies feasible.
2. The secondary focus should be testing the three assumptionsmade by the plant-quality model of Liu et al. (2012) at severallocations across the geographical range of hare cycles, com-bined with data on hare demography.
In an ideal world, these two foci could be combined in a majorcollaborative, large-scale study across northwestern North Amer-ica to bring together the information needed to understand theecosystem dynamics of this important part of the boreal forestbiome.
We recognize that our attempts to analyze the variations inamplitude of snowshoe hare peaks are limited because of thelength of the time series and the fact that not all areas have dataon hare and predator abundances, as well as forage availabilityand quality from the same years. To further our understanding ofthese population events, we need to expand our long-term, stan-dardized monitoring program of hares, their predators, and foodplants to extend over not only northwestern Canada and Alaskabut also over the eastern part of the continent. The continuationof long-term time series is important if we wish to see how eco-system changes associated with climate change will impact cyclicvariation in the snowshoe hare cycle and community dynamics.
The concern about collapsing population cycles (Ims et al. 2008)is not visible in the data that we have assembled, but our resultsemphasize the continuing importance of maintaining long-termmonitoring in the boreal forest. A better understanding of predatormovements relating to the hare cycle could improve our understand-ing of the landscape dynamics of lynx and other predators.
We hypothesize that the models we have tried to evaluate herefor snowshoe hare cycles should also apply to other species ofmammals and birds that show cycles of variable amplitude. Snow-shoe hare cycles might be a simple case in which predation is themain cause of amplitude variation, but since cycles occur in manydiverse species in different ecosystems, one explanation for vari-able amplitudes may not fit all species or all populations. Thequestion remains open and in need of additional experimentalwork.
AcknowledgementsWe thank all who have gathered these long-term data and al-
lowed them to be incorporated into this synthesis. In particularwe thank the personnel of the Alaska Department of Fish andGame, the US Fish and Wildlife Service, and National Park Serviceworking at the Alaskan sites, and the biologists and wildlife mon-itors in Yukon and Northwest Territories who have contributedtheir time and energy in these surveys. C. McIntyre provided datafrom Denali National Park. E. Hofer assisted in the Kluane live-trapping program. Research funding from the Natural Sciencesand Engineering Research Council of Canada is gratefully ac-knowledged. In British Columbia, monitoring was funded by For-est Renewal BC (through Babine Forest Products), the Ministry ofSustainable Resource Management, and the Ministry of Forests, insupport of D. Reid and F. Doyle.
ReferencesArthur, S.M., and Prugh, L.R. 2010. Predator-mediated indirect effects of snow-
shoe hares on Dall’s sheep in Alaska. J. Wildl. Manage. 74(8): 1709–1721.doi:10.2193/2009-322.
Blasius, B., Huppert, A., and Stone, L. 1999. Complex dynamics and phase syn-chronization in spatially extended ecological systems. Nature, 399(6734):354–359. doi:10.1038/20676. PMID:10360572.
Bookhout, T.A. 1965. The snowshoe hare in Upper Michigan and its biology andfeeding coactions with white-tailed deer. In Michigan Department of Conser-vation Research and Development Report No. 38. pp. 1–198.
Boonstra, R., Hik, D., Singleton, G.R., and Tinnikov, A. 1998. The impact ofpredator-induced stress on the snowshoe hare cycle. Ecol. Monogr. 68(3):371–394. doi:10.1890/0012-9615(1998)068[0371:TIOPIS]2.0.CO;2.
Bryant, J.P., and Kuropat, P.J. 1980. Selection of winter forage by subarctic brows-ing vertebrates: the role of plant chemistry. Annu. Rev. Ecol. Syst. 11: 261–285.doi:10.1146/annurev.es.11.110180.001401.
Bryant, J.P., Chapin, F.S., III, and Klein, D.R. 1983. Carbon/nutrient balance ofboreal plants in relation to vertebrate herbivory. Oikos, 40(3): 357–368. doi:10.2307/3544308.
Dale, M.R.T., Francis, S., Krebs, C.J., and Nams, V.O. 2001. Trees. In Ecosystemdynamics of the boreal forest. Edited by C.J. Krebs, S. Boutin, and R. Boonstra.Oxford University Press, New York. pp. 116–137.
de Bellefeuille, S., Bélanger, L.B., Huot, J., and Cimon, A. 2001. Clear-cutting andregeneration practices in Quebec boreal balsam fir forest: effects on snow-shoe hare. Can. J. For. Res. 31(1): 41–51. doi:10.1139/x00-140.
Elton, C., and Nicholson, M. 1942. The ten-year cycle in numbers of the lynx inCanada. J. Anim. Ecol. 11(2): 215–244. doi:10.2307/1358.
Forbey, J.S., Pu, X., Xu, D., Kielland, K., and Bryant, J. 2011. Inhibition of snow-shoe hare succinate dehydrogenase activity as a mechanism of deterrence forpapyriferic acid in birch. J. Chem. Ecol. 37: 1285–1293. doi:10.1007/s10886-011-0039-9. PMID:22116690.
Fox, J.F. 1978. Forest fires and the snowshoe hare – Canada lynx cycle. Oecologia,31(3): 349–374. doi:10.1007/BF00346252.
Fox, J.F., and Bryant, J.P. 1984. Instability of the snowshoe hare and woody plantinteraction. Oecologia, 63(1): 128–135. doi:10.1007/BF00379794.
Grange, W.B. 1949. The way to game abundance. Scribner’s, New York.Grange, W.B. 1965. Fire and tree growth relationships to snowshoe rabbits. In
Proceedings of the Fourth Annual Tall Timbers Fire Ecology Conference,Tallahassee, Fla., 18–19 March 1965. Tall Timbers Research, Inc., Tallahassee,Fla. Vol. 4. pp. 110–125.
Haydon, D.T., and Greenwood, P.E. 2000. Spatial coupling in cyclic populationdynamics: models and data. Theor. Popul. Biol. 58(3): 239–254. doi:10.1006/tpbi.2000.1489. PMID:11120651.
Homyack, J.A., Harrison, D.J., and Krohn, W.B. 2007. Effects of precommercialthinning on snowshoe hares in Maine. J. Wildl. Manage. 71(1): 4–13. doi:10.2193/2005-481.
Ims, R.A., Henden, J.-A., and Killengreen, S.T. 2008. Collapsing population cycles.Trends Ecol. Evol. 23(2): 79–86. doi:10.1016/j.tree.2007.10.010. PMID:18191281.
Keith, L.B. 1990. Dynamics of snowshoe hare populations. Curr. Mammal. 4:119–195.
Kielland, K., Olson, K., and Euskirchen, E. 2010. Demography of snowshoe haresin relation to regional climate variability during a 10-year population cycle ininterior Alaska. Can. J. For. Res. 40(7): 1265–1272. doi:10.1139/X10-053.
Kozlowski, T.T. 1971. Growth and development of trees. Vol. 1. Academic Press,New York.
Krebs, C.J. 2009. Ecology: The experimental analysis of distribution and abun-dance. 6th ed. Benjamin Cummings, San Francisco, Calif.
Krebs, C.J., Boutin, S., Boonstra, R., Sinclair, A.R.E., Smith, J.N.M., Dale, M.R.T.,Martin, K., and Turkington, R. 1995. Impact of food and predation on thesnowshoe hare cycle. Science, 269(5227): 1112–1115. doi:10.1126/science.269.5227.1112. PMID:17755536.
Krebs, C.J., Boonstra, R., Nams, V., O’Donoghue, M., Hodges, K.E., and Boutin, S.
Krebs et al. 1047
Published by NRC Research Press
Can
. J. Z
ool.
Dow
nloa
ded
from
ww
w.n
rcre
sear
chpr
ess.
com
by
Uni
vers
ity o
f B
ritis
h C
olum
bia
on 1
1/17
/14
For
pers
onal
use
onl
y.

2001a. Estimating snowshoe hare population density from pellet plots: afurther evaluation. Can. J. Zool. 79(1): 1–4. doi:10.1139/z00-177.
Krebs, C.J., Boutin, S., and Boonstra, R. (Editors). 2001b. Ecosystem dynamics ofthe boreal forest: the Kluane Project. Oxford University Press, New York.
Krebs, C.J., Kielland, K., Bryant, J., O’Donoghue, M., Doyle, F., McIntyre, C.,DiFolco, D., Berg, N., Carrier, S., Boonstra, R., Boutin, S., Kenney, A.J., Reid, D.G.,Bodony, K., Putera, J., and Burke, T. 2013. Synchrony in the snowshoe hare(Lepus americanus) cycle in northwestern North America, 1970–2012. Can. J.Zool. 91(8): 562–572. doi:10.1139/cjz-2013-0012.
Liu, R., Gourley, S.A., DeAngelis, D.L., and Bryant, J.P. 2012. Modeling the dynam-ics of woody plant–herbivore interactions with age-dependent toxicity.J. Math. Biol. 65(3): 521–552. doi:10.1007/s00285-011-0470-0. PMID:21984335.
Liu, R., Gourley, S.A., DeAngelis, D.L., and Bryant, J.P. 2013. A mathematicalmodel of woody plant chemical defenses and snowshoe hare feeding behav-ior in boreal forests: the effect of age-dependent toxicity of twig segments.SIAM J. Appl. Math. 73(1): 281–304. doi:10.1137/110848219.
McCabe, G.J., Ault, T.R., Cook, B.I., Betancourt, J.L., and Schwartz, M.D. 2012.Influences of the El Niño Southern Oscillation and the Pacific Decadal Oscil-lation on the timing of the North American spring. Int. J. Climatol. 32(15):2301–2310. doi:10.1002/joc.3400.
McIntyre, C.L., and Schmidt, J.H. 2012. Ecological and environmental correlatesof territory occupancy and breeding performance of migratory GoldenEagles Aquila chrysaetos in interior Alaska. Ibis, 154(1): 124–135. doi:10.1111/j.1474-919X.2011.01181.x.
McKelvey, K.S., Aubry, K.B., and Ortega, Y.K. 2000. History and distribution oflynx in the contiguous United States. In Ecology and conservation of lynxin the United States. Edited by L.F. Ruggiero, K.B. Aubry, S.W. Buskirk,G.M. Koehler, C.J. Krebs, K.S. McKelvey, and J.R. Squires. University Press ofColorado, Boulder. pp. 207–264.
Mills, L.S., Griffin, P.C., Hodges, K.E., McKelvey, K., Ruggiero, L., and Ulizio, T.2005. Pellet count indices compared to mark–recapture estimates for evalu-ating snowshoe hare density. J. Wildl. Manage. 69(3): 1053–1062. doi:10.2193/0022-541X(2005)069[1053:PCICTM]2.0.CO;2.
Moran, P.A.P. 1953. The statistical analysis of the Canadian lynx cycle. I. Struc-ture and prediction. Aust. J. Zool. 1: 163–173.
O’Donoghue, M. 1994. Early survival of juvenile snowshoe hares. Ecology, 75(6):1582–1592. doi:10.2307/1939619.
O’Donoghue, M., Boutin, S., Krebs, C.J., and Hofer, E.J. 1997. Numerical responsesof coyotes and lynx to the snowshoe hare cycle. Oikos, 80(1): 150–162. doi:10.2307/3546526.
O’Donoghue, M., Boutin, S., Krebs, C.J., Zuleta, G., Murray, D.L., and Hofer, E.J.1998. Functional responses of coyotes and lynx to the snowshoe hare cycle.Ecology, 79(4): 1193–1208. doi:10.2307/176736.
O’Donoghue, M., Boutin, S., Murray, D.L., Krebs, C.J., Hofer, E.J., Breitenmoser, U.,Breitenmoser-Wuersten, C., Zuleta, G., Doyle, C.E., and Nams, V.O. 2001.Coyotes and lynx. In Ecosystem dynamics of the boreal forest: the KluaneProject. Edited by C.J. Krebs, S. Boutin, and R. Boonstra. Oxford UniversityPress, New York. pp. 275–323.
Oldemeyer, J.L. 1983. Browse production and its use by moose and snowshoehares at the Kenai Moose Research Center, Alaska. J. Wildl. Manage. 47(2):486–496. doi:10.2307/3808521.
Pease, J.L., Vowles, R.H., and Keith, L.B. 1979. Interaction of snowshoe hares andwoody vegetation. J. Wildl. Manage. 43(1): 43–60. doi:10.2307/3800634.
Ranta, E., Kaitala, V., and Lundberg, P. 1997. The spatial dimension in popu-lation fluctuations. Science, 278(5343): 1621–1623. doi:10.1126/science.278.5343.1621.
Ranta, E., Lundberg, P., and Kaitala, V. 2006. Ecology of populations. CambridgeUniversity Press, Cambridge.
Reichardt, P.B. 1981. Papyriferic acid: a triterpenoid from Alaskan paper birch.J. Org. Chem. 46(22): 4576–4578. doi:10.1021/jo00335a054.
Reichardt, P.B., Bryant, J.P., Clausen, T.P., and Wieland, G.D. 1984. Defense ofwinter-dormant Alaska paper birch against snowshoe hares. Oecologia, 65(1):58–69. doi:10.1007/BF00384463.
Reichardt, P.B., Green, T.P., and Chang, S. 1987. 3-O-Malonylbetulafolientrioloxide I from Betula nana subsp. exilis. Phytochemistry, 26(3): 855–856. doi:10.1016/S0031-9422(00)84806-2.
Schaffer, W.M. 1984. Stretching and folding in lynx fur returns: evidence for astrange attractor in nature? Am. Nat. 124(6): 798–820. doi:10.1086/284318.
Sheriff, M.J., Krebs, C.J., and Boonstra, R. 2010. The ghosts of predators past:population cycles and the role of maternal programming under fluctuatingpredation risk. Ecology, 91(10): 2983–2994. doi:10.1890/09-1108.1. PMID:21058558.
Sinclair, A.R.E., Krebs, C.J., Smith, J.N.M., and Boutin, S. 1988. Population biologyof snowshoe hares. III. Nutrition, plant secondary compounds and food lim-itation. J. Anim. Ecol. 57(3): 787–806. doi:10.2307/5093.
Smith, J.N.M., Krebs, C.J., Sinclair, A.R.E., and Boonstra, R. 1988. Populationbiology of snowshoe hares. II. Interactions with winter food plants. J. Anim.Ecol. 57(1): 269–286. doi:10.2307/4778.
Stocks, B.J., Mason, J.A., Todd, J.B., Bosch, E.M., Wotton, B.M., Amiro, B.D.,Flannigan, M.D., Hirsch, K.G., Logan, K.A., Martell, D.L., and Skinner, W.R.2002. Large forest fires in Canada, 1959–1997. J. Geophys. Res. Atmos. 107(D1):8149. doi:10.1029/2001JD000484.
Williams, D.E., Sinclair, A.R.E., and Andersen, R.J. 1992. Triterpene constituentsof the dwarf birch, Betula glandulosa. Phytochemistry, 31(7): 2321–2324. doi:10.1016/0031-9422(92)83272-Z.
Wolff, J.O. 1980. The role of habitat patchiness in the population dynamics ofsnowshoe hares. Ecol. Monogr. 50(1): 111–130. doi:10.2307/2937249.
1048 Can. J. Zool. Vol. 92, 2014
Published by NRC Research Press
Can
. J. Z
ool.
Dow
nloa
ded
from
ww
w.n
rcre
sear
chpr
ess.
com
by
Uni
vers
ity o
f B
ritis
h C
olum
bia
on 1
1/17
/14
For
pers
onal
use
onl
y.


![[TS I-3A.4] Cyclic plastic deformation behaviour of PHT ...eprints.nmlindia.org/4627/1/SMiRT_2011_Shiva... · Figure 1: Cyclic hardening: strain amplitude versus number of cycles](https://img.pdfslide.us/doc/110x75/5f5e0c12dd3c8c6da904c349/ts-i-3a4-cyclic-plastic-deformation-behaviour-of-pht-figure-1-cyclic-hardening.jpg)