Embed Size (px)
Citation preview
What drives remittance inflows to Sub-Saharan
Africa: A Dynamic Panel Approach
Francis M. Kemegue, Emmanuel Owusu-Sekyere and Reneé van Eyden
Working paper 262
December 2011
What drives remittance inflows to Sub-Saharan Africa: Adynamic panel approach
Francis M. Kemegue, Emmanuel Owusu-Sekyere∗and Reneé van Eyden†
December 22, 2011
Abstract
This paper investigates the factors that drive and constrain remittance inflows into SubSaha-ran Africa (SSA) using annual data for 35 SSA countries from 1980 to 2008, generalised methodof moments by Arellano and Bover (1995) and LSDV with Driscoll and Kraay (1998) correctedstandard errors. We find that when cross-sectional dependence of the error term and individ-ual effects are controlled for, host country economic conditions override home country income indriving remittances to SSA The quality of financial service delivery and investment opportunitiesin the home country and exchange rate considerations are also significant to remittance inflowsto SSA. This is more consistent with self interest motives for remittance inflows than altruism.However there are country level differences.
Keywords: migration, remittances, Sub-Saharan AfricaJEL Classification: F22, F24, O55
1 IntroductionThe issue of migration is at the core of global policy dialogue today as developed countries grapplewith unexpected arrivals of migrants from different countries and by various means. SubSaharanAfrica (SSA), one of the poorest and economically deprived regions of the world is no exception tothis trend. SubSaharan Africa lags behind in several human development indicators as compared toother developing regions (Human Development Indicators, 2009). These factors among others haveresulted in consistent migration of both skilled and unskilled labour in search of better working andliving conditions. The heaviest toll of this brain drain is mostly felt in the health and educationsectors of SubSaharan African countries (Kapur, 2005).One of the outcomes of migration is remittance inflows, which has emerged as both a positive and
negative externality to the migration epidemic and consequently one of the key links between humanmobility and development. Its current levels in excess of Official Development Assistance (ODA),portfolio investments and in some cases Foreign Direct Investment (FDI), and its characteristicsand diverse economic impact on recipient economies have resulted in increased research and policyinterest over the last two decades.In terms of levels, remittances to developing countries as at end 2008, stood at 330 billion
US dollars, thrice the value of official development assistance and also exceeded 10% of GDP in23 developing countries worldwide (Mohapatra et al., 2009). In Sub-Saharan Africa remittanceinflows have steadily increased from 1.4 billion US dollars in 1980 to 21.3 billion US dollars in 2008,approximately 2.2% of the regional GDP (World Bank, 2008).Regarding its characteristics, remittances have been found to be relatively more stable than
other forms of foreign inflows (Ratha, 2003) even during the recent global financial crisis. Contrary
∗Corresponding author. E-mail: [email protected]†Department of Economics and Management Sciences, University of Pretoria, Pretoria 0002, South Africa.
1
to a projected decline of 6.7% between 2007 and 2008, remittance inflows to developing countriesincreased by 28% from 265 billion US dollars in 2007 to 338 billion US dollars in 2008, and declinedby a meager 6% to 316 billion US dollars from 2008 to 2009. FDI on the other hand fell byapproximately 30% coupled with a total collapse in private portfolio investment and scarce donorfunds to developing countries due to the credit crunch during this period (World Bank, 2010).Remittances are also unrequited funds, thus they do not result in any contractual or debt servicingobligations (Kapur, 2005). Furthermore, unlike other forms of foreign inflows, remittances arenot usually withdrawn ex-post from a recipient economy. Consequently, they have been found tosometimes mitigate volatility and reversibility in other capital inflows (Bugamelli and Patterno,2006).With respect to its economic impact, remittances have emerged as both a positive and negative
externality to migration. As a positive externality, remittances have been found to smooth con-sumption and income for households thereby reducing poverty (Ratha, 2003). Remittances havecontributed to employment creation by providing capital for microenterprises (Woodruff and Zen-teno, 2000). In countries with underdeveloped financial systems remittance inflows have enhancedaccess to finance for the poor and financially excluded (Gupta et al., 2007). Furthermore, remit-tances have increased economic growth by providing finance for investment (Guiliano and Ruiz-Arranz, 2005). Due to the multiplier effect of remittance inflows, non-recipient households havealso benefited indirectly through labour income and payment for goods and services by recipienthouseholds (Durand et al., 1986). Remittances have served as a vital source of foreign exchange forsome developing countries in the Euro-Mediterranean region, improved their sovereign rating andenhanced their access to international capital markets to raise finance for development (Herzberg,2006).As a negative externality remittance inflows have been known to widen the poverty gap due to
the creation of pockets of more affluent remittance receiving households in relatively poor neigh-bourhoods (Carrasco and Ro, 2007). Recipient households have sometimes supplied less labour thannon-recipient households, thereby aggravating unemployment (Funkhouser, 1992; Amuedo-Dorantesand Pozo, 2004). From the labour supply perspective remittance inflows have been found to reduceeconomic growth (Chami et al., 2003). Most remittances are spent on consumption goods, therebygenerating inflationary pressures on the domestic economy (Gupta et al., 2007). Remittances couldalso appreciate the domestic exchange rate in small open economies. This adversely affects exportcompetitiveness thereby worsening the current account deficit (Corden and Neary, 1982). As a resultof high transaction costs, eligibility and identification constraints, informal channels are often usedby migrants to remit home. This remains a major policy challenge worldwide with serious implica-tions for money laundering, terrorism finance, illegal foreign exchange markets and fraud (Pearce,2006).These trends, characteristics and varying economic impact of remittances have generated sub-
stantial research and policy interest. The aim is to ascertain the specific impact of remittance inflowson various regions and corridors and how the benefits of these inflows could be optimised whiles ef-fectively addressing the associated negative externalities. This research posits that a critical stepto achieving this is to first of all establish which factors drive and constrain these inflows and howremittance inflows respond to changes in these factors. Countries which have been able to achievethis critical step have realised substantial net benefits from remittance inflows by implementing thenecessary regulatory, market and technological reforms at the required levels (Ratha, 2006; Ketley,2006; Herzberg, 2006).SubSaharan Africa lags woefully behind other regions in efforts at effectively harnessing the
benefits of remittance inflows whiles minimising negative externalities associated therewith. This hasbeen attributed to several factors such as inadequate awareness of the drivers and constraints to theseinflows through formal channels, overregulation, underdeveloped financial systems and markets,lack of the requisite structures and enabling environment. (Ketley, 2006; Bokkerind, 2006; Bester,2006). Consequently, SubSaharan Africa receives only 5% of formal global remittances to developing
2
countries as compared to 25% that goes to Latin America, 14.4% to the Middle East and NorthAfrica, 24% to East Asia and Pacific, 20% to South Asia and 13% to East and Central Asia. Informalinflows to Sub-Saharan Africa have been estimated to be 45 to 65% of formal inflows, as comparedto 5 to 20% for Latin America (IMF BOPSY, 2006; Freud and Spatafora, 2005).The objective of this paper therefore is to investigate which factors drive and constrain remittance
inflows into SubSaharan Africa and how remittances respond to changes in these factors. We findthat when cross-sectional dependence of the error term and individual effects are controlled for, hostcountry economic conditions are a stronger driver of remittance inflows to SSA than home countryincome. This aligns with earlier findings of Huang and Vargas Silva (2006) for 11 Latin Americanand the Caribbean countries. The quality of financial service delivery in the home country is key tothe ability of SSA countries mitigating the use of informal channels and harnessing remittances formore productive uses. SSA migrants would respond to investment opportunities in the home country(denoted by higher home country interest rates) conditional on a strong exchange rate since returnson investment are assumed to be in home country currency units. This is more consistent with selfinterest motives for remittances than altruism. This finding also modifies Katseli and Glystos (1986)who found no relationship between home country interest rates and remittance inflows, and alignswith earlier finding by Higgins et al. (2004) that exchange rate considerations as a measure of riskis a determining factor in remittance inflows to developing countries. There are also country specificdifferences which imply that policies aimed at maximising the benefits of remittance inflows woulddiffer between countriesThe rest of this paper is organised as follows: section 2 reviews the related literature and details
the theoretical framework, section 3 describes the data and methodology used, section 4 discussesempirical results and section 5 the addresses the conclusion, policy implications and future research.
2 Related LiteratureThe literature identifies two main reasons why migrants remit money home which are altruism andselfinterest motives. Altruism refers to the migrant’s assistance to the family back home to meetbasic family needs (Chami et al., 2005) whiles self?interest motives refer to returnsseeking purposesfor remitting back home (Docquier et al. 2006). Remittance inflows sometimes involve a complexarrangement that incorporate features of both self interest and altruism such as risk diversification,consumption smoothing and intergenerational financing of investments (Docquier and Rapoport,2006). Migrants also remit home, aimed at maintaining good family ties to improve their standingfor inheritance purposes or ensure that their assets back home are properly taken care of. This isreferred to as “enlightened self interest” (Lucas and Stark, 1985).Remittances are also sent by migrants to reimburse their families for the cost of migration and
education abroad and also serves as a co?insurance mechanism in which remittances sent home helpsto support the migrant’s family in times of crisis. This is based on the assumption that crisis times inthe host and home countries are negatively correlated. Conversely for the migrant, having a familydoing well back home to return to if need be is reassuring as “bad times” could also occur in thehost country (Solimano, 2003; Addison, 2004).Differences in patterns of migration have also been found to impact on migrant remittances
with temporary migrants more geared towards returns?seeking purposes whiles permanent migrantsdisplay more altruistic behaviour (Glystos, 1997). Additionally, the degree of integration betweenthe economies of host and home countries also plays a role. Where the degree of integration is high,an improvement in the host country’s economic conditions results in some improvement in homecountry economic conditions. Consequently, although the income position of the migrant mighthave improved, from the altruistic perspective it does not trigger increased remittances back homesince economic conditions of the migrant’s family back home might also have improved (Coulibaly,2009).
3
There is also the portfolio allocation choice perspective in which investment opportunities inthe home country drive remittance inflows (Katseli and Glystos, 1986). Consequently, such inflowsare influenced by the interest rate differential between home and host country, exchange rate ex-pectations, institutional quality and economic policies in the home country. This is based on theassumption that the migrant maximises the total returns on his portfolio in the home country cur-rency units. The relationship between the host country interest rate and remittance inflows a priori,has been found to be ambiguous. In the short run, an increase in the host country interest rates couldcause the migrant to increase his investments in the host country, adversely affecting remittancessent back home. However in the medium to long term, returns on his investments would improvehis level of income and wealth, which is likely to have a positive impact on remittances sent home.In terms of high home country interest rates Katseli and Glystos (1986) found no relationship withremittance inflows.The factors that drive remittance inflows into Sub-Saharan Africa as well as specific corridors
within Sub-Saharan Africa have been addressed to a much lesser extent than other foreign inflowssuch as FDI, aid and portfolio investments (Opoku-Afari et al. 2004; Quartey and Blankson 2004;Sackey, 2001). However this is not the first paper to address the determinants of remittance inflowsinto Sub-Saharan Africa. Recently, the determinants and macroeconomic impact of remittanceinflows have been looked at by Singh et al. (2010) for 36 Sub-Saharan African countries from1990 to 2005. Using fixed effects/fixed effects 2SLS they found that remittances to Sub-SaharanAfrica were largely altruistic in nature, consistent with the countercyclicality literature on remittanceinflows, and that countries with more citizens in the diaspora or in wealthier host countries receivedmore remittance inflows. Singh et al. (2010) also found that although remittances negatively affectedeconomic growth countries with well functioning domestic institutions were better placed to optimisethe benefits of remittance inflows towards enhancing economic growth.Using annual data from 1980 to 2008, this paper seeks to add to scarce literature on remittance
inflows to Sub-Saharan Africa by determining which of these factors identified in the literature driveremittances into Sub-Saharan Africa and how remittances respond to changes in these factors. Thispaper further seeks to ascertain whether remittances to Sub-Saharan Arica are predominantly drivenby altruism or self-interest motives.We differ from most previous work by testing for cross-sectional dependence between the countries
in the panel using the Pesaran (2004) CD test1 and controlling for it with Driscoll and Kraay(1998) robust standard errors, thereby addressing one major critique of panel data estimations.Cross-sectional dependence implies that the error term is contemporaneously correlated across cross-sections. In the presence of cross sectional dependence of the error terms, methods that assume crosssectional independence would result in estimators that are inefficient with biased standard errors,which leads to misleading inference. Consequently panel data estimations using instrumental variableand generalised method of moments approaches would provide very little efficiency gain over OLSestimators (Coakley et al. 2002; Baltagi, 2008; Phillips and Sul 2003). Thirdly, the use of real GDPper capita alone as a measure of host country economic conditions is also improved on in this paper.Using a similar approach as in Huang and Vargas-Silva (2006) we measure host country economicconditions using a composite variable created by principal component analysis. It consists of thereal GDP per capita, end of period inflation rate, M2 and the Federal Fund Rate (FFR) of the US.The basis for this is that the rate of inflation affects the migrant’s cost of living in the host country.Real GDP per capita is an acceptable measure of income level in the host country. The FFR isa policy signal of the cost of borrowing or returns on investment whiles M2 measures the depositgathering ability or quality of financial service delivery in the host country which has a bearing onthe migrant’s access to finance. These variables together better captures the economic conditions ofthe migrant in the host country his level of income, his portfolio allocation choices between the hostand home countries and therefore his ability to remit back home.
1The properties of other tests such as the Frees (1995) test and Friedman (1937) test for cross sectional dependenceare suited for static panel data estimations and not dynamic panel estimations.
4
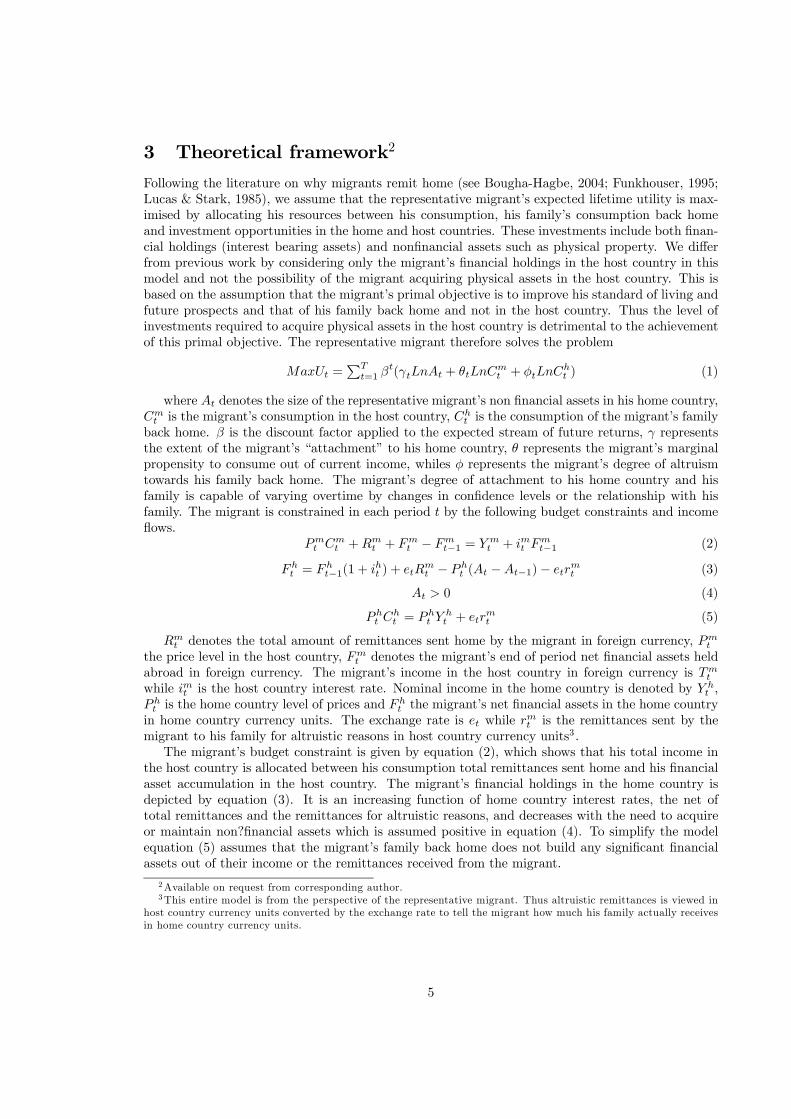
3 Theoretical framework2
Following the literature on why migrants remit home (see Bougha-Hagbe, 2004; Funkhouser, 1995;Lucas & Stark, 1985), we assume that the representative migrant’s expected lifetime utility is max-imised by allocating his resources between his consumption, his family’s consumption back homeand investment opportunities in the home and host countries. These investments include both finan-cial holdings (interest bearing assets) and nonfinancial assets such as physical property. We differfrom previous work by considering only the migrant’s financial holdings in the host country in thismodel and not the possibility of the migrant acquiring physical assets in the host country. This isbased on the assumption that the migrant’s primal objective is to improve his standard of living andfuture prospects and that of his family back home and not in the host country. Thus the level ofinvestments required to acquire physical assets in the host country is detrimental to the achievementof this primal objective. The representative migrant therefore solves the problem
MaxUt =PT
t=1 βt(γtLnAt + θtLnC
mt + φtLnC
ht ) (1)
where At denotes the size of the representative migrant’s non financial assets in his home country,Cmt is the migrant’s consumption in the host country, Ch
t is the consumption of the migrant’s familyback home. β is the discount factor applied to the expected stream of future returns, γ representsthe extent of the migrant’s “attachment” to his home country, θ represents the migrant’s marginalpropensity to consume out of current income, whiles φ represents the migrant’s degree of altruismtowards his family back home. The migrant’s degree of attachment to his home country and hisfamily is capable of varying overtime by changes in confidence levels or the relationship with hisfamily. The migrant is constrained in each period t by the following budget constraints and incomeflows.
Pmt Cm
t +Rmt + Fm
t − Fmt−1 = Y m
t + imt Fmt−1 (2)
Fht = Fh
t−1(1 + iht ) + etRmt − Ph
t (At −At−1)− etrmt (3)
At > 0 (4)
Pht C
ht = Ph
t Yht + etr
mt (5)
Rmt denotes the total amount of remittances sent home by the migrant in foreign currency, Pm
t
the price level in the host country, Fmt denotes the migrant’s end of period net financial assets held
abroad in foreign currency. The migrant’s income in the host country in foreign currency is Tmt
while imt is the host country interest rate. Nominal income in the home country is denoted by Y ht ,
Pht is the home country level of prices and F
ht the migrant’s net financial assets in the home country
in home country currency units. The exchange rate is et while rmt is the remittances sent by themigrant to his family for altruistic reasons in host country currency units3.The migrant’s budget constraint is given by equation (2), which shows that his total income in
the host country is allocated between his consumption total remittances sent home and his financialasset accumulation in the host country. The migrant’s financial holdings in the home country isdepicted by equation (3). It is an increasing function of home country interest rates, the net oftotal remittances and the remittances for altruistic reasons, and decreases with the need to acquireor maintain non?financial assets which is assumed positive in equation (4). To simplify the modelequation (5) assumes that the migrant’s family back home does not build any significant financialassets out of their income or the remittances received from the migrant.
2Available on request from corresponding author.3This entire model is from the perspective of the representative migrant. Thus altruistic remittances is viewed in
host country currency units converted by the exchange rate to tell the migrant how much his family actually receivesin home country currency units.
5
Let λ1,t, λ2,t and λ3,t be the Lagrangian multipliers for constraints (2), (3) and (5). The La-grangian for optimizing equation (1) is given by
L =PT
t=1 βt[(γtLnAt + θtLnC
mt + φtLnC
ht ) + λ1,t(Y
mt + imt F
mt−1 − Pm
t Cmt −Rm
t − Fmt + Fm
t−1) +
λ2,t(−Fht + Fh
t−1(1 + iht ) + etRmt − Ph
t (At −At−1)− etrmt ) + λ3,t(P
ht Y
ht + etr
mt − Ph
t Cht )] (6)
From first order conditions and at the optimum4
θtCht P
ht = etP
mt Cm
t φt (7)
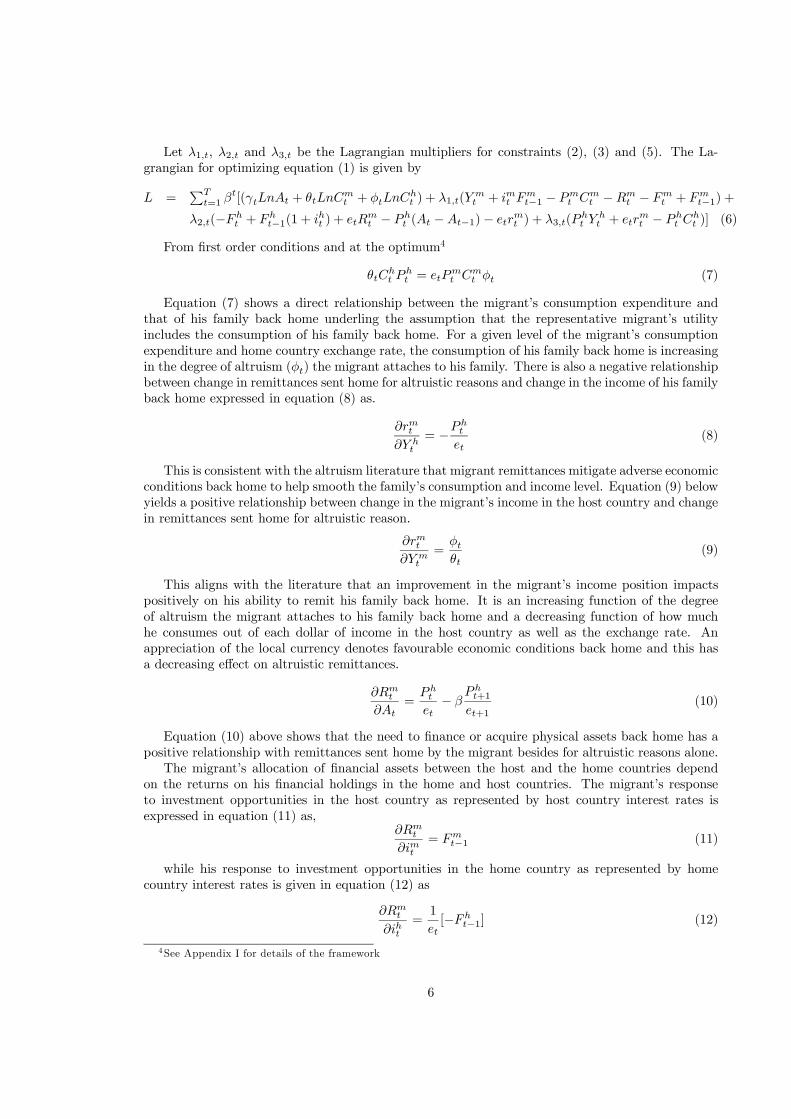
Equation (7) shows a direct relationship between the migrant’s consumption expenditure andthat of his family back home underling the assumption that the representative migrant’s utilityincludes the consumption of his family back home. For a given level of the migrant’s consumptionexpenditure and home country exchange rate, the consumption of his family back home is increasingin the degree of altruism (φt) the migrant attaches to his family. There is also a negative relationshipbetween change in remittances sent home for altruistic reasons and change in the income of his familyback home expressed in equation (8) as.
∂rmt∂Y h
t
= −Pht
et(8)
This is consistent with the altruism literature that migrant remittances mitigate adverse economicconditions back home to help smooth the family’s consumption and income level. Equation (9) belowyields a positive relationship between change in the migrant’s income in the host country and changein remittances sent home for altruistic reason.
∂rmt∂Y m
t
=φtθt
(9)
This aligns with the literature that an improvement in the migrant’s income position impactspositively on his ability to remit his family back home. It is an increasing function of the degreeof altruism the migrant attaches to his family back home and a decreasing function of how muchhe consumes out of each dollar of income in the host country as well as the exchange rate. Anappreciation of the local currency denotes favourable economic conditions back home and this hasa decreasing effect on altruistic remittances.
∂Rmt
∂At=
Pht
et− β
Pht+1
et+1(10)
Equation (10) above shows that the need to finance or acquire physical assets back home has apositive relationship with remittances sent home by the migrant besides for altruistic reasons alone.The migrant’s allocation of financial assets between the host and the home countries depend
on the returns on his financial holdings in the home and host countries. The migrant’s responseto investment opportunities in the host country as represented by host country interest rates isexpressed in equation (11) as,
∂Rmt
∂imt= Fm
t−1 (11)
while his response to investment opportunities in the home country as represented by homecountry interest rates is given in equation (12) as
∂Rmt
∂iht=1
et[−Fh
t−1] (12)
4See Appendix I for details of the framework
6
Thus from equations (A.26) and (A.27) the theoretical framework indicates that an increase inhost country interest rates has a positive impact on remittances sent home. An increase in homecountry interest rates will result in a decline in remittance inflows. This is because it is furtherconditional on exchange rate expectations since returns on investments are assumed to be in homecountry currency units (Katseli and Glystos, 1986; Higgins 2004).
4 Data and methodologyTable 1 below details the data used and how variables are measured. Data on all variables for the35 Sub-Saharan African5 countries included in the panel are obtained from the World DevelopmentIndicators of the World Bank, complimented with data from the International Monetary Fund.
4.1 Descriptive statistics and stylised facts
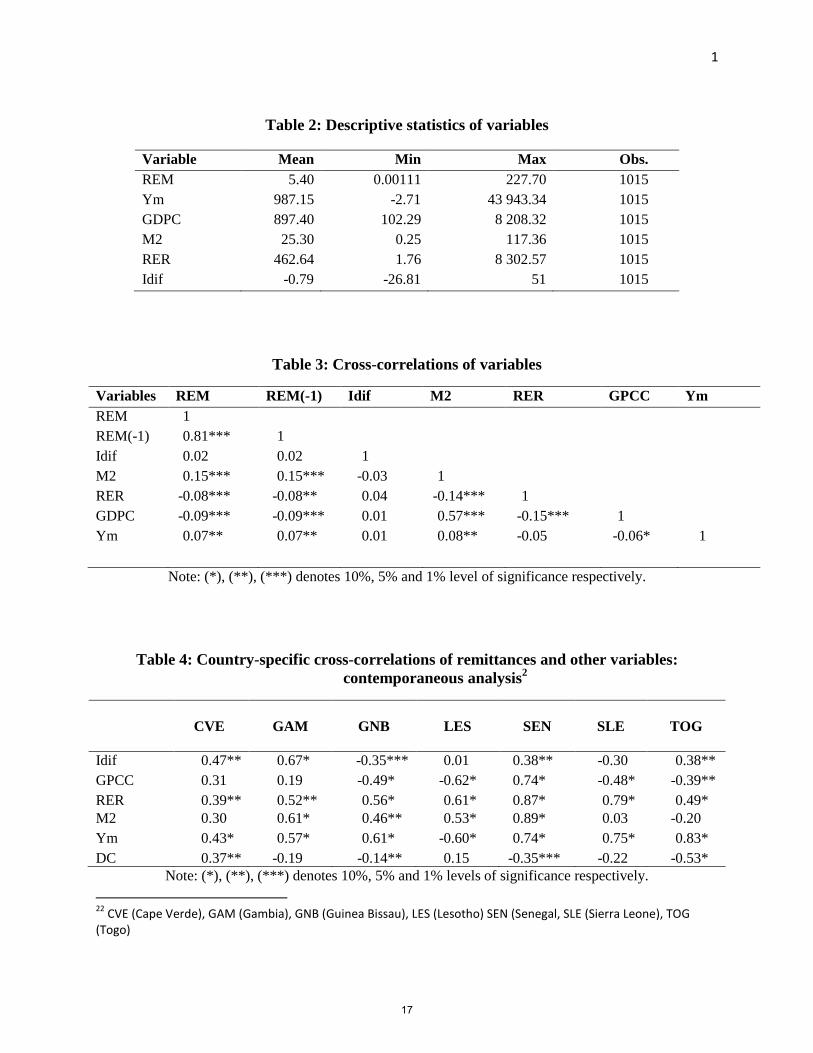
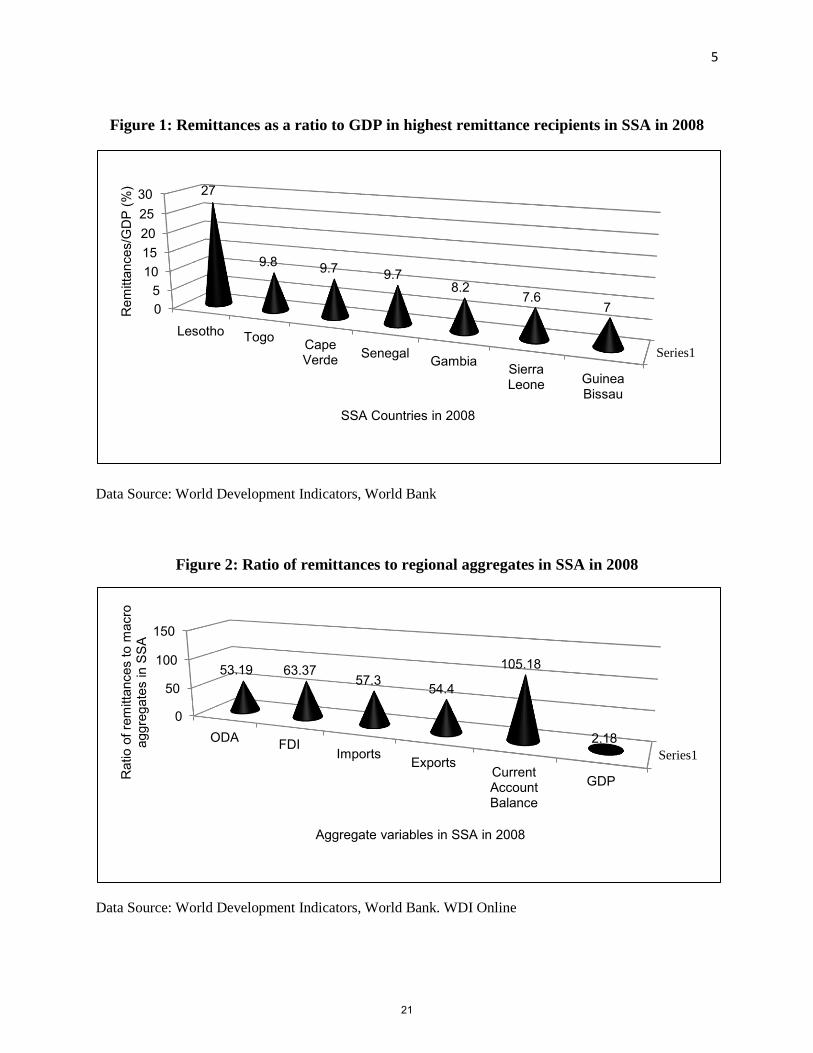
Table 2 contains a summary of descriptive statistics of variables used in this study. Remittanceas a percentage of real GDP per capita averaged 5.4% in SubSaharan Africa from 1980 to 2008.However certain countries exceeded the regional average. Remittances to Lesotho as a percentageof GDP averaged 58.7% over the period, followed by Cape Verde 12.2% and Swaziland 7.1%. WestAfrica generally registered higher remittance inflows as a percentage of GDP (between 3.3% and4.3%) than East and Southern Africa (between 0.6% to 2.5%, and 0.02% to 1.8%, respectively). It isknown that West Africa generally registers lower economic growth levels and higher rates of inflationthan Southern and Eastern African countries. This trend is consistent with the altruism literaturethat bad economic conditions attract more remittance inflows from migrants. M2 as a percentageof GDP averaged 25.3% across the period.As a ratio to GDP in 2008, remittances to Lesotho ranks highest at 27% of GDP. Togo, Cape
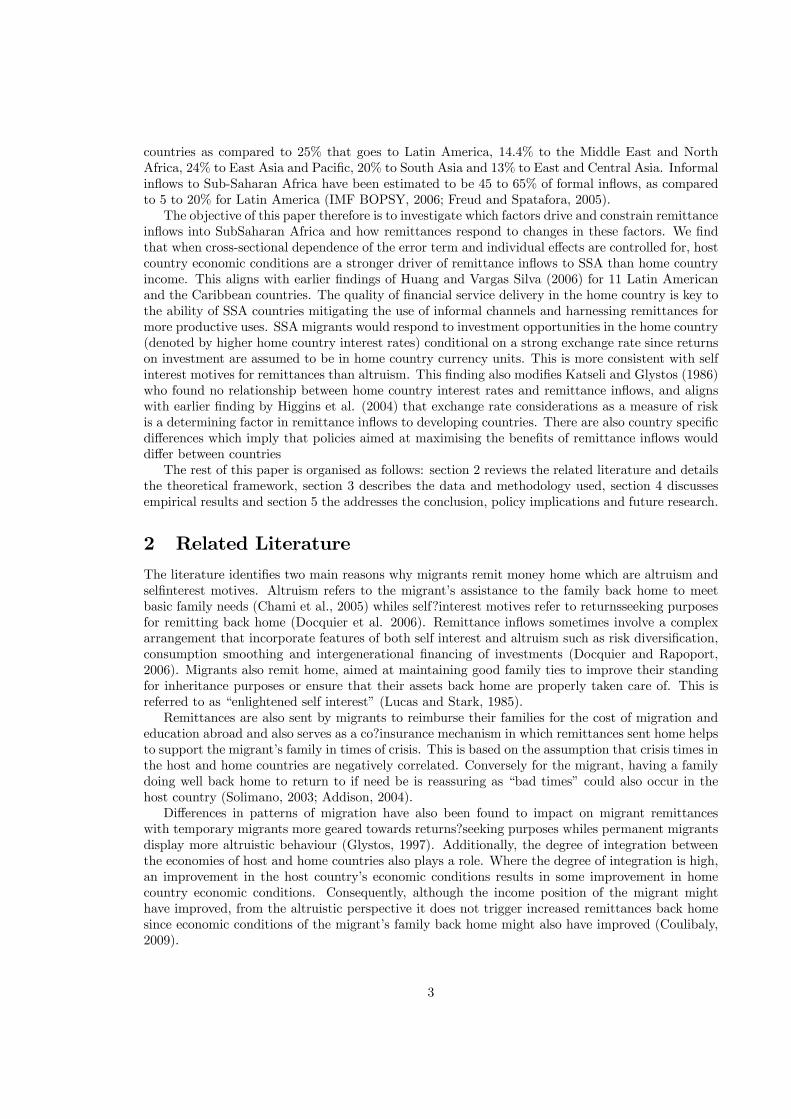
Verde and Senegal follow with approximately 10% of GDP, The Gambia 8.2%, Sierra Leone 7.6%,and Guinea Bissau 7% (World Bank, 2009). Figure 1 depicts remittances as a ratio to GDP in the7 highest remittance recipient countries in Sub-Saharan Africa in 2008.As at end 2008, remittances to Sub-Saharan Africa were 53% of ODA and 63% of FDI to the
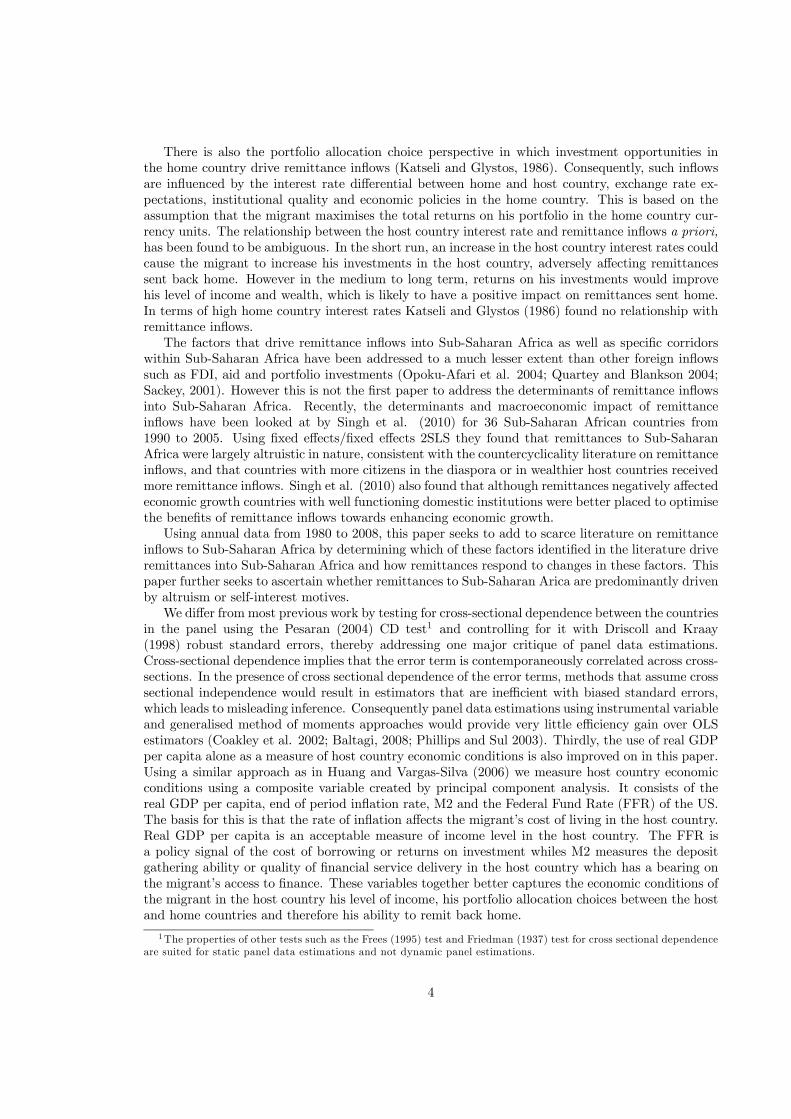
region (Figure 2). As at end 2008, remittance inflows to Sub-Saharan Africa were 54% and 57% ofregional exports and imports respectively and exceeded the regional current account surplus by 5%.This underlines the relevance of remittance inflows to the balance of payments and its potential tosupplement financing of the external gap in recipient countries and regions.
4.2 Cross-correlation analysis
Cross-correlation analysis is used to ascertain the correlation between remittances and the othervariables. From Table 3 remittances are negatively correlated with real GDP per capita in the homecountry and statistically significant at the 1% level.This is consistent with the altruism literature that remittance inflows mitigate economic down-
turns in the home country. Host country economic conditions are positively correlated with remit-tance inflows and statistically significant at the 5% level, denoting that Sub-Saharan Africa migrantsremit more when an improvement in host country economic conditions improves their income po-sitions. M2 is positively correlated with remittance inflows at the 1% level. This underlines therelevance of the quality of financial services to formal remittance inflows and confirms the litera-ture that countries with quality institutions and welldeveloped financial sectors are better placed toreceive more remittances through formal channels and thereon harness them for more productive
5Benin, Burundi, Botswana, Burkina Faso, Cameroun, Cape Verde, Comoros, Cote D’Ivoire, Ethiopia, Gabon,The Gambia, Ghana, Guinea, Guinea-Bissau, Kenya, Lesotho, Madagascar, Malawi, Mali, Mauritius, Mauritania,Mozambique, Niger, Nigeria, Republic of Congo, Rwanda, Senegal, Seychelles, Sierra Leone, Swaziland, South Africa,Tanzania, Togo, Uganda, Zambia.
7
uses (Singh et al. 2010). There is also a negative and statistically significant correlation betweenremittances and the real exchange rate. This needs to be interpreted cautiously. An increase inthe real exchange rate which denotes a depreciation of home country currency is associated withadverse economic trends and would therefore have a positive relationship with altruistic remittanceinflows and a negative relationship with selfinterest/returnsseeking inflows. On the contrary, a de-crease in the real exchange rate which denotes an appreciation and consequently strong economicfundamentals would have a positive relationship with self?interest remittance inflows. The interestrate differential is positively correlated with remittances but statistically insignificant.Besides these general trends, there are country-specific differences Focusing on the seven highest
recipient countries of remittances as a percentage of GDP in Sub-Saharan Africa in 2008 we reporton some of these differences. First of all the crosscorrelation coefficients are much higher than in thesample wide analysis.Table 4 uses the sign, magnitude and significance of the correlation coefficients as a proxy to
determine the main driver of remittance inflows to each country. For Lesotho the negative and highcorrelation between remittances and home country income denotes strong altruistic patterns. ForTogo and Guinea Bissau the positive and high correlation between remittances and host countryincome shows that host country economic conditions is the key factor to remittance inflows to thesetwo countries. Similarly, investment opportunities in the home country evidenced by the positivecorrelation between remittances and the interest rate differential mainly drives remittances to CapeVerde and Gambia. Exchange rate expectations and host country income feature strongly for SierraLeone and Senegal, however for Senegal, the quality of the financial services sector ranks highestamong the other variables. This can be seen from the high and positive correlation between M2 andremittance inflows to Senegal. These results give useful insight into what the policy target shouldbe in each of the respective countries in their efforts to harness remittance inflows as an additionalsource of external finance for development.Since correlation does not necessarily imply causality there is the need to ascertain these trends
empirically. We also need to establish that the relationships derived from the theoretical frameworkare consistent with an empirical estimation of the data
4.3 Model specification and estimation technique
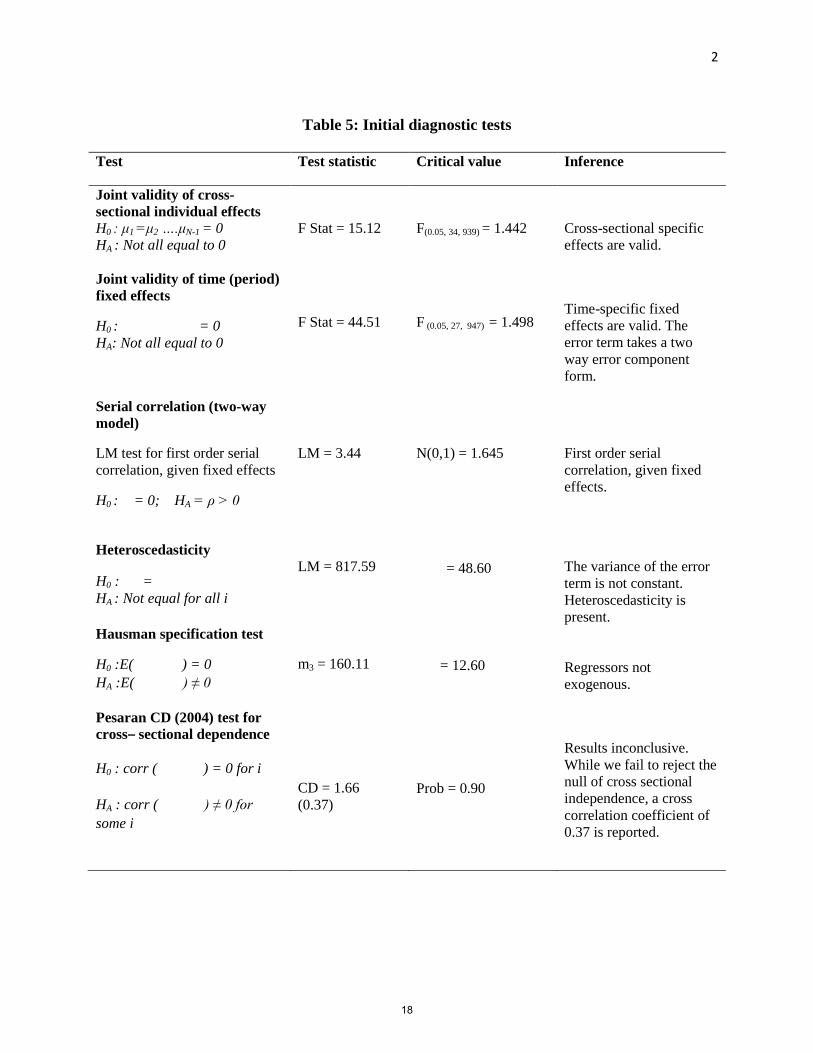
As a result of the strong persistence behaviour of remittance inflows the model is specified as adynamic panel model which includes one or more lags of the dependent variable. Tests for jointvalidity of individual effects reveal that both cross-sectional and time specific effects are valid. Table5 below details the results of initial diagnostic tests performed on pooled OLS and fixed effectsmodels.Consequently the error term takes a two-way error component form and the model is specified
asyit = δyi,t−1 +Xitβ + μi + λt + vit (13)
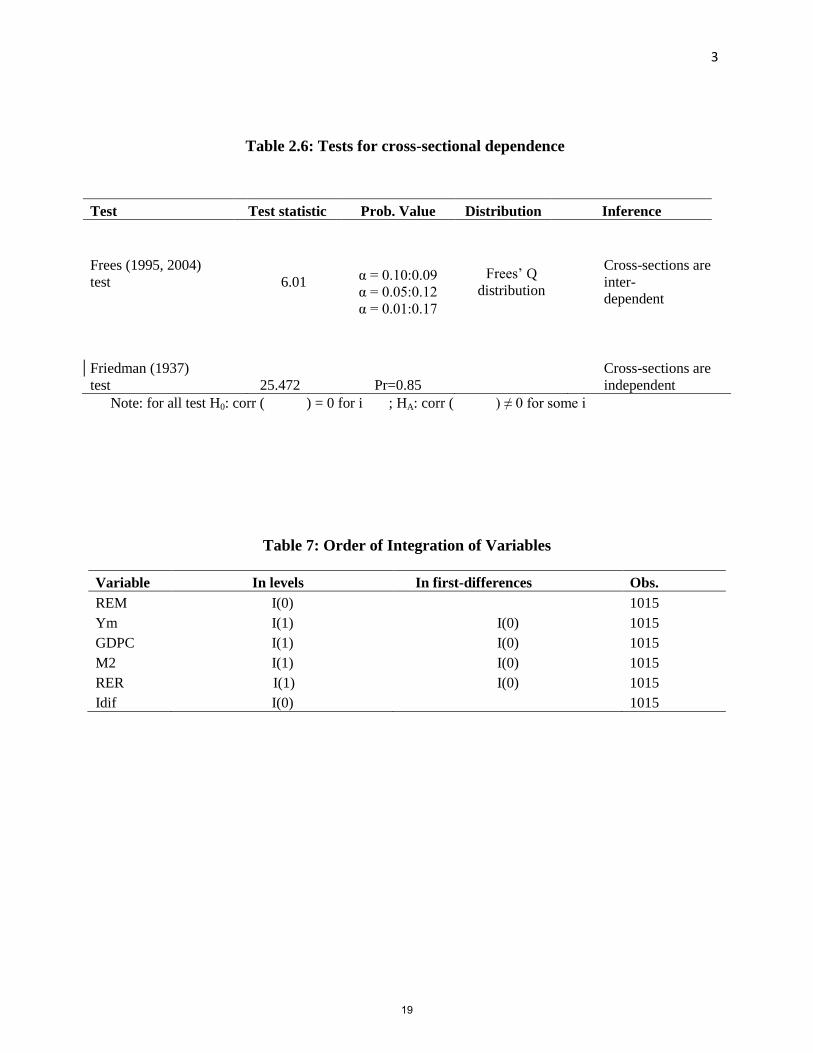
where μi represent country-specific effects, λt time specific effects and vit the idiosyncratic errorterm. Tests for cross-sectional dependence of the error terms using the Pesaran (2004) CD test showsa correlation coefficient of 0.37 of the error term across cross sections although we fail to reject thenull of crosssectional independence. For robustness Frees (1995) test rejects the null of crosssectionalindependence. It is however recognised in this study that the suitability of the Frees (1995) test fordynamic panel estimations has not yet been empirically ascertained (De Hoyos and Sarafidis, 2006).Thus on the basis of both tests we accept that there is some degree of cross-sectional dependence ofthe error term across cross-sections6 To determine the order of integration of the variables we takepreference to unit root methods that assume individual unit root processes due to the validity of
6As a result of the correlation coefficient returned by the Pesaran (2004) Test and the results of the Frees (1995)test we control for the existence of cross sectional dependence with a LSDV estimation using the Driscoll and Kraay(1998) robust standard errors.
8
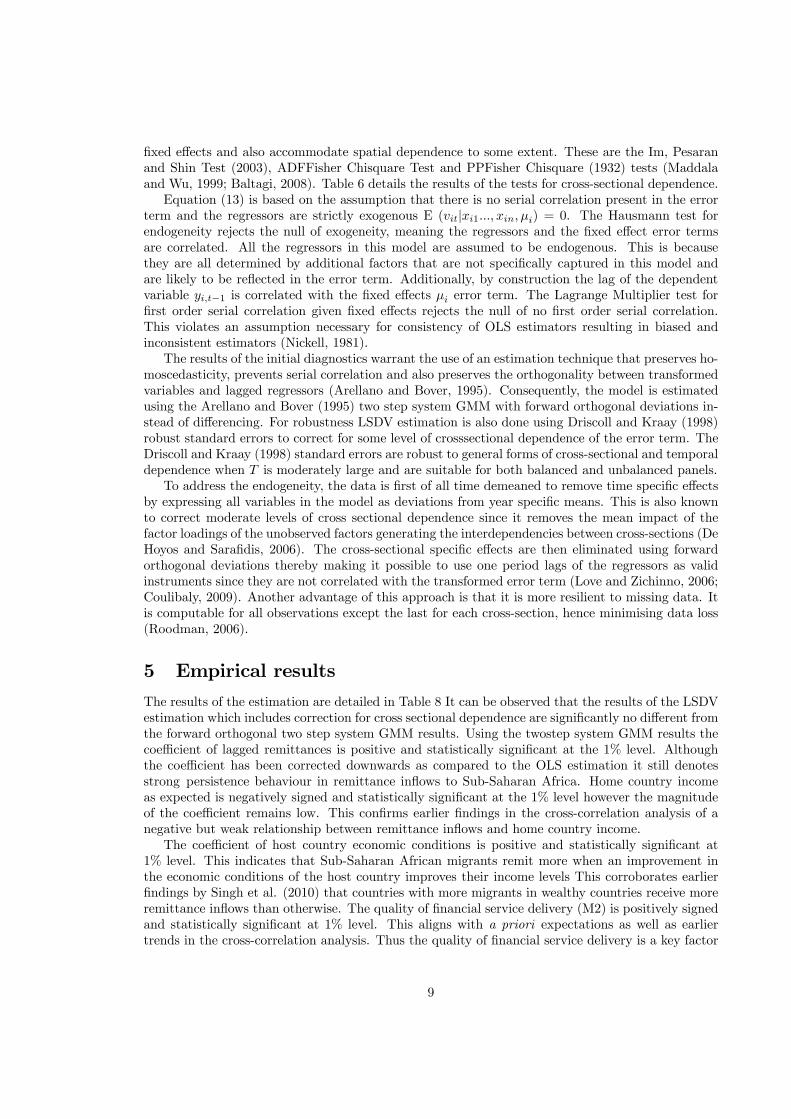
fixed effects and also accommodate spatial dependence to some extent. These are the Im, Pesaranand Shin Test (2003), ADFFisher Chisquare Test and PPFisher Chisquare (1932) tests (Maddalaand Wu, 1999; Baltagi, 2008). Table 6 details the results of the tests for cross-sectional dependence.Equation (13) is based on the assumption that there is no serial correlation present in the error
term and the regressors are strictly exogenous E (vit|xi1..., xin, μi) = 0. The Hausmann test forendogeneity rejects the null of exogeneity, meaning the regressors and the fixed effect error termsare correlated. All the regressors in this model are assumed to be endogenous. This is becausethey are all determined by additional factors that are not specifically captured in this model andare likely to be reflected in the error term. Additionally, by construction the lag of the dependentvariable yi,t−1 is correlated with the fixed effects μi error term. The Lagrange Multiplier test forfirst order serial correlation given fixed effects rejects the null of no first order serial correlation.This violates an assumption necessary for consistency of OLS estimators resulting in biased andinconsistent estimators (Nickell, 1981).The results of the initial diagnostics warrant the use of an estimation technique that preserves ho-
moscedasticity, prevents serial correlation and also preserves the orthogonality between transformedvariables and lagged regressors (Arellano and Bover, 1995). Consequently, the model is estimatedusing the Arellano and Bover (1995) two step system GMM with forward orthogonal deviations in-stead of differencing. For robustness LSDV estimation is also done using Driscoll and Kraay (1998)robust standard errors to correct for some level of crosssectional dependence of the error term. TheDriscoll and Kraay (1998) standard errors are robust to general forms of cross-sectional and temporaldependence when T is moderately large and are suitable for both balanced and unbalanced panels.To address the endogeneity, the data is first of all time demeaned to remove time specific effects
by expressing all variables in the model as deviations from year specific means. This is also knownto correct moderate levels of cross sectional dependence since it removes the mean impact of thefactor loadings of the unobserved factors generating the interdependencies between cross-sections (DeHoyos and Sarafidis, 2006). The cross-sectional specific effects are then eliminated using forwardorthogonal deviations thereby making it possible to use one period lags of the regressors as validinstruments since they are not correlated with the transformed error term (Love and Zichinno, 2006;Coulibaly, 2009). Another advantage of this approach is that it is more resilient to missing data. Itis computable for all observations except the last for each cross-section, hence minimising data loss(Roodman, 2006).
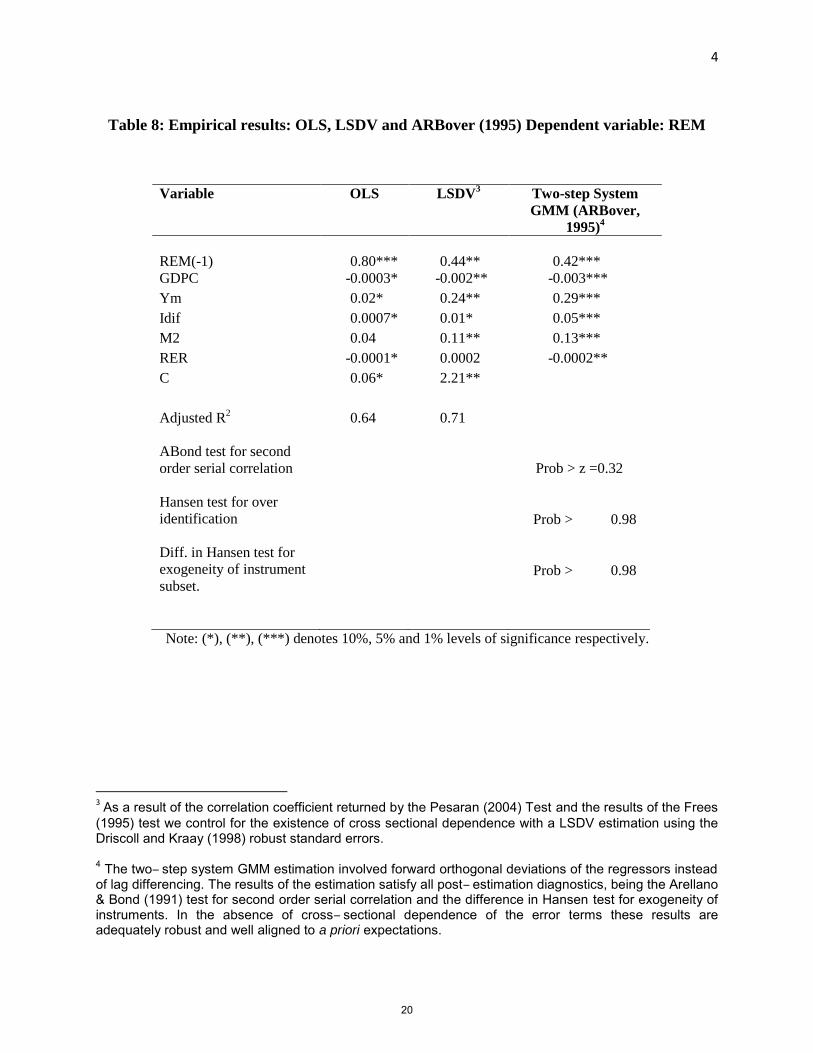
5 Empirical resultsThe results of the estimation are detailed in Table 8 It can be observed that the results of the LSDVestimation which includes correction for cross sectional dependence are significantly no different fromthe forward orthogonal two step system GMM results. Using the twostep system GMM results thecoefficient of lagged remittances is positive and statistically significant at the 1% level. Althoughthe coefficient has been corrected downwards as compared to the OLS estimation it still denotesstrong persistence behaviour in remittance inflows to Sub-Saharan Africa. Home country incomeas expected is negatively signed and statistically significant at the 1% level however the magnitudeof the coefficient remains low. This confirms earlier findings in the cross-correlation analysis of anegative but weak relationship between remittance inflows and home country income.The coefficient of host country economic conditions is positive and statistically significant at
1% level. This indicates that Sub-Saharan African migrants remit more when an improvement inthe economic conditions of the host country improves their income levels This corroborates earlierfindings by Singh et al. (2010) that countries with more migrants in wealthy countries receive moreremittance inflows than otherwise. The quality of financial service delivery (M2) is positively signedand statistically significant at 1% level. This aligns with a priori expectations as well as earliertrends in the cross-correlation analysis. Thus the quality of financial service delivery is a key factor
9
to be considered in efforts aimed at directing remittance inflows through formal channels into Sub-Saharan Africa and thereon for more productive uses This is consistent with earlier findings byGupta, Patillo and Wagh (2007).The coefficient of the interest rate differential is positively signed and statistically significant at
1% level. This indicates that Sub-Saharan African migrants would take advantage of investmentopportunities in their home countries under the right conditions.7 This modifies earlier findingsby Katseli and Glystos (1986) who found no relationship between home country interest rates andremittance inflows. However this is conditioned on exchange rate expectations being well anchored.The coefficient of the real exchange rate is negatively signed and statistically significant at the 1%level. This implies that an expected depreciation of the real exchange rate which signals adverseeconomic conditions back home would result in a fall in remittance inflows whiles an expectedappreciation of the real exchange rate which signals strong economic fundamentals would result inan increase in remittance inflows. The assumption that returns on investment are in home countrycurrency units means that a depreciation of the exchange rate represents a loss of value to the returnsseeking migrant. These results especially the interest rate differential and the real exchange rate areconsistent with self interest motives for remittances and not altruistic motivesThe Arellano and Bond (1991) test for second order serial correlation fails to reject the null of
no autocorrelation. The Hansen (1982) test for overidentification fails to reject the null that theoveridentification restrictions are valid whiles the Difference in Hansen test also fails to reject the nullthat the instrument subset are strictly exogenous. Hence the results of the two step system GMMestimation with forward orthogonal deviations meet all post estimation diagnostic requirements. Allcoefficient estimates compare favourably with the OLS and LSDV coefficient estimates. This showsthat they are likely good estimates of the true parameters of the variables.
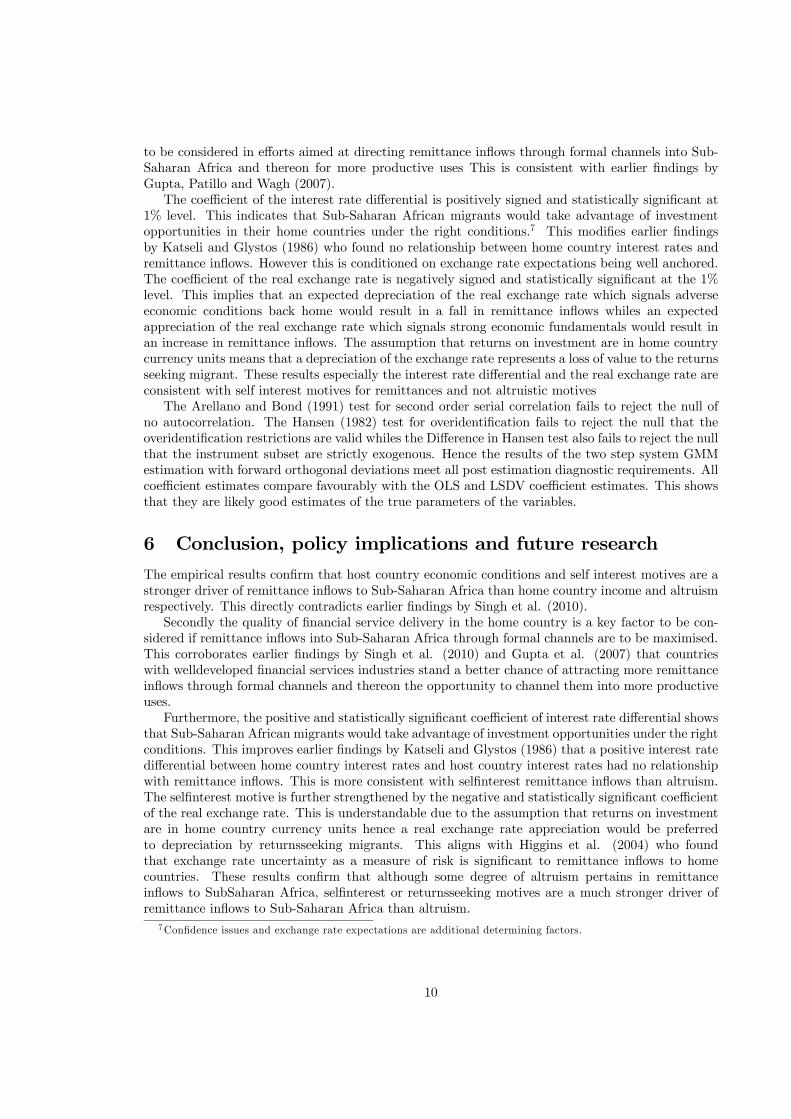
6 Conclusion, policy implications and future researchThe empirical results confirm that host country economic conditions and self interest motives are astronger driver of remittance inflows to Sub-Saharan Africa than home country income and altruismrespectively. This directly contradicts earlier findings by Singh et al. (2010).Secondly the quality of financial service delivery in the home country is a key factor to be con-
sidered if remittance inflows into Sub-Saharan Africa through formal channels are to be maximised.This corroborates earlier findings by Singh et al. (2010) and Gupta et al. (2007) that countrieswith welldeveloped financial services industries stand a better chance of attracting more remittanceinflows through formal channels and thereon the opportunity to channel them into more productiveuses.Furthermore, the positive and statistically significant coefficient of interest rate differential shows
that Sub-Saharan African migrants would take advantage of investment opportunities under the rightconditions. This improves earlier findings by Katseli and Glystos (1986) that a positive interest ratedifferential between home country interest rates and host country interest rates had no relationshipwith remittance inflows. This is more consistent with selfinterest remittance inflows than altruism.The selfinterest motive is further strengthened by the negative and statistically significant coefficientof the real exchange rate. This is understandable due to the assumption that returns on investmentare in home country currency units hence a real exchange rate appreciation would be preferredto depreciation by returnsseeking migrants. This aligns with Higgins et al. (2004) who foundthat exchange rate uncertainty as a measure of risk is significant to remittance inflows to homecountries. These results confirm that although some degree of altruism pertains in remittanceinflows to SubSaharan Africa, selfinterest or returnsseeking motives are a much stronger driver ofremittance inflows to Sub-Saharan Africa than altruism.
7Confidence issues and exchange rate expectations are additional determining factors.
10
With respect to policy recommendations, economic fundamentals (e.g. the real exchange rate)need to be strong to generate the right confidence levels if countries are to be able to harness remit-tance inflows from the diaspora for development finance. Coupled with an improved level of marketsophistication, i.e. the products and services provided by financial service providers, the enablingenvironment would be created to direct remittance inflows through formal channels and thereon formore productive uses. This would further mitigate its negative impact on macroeconomic variablessuch as money supply growth, inflation and the exchange rate. It would also help alleviate itsinfluence on money laundering, fraud, terrorism financing and illegal forex markets. Many coun-tries in Latin America, South Asia, Eastern Europe and Mediterranean regions have been able tofinance several community based development projects through diaspora targeted debt instruments.In light of dwindling portfolio investments FDI and ODA saddled with unfavourable conditionali-ties, Sub-Saharan African countries could also harness remittance inflows as an alternative source ofexternal finance for development if the right products and services are designed by financial serviceproviders, economic fundamentals are strong, exchange rate expectations are well anchored and theright confidence levels are ensured.It must be mentioned though that there are strong migration and remittance dynamics within
Sub-Saharan Africa that need to be researched. It is estimated that about 20 percent of SSAmigrants are within SSA who also remit regularly (Barajas et al. 2010). Thus in terms of futureresearch, it would be useful for specific remittance corridors within Sub-Saharan Africa to be studiedin relation to their respective dominant host countries. This would further facilitate targeted policyinterventions aimed at enhancing the flow of remittances through formal channels, maximising theirpositive externalities whiles minimising the associated negative externalities.
References[1] Addison, E.K.Y. 2004. The Macroeconomic Impact of Remittances in Ghana. Ghana: Bank of
Ghana.
[2] Agarwal, R., Andrew, W.H. 2002. Are International Remittances Altruism or Insurance? Evi-dence from Guyana Using Multiple-Migrant Households World Development 30(11), 2033-44
[3] Amuedo-Dorantes, C., Pozo, S. 2004. Workers’ Remittances and the Real Exchange Rate: AParadox of Gifts Journal of World Development 32(8)1407-17.
[4] Arellano, M., Bond, S. 1991. Some tests of specification for panel data: Monte Carlo evidenceand an Application of Employment Equations Review of Economic Studies 58, 277-97.
[5] Arellano, M., Bover O. 1995. Another look at the Instrumental Variable Estimation of ErrorComponent Model. Journal of Econometrics 68, 29-52.
[6] Baltagi, B.H. 2008. Econometric Analysis of Panel Data 4th ed. John Wiley and Sons Ltd.United Kingdom.
[7] Barajas, A., Chami, R., Fullenkamp, C., Garg, A. 2010. The Global Financial Crisis and Work-ers’ Remittances to Africa: What’s the Damage? IMF Working Paper WP/10/24.
[8] Blundell, R. Bond, S. 1998. Initial Conditions and Moment Restrictions in Dynamic Panel DataModels Journal of Econometric 87, 115-43.
[9] Bugamelli, M., Paterno, F. 2006. Do Workers’ Remittances Reduce the Possibility ofCurrent Account Reversals, Centre for Economic Performance Discussion Paper dp071.http://cep.lse.ac.uk/pubs/download/dp0714.pdf
11
[10] Carrasco, E., Ro, J. 2007. Remittances and development, The Universityof IOWA Centre for International Finance Development E-Book, June 2007.http://www.uiowa.edu/ifdebook/ebook2/contents/part4-II.shtml
[11] Chami, R., Fullenkamp, C., Jahjah, S. 2003. Are Immigrant Remittance Flows a Sourceof Capital for Development? IMF Working Paper 03/189, http://www.imf.org/ Exter-nal/Pubs/FT/staffp/2005/01/chami.htm
[12] Coakley, J., Fuertes, A., Smith, R. 2002. A Principle Components Approach to Cross-SectionalDependence in Panels. Unpublished Manuscript
[13] Corden, W.M., Neary, J.P. 1982. Booming Sector and De-Industrialisation in aSmall Open Economy. Economic Journal 92, 825-48. http://ideas.repec.org/a/ecj/econjl/v92y1982i368p825-48.html
[14] Coulibaly, D. 2009. Macrodeterminants of Migrant remittances: New Evidence from a PanelVAR, Centre d’Economie de la Sorbonne, http://ces.univ-paris1.fr/cesdp/ CES-docs.htm
[15] De Hoyos, R.E. Sarafidis, V. 2006. Testing for cross-sectional dependence in panel - data models.The Stata Journal 6(4), 482-96.
[16] De la Briere, B., De Janvry, A., Lambert, S., Sadouleth, F. 2002. The Roles of Destination,Gender, and Household Composition in Explaining Remittances: An Analysis for the DominicanSierra. Journal of Development Economic 68, 309-28.
[17] Docquier, F. and H. Rapoport. 2009. The Economics of Migrants’ Remittances Institute for theStudy of Labor (IZA) Discussion Paper 1351, http://ideas.repec.org/e/ pdo36.html
[18] Driscoll, JC. Kraay, A.C. 1998. Consistent Covariance Matrix Estimation with Spatially De-pendent Panel Data. Review of Economics and Statistics 80: 549-60.
[19] Durrand, J., Parrado, A., Massey, D. 1996. Migradollars and Development: A Reconsiderationof the Mexican Case. International Migration Review 30(2), 423-44.
[20] Elbadawi, I.A., Rocha, R. 1992. Determinants of Expatriate Workers’ Remittances in NorthAfrica and Europe Working Papers 1038, 1-56 www.worldbank.org
[21] Fisher, R.A. 1932. Statistical Methods for Research Workers,4thedn. Edinburgh: Oliver andBoyd.
[22] Frees, E.W. 1995. Assessing Cross-Sectional Correlation in Panel Data, Journal of Econometrics69, 393-414.
[23] Friedman, M. 1937. The Use of Ranks to Avoid the Assumption of Normality Implicit in theAnalysis of Variance, Journal of the American Statistical Association, 32, 675-701.
[24] Funkhouser, E. 1995. Remittances from International Migration: A comparison of El Salvadorand Nicaragua. The Review of Economics and Statistics, 77, 137-46.
[25] Glystos, N. 1997. Remitting Behaviour of temporary and permanent migrants: The Case ofGreeks in Germany and Australia. Labour, 11, 409-35.
[26] Guilliano, P., Ruiz-Arranz. M. 2005. Remittances, Financial Development and Growth IMFWorking Paper 05/234, http://programs.ssrc.org/intmigration/ Topic_14_Guiliano_Ruiz.pdf
[27] Gupta, S., Patillo, C., Wagh, S. 2007. Impact of Remittances on Poverty and Financial Devel-opment in Sub-Saharan Africa. IMF Working Paper 07/38 www.imf.org
12
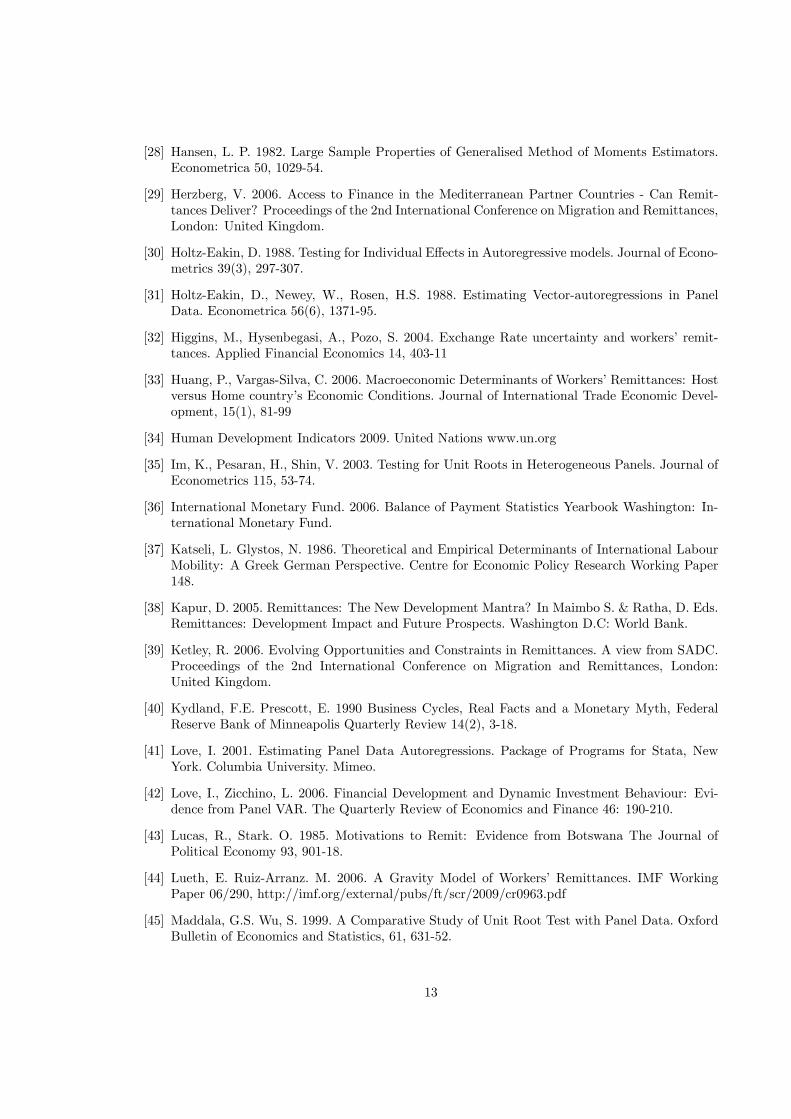
[28] Hansen, L. P. 1982. Large Sample Properties of Generalised Method of Moments Estimators.Econometrica 50, 1029-54.
[29] Herzberg, V. 2006. Access to Finance in the Mediterranean Partner Countries - Can Remit-tances Deliver? Proceedings of the 2nd International Conference on Migration and Remittances,London: United Kingdom.
[30] Holtz-Eakin, D. 1988. Testing for Individual Effects in Autoregressive models. Journal of Econo-metrics 39(3), 297-307.
[31] Holtz-Eakin, D., Newey, W., Rosen, H.S. 1988. Estimating Vector-autoregressions in PanelData. Econometrica 56(6), 1371-95.
[32] Higgins, M., Hysenbegasi, A., Pozo, S. 2004. Exchange Rate uncertainty and workers’ remit-tances. Applied Financial Economics 14, 403-11
[33] Huang, P., Vargas-Silva, C. 2006. Macroeconomic Determinants of Workers’ Remittances: Hostversus Home country’s Economic Conditions. Journal of International Trade Economic Devel-opment, 15(1), 81-99
[34] Human Development Indicators 2009. United Nations www.un.org
[35] Im, K., Pesaran, H., Shin, V. 2003. Testing for Unit Roots in Heterogeneous Panels. Journal ofEconometrics 115, 53-74.
[36] International Monetary Fund. 2006. Balance of Payment Statistics Yearbook Washington: In-ternational Monetary Fund.
[37] Katseli, L. Glystos, N. 1986. Theoretical and Empirical Determinants of International LabourMobility: A Greek German Perspective. Centre for Economic Policy Research Working Paper148.
[38] Kapur, D. 2005. Remittances: The New Development Mantra? In Maimbo S. & Ratha, D. Eds.Remittances: Development Impact and Future Prospects. Washington D.C: World Bank.
[39] Ketley, R. 2006. Evolving Opportunities and Constraints in Remittances. A view from SADC.Proceedings of the 2nd International Conference on Migration and Remittances, London:United Kingdom.
[40] Kydland, F.E. Prescott, E. 1990 Business Cycles, Real Facts and a Monetary Myth, FederalReserve Bank of Minneapolis Quarterly Review 14(2), 3-18.
[41] Love, I. 2001. Estimating Panel Data Autoregressions. Package of Programs for Stata, NewYork. Columbia University. Mimeo.
[42] Love, I., Zicchino, L. 2006. Financial Development and Dynamic Investment Behaviour: Evi-dence from Panel VAR. The Quarterly Review of Economics and Finance 46: 190-210.
[43] Lucas, R., Stark. O. 1985. Motivations to Remit: Evidence from Botswana The Journal ofPolitical Economy 93, 901-18.
[44] Lueth, E. Ruiz-Arranz. M. 2006. A Gravity Model of Workers’ Remittances. IMF WorkingPaper 06/290, http://imf.org/external/pubs/ft/scr/2009/cr0963.pdf
[45] Maddala, G.S. Wu, S. 1999. A Comparative Study of Unit Root Test with Panel Data. OxfordBulletin of Economics and Statistics, 61, 631-52.
13

[46] Migration Policy Institute. 2006. Remittance Profile, Sub-Saharan Africa.www.migrationpolicy.org/datahub
[47] Mohapatra, S., Ratha, D., Silwal, A. 2009. Migration and Remittance Trendsin 2009. Migration and Development Brief 11. World Bank, www.worldbank.org/prospects/migrationandremittances
[48] Nickell, S. 1981. Biases in Dynamic Models with Fixed Effects. Econometrica, 49(6): 1417-26.
[49] Opoku-Afari, M., Morrissey, O., Lloyd, T. 2004. Real Exchange Rate Response to Cap-ital Inflows: A Dynamic Analysis For Ghana, CREDIT Research Paper No. 04/12www.nottingham.ac.uk/economic/credit/research/papers/cp.04.12.pdf
[50] Pearce, D. 2006. Key Developments in Remittance Inflows since 2003. Proceedings of the 2ndInternational Conference on Migration and Remittances, London: United Kingdom.
[51] Pesaran M.H. 2004. General Diagnostic Tests for Cross Section Dependence in Panels, Cam-bridge Working Paper 0435. University of Cambridge. Faculty of Economics. Cambridge.
[52] Philips, P., Sul, D. 2003. Dynamic Panel Estimation and Homogeneity Testing under CrossSection Dependence. Economics Journal, 6, 217-59.
[53] Quartey, P., Blankson, T. 2004. Do Migrant Remittances Minimise the Impact ofMacro-Volatility on the Poor in Ghana? http://www.gdnet.org/pdf2/gdn_library/global_research_projects/macro_low_income/Quartey.pdf
[54] Ratha, D. 2003. Worker’s Remittances: An Important and Stable Source of External Develop-ment Finance. Global Development Finance, 157-75.
[55] Ratha, D. 2006. Remittances and Migration. Proceedings of the 2nd International Conferenceon Migration and Remittances, London: United Kingdom.
[56] Roodman, D. 2006. How to do xtabond2: An Introduction to “Difference” and “System” GMMin Stata Centre for Global Development Working Paper 103, www.cgdev.org
[57] Sackey, H.A. 2001. External Aid Inflows and The Real Exchange Ratein Ghana. African Economic Research Consortium Research Paper 110.http://www.aercafrica.org/documents/rp110.pdf
[58] Singh, R.J, Haacker, M., Lee, K. 2009. Determinants and Macroeconomic Impact of Remittancesin Sub-Saharan Africa. International Monetary Fund Working Paper 09/216 www.imf.org
[59] Solimano, A. 2003. Workers’ Remittances to the Andrean Region: Mechanisms,Costs and Development Impact. Paper prepared for the Multilateral InvestmentFund-IDB’s Conference on Remittances and Development, May 2003, Quito-Ecuador.http://www.andressolimano.com/articles/migration/Remittances%20Andean%20Region,%20manuscript.pdf
[60] Windmeijer, F. 2005. A finite sample correction for the variance of linear efficient two-stepGMM estimators. Journal of Econometrics 126, 25-51.
[61] Woodruff, C., Zenteno, R. 2001. Remittances and Microenterprises in Mexico. UCSD GraduateSchool of International Relations and Pacific Studies Working Paper. San Diego: University ofCalifornia.
[62] World Bank. 2008. Migration and Remittances Washington. World Bank. www.worldbank.org
14

[63] World Bank. 2009. World Development Indicators World Bank. www.worldbank.org
[64] World Bank. 2010. Migration and Remittances Washington. World Bank. www.worldbank.org
15
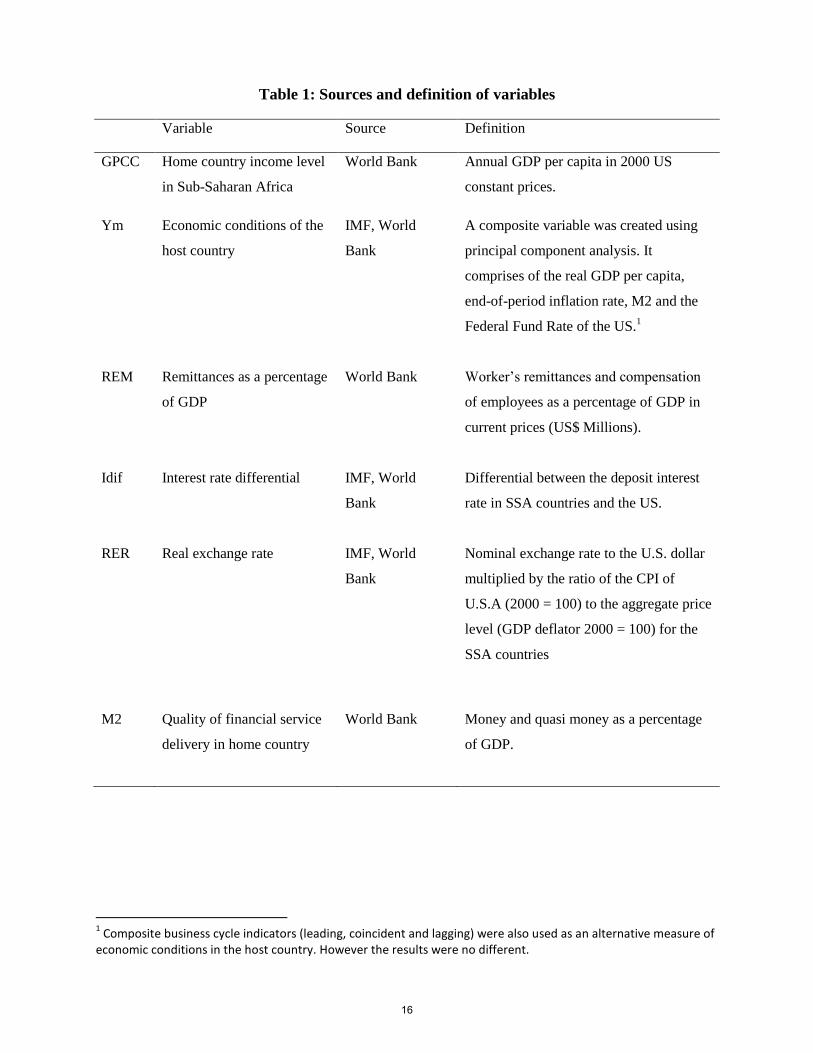
Table 1: Sources and definition of variables
Variable Source Definition
GPCC Home country income level
in Sub-Saharan Africa
World Bank Annual GDP per capita in 2000 US
constant prices.
Ym Economic conditions of the
host country
IMF, World
Bank
A composite variable was created using
principal component analysis. It
comprises of the real GDP per capita,
end-of-period inflation rate, M2 and the
Federal Fund Rate of the US.1
REM Remittances as a percentage
of GDP
World Bank Worker’s remittances and compensation
of employees as a percentage of GDP in
current prices (US$ Millions).
Idif Interest rate differential IMF, World
Bank
Differential between the deposit interest
rate in SSA countries and the US.
RER Real exchange rate IMF, World
Bank
Nominal exchange rate to the U.S. dollar
multiplied by the ratio of the CPI of
U.S.A (2000 = 100) to the aggregate price
level (GDP deflator 2000 = 100) for the
SSA countries
M2 Quality of financial service
delivery in home country
World Bank Money and quasi money as a percentage
of GDP.
1 Composite business cycle indicators (leading, coincident and lagging) were also used as an alternative measure of
economic conditions in the host country. However the results were no different.
16
1
Table 2: Descriptive statistics of variables
Variable Mean Min Max Obs.
REM 5.40 0.00111 227.70 1015
Ym 987.15 -2.71 43 943.34 1015
GDPC 897.40 102.29 8 208.32 1015
M2 25.30 0.25 117.36 1015
RER 462.64 1.76 8 302.57 1015
Idif -0.79 -26.81 51 1015
Table 3: Cross-correlations of variables
Variables REM REM(-1) Idif M2 RER GPCC Ym
REM 1
REM(-1) 0.81*** 1
Idif 0.02 0.02 1
M2 0.15*** 0.15*** -0.03 1
RER -0.08*** -0.08** 0.04 -0.14*** 1
GDPC -0.09*** -0.09*** 0.01 0.57*** -0.15*** 1
Ym 0.07** 0.07** 0.01 0.08** -0.05 -0.06* 1
Note: (*), (**), (***) denotes 10%, 5% and 1% level of significance respectively.
Table 4: Country-specific cross-correlations of remittances and other variables:
contemporaneous analysis2
CVE
GAM
GNB
LES
SEN
SLE
TOG
Idif 0.47** 0.67* -0.35*** 0.01 0.38** -0.30 0.38**
GPCC 0.31 0.19 -0.49* -0.62* 0.74* -0.48* -0.39**
RER 0.39** 0.52** 0.56* 0.61* 0.87* 0.79* 0.49*
M2 0.30 0.61* 0.46** 0.53* 0.89* 0.03 -0.20
Ym 0.43* 0.57* 0.61* -0.60* 0.74* 0.75* 0.83*
DC 0.37** -0.19 -0.14** 0.15 -0.35*** -0.22 -0.53*
Note: (*), (**), (***) denotes 10%, 5% and 1% levels of significance respectively.
22
CVE (Cape Verde), GAM (Gambia), GNB (Guinea Bissau), LES (Lesotho) SEN (Senegal, SLE (Sierra Leone), TOG (Togo)
17
2
Table 5: Initial diagnostic tests
Test Test statistic Critical value Inference
Joint validity of cross-
sectional individual effects
H0 : μ1 =μ2 ….μN-1 = 0
HA : Not all equal to 0
F Stat = 15.12
F(0.05, 34, 939) = 1.442
Cross-sectional specific
effects are valid.
Joint validity of time (period)
fixed effects
H0 : = 0
HA: Not all equal to 0
F Stat = 44.51
F (0.05, 27, 947) = 1.498
Time-specific fixed
effects are valid. The
error term takes a two
way error component
form.
Serial correlation (two-way
model)
LM test for first order serial
correlation, given fixed effects
H0 : = 0; HA = ρ > 0
LM = 3.44
N(0,1) = 1.645
First order serial
correlation, given fixed
effects.
Heteroscedasticity
H0 : =
HA : Not equal for all i
LM = 817.59
= 48.60
The variance of the error
term is not constant.
Heteroscedasticity is
present.
Hausman specification test
H0 :E( ) = 0
HA :E( ) ≠ 0
Pesaran CD (2004) test for
cross‒ sectional dependence
H0 : corr ( ) = 0 for i
HA : corr ( ) ≠ 0 for
some i
m3 = 160.11
CD = 1.66
(0.37)
= 12.60
Prob = 0.90
Regressors not
exogenous.
Results inconclusive.
While we fail to reject the
null of cross sectional
independence, a cross
correlation coefficient of
0.37 is reported.
18
3
Table 2.6: Tests for cross-sectional dependence
Test Test statistic Prob. Value Distribution Inference
Frees (1995, 2004)
test 6.01 α = 0.10:0.09
α = 0.05:0.12
α = 0.01:0.17
Frees’ Q
distribution
Cross-sections are
inter-
dependent
Friedman (1937)
test 25.472 Pr=0.85 Cross-sections are
independent
Note: for all test H0: corr ( ) = 0 for i ; HA: corr ( ) ≠ 0 for some i
Table 7: Order of Integration of Variables
Variable In levels In first-differences Obs.
REM I(0)
1015
Ym I(1) I(0) 1015
GDPC I(1) I(0) 1015
M2 I(1) I(0) 1015
RER I(1) I(0) 1015
Idif I(0)
1015
19
4
Table 8: Empirical results: OLS, LSDV and ARBover (1995) Dependent variable: REM
Variable OLS LSDV3 Two-step System
GMM (ARBover,
1995)4
REM(-1)
0.80***
0.44**
0.42***
GDPC -0.0003* -0.002** -0.003***
Ym 0.02* 0.24** 0.29***
Idif 0.0007* 0.01* 0.05***
M2 0.04 0.11** 0.13***
RER -0.0001* 0.0002 -0.0002**
C 0.06* 2.21**
Adjusted R2
ABond test for second
order serial correlation
Hansen test for over
identification
Diff. in Hansen test for
exogeneity of instrument
subset.
0.64 0.71
Prob > z =0.32
Prob > 0.98
Prob > 0.98
Note: (*), (**), (***) denotes 10%, 5% and 1% levels of significance respectively.
3 As a result of the correlation coefficient returned by the Pesaran (2004) Test and the results of the Frees
(1995) test we control for the existence of cross sectional dependence with a LSDV estimation using the Driscoll and Kraay (1998) robust standard errors. 4 The two‒ step system GMM estimation involved forward orthogonal deviations of the regressors instead of lag differencing. The results of the estimation satisfy all post‒ estimation diagnostics, being the Arellano & Bond (1991) test for second order serial correlation and the difference in Hansen test for exogeneity of instruments. In the absence of cross‒ sectional dependence of the error terms these results are adequately robust and well aligned to a priori expectations.
20
5
Figure 1: Remittances as a ratio to GDP in highest remittance recipients in SSA in 2008
Data Source: World Development Indicators, World Bank
Figure 2: Ratio of remittances to regional aggregates in SSA in 2008
Data Source: World Development Indicators, World Bank. WDI Online
Series1
0 5
10 15 20 25 30
Lesotho Togo Cape Verde Senegal Gambia Sierra
Leone Guinea Bissau
27
9.8 9.7 9.7 8.2
7.6 7 R
emitt
ance
s/G
DP
(%)
SSA Countries in 2008
Series1
0
50
100
150
ODA FDI Imports Exports
Current Account Balance
GDP
53.19 63.37 57.3 54.4
105.18
2.18
Rat
io o
f rem
ittan
ces
to m
acro
ag
greg
ates
in S
SA
Aggregate variables in SSA in 2008
21