Embed Size (px)
Citation preview

WP/07/211
What Drives China’s Growing Role in Africa?
Jian-Ye Wang


© 2007 International Monetary Fund WP/07/211 IMF Working Paper African Department
What Drives China’s Growing Role in Africa?
Prepared by Jian-Ye Wang1
Authorized for distribution by Benedicte Vibe Christensen
October 2007
Abstract
This Working Paper should not be reported as representing the views of the IMF. The views expressed in this Working Paper are those of the author and do not necessarily represent those of the IMF or IMF policy. Working Papers describe research in progress by the authors and are published to elicit comments and to further debate.
What role does China play in Africa’s development? What drives China’s increasing economic involvement in the continent? This paper attempts to provide a quantified assessment of China’s multifaceted influence as market, donor, financer and investor, and contractor and builder. Though in the past official development aid predominated, the paper argues that government policies, markets for each other’s exports, Africa’s demand for infrastructure, and China’s differential approach to financing have together moved commercial activities—trade and investment—to the center of China-Africa economic relations. While China’s public sector, state financial institutions in particular, has been instrumental in the process, the influence of its private sector is increasing. Implications for the future of China-Africa economic relations are briefly noted. JEL Classification Numbers: F10; F21; F35; O53; O55 Keywords: Trade, Aid, Capital Flows, Africa, China Author’s E-Mail Address: [email protected] 1Amar Shanghavi who ably assisted in research, prepared all the charts, tables, and the annex on terms of trade estimation. The author thanks Abdoulaye Bio-Tchané and Benedicte Vibe Christensen for their encouragement. Helpful comments from Jianxiong He, Jean A.P. Clément, Piroska M. Nagy, Norbert Funke, Ulrich Jacoby, Lawrence Dwight, and colleagues of the Fund’s Policy Development and Review Department and Asia and Pacific Department are gratefully acknowledged. Thanks are due to Anne Grant for editorial assistance, and Belkys Rondon for secretarial support. Any errors and omissions remain the author's responsibility.

2
Contents Page
I. Introduction ............................................................................................................................4
II. Trade and Capital Flows Between China and Africa............................................................5 A. Merchandise Trade....................................................................................................5 B. Official Development Assistance and Debt Relief ...................................................8 C. Other Debt-Creating Financial Flows .....................................................................10 D. Foreign Direct Investment ......................................................................................11 E. Contract Labor and Other Services .........................................................................12
III. The Role of China’s Public Sector.....................................................................................12 A. China’s African Policy and New Commitments for 2007–09 ................................12 B. State Financial Institutions ......................................................................................13
China Exim Bank.............................................................................................14 China Development Bank ................................................................................15 China Export and Credit Insurance Corporation (SINOSURE) ......................16 Other State Entities ..........................................................................................16
C. Commercial Policies ...............................................................................................16
IV. The Role of the Private Sector...........................................................................................17 A. Private Traders ........................................................................................................17 B. Private Investors......................................................................................................17 C. Private Contractors and Builders.............................................................................19
V. Aid vs. Commerce: Factors Influencing the Growing Ties ................................................19 A. Markets for Exports ................................................................................................20 B. African Demand for Infrastructure..........................................................................20 C. China’s Approach to Financing...............................................................................21 D. The Future of China-Africa Economic Relations ...................................................22
VI. Conclusion .........................................................................................................................23
References................................................................................................................................24
Annex I. Data sources and Problems ......................................................................................26 Annex II. Estimation of Africa's Terms of Trade with China ………………….……………27
Tables 1. Africa: Merchandise Trade with China, 2000–06................................................................28 2. Foreign Direct Investment Flows to Africa, 2002–05 .........................................................29 3. China Export and Credit Insurance Corporation (SINOSURE)

3
Major Activities, 2002–06 ................................................................................................29 4. Major Aid by Donor, 2005...................................................................................................30 Figures 1. Africa: External Trade, 2000–06 .........................................................................................6 2. Africa’s Terms of Trade with China, 2000-06: ..................................................................7 3. Africa: Composition of Trade with China, 2006 .................................................................7 4. Geographical Composition of China’s External Trade, 2000 and 2006..............................8 5. Official Development Assistance to Sub-Saharan Africa by Major Donors, 2006 .............9 6. Africa’s FDI to China, 1995–05 ........................................................................................11 7. China and Africa: Bilateral Tourism, 2000–04..................................................................12 8. China Export-Import Bank, Main Operations, 2001-06………………………………....14 9. Major Export Credit Agencies, Selected Activities, 2006.................................................15 10. SINOSURE: Breakdown of Operations by Continent, 2006.............................................16 Boxes 1. Private Chinese Direct Investment in Africa: Some Examples ...........................................18 2. Summary of Africa-China Economic Relations: Trade, Aid and FDI, 2006.......................22

4
I. INTRODUCTION
China’s fast-growing economic ties with Africa are attracting considerable attention. The relationship came into the spotlight during the summit of the Forum on China-Africa Cooperation (FOCAC) in Beijing in November 2006 and the Annual Meetings of the African Development Bank (AfDB) in Shanghai in May 2007. While the expansion of trade and investment between Africa and China has been generally welcomed, concerns have been expressed about how China’s growing presence might affect African development.2 But what roles exactly has China played? What drives China’s trade and financial involvement in Africa? What are the implications of the relationship for Africa’s other development partners? This paper aims to shed light on these questions, particularly the first two, by examining evidence available that relates especially to China’s state financial institutions.
There have been relatively few systematic studies of the resurging economic relations between China and Africa. Alden (2005) reviews the evolution of Sino-African economic relations since the 1970s; Edwards and Jenkins (2005) study trade-poverty links; Kennan and Stevens (2005) attempt to identify possible winners and losers among African countries as China becomes more prominent in world trade; Jenkins and Edwards (2006) examine the direct and indirect trade impact of China and India on sub-Saharan Africa. A recent study by an OECD staff team emphasizes trade and foreign direct investment (FDI), focusing on China’s and India’s role in specific commodity and energy markets (Goldstein et al., 2006). A World Bank study investigates constraints or policy challenges “at the border,” “behind the border,” and “between the borders” for increasing Africa-Asia trade and investment (Broadman, 2007).
This paper differs from previous studies. By putting together merchandise trade, state-supported trade credit, official development assistance, debt relief, FDI, and contract labor services, it paints a broader picture of Chinese-African economic relations and highlights the changing roles of China’s public and private sectors. In seeking to explain the recent rise in China-Africa trade and capital flows, the analysis hopes to contribute to a better understanding of the forces shaping China-Africa relations.
The remainder of this paper is organized as follows: Section II presents information on the multiple dimensions of China-Africa economic relations beyond merchandise trade, which has been relatively well documented. The role of government policies and China’s public sector, particularly state financial institutions, is examined in Section III. Section IV then discusses how China’s private traders and investors and its corporate sector in general are expanding China-Africa economic exchanges. Section V assesses other factors behind China’s growing role in African development, with special attention to the complementary trade pattern and growing markets for each other’s exports, Africa’s demand for infrastructure, and China’s differential approach to financing social needs and business
2 These concerns range from debt sustainability and governance reform to environmental impact; see news reports in Les Echos, October 24, 2006 (in French); Financial Times, November 28, 2006, and News Edge, May 17, 2007.

5
development—and the possible implications for the future of China-Africa economic relations. The last section summarizes the main findings of the paper.
II. TRADE AND CAPITAL FLOWS BETWEEN CHINA AND AFRICA
This section pulls together the information available and attempts to quantify, to the extent possible, China’s economic engagement with Africa.3 Emerging from the review is a recognition of China’s multifaceted influence: as market for Africa’s exports, donor, financer and investor, and contactor and builder. While official financial and technical assistance predominated in the past, commercial activities, which have increased rapidly in the last few years, are now dominant in financial terms.
A. Merchandise Trade
Trade between Africa and China began to accelerate in about 2000. Between 2001 and 2006, Africa’s exports to China increased at an annual rate of over 40 percent, rising from US$4.8 billion to reach US$28.8 billion in 2006 (Figure 1 and Table 1). During the same period, Africa’s imports from China quadrupled to US$26.7 billion. In 2006 Sub-Saharan Africa (SSA) accounted for the bulk of the Africa-China trade; the region’s exports to China amounted to US$25 billion, about 85 percent of all African exports to China that year. According to statistics compiled by China, for 2004–06 Africa ran a small trade surplus, about US$2 billion each year.
The terms of trade have moved in Africa’s favor, reflecting both the composition of trade and rising prices for Africa’s main export commodities (Figures 2 and 3). In 2006 oil and gas accounted for 62 percent of Africa’s exports to China, followed by nonpetroleum minerals and metals (13 percent). 4 Africa’s imports from China comprised mainly manufactured products (45 percent) and machinery and transport equipment (31 percent). Rough estimates suggest that Africa’s terms of trade in relation to China improved by 80 to 90 percent between 2001and 2006, primarily because robust world demand, lifted in part by China, drove up international prices for oil and minerals.5
3 Data sources and problems are summarized in Annex I. The assessments in this paper are subject to the usual caveats related to data limitations.
4 See IMF (2007), Chapter IV for a discussion of SSA’s export pattern, including China’s share in total SSA exports, based on data through 2005.
5 This echoes the findings of Jenkins and Edwards (2006), Goldstein (2006), and Broadman (2007).

6
Figure. 1 Africa: External Trade, 2000–06
Sources: IMF, Direction of Trade Statistics; and the author's calculations.
Exports and Imports of Africa, by Trading Partners(Billions of US dollars)
0
100
200
300
400
500
600
2000 2001 2002 2003 2004 2005 2006
ChinaAsia (Excl. China)United StatesEU-15
0
15
30
45
60
2000 2006
EU-15Unites StatesAsia (excl. China)China
African Exports by Destination(Percent of total exports)
-5
5
15
25
35
2000 2001 2002 2003 2004 2005 2006
Trade Balance
African Exports toChina
Trade Balance with China(Billions of US dollars)
0
10
20
30
40
50
2000 2006
EU-15Unites StatesAsia (excl. China)China
Contribution to Africa's Export Growth(Percent of total annual growth)
Africa-China trade, although growing fast, is relatively small in the global context: China accounted for 16 percent of total African exports (19 percent of exports from SSA) in 2006, a share well below that of the E.U. and the U.S.A.6 Although the E.U. and the U.S.A. continue to make major contributions to Africa’s export growth, China is catching up fast. China’s imports from and exports to Africa are still smaller than its trade with the Middle East and developing countries in the Western Hemisphere (Figure 4), but it has set a goal of doubling two-way trade with Africa to US$100 billion by 2010. China is thus likely to take an increasingly larger share in Africa’s external trade.
6 Based on UNComtrade data. See Table 1 for a comparison of trade data from various sources.

7
Figure 2. Africa's Terms of Trade with China, 2000–06 (Index, 2000=100)
70
90
110
130
150
170
190
210
230
250
2000 2001 2002 2003 2004 2005 2006
Terms of tradeFuel price indexManufactures price index
Sources: Author's estimates based on data from Uncomtrade; IMF, World Economic Outlook and International Financial Statistics. Note: See Annex II for details of calculations and assumptions.
Africa's Imports from China
31%
45%
24%
Machinery and transport equipmentManufactured goodsOther
Africa's Exports to China
13%
8%
17%
62%
FuelCrude materials (excl. fuel)Manufactured goodsOther
Source: UNcomtrade.
Figure 3. Africa: Composition of Trade with China, 2006

8
Figure 4. Geographical Composition of China's External Trade, 2000 and 2006
0
10
20
30
40
50
60
2000 2006
DevelopingAsia
Middle East
Cent. andS.America
Africa
Imports by Sources (Percent of total imports)
0
10
20
30
40
50
60
2000 2006
DevelopingAsia
Middle East
Cent. andS.America
Africa
Exports by Destination (Percent of total exports)
Sources: IMF, Direction of Trade Statistics.
B. Official Development Assistance and Debt Relief
China started providing aid to Africa in 1956. By May 2006, it had contributed a total of 44.4 billion yuan (US$5.7 billion) for more than 800 aid projects, according to a researcher at the Chinese Academy of Social Science (He, 2006).7 The last officially reported flows are for 2002, when the Chinese government reported that it provided US$1.8 billion in economic support to Africa.8 The Chinese National Bureau of Statistics reports annual data on contracted projects in SSA countries, which include “projects financed by the Chinese government under its aid program.”9 While the foreign aid component of the figures is hard to pin down, it is even more difficult to estimate the value of Chinese technical assistance and aid in-kind because of problems in pricing Chinese labor. Assuming Chinese aid, including technical assistance, is about 50 percent of the value of contracted projects, China’s official development assistance (ODA) to SSA could amount to US$1.0–1.5 billion annually for 2004–05 (Figure 5).10 In comparison, China’s aid flows to Africa averaged about US$310 million annually for 1989–199211.
7 This stock figure may not be consistent with aid flows discussed in the rest of this paragraph. See Annex I for a summary of the data problems.
8 Because this figure may include loans on non-concessional terms, it is not comparable with ODA as defined by OECD/DAC (see Broadman, 2007, pp. 274-75).
9 “Contracted projects” also include construction projects of China’s diplomatic missions and projects financed by sources other than the Chinese government but undertaken by Chinese contractors with approval of China’s Ministry of Commerce. See National Bureau of Statistics of China, http://www.stats.gov.cn/english/statisticaldata/yearlydata/; Also He Wenping (2007).
10 This assumption reflects the observation that preferential credits amount to 50 percent of the Chinese government’s total credit and investment commitments to Africa for 2007–09 (see Section III.A)
11 See Talyor (1989), which provides historical data on China’s aid flows or commitments to Africa based on bilateral agreements. The average for 1980-87 was about US$290 million a year.

9
.
Sources: OECD/DAC; and National Bureau of Statistics of China.1Multilateral institutions include the World Bank, the International Monetary Fund, and the African Development Bank. These institutions delivered significant debt relief in 2000–05.2Author's estimate for 2005, assuming that 50 percent of the value of contracted projects is ODA (including technical assistance and aid in kind). Contracted projects reported by the National Bureau of Statistic of China include projects financed by the Chinese government under its foreign aid program. Debt relief includes all interest-free loans that had matured by the end of 2005, as announced by the Chinese government in November 2006.
-5
0
5
10
15
20
Multilateral FinancialInstitutions
EU-15 United States Japan China
Debt reliefNet ODA (less debt relief)
1 21
Figure 5. Official Development Assistance to Sub–Saharan Africa by Major Donors, 2006 (Billions of US dollars)
China has also been providing debt relief to African countries on its own terms. At the first China-Africa Cooperation Forum in October 2000 in Beijing, the Chinese government pledged to write off in two years overdue obligations on 156 loans owed by African countries; these totaled 10.5 billion yuan (US$1.3 billion). The pledge was fulfilled ahead of schedule (He, 2007). In November 2006 China announced that it would cancel another 10 billion yuan (US$1.3 billion) in debt—168 interest-free government loans that had matured by the end of 2005 and were owed by 33 of the heavily indebted and least developed countries in Africa. By mid-May 2007 China had signed debt forgiveness agreements with 11 of these countries and expected to conclude agreements with the other 22 by the end of 2007.
The terms of China’s ODA follow the principles established during late Primer Zhou Enlai’s visit to Africa in the early 1960s: no conditions or demand for privileges can be attached to ODA; China provides ODA in the form of grants, interest-free or low-interest loans (i.e., preferential loans that have an interest subsidy); and repayment will be rescheduled if necessary.12 China’s aid program also includes technical assistance, with an emphasis on agricultural technology and training in Chinese institutions. China’s ODA has focused on 12 Other principles are to help recipient countries achieve economic independence and master technology provided by Chinese TA; to provide the best possible equipment and materials; and to require equal treatment of Chinese and local experts (http://english.focacsummit.org).

10
social and humanitarian projects, such as hospitals, schools, low-cost housing, sport venues, and library and government buildings, and often is delivered in kind. ODA has also been used for infrastructure construction (133 out of the more than 800 aid projects) and agricultural development (137 projects).
C. Other Debt-Creating Financial Flows
Aside from intergovernmental loans, there are other debt-creating financial flows from China to Africa, mainly trade credits, some of which are medium- and long-term.13 Trade credit may be provided by suppliers or financial institutions. Of these the Export-Import Bank of China (China Exim Bank) is the most active. Its total export credit and international guarantee business increased to US$19.8 billion in 2006, from US$15.2 billion in 2005. Though China Exim Bank does not report activities by region, there is clear evidence of significant and expanding operations in Africa.
By the end of 2005, China Exim Bank had approved more than 50 billion yuan (US$6.5 billion) for projects in Africa, which accounted for close to 10 percent of the Bank’s total approvals at that time. 14 Estimates by World Bank staff compiling data from public sources are much higher—China Exim Bank loans to SSA for infrastructure alone amounted to US$12.5 billion by mid-2006.15 As of September 2006 there were 259 China Exim Bank projects in 36 African countries, and 79 percent of its commitments to Africa were for infrastructure (Ellis, 2007). According to news reports summarized by Moss and Rose (2006), several of these projects are very large.16 This financing is clearly much larger than ODA flows.
What is not clear is the extent to which China Exim Bank’s projects or its commitments give rise to external debt of African countries, because the financial arrangements and obligors vary from project to project. China Exim Bank’s annual reports indicate that export buyers’ credit accounted for only 10 percent of its new commitments in 2005–06.
13 China Exim Bank provides credit to export buyers with a repayment period up to 15 years.
14 China Exim Bank, China-Tunisia Cooperation Forum, press release, March 28, 2006.
15 See Broadman (2007), pp. 275. Data from the China Exim Bank and World Bank estimates may not be comparable because the latter may include financing leveraged by China Exim Bank lending.
16 Reported projects in 2005–06 alone (not necessarily confirmed by the authorities) include US$2.3 billion in total financing to Mozambique for the Mepanda Nkua dam and hydroelectric power plant and perhaps another $300 million for the Moamba-Major dam; a possible US$1.2 billion in new loans to Ghana, including US$600 million toward construction of the Bui dam; US$1.6 billion for an oil project in Nigeria; $200 million in preferential buyers credit for Nigeria’s first communication satellite; a US$2 billion line of credit to Angola, with the possibility of another US$9–10 billion; and possible loans and export credits for projects in Congo-Brazzaville, Sudan, and Zimbabwe.

11
D. Foreign Direct Investment
China’s direct investment in Africa, as reported by the National Bureau of Statistics of China, amounted to US$392 million in 2005, up from US$317 million in 2004. Data from other sources show significantly higher figures: in 2004, Chinese FDI was estimated to be more than US$900 million; total FDI in Africa was US$15 billion (Table 2). China’s Ministry of Commerce puts China’s direct investment to Africa for 2000–06 at US$6.6 billion. Among the 800 Chinese enterprises investing in Africa, only about 100 are state-owned. The rest are private businesses with interests ranging from trade, manufacturing and processing, services, and communications to agriculture and natural resource development. 17
Chinese official statistics may not fully capture the true magnitude of direct investment by Chinese entities in African countries. The dividing line between trade and project financing by China’s financial institutions and direct investment by Chinese enterprises is often unclear. Data on “overseas investment” as recorded by China’s National Bureau of Statistics may not be comprehensive.18 In addition, China’s private enterprises also rely heavily on retained earnings and informal arrangements rather than capital markets and bank borrowing to finance investments. For these and other reasons the FDI of China’s private enterprises may be under-recorded.
FDI between Africa and China flows both ways (Figure 6). Chinese statistics show that a large share of African FDI in China is from Mauritius. The flows recorded may include investments originating outside Africa (Broadman, 2007, pp.100). Worth noting is that South African firms have been expanding actively into the Chinese market, using their management and technological strength (e.g., in mining, paper, and consumer goods) and their experience of operating in developing countries.
17 People’s Daily Online, January 17 and May 14, 2007, http://english.people.com.cn; and website of the Ministry of Commerce of China, http://preview.english.mofcom.gov.cn.
18 For instance, in 2006 CNOOC (China National Offshore Oil Corporation) bought a 45 percent stake in a Nigeria oil and gas field for US$2.3 billion.
Figure 6. Africa's FDI to China, 1995-05(Billions of US dollars)
Source: National Bureau of Statistics of China.
0.0
0.5
1.0
1.5
1995 2000 2005

12
Figure 7. China and Africa: Bilateral Tourism, 2000-041
(In '000)
Sources: Yearbook of Tourism Statistics 2006.1China includes Hong Kong SAR and Taiwan province of China. Africa includes 25 countries that report tourism statistics at country level. However definitions may vary from country to country and sample size may vary from year to year.
50
100
150
200
250
300
2000 2001 2002 2003 2004
Chinese Tourists to Africa
African Tourists to China
E. Contract Labor and Other Services
Africa is an important market for Chinese enterprises that contract for construction and engineering projects (roads, bridges, schools, shopping centers, housing and office buildings, water conservancy, and power plants). Since 2000 Chinese enterprises have been contracted to build more than 6,000 kilometers of roads, 3,000 km railways, and 8 large- and medium-sized power plants in Africa. Official Chinese statistics show that the sum of “contracted projects,” “labor cooperation,” and “design consultation” in Africa increased from US$4 billion in 2004 to US$6.3 billion in 2005. In 2006 the turnover on contract labor service went up to US$9.5 billion, representing 31 percent of China’s offshore contracted projects and exceeding the total in 1998–2002 (PBC and CBD, 2007; Yang, 2004).
Within trade in services, two-way traffic is growing particularly fast in tourism. By September 2006, 17 Africa countries had become destinations for Chinese citizens and tourist groups. Namibia, Botswana, Madagascar, Lesotho, and Ghana had been added to the list of tourist destinations by the Chinese government only in the two preceding years. The number of African tourists to China has been accelerating (Figure 7).
III. THE ROLE OF CHINA’S PUBLIC SECTOR
As China’s economic engagement with Africa has become more sophisticated, involving more and different players, it has become necessary to look beyond the central government to understand the driving forces behind recent developments. This chapter pays particularly better attention to China’s state financial institutions.
A. China’s African Policy and New Commitments for 2007–09
China’s first African Policy Paper, issued in January 2006, articulates the objectives of Chinese policy toward Africa and how they are to be achieved. Because the intention is to build a new type of strategic partnership, the paper emphasizes “mutual benefit,” “common development,” and “win-win” results in economic relations. It outlines government actions to promote trade, investment, financial services, agriculture, infrastructure, resources development, and tourism. The approach is supported by financial and technical assistance in

13
such noncommercial areas as health and education. The thrust of this policy is vividly demonstrated in China’s new commitments to Africa.
During the Beijing Summit of the Forum on China-African Cooperation in November 2006, President Hu Jintao of China announced new commitments to Africa for 2007–2009:
• Preferential credits: US$5 billion, consisting of US$3 billion concessional loans and US$2 billion export buyers credits.19
• Direct investment: A US$5 billion China-Africa Development Fund to support Chinese FDI in Africa.
• Trade: Further opening up China’s market to Africa by expanding the list of duty- free African exports and setting up trade cooperation zones in Africa.
• Grants and debt relief: A doubling of 2006 assistance, to build hospitals, malaria prevention and treatment centers, and rural schools in Africa and a conference center for the African Union; and cancellation of all interest-free loans owed by eligible countries that had matured by the end of 2005.
• Technical assistance: Training for African professionals and sending agriculture experts to Africa; setting up agriculture technology demonstration centers in Africa; doubling Chinese government scholarships for African students.
With its heavy emphasis on trade and investment, the new commitment package is consistent with China’s Going Global strategy, which encourages Chinese enterprises to compete for resources and markets beyond Chinese borders.
These commitments do not include trade and project financing by Chinese banks on commercial terms. In May 2007, during the African Development Bank Annual Meetings in Shanghai, officials of China Exim Bank reportedly stated that they plan to provide about US$20 billion in infrastructure and trade financing to Africa over the next three years.20
B. State Financial Institutions
Among the large number of state-owned financial institutions, China Exim Bank and China Development Bank (CDB) are the two primary agencies implementing China’s new pledge to Africa; the former is responsible for the preferential credit component (US$5 billion) and the latter for the FDI support fund (US$5 billion).
19 By mid-May 2007 China had signed agreements with Chad, Cameroon, and Mozambique and announced US$100 million in preferential export buyers credit to Namibia.
20 See “China Pledges US$20 Billion for Africa,” Financial Times, http://www.ft.com, May 18, 2007.

14
China Exim Bank Founded in 1994, China Exim bank is wholly owned by the state and operates under the guidance of the central government. It is the sole bank handling Chinese government concessional loans.21 Together with China Development Bank (CDB) and China Agriculture Development Bank, the Exim Bank is tasked to promote exports and foreign investment. Its export credits focus on infrastructure (roads, power plants, oil and gas pipelines, telecommunications, and water projects); its investment loans target the energy, mining, and industrial sectors. The bank’s main source of funding is the bond market. Unlike export credit agencies in other countries, the government does not guarantee the bank’s liabilities.
China Exim Bank’s business (excluding concessional loans) almost quadrupled in 2001–06 (Figure 8). Available data suggest that China Exim Bank’s primary commercial operations in 2006 were larger than those of comparable institutions in major industrial countries, such as the U.S. Exim Bank and the Japan Bank for International Cooperation (Figure 9).22 Because China Exim Bank’s main business is commercial lending, the impact of its lending activities, which include both commercial and concessional loans, in Africa therefore is far larger than providing preferential credits on behalf of the government.
Figure 8. China Export–Import Bank, Main Operations, 2001–06(Billions of US dollars)
0
5
10
15
20
25
2001 2002 2003 2004 2005 2006
Export buyers credit International guarantees Export sellers credit
Sources: Annual Reports of the Export-Import Bank of China, 2003–2006.
21 China does not have a centralized aid agency. Projects supported by concessional loans require approval by China’s Ministry of Commerce and the host country government.
22 See Wang, et al (2005) for an assessment of major export credit agencies in industrial countries and emerging markets.

15
Sources: 2006 Annual Report of the Export-Import Bank of China; 2006 Annual Report of the Export-Import Bank of the United States; Japan Bank of International Cooperation Annual Report 2005; and 2005-06 Annual Review and Resource Account of the Export Credits Guarantee Department (UK). Note: Data for China are for 2006 disbursements, U.S. for 2006 authorizations, Japan for FY2005 commitments, and UK for FY05/06 issuances. Figures do not include official development assistance.
0
5
10
15
20
China Exim US Exim JBIC ECGD
Export sellers credit
Export buyers credit
International guarantee
Export credit insurance
Total guarantee Buyers and
supplier credit
Supplier credit insurance
Overseas investment insurance
Guarantees
Trade loan
Figure 9. Major Export Credit Agencies, selected activities, 2006(Billions of US dollars)
Investment loan
China Exim Bank has made efforts to enhance its collaboration with multilateral, bilateral, and private lending institutions active in Africa. In May 2007, it signed a memorandum of understanding with the World Bank to improve cooperation, beginning with road and energy projects.
China Development Bank Since CDB was established in 1994, its main mission has been to build China’s infrastructure (national highway and rail networks, gas pipelines, water projects, and power plants); vital economic sectors (petroleum-chemical refining, telecommunications); and the western provinces. It also gives loans to Chinese businesses as part of the national Going Global strategy, which makes CDB China’s most important bank in this regard. More recently, CDB has launched the China-Africa Development Fund, in line with the government’s pledge, to support Chinese FDI in Africa through equity participation as well as other means.
In 2006 CDB had a balance sheet of 2.3 trillion yuan, about US$290 billion. Its business has grown rapidly; outstanding loans more than doubled between 2002 and 2006. CDB provides loans in both yuan and foreign currencies. Short-term loans are used to fill client financing needs before medium- and long-term loan contracts are completed. CDB’s main source of funding is the bond market. Like China Exim Bank, it enjoys the same credit rating as China’s sovereign ratings.

16
China Export and Credit Insurance Corporation (SINOSURE) SINOSURE started operations in 2001. Its goal is to support Chinese exports and investment abroad by insuring against buyer and country risks, such as foreign exchange restrictions, expropriation, nationalization, and war. In 2006 the volume of new business reached US$29.4 billion, up from just US$2.8 billion in 2002 (Table 3). Although only 3 percent of its short-term insurance was for Africa in 2006, Africa accounted for near 30 percent of SINOSURE’s medium- and long-term business, second only to Asia (Figure 10).
Figure 10. SINOSURE: Breakdown of Operations by Continent, 2006
Source: SINOSURE Annual Report, 2006.
Asia35%
Europe 22%
Latina America
8%
Africa3%
Oceania3%
North America
29%
Asia49%
Europe 9%
Latina America
13%
Africa29%
Medium and Long-Term Outstanding Liability
Short-Term Business
Other State Entities China’s “big four” (Industrial and Commercial Bank, Bank of China, Construction Bank, and Agriculture Bank) and other commercial banks command most of the country’s financial savings. Because these banks compete in the credit market, some of their lending may affect the foreign trade and investment of Chinese enterprises. Also, many enterprises and financial institutions supported by provincial and local governments are active in Africa-related business. Their operations are not necessarily coordinated.
C. Commercial Policies
Market access and trade policy are important in fostering China-Africa trade. The Chinese government in January 2005 implemented the Special Preferential Tariff Treatment (SPTT), which removes the tariff from some 190 items exported to China from 25 of the least developed countries in Africa. Chinese custom statistics show that the value of goods imported from Africa under the SPTT reached US$380 million in 2005—a year-on-year increase of 88 percent, about 50 percentage points higher than the growth of China’s total imports from Africa for the same year. As part of the new package of commitments China

17
announced in November 2006, the number of tariff items affected by SPTT has been increased to over 440.
The Chinese authorities have also taken other steps. In June 2006 they announced the launch of free trade area (FTA) negotiations with the Southern African Customs Union as part of the efforts envisaged in their African Policy Paper to negotiate FTA with African countries and regional trading blocs. To help African countries build their export platform, China has set up more than 100 trade processing projects in Africa and in November 2006 committed to establishing three to five trade and economic cooperation zones in Africa by 2009.
IV. THE ROLE OF THE PRIVATE SECTOR
Mirroring its contributions to domestic economic activity, China’s private sector is in the forefront of the country’s external trade and investment expansion. However, its role in China-Africa economic relations has been much less appreciated, in part because there are no reliable data. Understanding China’s private enterprises (including those that are joint ventures and collectively owned) and their activities in Africa is important for assessing the evolution of trade and capital flows between China and Africa.
A. Private Traders
Before 1985 state-owned trading companies had exclusive rights to export, import, and foreign exchange, and sector-dictated mandates were strict. With these restrictions since relaxed, China’s foreign trade landscape has changed completely. State trading companies have faded away; trade has become decentralized, and private and joint venture firms are now the dominant forces in export and import.
In recent years individual small entrepreneurs, often traders, have been traveling or migrating to Africa to seek business opportunities. Once established in African towns, these entrepreneurs set up wholesale or retail outlets and import from China consumer goods like electronic appliances, textiles, and clothing, competing with local traders (ECOWAS–SWAC/OECD, 2006). Many of these companies have teamed up with local businesses. These companies, which have an intimate knowledge of the African market and local networks, may become more important in China-Africa trade as African incomes rise.
B. Private Investors
While the deals of Chinese state-owned oil companies such as CNPC, CNOOC, and SINOPEC in Angola, Equatorial Guinea, Nigeria, and Sudan caught headlines, millions of U.S. dollars were being invested by Chinese private enterprises in Africa with little fanfare (Box 1). These investments are not confined to textiles and mining. They cover a variety of services from agriculture to processing and manufacturing.

18
Box 1. Private Chinese Direct Investment in Africa: Some Examples
The examples below are based on Naidu (2007) and a Chinese government website (http://preview.english.mofcom.gov.cn). The examples are by no means comprehensive; nor are they necessarily consistent with official statistics. Nevertheless, they suggest the scope and scale of private Chinese investment in Africa.
• Since 1997 Chinese businessmen have invested US$24 million in a textile mill in Zambia. In recent years they have also poured more than US$300 million into mines, manufacturing projects, construction companies, and agriculture.
• COBEC, a Beijing-based company, plans to rehabilitate the Kamatanda copper and cobalt mines and three processing plants in Katanga province, Democratic Republic of Congo, in a deal worth US$27.5 million.
• Chinese companies have been operating since in the Zambezi province of Mozambique, logging and shipping timber products to China.
• Guoji Group, based in central China’s Henan Province, has set up an economic cooperation zone in Sierra Leone that has attracted about 20 Chinese small- and medium-sized enterprises producing necessities like spring mattresses, roofing tiles, hair lotions, and other light manufactures.
• Huawei Company, whose sales in SSA countries exceeded US$1 billion, has become the largest wireless technology CDMA product provider in the region.
• ZTE Corporation International has signed an agreement with Mundo Startel, the Angolan fixed-line telecommunications utility, for the sale of telecommunications equipment. ZTE would invest US$400 million to build Angola’s telecom network, upgrade the military telecommunications system, and construct a mobile phone factory.
• Hashan Company in eastern Zhejiang Province is tripling its investment in Nigeria to US$6 million to boost the local shoemaking industry.
• Global Trading, a subsidiary of a Beijing-based company, spent US$10 million to renovate the Bintumani Hotel in Sierra Leone. The renovated hotel began operating in early 2003. In return, Global Trading was contracted to manage the hotel for 10 years, with an option to renew the lease at the end of the term.

19
Differentiating between the FDI of China’s state-owned and of its private enterprises is becoming more difficult—and less meaningful. As the Chinese government restructures and sells shares in state-owned enterprises, the exact shareholder structure of many large Chinese companies becomes harder to ascertain. These companies have considerable operational autonomy and increasingly base their investment decisions on profitability considerations. Moreover, the government has been actively encouraging private firms, small and medium as well as large, to invest in Africa. The differences between state and private enterprises in access to state-supported financing have also been progressively reduced. In 2005 China and the UN Development Program together established the China-Africa Business Council to promote private Chinese businesses in Cameroon, Ghana, Mozambique, Nigeria, South Africa, and Tanzania.
C. Private Contractors and Builders
Private Chinese companies compete actively for construction contracts in Africa. When Chinese companies first entered the market, they tended to be large and state-owned (e.g., China Overseas Engineering Corporation, China Roads and Bridges Corporation, China Railway Construction Corporation, and Harbin Power Corporation). Now the number of private Chinese construction companies is growing rapidly, as are their size and capacity. Competition between Chinese companies is fierce. While state-owned enterprises receive more assistance from the Chinese government in terms of access to African governments and information on market trends, the private construction companies seem to be more efficient in implementing projects (CFCS, 2006, pp.77).
Typically, state-owned companies arrive with their own workforce.23 A minority of these workers stay in Africa after the work is completed and become independent contractors. Thus, there are a variety of private Chinese contractors and builders in the African market, some as small as single-person operations established by Chinese nationals residing in Africa. Some were originally private subcontractors for state-owned companies they had worked for in China, specializing in different areas of construction, like plumbing, electrical engineering, or air conditioning. There are no reliable figures on the number of Chinese now working in Africa. A recent study notes that the Chinese authorities identified 78,000 of them on the continent (ECOWAS–SWAS/OECD, 2006).
V. AID VS. COMMERCE: FACTORS INFLUENCING THE GROWING TIES
A silent feature of the recent developments in China’s economic engagement with Africa is that trade and other commercial activities have grown faster than aid flows. While
23 They consist mainly of project managers, engineers, and technicians. Based on a survey and four case studies (Angola, Sierra Lenoe, Tanzania, and Zambia), researchers at South Africa’s Stellenbosch University found that “with few exceptions, locals accounted for 85–95 percent of the total workforce of the Chinese construction companies examined for the survey” CFCS, 2006, pp. 79–80.

20
China has stepped up ODA, aid flows relative to trade declined from 20–21 percent in 1990–92 to 3–4 percent in 2004–05.24 As discussed in Section III, China’s government policies, with the objectives of mutual benefit and win-win outcomes have facilitated this shift; here we look at other forces that are at work.
A. Markets for Exports
Strong growth of the Chinese and African economies, together with the complementary trade pattern—China imports fuel and other commodities, Africa purchases investment and manufactured products from China—largely explains their surging trade in recent years. With total imports of goods close to US$800 billion in 2006 and real GDP growth in double digits, China is a large and fast-growing market. Its imports from Africa grew at an annual average rate of over 40 percent between 2001 and 2006—twice as fast as its total imports for the same period. Meanwhile, since 2004 SSA has recorded growth in the 5–6 percent range, making the region an increasingly attractive market for investment and consumer goods.
Falling barriers to cross-border trade and capital flows may also have contributed to the recent rise in China-Africa trade. It is not coincidental that the trade picked up in about 2001, when China joined the World Trade Organization. WTO membership helped China to lock in the gains from multilateral trade liberalization; it also greatly reduced uncertainty about market access. Progress in regional integration in Africa through common currency and regional free trade arrangements also gave Chinese investors and traders incentives to exploit the economy of scale of an expanded regional market.25
B. African Demand for Infrastructure
Inadequate infrastructure is one of the top constraints to business in Africa, where energy and transportation are among the main bottlenecks to productivity growth and competitiveness. According to a study prepared by the staffs of the World Economic Forum, the World Bank, and the AfDB, African firms lose as much as 8 percent of sales due to power outages, and transportation delays can account for as much as 3 percent of lost sales (World Economic Forum, 2007). Poor infrastructure also holds back commercial agriculture. Improving infrastructure thus is critical if Africa, particularly SSA, is to diversify exports, move up the value chain, and achieve sustained growth.
There is thus a large unmet demand; upgrading infrastructure requires financing and technical expertise, both lacking in many African countries. Moreover, traditional donors, bilateral and multilateral, tend to allocate only a relatively small proportion of their funding to infrastructure (Table 4), and for the private sector, investing in infrastructure in poor countries is a high-risk business.
24 Based on the aid flow estimates discussed in Section II.B.
25 Wang et al. (2007) analyze integration in the markets for goods, financial services and labor in the Common Monetary Area in Southern Africa.

21
Chinese enterprises have nevertheless been active in Africa’s infrastructure market. They are not newcomers—Chinese engineers and workers have been building large projects such as the Tanzania-Zambia railway since the 1960s. They have also gained experience in modernizing China’s own infrastructure. Their technology may be less capital-intensive and their labor and material costs tend to be lower than competitors in industrial countries, which gives them an edge in pricing and risk taking. Finally, access to substantial, long-term financing in China reinforces their competitive position. It is therefore not surprising that infrastructure financing and construction are a booming business for China and Africa.
C. China’s Approach to Financing
A pattern emerging in China’s official financial support to Africa is that it differentiates between social services and business development projects. Implicitly, grants (including in-kind) and quasi-grants (interest-free or low-interest-rate loans, with a willingness to reschedule) are used for projects that are meant to provide public goods or social services, such as hospitals, schools, public buildings or facilities, and technical assistance. To finance projects that are expected to generate revenue or export earnings, through state financial institutions and enterprises China provides trade credit and commercial loans, often with repayment linked to the output of the projects (e.g., oil). This approach thus aligns debt financing with evolving repayment capacity.
Instead of delivering a whole infrastructure project as an in-kind grant, as in the 1960s–1970s, China now uses aid to facilitate investment—only a small part of China’s infrastructure activity in Africa is outright aid. Concessional financing is often used as only part of a financing package for commercial projects.26 Because aid is used to finance infrastructure that complements investments in productive or export sectors, it helps leverage financing from nongovernmental sources and indirectly stimulates growth in the recipient country.
China’s official financing seldom directly supports a country’s recurrent public expenditure. Any assistance to current spending is usually in kind (e.g., free medicine, medical services, training of professionals, and scholarships). China’s technical assistance also seems to relate mostly to sectoral development rather than government functioning or external consultants for public service. These aspects of China’s official assistance—aligning debt financing with commercial projects, using aid to leverage financing from nongovernment sources, and focusing on capital expenditure and development of the productive sectors—help explain the changing financing mix and growing Chinese financial flows to Africa.
26 For example, in Gabon, the CMEC/Sinosteel consortium, with financing from China Exim Bank, is constructing a railway, a port, and a hydroelectric power station as part of the project to develop an iron ore mine (IMF, 2007, pp. 40). In Nigeria, oil rights secured in early 2006 are linked to plans to build power and other infrastructure (David White, “A Spectacular Resurgence,” http://www.ft.com. November 21, 2006).

22
D. The Future of China-Africa Economic Relations
China’s growing role in Africa is not transitory. As China-Africa economic relations are increasingly based on trade and investment, and trade is based on more than just commodities, the relationship is likely to expand, along with economic growth in China and Africa. Economic relations are increasingly dominated by commercial ties rather than by aid considerations (Box 2).
The private (more broadly, the corporate) sector, rather than government ministries, is increasingly the engine of economic exchange between China and Africa. The future of China-Africa economic relations will thus be shaped by shifts in comparative advantage and changes in global supply chains. This underscores the importance of improving the investment climate and strengthening the regulatory framework, particularly in Africa, to achieve win-win outcomes.
Issues of debt sustainability, governance reform, and environmental protection are associated with new lending and investment in Africa. These issues need to be addressed based on shared information, collaboration, and coordination between host country authorities and their development partners.
Total trade1 55.5 African exports 28.8 African imports 26.7
ODA and debt relief 2.3 ODA 2 1.0 Debt relief 3 1.3
Foreign direct investment4 0.9 Contracted projects 9.5 1 China Customs Statistics.2 2005; author's estimate.
4 2004; see Table 2.
(Billions of US dollars)
Box 2. Summary of Africa-China Economic Relations: Trade, Aid, and FDI,
2006
3 2005, based on debt relief announced by the Chinese government in November 2006.

23
VI. CONCLUSION
This paper intends to provide an assessment, based on fractional information, of China’s economic involvement in Africa and to identify the forces shaping burgeoning China-Africa economic relations. The study is undertaken against the background of a rapidly changing landscape of international trade and finance that has eclipsed traditional aid flows to middle-income countries, making Africa ever more central for development finance.
For Africa, China has been a market, a donor, a financier and investor, and a contractor and builder. While aid historically was of major importance, two significant changes have occurred since the turn of the new century. Because trade and investment have become much more significant in volume than aid flows, economic relations between China and Africa are clearly commercial rather than aid-driven. Meanwhile, the private sector has stepped to center stage. Here China’s foreign economic relations mirror changes in its domestic economy. China-Africa economic exchanges have become much more decentralized and broad-based.
The paper identifies four factors associated with recent changes in China’s economic engagement with Africa: Chinese government policies, growing Chinese and African markets for each other’s exports, Africa’s demand for infrastructure, and differential China’s approach to financing. China’s state financial institutions have been instrumental in cementing the new, commerce-based economic ties. In the process, they are helping correct chronic undervaluation of Africa by investors and helping fund new investments in Africa’s export and infrastructure sectors.
Africa will become an increasingly attractive market as incomes rise and progress in regional integration makes its markets even more attractive. It will also become a key destination for FDI, and it will continue to need infrastructure. Together these powerful market forces may put Africa-China economic relations firmly on a commercial footing. Both public and private sectors have a part in ensuring that the expanding trade and investment ties are mutually beneficial and contribute to sustainable growth and development in Africa. The impact of possible changes in Chinese demand on African terms of trade, trade patterns, and the economic prospects of countries in Africa are worthwhile topics for further research.

24
REFERENCES
Alden, Chris, 2005, “China in Africa,” Survival, Vol. 47 (No. 3), pp. 147–64.
Bosshard, Peter, 2007, “China’s Role in Financing African Infrastructure,” International River Network, http://www.irn.org.
Broadman, Harry G., 2007, Africa’s Silk Road: China and India’s New Economic Frontier (Washington: World Bank).
Center for Chinese Study [CFCS], 2006, China’s Interest and Activity in Africa’s Construction and Infrastructure Sectors (South Africa: Stellenbosch University).
ECOWAS-SWAC/OECD, 2006, “Africa and China,” Economic Series of the Atlas on Regional Integration in West Africa, http://www.atlas.westafrica.org.
Edwards, Chris, and Rhys. Jenkins, 2005, The Effect of China and India’s Growth and Trade Liberation and Poverty in Africa, IDS/Enterplan.
Ellis, Linden J., 2007, “China Exim Bank in Africa,” China Environmental Forum, March 22, 2007, Woodrow Wilson Center for Scholars, http://www.wilsoncenter.org.
Goldstein, Andrea, Nicolas Pinaud, Helmut Reisen, and Xiabao Chen, 2006, The Rise of China and India: What Is in it for Africa? (Paris: OECD).
He, Wenping, 2006, “China-Africa Relations Moving into an Era of Rapid Development,” in: Africa Institute of South Africa, Inside AISA, Oct./Dec., pp. 3–6.
__________, 2007, “China Loans to Africa Won’t Cause Debt Crisis,” China Daily, June 6.
International Monetary Fund, 2007, Regional Economic Outlook: Sub-Saharan Africa (Washington: IMF).
Jenkins, Rhys, and Chris Edwards, 2007, “The Economic Impacts of China and India on sub-Saharan Africa: Trends and Prospects,” Journal of Asian Economics, vol. 17, pp. 207–225.
Kennan, J., and C. Stevens, 2005, “Opening the Package: the Asian Drivers and Poor-Country Trade,” photocopy (Sussex University: Institute for Development Studies).
Moss, Todd, and Sarah Rose, 2006, “China Exim Bank and Africa: New Lending, New Challenges,” Center for Global Development, http://www.cgdev.org.
Naidu, Sanusha, 2007, “China and Africa’s Natural Resource Sector: A View From South Africa,” Online Africa Policy Forum (Washington: Center for Strategic and International Studies (CSIS)), http://forums.csis.org.
Taylor, Ian, 1998, “China’s Foreign Policy Towards Africa in the 1990s,” Journal of Modern African Studies, Vol. 36 (No. 3), pp. 443–60.

25
PBC and CDB, 2007, “Development Financing and China-Africa Cooperation—Concept Paper,” prepared by the People’s Bank of China and China Development Bank for a seminar during the African Development Bank Annual Meetings, Shanghai.
Yang, Lihua, 2004, “Sino-Africa Economic Cooperation: An Analysis of Trends and Developments” (Beijing: Institute of West Asia and Africa, Chinese Academy of Social Science), http://iwaas.cass.cn.
Wang, Jian-Ye, Mario Mansilla, Yo Kikuchi, and Siddhartha Choudhury, 2005, Officially Supported Export Credits in a Changing World (Washington: International Monetary Fund).
__________, with Iyabo Masha, Kazuko Shirono, Leighton Harris, 2007, “The Common Monetary Area in Southern Africa: Shocks, Adjustment, and Policy Challenges, ” Working Paper WP/07/158 (Washington: International Monetary Fund).
World Bank, 2004, “The Challenge of Financing Infrastructure in Developing Countries,” Chapter 6 in World Development Finance 2004 (Washington: World Bank).
__________, 2007, “Financial Flows to Developing Countries: Recent Trends and Prospects,” Chapter 2 in World Development Finance 2007 (Washington: World Bank)
World Economic Forum, 2007, Africa Competitiveness Report 2007 (Washington: World Bank), http://www.weforum.org/africacompetitiveness.

26
ANNEX I. DATA SOURCES AND PROBLEMS
Trade in Goods and Services The main sources of data for this study are from the National Bureau of Statistics of China (available from the NBSC’s website http://www.stats.gov.cn ); UN Comtrade; and IMF Direction of Trade Statistics. Data from these sources (see Table 1) follow similar trends; the differences are relatively small.
Official Development Assistance There are no time series data from Chinese official sources. China does not have a centralized aid agency. China Exim Bank, designated as the sole operating bank for Chinese government concessional loans, does not publish information on commitments and disbursements of concessional loans. While the Ministry of Commerce has the authority to approve concessional loans, other ministries also provide technical assistance (TA) and aid in kind (e.g., in the areas of health and education). There are also problems in pricing Chinese labor into the cost of aid, particularly TA and aid in kind, and in differentiating between official development assistance (ODA) and spending on trade and investment promotion. For these and other reasons (e.g., the exchange rate to be applied to historical data), the stock and flow figures discussed in Section II.B are not necessarily consistent.
For OECD countries this study relies on data published by the OECD’s Development Assistance Committee (http://www.oecd.org/statisticsdata).
Debt Relief Debt relief figures reported in Section II.B are based on Chinese official sources (e.g., the website of the China-Africa Cooperation Forum, http://english.focacsummit.org). It is difficult to compare these data with debt relief under the Heavily Indebted Poor Country Initiative because there is no breakdown by country, maturity, and concessionality of the original debt.
Foreign Direct Investment Data sources include publications of the NBSC and UNCTAD, and the websites of the Ministry of Commerce of China and the China-Africa Business Council. Problems with the data are discussed in Section II.D.
Contracted Construction Services The sources here are data compiled and published by the NBSC.
27
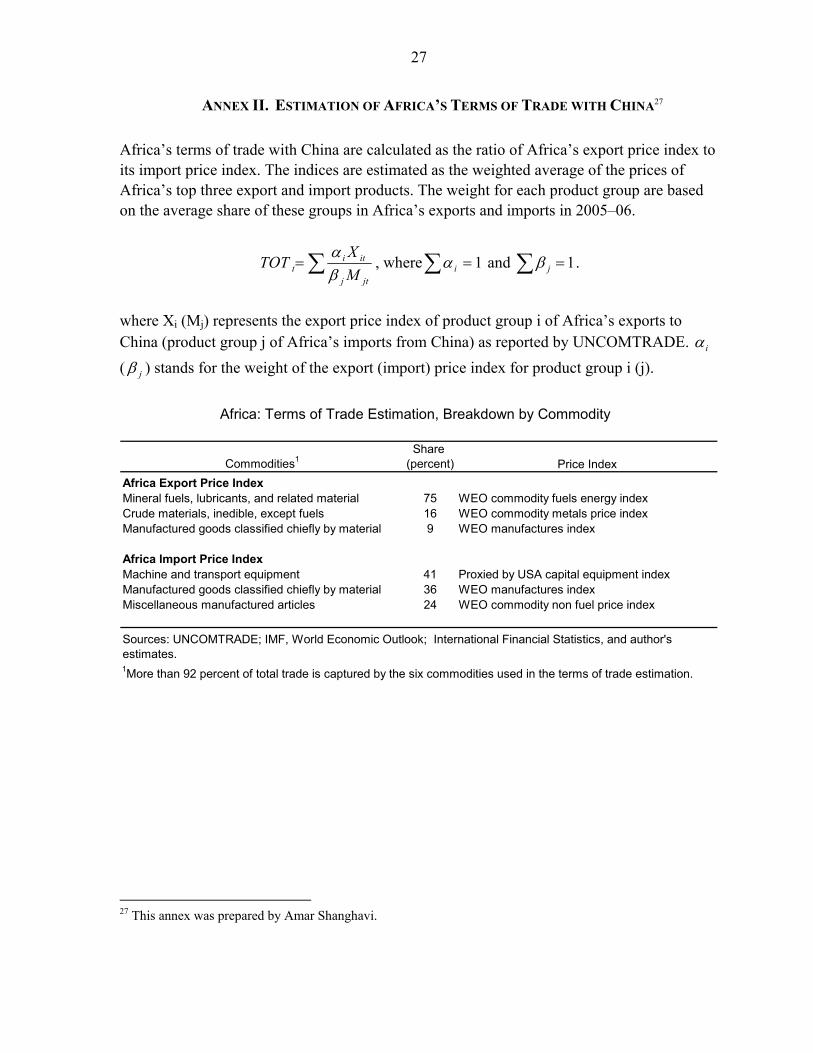
ANNEX II. ESTIMATION OF AFRICA’S TERMS OF TRADE WITH CHINA27
Africa’s terms of trade with China are calculated as the ratio of Africa’s export price index to its import price index. The indices are estimated as the weighted average of the prices of Africa’s top three export and import products. The weight for each product group are based on the average share of these groups in Africa’s exports and imports in 2005–06.
∑=jtj
itit M
XTOT
βα
, where∑ = 1iα and ∑ =1jβ .
where Xi (Mj) represents the export price index of product group i of Africa’s exports to China (product group j of Africa’s imports from China) as reported by UNCOMTRADE. iα ( jβ ) stands for the weight of the export (import) price index for product group i (j).
Commodities1Share
(percent) Price IndexAfrica Export Price IndexMineral fuels, lubricants, and related material 75 WEO commodity fuels energy indexCrude materials, inedible, except fuels 16 WEO commodity metals price indexManufactured goods classified chiefly by material 9 WEO manufactures index
Africa Import Price IndexMachine and transport equipment 41 Proxied by USA capital equipment indexManufactured goods classified chiefly by material 36 WEO manufactures indexMiscellaneous manufactured articles 24 WEO commodity non fuel price index
Africa: Terms of Trade Estimation, Breakdown by Commodity
Sources: UNCOMTRADE; IMF, World Economic Outlook; International Financial Statistics, and author's estimates.1More than 92 percent of total trade is captured by the six commodities used in the terms of trade estimation.
27 This annex was prepared by Amar Shanghavi.

28
2000 2001 2002 2003 2004 2005 2006
Africa Exports to China
China Customs Statistics 5.6 4.8 5.4 8.4 15.6 21.1 28.8IMF Direction of Trade Statistics 6.3 5.3 6.2 9.2 16.7 22.3 29.9UN Comtrade 6.2 5.4 6.0 9.0 16.4 21.8 29.4
of which: Sub-Saharan Africa 5.3 4.2 4.6 7.2 13.6 17.5 24.8
Africa Imports from China
China Customs Statistics 5.0 6.0 7.0 10.2 13.8 18.7 26.7IMF Direction of Trade Statistics 6.8 7.4 8.3 11.6 15.4 20.2 28.4UN Comtrade 6.4 7.1 7.7 10.9 14.5 19.0 26.8
of which: Sub-Saharan Africa 4.8 5.4 5.6 8.2 10.5 13.4 18.9
Trade Balance
China Customs Statistics 0.5 -1.2 -1.5 -1.8 1.8 2.4 2.1IMF Direction of Trade Statistics -0.5 -2.1 -2.0 -2.4 1.3 2.1 1.5UN Comtrade -0.2 -1.7 -1.7 -1.8 1.9 2.8 2.6
of which: Sub-Saharan Africa 0.5 -1.1 -1.0 -1.0 3.2 4.1 5.9
Memorandum items
Africa Exports to China
China Customs Statistics 134 -14 13 54 87 35 37IMF Direction of Trade Statistics 102 -15 16 48 81 34 34UN Comtrade 104 -13 11 51 81 33 35
of which: Sub-Saharan Africa 89 -20 9 58 89 28 42
Source: UNCOMTRADE, National Bureau of Statistics of China, and IMF, Direction of Trade Statistics.
Table 1. Africa: Merchandise Trade with China, 2000–06
(Billions of US dollars)
(Annual percentage change)

29
Source: World Bank, World Development Finance 2007, National Bureau of Statistics of China, and ECOWAS/SWAC/OECD 2006.1Also see China-Africa Business Council. www.cabc.org.cn, "United Nations and China-Africa Business Council to promote Chinese Investment to Africa."
(Billions of US dollars)
China official Statistics
6.32.3
0.40.3…
Total FDI to Sub-Saharan AfricaAngolaEquatorial GuineaNigeriaSouth AfricaSudan
FDI from China
0.61.5
0.01.93.41.9
Table 2. Foreign Direct Investment Flows to Africa, 2002–05
2003
9.13.51.4
13.8
0.81.3
20052004
7.11.41.7
0.9……ECOWAS-SWAC/OECD1
2.0
2002 2003 2004 2005 2006
Sum insured1 2.75 5.71 13.29 21.21 29.57of which: short-term insurance 1.75 4.26 10.63 16.98 23.32 medium and long-term insurance 0.94 1.36 2.07 2.80 2.61
Source: SINOSURE Annual Reports, 2002–2006.
Table 3. China Export and Credit Insurance Corporation (SINOSURE)
(Billions of US dollars)
1Includes short medium and long-term insurance; investment insurance; bonds and guarantee; and domestic insurance.
Major Activities, 2002–06

30
26 8 443 8 520 23 8
20 33 1218 21 22
2Weighted average based on share in net ODA.3 Data for 2006, includes aid provided by IBRD.4Data for 2006.
Source: OECD/DAC; World Bank Annual Report 2006, Compendium of Statistics on Bank Group Operation 2007.
1OECD/DAC data are on a net disbursement basis. Other major use include humanitarian aid, and commodity aid.
United StatesJapan
Economic Infrastructure
Table 4. Major Aid Use by Donor1, 2005
Social and Administrative Infrastructure
IDA3
AfDF4
(Percent of Total ODA)
Agriculture, Industry and Other Production
EU-152