Embed Size (px)
Citation preview

What does “peak coal” mean for international coal exporters? A global modelling analysis on the future of the international steam coal market
2018
AuthorsFranziska Holz (DIW Berlin)Ivo Valentin Kafemann (DIW Berlin)Oliver Sartor (IDDRI)Tim Scherwath (DIW Berlin)Thomas Spencer (TERI, IDDRI)
COAL TRANSITIONSwww . c o a l t r a n s i t i o n s . o r g

What does “peak coal” mean for international coal exporters? A global modelling analysis on the future of the international steam coal market
A project funded by the KR Foundation
AuthorsFranziska Holz1, Ivo Valentin Kafemann1, Oliver Sartor2, Tim Scherwath1, Thomas Spencer2,3
1DIW Berlin, 2IDDRI, 3TERI
Cite this report asHolz F., Kafemann I. V., Sartor O., Scherwath T., Spencer T.(2018). What does “peak coal” mean for international coal exporters? A global modelling analysis on the future of the international steam coal market. IDDRI and Climate Strategies.
Acknowledgments
The project team is grateful to the KR Foundation for its financial support. We would like to thank Roman Mendelevitch, Jesse Burton and Tara Caetano, Frank Jotzo and Salim Mazouz, as well as Fergus Green for their helpful comments and suggestions. We would also like to thank Amit Garg from the Indian Institute of Management Ahmedebad (IIMA) as well as Teng Fei from Tsinghua University for providing input to the scenario assumptions. We acknowledge funding from the KR Foundation. All remaining errors are ours.
Contact informationOliver Sartor, IDDRI, [email protected] Andrzej Błachowicz, Climate Strategies, [email protected]
Copyright © 2018 IDDRI and Climate StrategiesIDDRI and Climate Strategies encourage reproduction and communication of their copyrighted materials to the public, with proper credit (bibliographical reference and/or corresponding URL), for personal, corporate or public policy research, or educational purposes. However, IDDRI and Climate Strategies copyrighted materials are not for commercial use or dissemination (print or electronic). Unless expressly stated otherwise, the findings, interpretations, and conclusions expressed in the materials are those of the various authors and are not necessarily those of IDDRI’s board or Climate Strategies Board/Secretariat.
Publishers: IDDRI and Climate Strategies Editors: Pierre Barthélemy, Andrzej Błachowicz, Oliver SartorGraphic design: Alain Chevallier, Ivan Pharabod

Executive summary 4
1. Introduction 7
2. Fundamental uncertainties in the global coal markets 9
3. Introduction to the COALMOD-World model 14
4. Scenario architecture, assumptions and rationales 16
4.1. Overview 16
4.2. Scenario design for China 17
4.3. Scenario design for India 18
5. Climate scenarios in the global markets 20
5.1. The global picture 20
5.2. China 23
5.3. India 24
6. Investment and production plans in key exporting countries 26
6.1. Implications for investments going forward 26
6.2. South Africa 27
6.3. Australia 28
6.4. Indonesia 29
6.5. USA 30
7. Conclusions and policy discussion 31
References 33
Appendix 34
WHAT DOES “PEAK COAL” MEAN FOR INTERNATIONAL COAL EXPORTERS? 3
What does “peak coal” mean for international coal exporters?
A global modelling analysis on the future of the international steam coal market

Executive summary
4 WHAT DOES “PEAK COAL” MEAN FOR INTERNATIONAL COAL EXPORTERS?
1Executive summary
The beginning of the decline of global thermal coal demand is now likely by the early 2020s at the latest. Much has been made of the idea that the inter-national steam coal sector is facing an uncertain future. This future is indeed highly uncertain. However, this report goes further. Our analysis suggests that, in our central scenarios—those we consider most likely—global demand for steam coal will very likely stagnate (more or less) until 2020 before going into decline during the early-to-mid-2020s.Secondly, this study uses the COALMOD-World global coal market model to analyse potential impacts of a range of likely stagnation and declining global demand scenarios on major coal producers, consumers and in-vestment. Based on these results, this report sounds an alarm bell for major exporting countries heavily invest-ed in a continuation of business as usual demand from major developing economies.
This change will be driven by both climate and non-climate policy factors. Some frequently used scenarios still project either a stagnation of current lev-els of global thermal coal demand for the foreseeable future or modest growth out to 2040. In general, such scenarios—which are often qualified as based on cur-rent or moderately altered policy settings—see demand in Europe and North America declining, but offset by steady consumption growth persisting in India and the
Middle East, South East Asia and Africa and demand remaining stable in China. However, such scenarios struggle to adequately address three factors that are already demonstrating the capacity to quickly shift the fundamentals of the global market for coal:
y The speed of technological change;
y The iterative nature of the climate policy game;
yOther non-climate policy trends affecting the social, environmental and economic case for coal.
Figure ES.1 presents five scenarios explored in th is report. Of these five, four suggest a decline in coal demand from the next decade at the latest. Those that we ultimately consider to be the most likely scenarios in the short-term, i.e. between now and ~2025, are the ECT1, ECT2 and potentially the ECT-squared scenarios. The scenarios are based on current policies but also include both climate and non-climate policy factors, especially with regards to developments in India and China. In the medium-to-longer term, i.e. beyond the mid-2020s, we see coal demand potentially declining more quickly, as forces driving short-term trends in-tensify and are supported by stronger climate action. (This is therefore not a prediction of coal demand out to 2050.)
There is now a good chance that coal demand from China has not only peaked, but will begin to decline in the early-to-mid-2020s and that Indian demand will not replace this decline. Conditions on the ground in China point to a policy debate that is increasingly looking to move beyond existing policy of a simple cap on coal consumption by 2020. There is evidence of this already in China’s heating sector, where a s trong push phase out coal exis ts that is linked to air quality concerns. Further, there are also signs that debates about how to remove over-capac-ity in coal power emerging in China. Coupled with continued growth in clean energy investment, and improvements in infrastructure between regions to tap stranded clean energy sources, this would likely see coal demand squeezed in China over the coming decade. Moreover, in the event of an EU revision of its Paris commitment pre-2020, we see a revision of China’s Paris Climate commitments as also possible. This would likely hit coal demand first.Source: COALMOD-World results.
1000
2000
3000
4000
5000
6000
20502040203020202010
Mtpa
0
1000
2000
3000
4000
5000
6000
ECT-squared
ECT2ECT1
2°C
NDC
Figure S1. Global coal consumption 2010-2050 in various scenarios in Mtpa

Executive summary
WHAT DOES “PEAK COAL” MEAN FOR INTERNATIONAL COAL EXPORTERS? 5
Continuation of rapid Indian demand growth at recent speeds also seems unlikely. Despite a large push to upscale domestic production capacity to over a billion tonnes per year, coal power production capacity is currently at just 60%, given the large number of idle plant. New plant coming on line are generally more ef-ficient supercritical plant, are serviced by higher quality coal (in light of new coal quality standards) and therefore will consume less coal for the same output. Significant expansions of alternatives including major investment initiatives in wind and solar, nuclear and gas are also likely to go ahead during the next decade. Against this, it remains unclear to what extent Indian manufacturing or residential demand will pick up in the coming decade.The existing government in India is increasingly appear-ing to be determined to push ahead with a pro-climate mitigation agenda for the country’s energy system. Giv-en favourable domestic conditions for renewables, a key question is therefore the extent to which existing barri-ers to higher penetration rates can be removed, so as to enable energy access to be expanded through renewa-bles rather than coal. In principle, many of these barriers can be resolved as in other jurisdictions, if political will exists. Emerging battery storage solutions could also be a game changer potentially offering ways to shortcut infrastructure and other energy access constraints for small and medium scale consumers.
The impending decline in global coal demand will hit major exporters—such as Indonesia, Australia and South Africa—hard, if they fail to anticipate it. Given that China and India account for roughly half of global coal imports, what happens to demand in India and China will be critical and cannot be compensated for by demand increases elsewhere. Modelling results using the COALMOD-World coal market model show that even relatively small declines in domestic coal de-mand from large consumers can have large impacts on major exporters.
For instance, China in 2015 imported 270 million tonnes out of an annual consumption of 3.97 billion tonnes of coal (just 8%), while producing the remaining 3.7 billion tonnes domestically. Consequently, a similar order decline in Chinese coal consumption—of say 5 to 10%—could technically allow China to replace the majority of its im-ports with domestic production. While Chinese infrastruc-ture bottlenecks could limit short-term substitutability, Chinese coal is also somewhat flexible and infrastructure are being developed. In the medium term, especially if
declining coal consumption were to create political eco-nomic concerns about domestic mining regions, major exporters to China, such as Australia and Indonesia, could find themselves in a very vulnerable position quite quickly.As the second largest coal consumer, India’s coal de-mand from abroad is a second option for Asia Pacific and even South African producers. However, Indian imports are currently roughly 60 Mt for a domestic market of over 850 Mt in 2016 (i.e. 6.5% of consump-tion) and thus unable to offset a significant drop in Chinese demand. Moreover, there are increasing signs that Indian domestic coal production may grow faster than domestic consumption. Infrastructure and coal allocation challenges notwithstanding, the short-term outlook for Indian coal imports seems more likely to remain stable and the medium to long term outlook suggests decline. A decline in Indian coal import de-mand would first and foremost hit South African coal exports hardest. However, if Chinese import demand were declining, even a stabilisation of Indian demand could have significant knock on effects in South Africa as Pacific suppliers—and the US—simultaneously seek an outlet for surplus capacities.
Policymakers need to understand that coal transi-tion scenarios do not have to be “<2°C-compatible” to strongly impact major exporters. The sensitivities of the global coal trade to the domestic policies of a small number of large developing countries, highlights an important but underappreciated fact by coal sector stakeholders. Namely, even if, in the short term, coun-tries do not implement climate policies consistent with the goals of the Paris Agreement, major exporters can still be strongly affected.In thermal coal exporting economies, the coal global trade is often deeply embedded in domestic energy, regional and fiscal policy. Export revenues and relat-ed taxes are often important to, inter alia, subsidise domestic (coal-based) power prices, pay for local infrastructure, employ lower skilled workers in specific regions, and contribute to balancing budgets through tax revenues. Conversely, governments are wont to provide various supports to the sector in return for expectations of longer-term economic benefits. How-ever, the scenarios explored in this report suggest that it is time for governments to begin to prepare and implement credible transition policies. The transition may well arrive sooner and more disruptively than currently anticipated.

Executive summary
6 WHAT DOES “PEAK COAL” MEAN FOR INTERNATIONAL COAL EXPORTERS?
Investors, businesses and policy-makers need to develop a more nuanced view on the drivers and potential non-linear inflection points of transition in the global coal steam market. The most likely scenario for global coal demand in the short term is a non-linear transition, driven by feedback loops be-tween technological change, local environmental and macro-economic factors, and climate policy. The pace of technological change, particularly in the field of re-newable energy technologies, has continually surpassed expectations over the past decade. Impressive develop-ments in energy storage are already occurring will help to reinforce the capacity of renewables to displace con-ventional generation technologies, first by supporting distributed generation and providing energy access, but ultimately also alternatives to firm capacity that provides a competitive range of system services.The political power of air quality concerns, similar grow-ing concerns about water requirements for coal-plant cooling in water scarce regions, and concerns about fly-ash pollution of arable land are growing in large develop-ing countries. These concerns will contribute to further increasing pressure to close old plant, while raising the cost of new coal plants. Where alternative fuel technol-ogies can address these concerns at (close to) equivalent cost, and in an energy secure manner, coal will increas-ingly come under pressure. While further developments on the economic, technology and social acceptance of very high penetrations of RES will be needed to achieve <2°C mitigation scenarios, existing trends are enough to force the beginning of the decline in thermal coal demand in the coming 5 years or so.
Social constraints could, if not addressed, poten-tially slow the growth of alternative energy sourc-es, but even this will not save the coal sector. It cannot be ignored that alternative energy sources to coal also pose social and other constraints and that this can slow their implementation. Societal accept-ance of alternative energy technologies, and continued adjustments to regulatory and market conditions is of course crucial to achieving the penetration requires to ach ieve the Paris climate goals. However, th is paper argues that even relatively small ramp ups in alternative energy sources at the global scale will send coal demand into decline. For instance, displacing just 5-10% of Chinese coal demand could potentially send the global seaborne trade into a death spiral, as excess export capacities compete for a substantially smaller global market. Moreover, our view is that
social acceptance factors to renewable energy will be binding, but are not insurmountable through learning by doing and copying of best practices.
Economic growth is also not a panacea for coal. There is strong evidence that the world is in for slower and less economic growth led by the energy industry in the coming decade, than during the previous two. Future policy developments may therefore be non-linear in their impacts on global demand. Investors, businesses and policy-makers need to develop a more nuanced view on the drivers and inflection points of transition in the global coal steam market.We therefore constructed two scenarios with bottom-up information on the energy transition and coal demand in China, India and other major coal countries (Enhanced Coal Transition scenarios). We contrast them with a Business as usual scenario for global coal demand as well as a 2°C scenario that is much more ambitious in terms of coal demand reduction.
Exports cannot save US coal. In the USA, shale gas and coal power plant shutdowns have freed up a lot of coal for the global markets. However, without West coast export terminals, transport costs are too high to become a “base load” supplier in the large Asian mar-kets. Rather, the US exporters will become the marginal suppliers in the global markets and are first hit by coal transition efforts and a shrinking global market. This is likely to intensify the challenges currently facing US coal suppliers, independently of climate policy.
Policy makers in coal exporting and importing countries should be engaging in dialogue on the medium and long-term future of the coal sector. There is a tendency for policy makers in major coal pro-ducing economies to sometimes struggle, from a purely domestic vantage point, to grasp the full scale of the risks posed by external factors. Conversely, major consumers may well stand to be impacted by policy developments in supplier countries as they react to a declining global market pie. A first step for policy makers to anticipate and manage these uncertainties is through a focused dialogue on the future of the sector in their respective countries.

Introduction
WHAT DOES “PEAK COAL” MEAN FOR INTERNATIONAL COAL EXPORTERS? 7
1. Introduction
Stakeholders in the international steam coal market are increasingly being called upon to navigate starkly con-trasting visions of the future. On the one hand, coal remains a major source of energy globally, accounting for around 30% of the world’s primary energy consumption while steam coal accounts for around 40% of global power production (BP, 2017). Steam coal is an important fuel source for large developing economies in particu-lar. On this basis, projections by reputable independent institutions suggest that, based on current policies and technological assumptions, the aggregate consumption of coal globally will plateau and remain more or less at current levels until 2040 (e.g. IEA, 2016; MIT, 2015).On the other hand, there are persuasive reasons to be-lieve that a continuation of the status quo is no longer plausible. Most obviously, the status quo is inconsistent with the Paris Climate Agreement, which calls on coun-tries to collectively limit post-industrial temperature rises to +1.5-2°C. This will require significant reduc-tions in global coal consumption, even with extensive deployment of carbon capture and storage technology (cf. Figure 1). Indeed, this arithmetic is already accepted by a number of governments, which have recently an-nounced coal phase-outs by 2030 or earlier under the Powering Past Coal Alliance.1
Thus, ”current policies” therefore can—and will—change, most likely creating a non-linear pathway between cur-rent “NDC-style” coal demand scenarios and more am-bitious scenarios required by the Paris Agreement.Non-climate policy factors also suggest additional rea-sons why policy makers in large coal-consuming coun-tries might be persuaded to pursue quite substantial deviations from business as usual. This is likely to be due to interactions that can exist between a number of existing factors that are now becoming increasingly important to the future of thermal coal as an energy source. The inherent uncertainty around these factors are arguably not well represented—or at least not well interpreted—in existing mainstream scenarios—proba-
1 The Power Past Coal Alliance is an alliance dedicated to phasing out coal from further use in the power sector. As of December 2017, it included 34 national, state and city governments (including France, UK, Canada, Italy, Mexico, Netherlands, among others) and over 20 multi-national companies. https://www.oneplanetsummit.fr/IMG/pdf/powering_past_coal_declaration.pdf
bly because their interactions are hard to define neatly and can lead to non-linear scenario outcomes that can be difficult to explain. Nonetheless, if one is to explain the systematic errors in recent projections, then these factors consistently play a role.First and foremost, the unexpected and endogenous increase in the pace of clean technology developments can no longer be discounted as a threat to the future of coal as a baseload power source, including in devel-oping countries. Endogenous declines in cost through growing economies of scale (cf. Section 2), the unexpect-ed success of innovation pull policies, and the ensuing emergence of complementary solutions such as energy storage solutions, will mean that renewable energy (plus storage) can no longer be considered an inferior alter-native for sustainable economic development to coal. The modular nature of renewable energy also presents advantages in a growth market environment, since the scale of commitment to new capacity can be more ef-ficiently tailored to uncertain developments in energy demand, or infrastructure limitations.The development of equivalent or close-to-equivalent-cost alternatives for firm capacity technologies is all the more powerful when set beside growing concerns about coal’s adverse environment, health and social impacts. For instance, it is now difficult to see how India’s coal consumption can pursue China-like rates of growth, when increasing numbers of plant are being forcibly prevented from operating during increasingly dry summers due to water constraints. Similarly, developing countries’ gov-ernments’ aggressive pursuit of better air quality is already impacting coal demand and this will grow in future as cleaner and cost-effective alternatives become more read-ily available. Concerns over fly ash handling and disposal and land-degradation will further add to the multitude of additional costs that face new coal plant builders.Global macro-economic factors, such as Chinese eco-nomic rebalancing towards services and consumption led growth, the weight of excess industrial capacity on new industrial capacity growth, and different com-parative advantages and economic strategies, will also mean that the past will not look like the future for the energy-and-growth nexus. In short, a scenario is increas-ingly plausible in which large emerging economies see

Introduction
8 WHAT DOES “PEAK COAL” MEAN FOR INTERNATIONAL COAL EXPORTERS?
an interest in a transition to less use of coal as both desirable and feasible.At the same time, on the supply side of the market, in-vestments are being planned and undertaken that would potentially raise coal production and/or export capacities to a significant degree. For instance, Australia is cur-rently exploring the option of issuing public financing to support the Carmichael Coal Project in Queensland. The mine’s proponent, Indian power company Adani, has stated that the mine has an estimated 7.8 billion tonnes of coal resources and that production capacity could be expanded to 60 Mtpa2 by 2022, with a mine life of possibly a century.3 Simultaneously, India (the intend-ed destination of this coal) is attempting to reduce its dependence on foreign energy imports through several measures. Coal India Ltd. is seeking to expand domes-tic production capacity from approximately ~650 Mt in 2016-17 to 1 Gt/yr in the coming years. This is despite the fact that existing Indian coal power plants run at an average load factor of approximately 60% and as other new power sources are also emerging.The apparent inconsistency between these two phe-nomena—i.e. stagnating and potentially falling global demand in the foreseeable future and major new invest-ments in long-lived production capacity—raises impor-tant questions. It potentially amplifies risks of a “hard landing” for coal companies, workers, investors, national and local governments and other affected stakeholders. Indeed, lessons from past coal transitions suggest that the equilibria in coal markets can move very quickly in re-sponse to changing external factors. If unanticipated, this can result in very negative consequences for stakeholders who struggle to remain in control of their future once challenging economic realities have set in (IDDRI, 2017). Such a scenario would of course also have implications for the global effort to limit climate change, as a failure to prepare to manage these changes would inevitably create opposition to climate policy.This raises the question of how coal market actors can hope to manage these uncertainties. This is the subject of this report, which aims to do three things:
y Explore the implications of the implementation of 5 different coal transition scenarios for global coal trade, including climate policy, technology and non-climate policy drivers;
2 Mtpa: million tons per year (metric tons, with 1 ton = 1000 kg)3 https://www.sourcewatch.org/index.php/Carmichael_Coal_Project
yHighlight the implications of each of these scenarios for major producing and exporting countries, in terms of quantities sold, prices, and investment implications, including the risks of stranded assets;
y Reflect on common themes across the scenarios for the future of the coal market and identify possible policy and coordination mechanisms to help address interdependencies between transition pathways in net consumer and net producer countries.
Some key messages that emerge from analysis are:
y The peak and early stage decline of global thermal coal demand is now likely in the coming decade.
y This change will likely be driven by both climate and non-climate policy factors: namely technological change, climate policy and non-climate environmental and macro-economic factors.
y The impending decline in global coal demand will hit medium and higher cost suppliers hard, if they fail to anticipate it.
y “Endogenous coal transition” scenarios are still a fair way from being Paris-compatible, perhaps resulting in up to a 1/3 decline in annual global coal demand.
yHowever, scenarios do not have to be <2°C-com-patible to strongly impact net global suppliers. Giv-en rigidities in existing capacity, even scenarios that are not consistent with 2°C could have very severe impacts on major producers, especially for high cost exporters.
yNew long-lived expansions of thermal coal mines run a high risk of being stranded under many scenarios, even with moderate climate ambition. Large medium and high cost exporters, especially to China and India, are highly exposed.
yWhat happens to demand in India and China will be critical and cannot be offset by increasing demand elsewhere. Indonesia has a key role in cheaply supply-ing the Asian market but it has limited coal reserves on the horizon to 2050.
y Exports cannot save US coal, which will struggle to find an outlet for excess domestic supply unless (risky) West Coast export facilities are built.
This report concludes with a call for policy makers in coal exporting and importing countries should be engaging in dialogue on the medium and long-term future of the coal sector, in order to better anticipate the increasing likelihood of the risks discussed in this report.

Fundamental uncertainties in the global coal markets
WHAT DOES “PEAK COAL” MEAN FOR INTERNATIONAL COAL EXPORTERS? 9
2. Fundamental uncertainties in the global coal markets
There are a number of drivers of coal transitions. These include both climate policy and non-climate policy driv-ers. On the climate policy side, limiting temperature rises to +1.5-2°C compared to pre-industrial levels, as required by the Paris Agreement, will require significant reductions in coal demand on aggregate, even with the deployment of highly efficient coal-fired power plants and carbon capture and storage technology (cf. Figure 1). This conclusion stems partly from the fact that only a certain portion of the existing coal and fossil fuel reserves can be burned, even if it is burned in highly efficient plant. It also reflects expected real-world limitations in the timing, geological and socio-economic feasibility4 of installing and retrofitting carbon capture and storage with almost complete capture on a massive global scale (McGlade and Ekins, 2015).
4 McGlade and Ekins (2015) explore a range of scenarios of the level of burnable fossil fuels under the IPPC’s central +2°C scenarios. They explore options whether CCS is widely available for retrofitting with coal, gas and oil consumption from 2025 and where it never becomes available. They ultimately find that widespread CCS would allow only an additional 6% of the world’s coal reserves to be burned due to challenges related to time-to-roll out, economic competitiveness, and the late date of introduction.
Nevertheless, climate policies around the world are not currently consistent with a less than 2°C scenario. Indeed, the Paris Agreement, which agreed on a process to address the gap, foresaw this: that NDCs would be revised every 5 years under the Paris Agreement and climate ambition increased. Thus, from a climate policy perspective, a future driver of coal transitions is not simply the 2°C scenario per se, but the pathway towards it via the content of cur-rent and future revisions of NDCs. This is important to recognise as it creates a range of possible pathways that lie between current policies and the 2°C scenario, which could quickly become the new normal for coal.The potential significance of NDC revisions is highlighted in Figure 2. It shows two possible scenarios for how the Chinese government might elaborate on its current NDC. In the first scenario, by committing to faster cuts in coal use beyond 2030, or, in the second scenario, by raising ambition under an early peaking scenario, in the light of structural changes in the Chinese economy and reinforced climate ambition. The point is that just because a scenario is a “baseline” or a “current policy scenario” does not nec-essarily make it the most likely scenario. This is especially
Demand reduction
Notes: IEA’s 2016 450 ppm scenario assumes that there are 3,800 large scale commercial CCS sites operating worldwide by 2050 and that there is a feasible maximum of 125 Gt of CO2 that could be captured. McGlade and Ekins (2015) include significantly lower CCS assumptions, as they question the economic and social feasibility of reaching significant scales of deployment prior to 2050, such that emissions from coal would be likely to be consistent with the global <2°C carbon budget.
withhigh CCS
withlow CCS
M&E (2015)
IEA WEO (2016) - NPSIEA WEO (2016) - 450ppm
Source: Illustration by DIW Berlin, based on data from IEA (2016) and McGlade and Ekins (2015).
EJ
0
25
50
75
100
125
150
175
200
2040203520302025202020152010
Figure 1. Global coal consumption in 2 alternative 2°C scenarios versus a current reference scenario

Fundamental uncertainties in the global coal markets
10 WHAT DOES “PEAK COAL” MEAN FOR INTERNATIONAL COAL EXPORTERS?
true in a dynamic policy context, such as the one creat-ed by the Paris Agreement, where the iterative nature of country commitments means that “current policies” and “baselines” will be moving constantly.However, there is also an increasingly convincing case to make that non-climate policy factors could significantly impact coal demand pathways and hence be an important contributing factor to coal transitions. Factors such as pop-ulation growth, GDP growth, will of course affect energy demand growth rates and thus demand for coal. However, a number of other factors could also influence the way that population and GDP growth do or do not translate into energy demand and into demand for coal in particular.One key factor is how the industrial structure of devel-oping countries develops. At present, it can be argued that China has not only reached full potential, but ac-tually built excess capacity in terms of energy-intensive industries (Shi et al., 2018). While China’s use of coal grew in 2017, in reality this may well reflect more cyclical than structural factors. Indeed, there is evidence that China experienced a province-specific recession in 2015 and 2016,5 but that sustaining long-term growth will require structural change away from energy intensive industrial output (Grubb et al., 2015).Assumed increases in power and coal consumption in many developing countries project forward past trends in energy use when countries have industrialised. Howev-
5 Bloomberg, 2/08/2016: Recession hits China along with 10% growth as provinces diverge. https://www.bloomberg.com/news/articles/2016-08-02/recession-hits-china-along-with-10-growth-as-provinces-diverge
er, there is debate about whether future development of economies in India or Africa will necessarily follow the very manufacturing intensive pathways of China and some southeast Asian countries. There are significant uncertain-ties here. It is noteworthy nonetheless, that some leading trade economists suggest that the export-based manu-facturing led miracles of these countries are unlikely to be repeated due to the strength of existing competition, existing global overcapacity and technological change in the labour intensive manufacturing (Rodrik, 2015).Another key factor is how the energy efficiency of the sectors of the economy develop themselves due to tech-nical and other political factors. McKinsey (2015) has suggested that rapid developments in technology could mean that future investments and operating processes in energy intensive manufacturing, service sectors and households could potentially be significantly more ener-gy efficient than they are today. Particularly in develop-ing countries—where natural and energy resources pose socio-economic problems—such opportunities could in principle present companies and governments with a way to both clean up their environmental image while saving money or promoting growth. With respect to coal consumption in particular, large consuming countries are increasingly looking to be more energy efficient in its use, either by raising internal prices through taxes and carbon markets, raising standards for coal grades, co-fir-ing with biomass, replacing old plant with more efficient plant, etc. The extent of this impact remains uncertain. However, the ability of a large number of cumulative changes in energy consumption patterns to substan-
Similar to China's current NDC scenario Possible emissions under late peak/slow decline scenario
Possible revised emissions under an earlier peak/decline scenario
(implies coal peak in 2025 and decline from 2030 onwards)
(implies coal peak in 2020 and decline thereafter)
Source: Coal Transitions project, based on data and analysis from Tsinghua University.
4
6
8
10
12Gt CO2
0
2
4
6
8
10
12
20502040203020202010
PEAK-2025
PEAK-2030
Figure 2. CO2 emissions under 2025 vs 2030 peaking scenarios

Fundamental uncertainties in the global coal markets
WHAT DOES “PEAK COAL” MEAN FOR INTERNATIONAL COAL EXPORTERS? 11
tially affect future trajectories for conventional coal use activities should not be underestimated. This has been exemplified by unexpected and substantial declines in energy demand in Europe even after the worst of the economic crisis was over (IDDRI, 2013).Another potentially underestimated driver of steam coal transitions is technological change in the electricity sec-tor at large. Recent and unexpectedly fast declines in the levelised costs of renewable energy technologies are making the difference between coal and renewables (esp. solar, onshore, offshore wind) a viable econom-ic proposition, especially if the full environmental and health costs of coal are taken into account (cf. IRENA, 2017; IEA, 2017b; IEA 2016b).In response, it is commonly noted that such intermittent technologies cannot provide baseload or dispatchable power. However, new developments are also emerging that suggest that issues of intermittency will become less of a limitation, whether due to battery or longer-term storage solutions; or the design of the technolo-gies themselves to maximise load factors (e.g. in the case of wind: floating offshore platforms, higher hub heights, larger blades). Of course, it remains to be seen how the costs of these new solutions will play out. However, recent evidence shows that stationary storage costs are coming down and are already being deployed, especially in dis-tribution generation systems (IEA, 2016b; IRENA, 2017).For instance, approximately 40% of small-scale solar PV systems in Germany have been installed with bat-tery systems in the last few years, with modest finan-
cial supports. In Australia, with no financial support in place, approximately 7,000 small-scale battery systems were installed in 2016. Moreover at utility scale, bat-tery electric storage is beginning to emerge due to its ability to provide a range of system services that can be remunerated in various ways. This has occurred in Australia and in the UK. The growth of mobile storage applications—especially for fleets—also has the potential to contribute to the development of storage as electric vehicles become more common.The fast-evolving landscape of new energy technologies will be critical to the future of coal and is a potential ‘game changer’. For instance, IRENA (2017) projects that the stock of electricity storage capacity (includ-ing pumped hydro) in could potentially grow from an estimated 4.67 TWh in 2017 to 11.89-15.72 TWh if the share of renewable energy in the global energy system were to be doubled by 2030.Intermittent RES-E technologies pose a double challenge to coal: not just because they compete for load hours per year, but also because they pose an indirect challenge to the business model of traditional coal plant. The fluctu-ations in the production from renewables tend to make coal plants less economically attractive as a baseload power proposition. Thus, investors in places such as the United States—where gas is relatively cheap and readily available due to the shale gas boom—have tended to turn to nimbler natural gas plant as smaller and more flexible alternatives to coal. However, even in places where gas is more expensive or infrastructure is lacking, other flexibility
Source: IDDRI, based on data from IRENA, World Coal Association
Offshore wind
Onshore wind
Solar PV
0.05
0.10
0.15
0.20
0.25
2018 2020*2016201420122010
USD/KWh
0.00
0.05
0.10
0.15
0.20
0.25
New hard coal plant cost range
* forecast
Figure 3. The increasing competitiveness of renewable energy with hard coal technologies
(Levelised cost of generation basis)
Data Source: IEA, Energy Technology Perspectives 2017
100
200
300
400
500
600
700
800
2018 2020* 2022*2016201420122010
USD/KWh
0
100
200
300
400
500
600
700
800
* forecast
Figure 4. Cost of Lithum-ion Battery Storage

Fundamental uncertainties in the global coal markets
12 WHAT DOES “PEAK COAL” MEAN FOR INTERNATIONAL COAL EXPORTERS?
options (such as battery storage, demand-side response measures, hydropower, dispatchable renewable energy such as biomass) may increasingly appear more attrac-tive than (re-)investing in coal-fired plants to change their business model from baseload to load-following plant.Of course, the declining costs of RES and storage, need to be added together to get a sense of their systemic competitiveness with coal. However,It can of course not be ignored that alternative energy sources to coal also pose social constraints and that this can slow their implementation. Societal acceptance of alternative energy technologies is of course crucial to achieving the Paris climate goals. However, this paper argues that even relatively small ramp ups in alternative energy sources at the global scale will send coal demand into decline. Moreover, our view is that social acceptance factors to renewable energy will be binding, but are not insurmountable through learning by doing and copying of best practices around the world.Finally, while no energy production technology has zero environmental impact, it cannot be denied that in very large quantities and especially when concentrated in specific areas, coal power has unusually significant local environmental impacts. Local air pollution is the most obvious example, as evidenced by recent efforts by the Chinese government to replace coal-based district heat-ing with natural gas in 28 major cities. The competition between agriculture and coal plant for water is already beginning to limit coal-power output in places like India and imply higher new build costs (to install dry-cooling systems for instance). In densely populated countries,
coal mining and burning can also produce other impor-tant and potentially explosive sources of environmental concern for local stakeholders, such as ash disposal, soil and water contamination, and mine fires.In short, all of the above factors highlight significant uncertainty regarding the future of coal in global ener-gy systems, and hence the future of the global steam coal market. This suggests that projecting past trends or correlations (e.g. between GDP growth and coal con-sumption) into the future is increasingly difficult and risky as a guide the future.What does seem increasingly clear is that there are significant downside risks for the coal sector in terms of future demand remaining stable. While none of the above factors is likely to be a “knock-out punch” to the coal sector, it is the combination of factors together and the fact that so many of them point to potentially lower than currently expected demand that is striking.Indeed, it is also interesting to consider the fact that re-cent forecasts by experts have consistently shown a trend towards been revised downwards—and sometimes very substantially. Figure 5 and Figure 6 show the forecasts for the decade between 2016 and 2025 for total global coal demand from the IEA’s World Energy Outlooks between 2011 and 2017. The data show that from 2013 onwards, coal demand to 2020 and 2025 has been consistently revised downwards. In total, the gap between the fore-cast of 2013 and 2017 for demand in 2020 is now close to 1,000 Mtce, while the gap between the two forecasts for 2025 are closer to 850 Mt. Since policies change coal consumption itself relatively little from year to year, this
Source: IDDRI, based on forecast data from IEA WEO reports.
2008
2013
2015
2016
2017
2011
2013
2015
2016
2017
Mtce
5000
5500
6000
6500
7000 Mtce
5000
5500
6000
6500
7000
2020 20252016 2025 20302020
Figure 5. IEA WEO global coal demand forecasts evolution (Current Policies Scenarios)
Figure 6. IEA WEO global coal demand forecasts evolution(New Policies Scenarios)

Fundamental uncertainties in the global coal markets
WHAT DOES “PEAK COAL” MEAN FOR INTERNATIONAL COAL EXPORTERS? 13
appears to underscore mainly non-climate policy factors, such as technological change, structural economic chang-es in key countries like China, slower than expected de-mand growth from the developing world, and the shale gas boom in the United States.The potential impact of climate policies also appears to be making its way into the data. Interestingly, the IEA’s New Policies Scenarios’ forecasts for coal also show a similar downward trend over time, suggesting that new policy announcements may also be starting to have net negative rather than net positive effects on global coal demand (Figure 6). This helps to underscore the point that new policy developments—which are mostly climate and en-vironmental policy measures—appear more likely to drive coal demand to the downside than to the upside.Any forecast is ultimately destined to be wrong. None-theless market fundamentals do appear to be changing
substantially and in ways that are having clear and pres-ent impacts on the steam coal market. These changes appear to be skewed towards the downside for global coal demand. These trends have potentially important implications for policy-makers and stakeholders (from labour, to investors, to coal mining regions). Left unan-ticipated they may also represent a major barrier to the implementation of fair and effective coal transitions in line with the aims of the Paris Agreement.This report therefore takes the possible interaction of such downside risks seriously—indeed, interpreting them as the most likely scenario—and to explore their possible implications. Instead of providing forecasts, we there-fore explore a range of likely scenarios—and their effects on global coal markets—that include both climate and non-climate policy drivers. The following section de-scribes these scenarios in more detail.
Box 1. The 2017 coal consumption rebound in China: New structural trend or dead-cat bounce?
1 https://www.chinadialogue.net/article/show/single/en/10212-China-s-carbon-emissions-drive-global-uptick-in-2-17
In 2017 Chinese coal consumption rebounded by 3% after successive year on year stability in 2015 and 2016. This raises the question: was this rebound in consump-tion a sign that China has returned to its pre-existing trend of increasing demand? Or was it a shorter-term phenomenon? Our analysis suggests that this rise may be more related to one-off cyclical factors than any new trend towards rising emissions. The growth in coal use in 2017 in China was due to several factors, but all of these appear to be short-term or one-off events. Firstly, it appears that the rebound was in part due to extreme weather—in particular unusually low rainfall in Southern China—which limited the ability of hydropow-er capacity to be used and brought more coal generation into the system1. Secondly, some suggest that China in fact had an ‘unre-ported recession’ in certain industrial regions 2015 and 2016, which was finally reversed in 2017. This recession did not show up in aggregate GDP figures, which may have been overstated. As a result, the tremendous en-ergy intensity gains reported in the period 2013-2016 of 5.0% per year may in fact reflect, in part, an inflated denominator (GDP). In turn, the easing of this recession in 2017, on the back of stimulus measures introduced in 2016, led to an increase in energy demand as actual growth exceeded the real underlying improvement in
energy intensity (which was 2.3% in 2017) (Enerdata, n.d.; Financial Times, 02/05/2018). The stimulus of 2016 was neither sustainable nor aligned with the goal of restructuring the Chinese economy, and therefore economic projections suggest a slowing of growth, in particular in the industry sector, for the years ahead as the stimulus unwinds. This should assist with controlling energy demand growth in coming years. More generally, however, s tructural factors appear to support the hypothesis of a peak in coal use. The government has taken aggressive measures to halt new build of coal plant under the latest 5-year electricity plan. Renewable energy consumption rose 14% year on year in 2017 despite the decline in hydropower usage. The government continues to pursue policy measures to phase down coal use in the district heat-ing sector—despite teeth ing problems in 2017—as well as in the industrial and power sector, by closing inefficient excess capacity. Indeed, th is remains an important priority for the authorities due to other non-climate policy concerns, such as air quality and economic rebalancing towards h igher value-added activities and services. Provided economic restructuring continues as planned in China over the coming decade, 2017 thus appears like an exception rather than the rule.

Introduction to the COALMOD-World model
14 WHAT DOES “PEAK COAL” MEAN FOR INTERNATIONAL COAL EXPORTERS?
3. Introduction to the COALMOD-World model
We explore the different scenarios using the COALM-OD-World model.6 This is an established multi-period equilibrium model, which simulates global coal market outcomes such as coal production quantities, coal trade flows, prices, and coal infrastructure investments (Holz et al., 2015, 2016). The model was first developed as a tool to analyse competition in the global steam coal trade (Haftendorn and Holz, 2010). Later, it was extend-ed to investigate national policies and questions such as investment perspectives in the coal value chain (Haf-tendorn et al., 2012). It was used in the multi country “Global Coal” project convened by the Stanford Univer-sity’s Program on Energy and Sustainable Development which focused on the emerging economies’ perspec-tives of coal use (Thurber and Morse, 2015). In the “Coal Transitions” project, we benefitted again from the co-operation with country teams. In particular the national experts from Australia, South Africa, China, and India checked, and in some cases updated, the model’s input assumptions based on their local knowledge. Moreover, their input was crucial in deriving the project scenarios (see Section 4).The model includes two types of players that maximize their expected and discounted profits over the period from 2010 to 2050: producers and exporters. They face consumers (Figure 7). All stylized players are determined using geographical parameters, i.e. they are assigned to countries or regions.For a production node, all coal mines in a geographi-cally restricted area are aggregated to a model agent called “producer”. The production nodes are defined by the geograph ical location of the reserves, the type of coal, and production cost properties. Export terminals in a specific region are represented by ex-port nodes. The capacities of the real-world export harbours are aggregated to a model agent called “exporter”. Exporters do not only operate export terminals, they also have to pay for the seaborne transport. Demand nodes, or rather consumers, are represented by a demand function and defined by
6 http://www.diw.de/coalmod
a geographic area. In that area, the consumption of all coal fired power plants is aggregated. Demand nodes can be supplied in two different ways: either domestically (via land transport) or from seaborne trade through a port. Coal import terminals as well as inland transport links to the final customers are implicitly represented in the demand nodes. We in-clude quality differences in terms of energy content of the coal from different production regions. Demand is expressed as demand for energy while the various capacity constraints (in production, transportation, export) apply to tons of coal.The relationship between producers, exporters, and consumers as well as the model structure is depicted in Figure 7. Producers extract and process (i.e., produce) the coal in order to sell it either to local demand nodes or to exporters under a production capacity constraint in every year. Furthermore, the reserves in a production node are limited over the total time horizon (until 2050). For its profit maximization, the producer has to take into consideration production and inland transport costs. Production and transport capacities can be expanded by investments.Each producer has short-run production cost functions which can vary over time. The producer’s marginal cost curves are generated by aggregating individual mines from the mining basin of the producer. Due to market dynamics, the cost functions are not static and might change over the model horizon. We assume that cheap mines – which are usually the easiest to access and therefore, often the oldest to operate – are depleted first. Since all mines have a given amount of reserves, which can be mined out over time, the cheapest producers are the ones to disappear first from the cost curve. This is called “mine mortality” and it shifts the production cost function.In a similar manner to producers, exporters are also maximizing their profit under constraints. Each export-er is connected to one producer only. Therefore, the energy content of the coal sold by a certain exporter is the same as of the related producer. Exporters can only sell to demand nodes which have a port. An

Introduction to the COALMOD-World model
WHAT DOES “PEAK COAL” MEAN FOR INTERNATIONAL COAL EXPORTERS? 15
exporter makes its profit by maximizing the differ-ence between the revenue from sales and the costs of purchasing coal (FOB price from the producer), operating the export terminal, transporting (shipping) to the importing consumer as well as investment cost in additional export capacity.The demand of a consumer is described by a linear inverse demand function. Each consumer has an in-dividual demand function. The demand functions are based on reference price and reference demand values as well as demand elasticities assumptions in the first model year 2010. In order to calculate the parameters for future demand functions, demand growth projec-tions are applied to the starting values. These demand growth projections for each country are scenario-spe-cific and are derived from the assumptions explained in Section 4. For example, in the NDC Scenario, we calculate the demand functions’ reference quantities by using the country-specific growth projections from the IEA WEO’s New Policies Scenario that are applied to the demand nodes’ starting values.
Producers and exporters both face an intertemporal profit maximization problem over the total time horizon of the model. They are assumed to have perfect foresight which means that they choose their optimal supplied quantities knowing about current and future demand. Given that all players behave rationally and using all the information available to them, the model results re flect the optimal allo-cation of supplies to demand. This setup omits, of course, as any other computational model certain real-world features such as a preference for diver-sification or long-run relationships between certain suppliers and consumers.7
7 For more detail on the model setup and the data, we refer to Haftendorn et al. (2012) and Holz.et al. (2016).
Quality factor
k = t/Gj
P : Producers
Port operation costs
Freight rates
Transport costs
Transport costs
E : Exporters
C : Consumption
} : Capacity restriction
$/Gj
PJ
$/t
$/Gj
PJ
C
C
Pc
Pc
Pe
E}
P}
E*k=Q
E*k=Q
E*k=Q
}
}
Source: Haftendorn et al. (2012)
Figure 7. COALMOD-World model structure

Scenario architecture, assumptions and rationales
16 WHAT DOES “PEAK COAL” MEAN FOR INTERNATIONAL COAL EXPORTERS?
4. Scenario architecture, assumptions and rationales
4.1. OverviewWe analyse the potential developments in the global steam coal markets by running the COALMOD-World model in a total of five scenarios. These scenarios re-flect different visions of the development of global and regional coal demand development until 2050. The intention is to show that different pathways of coal demand – and, hence, coal production and emissions from coal consumption—can realize, even under same economy-wide climate targets. The scenario outcomes will show that there is a great deal of uncertainty on the future development of global coal markets—and that coal market actors therefore have to find strategies to deal with that uncertainty. This is particularly necessary as the uncertainty may go as far as being income-threat-ened for coal producers and employees in a particular year in one scenario, while producing as much as possible in the same year in another scenario.The scenarios build, on the one hand, on top-down infor-mation on global and regional energy system develop-ment. On the other hand, we have developed scenarios by using bottom-up national energy sector information available in the project team (see below). The top-down information comes from the IEA’s 2016 World Energy Outlook. As discussed above, the World Energy Outlook
presents consistent pictures of energy system develop-ment (with consumption and production information for all energy carriers) in three different climate policy scenarios. Given the Paris Agreement and the ongoing efforts to reduce greenhouse gas emissions to a level consistent with global warming of not more than 2°C, we choose the two scenarios that represent these sit-uations as data sources for our first two scenarios. Our scenario which picks up the IEA (2016) New Policies Sce-nario’s coal consumption pathways is an NDC-compati-ble scenario which we call Reference Scenario. Moreover, we call our scenario which relies on the IEA (2016) 450 ppm Scenario’s coal consumption information the 2° Scenario (Table 1).In the bottom-up scenarios, the IEA 2016 World Energy Outlook data provides the framework in terms of data for the rest of world. But for some major coal countries, we use additional national information to derive alterna-tive coal consumption pathways. We call these scenarios Enhanced Coal Transition (ECT) scenarios since they are based on enhanced information from national experts with deeper insight. Given their huge role in current and future coal consumption, these scenarios, of course, fo-cus on China and India (details below). But they also include enhanced information on future coal consump-
Scenario
Reference Scenario (NDC)
2°C Scenario
Enhanced Coal Transition Scenario (ECT)
Enhanced Coal Transition Scenario 2 (ECT2)
/ Main assumptions
• Coal consumption 2010 based on IEA Coal Information 2017• Growth rates of coal demand derived from IEA (2016) WEO 2016 New Policy Scenario
• Coal consumption 2010 based on IEA Coal Information 2017 and growth rates derived from WEO 2016 450 ppm Scenario (consistent with 2° target)• Note that IEA (2016) assumes strong use of CCS (430 GW CCS-power plants in 2040)
• Enhanced information on national transitions from the project• Based on the NDC Scenario, except for lower demand in China, India, USA and South Africa (after 2030) • Bottom-up information on delayed coal transition in Poland and Germany
• As ECT, except for India (less ambitious with higher reference demand) and China (more ambitious with lower reference demand)
Type of scenario
Top-down
Top-down
Bottom-up
Bottom-up
Table 1. Overview of scenarios and their main assumptions

Scenario architecture, assumptions and rationales
WHAT DOES “PEAK COAL” MEAN FOR INTERNATIONAL COAL EXPORTERS? 17
tion in South Africa and the USA.8 The ECT scenarios are consistent with the nationally determined contributions (NDCs) that have been pledged in the framework of the Paris Agreement. However, there are no confirmed tra-jectories of coal demand within these NDCs. We reflect the uncertainty on the concrete coal demand pathways by deriving the two alternative ECT scenarios.Lastly, we acknowledge the enormous role that India will play on future coal markets by introducing a “shock” to the ECT2 scenario, which focuses on the variation of Indian coal imports.
4.2. Scenario design for ChinaChina is by far the largest coal consumer, representing 52% of global consumption. With 17% of total global imports of coal it also plays an outsized role in global coal markets. There are a number of factors which are crucial to consider when thinking about China’s future coal demand. These include: the rate and structure of economic growth, local air pollution policies, and energy transition policies, including in the context of climate change objectives.
8 For the USA, we assume that federal policy on emissions regulations is rolled back although technological innovation and state level policy continue to drive a slow energy transition. The Clean Power Plan of the Obama administration is not implemented. However, a major continued uncertainty pertains to the economic competitiveness of coal’s main competitor energy sources, namely renewables and shale gas. In order to explore this aspect of uncertainty, we assume somewhat higher gas resources in the USA in the ECT scenarios. For South Africa, the ECT scenarios consider a somewhat lower local coal demand than the NDC scenario. This downward adjustment compared to the IEA NPS expectations results from a more pessimistic view on the local mine development perspectives.
China’s coal demand is driven by the industry sector. 32% of China’s primary coal consumption is from the in-dustry sector, for example for the production of heat for industrial processes or coking coal for steel production. A further 30% is consumed indirectly in the industrial sector as electricity derived from coal-fired power plants. Thus, more than 60% of China’s coal demand is driven by the industry sector.It is widely acknowledged that China’s economy is un-balanced in a manner unlikely to be sustainable in the mid-term. Investment is very high at 44.2% of GDP, the majority of which is funnelled into infrastructure and real-estate projects. The investment rate has been sup-ported by a high growth of leverage in the Chinese fi-nancial sector, in particular the corporate sector but also the local government sector (see Figure 8). The growth of the debt-to-GDP ratio represents one of the fastest such episodes in financial history, and is projected to continue (see Figure 8). High investment has led to a large amount of waste, i.e. returns to investment lower than benchmark costs of capital, although low returns may be acceptable given (artificially) low costs of capital (especially for state-owned enterprises). The consequence of this is that China’s economy is expected to rebalance towards lower levels of investment and slower overall economic growth (see Figure 8), which will in turn result in slower energy demand growth and coal demand growth in particular.This macroeconomic rebalancing effect (and an eco-nomic downturn in rustbelt regions not reflected in GDP statistics) is seen in the most recent statistics for coal demand, which has dropped almost 10% between
Total
Source: authors, based on IMF China Article IV Review, 2017.
Public sector*
Household
Corporate sector
Debt(percent of GDP)
Capital formation(percent of GDP)
0%
50%
100%
150%
200%
250%
300%
30%
35%
40%
45%
50%
55%
60%
2018 2020 2022201620142012
47%
41%
Figure 8. Macroeconomic indicators for China
*Includes off-balancing sheet exposures, particularly for local government.

Scenario architecture, assumptions and rationales
18 WHAT DOES “PEAK COAL” MEAN FOR INTERNATIONAL COAL EXPORTERS?
2013 and 2016; coal demand is understood to have re-bounded somewhat in 2017, due to the strong invest-ment stimulus given in 2015-16 and resultant recovery in growth rates (see the hiatus in the decline in the investment rate below in the years 2015-16). However, the structural trend is towards a more rapid decline in investment after the pause in 2016-17 (see Figure 8), and a consequent decline in energy demand growth and coal demand growth. The likely scenario is therefore one of slower energy and electricity demand growth in the com-ing decade, meaning that non-coal energy supply could grow fast enough to lead to a decline in coal demand.The other drivers for coal transition in China are the issues of local air pollution and energy transition associ-ated with energy security and climate change objectives. China’s share of renewables in electricity production has increased from 18.8% in 2010 to 25.4% in 2016, the vast majority of which has come from non-hydro renewables increasing their share from 1.7% to 6.0%. By 2030, Chi-na’s NDC would require more than 40% of electricity consumption to come from non-fossil fuel resources.In this context, two bottom-up scenarios were devel-oped, based on inputs from the energy models of Tsin-ghua University (Yang et al., 2017):
y ECT1 assumes broad consistency with China’s NDC scenario, as modelled by the MAPLE energy model of Tsinghua University (Yang et al., 2017). GDP growth slows in the 2020s and the economy rebalances some-what away from investment and industry. Consistent with China’s NDC, the non-fossil fuel share reaches 20% in primary energy by 2030 and emissions peak and plateau before 2030, and then decline towards 2050 (see Figure 2 – NDC + Late Decline Scenario).
y ECT2 assumes a more significant coal transition, based on faster and more significant macroeconomic restructuring resulting in lower energy demand growth and hence a higher share for non-fossil fuels in electricity and primary energy (see Figure 2 – Faster Peak and Decline Scenario).
4.3. Scenario design for IndiaIndia is the second largest consumer of coal in the world after China, with 10% of global coal consumption and 14% of global coal imports in 2016. Unlike China, In-dia’s energy demand per capita is just 37% of the world average and electricity demand just 29% of the world average. In addition, there are some 240 million Indians who do not have access to electricity, and hundreds of millions more who have access to low quality, unreliable electricity. Energy and electricity demand will therefore grow significantly with India’s development growth.India’s coal consumption is dominated by the electricity sector, which accounted for 67% of India’s primary coal consumption. Direct consumption in the industry sector accounted for 28%, while indirect consumption through coal fired electricity accounted for 29%. Unlike China, Vietnam or Thailand, to-date India’s development has not been electricity intensive, with the elasticity of final electricity demand to GDP growth just 0.95 over the period 2000-2016.9
India’s government has set itself the objective of reach-ing 175 GW of renewables capacity by 2022, which would bring non-hydro renewables to 22% of electricity generation, up from about 7% in 2016. After 2022, the government is informally targeting 265 GW of renewable capacity by 2027. On the back of strong capacity growth in recent years, slower than expected demand growth, and the strong push for renewables, coal demand growth is likely to been muted in the mid-term. Coal plant load factors have dropped significantly to around 58% in 2016. Beyond the current pipeline, the government has no plans for a further expansion of coal capacity before roughly the mid-2020s. There will, however, be a supply gap by 2030 of about 600-800 TWh, unless new capac-ities are built starting from the mid-2020s.The key question therefore for India’s mid-term coal trajectory is twofold. The first concerns demand growth. To what extent will India continue with its currently less electricity intensive development trajectory based on services, or will it shift closer to the manufacturing heavy model favoured by East Asia (China and South Korea) and some South East Asian countries (Vietnam, Thailand)? To what extent will new energy efficiency technologies favour slower demand growth?
9 For a country of India’s level of development, one would expect the elasticity of electricity demand to GDP growth to be above 1, as is the case for Vietnam and China, for example, at comparable levels of development.
Scenario
NDC
2°
ECT
ECT2
Reference demandin Mtpa
2010
2,498
2,498
2,498
2,498
Coal use growth rate in %(compared to 2015)
2020
98%
95%
95%
95%
2030
97%
71%
89%
85%
2040
87%
50%
81%
75%
2050
79%
28%
71%
63%
Table 2. COALMOD-World assumptions on coal demand in China in the scenarios

Scenario architecture, assumptions and rationales
WHAT DOES “PEAK COAL” MEAN FOR INTERNATIONAL COAL EXPORTERS? 19
The second concerns the supply options chosen in the mid-2020s. Here it is worth noting that the cost trends are not favourable towards coal. New coal plants sup-ply at between 3.5 and 4.5 R/kWh, versus renewables at between 2.4-3.0 R/kWh in the most recent auctions (see chart). In 2017, India shifted from a regulated tariff to competitive bidding for wind, which results in a sharp drop in the revealed prices (see chart). It can be expected that over time the cost of coal will increase as high efficiency, low emissions plants are favoured, wh ile the learning curve on renewables still has some way to run. There is thus a plausible scenario in which renewables meet the majority of incremental demand growth after the mid-2025s on a cost competitiveness basis, which would in turn seriously dampen coal demand growth.The big unknown here is the grid integration cost, and whether it can be contained at very high penetrations of variable renewables. Literature on this is sparse, and the estimate of the Central Electricity Authority of a grid integration cost of 1.1 R/kWh of RE is likely to be excessive for the level of penetration that was studied (22% in 2022). Even so, assuming a renewables cost of 2.5-3.0 R/kWh and a grid integration cost of 1.1 R/kWh, the all in cost of renewables could still be competitive with new coal at 3.5-4.5 R/kWh.In this context, two bottom-up scenarios were devel-oped for India, based on inputs from the AIM energy model of the Indian Institute of Management Ahme-debad (IIMA):
y ECT1: this scenario assumes aggressive implementa-tion of India’s renewable objectives, and a continued deployment of renewables on a cost competitive ba-sis after the mid-2020s. Electricity demand growth is assumed to be moderate, based on a strong GDP growth but low elasticity of electricity demand to GDP, as has been the case historically. The objectives of the government of India to limit coal imports are also considered in this scenario, where domestic supply is favoured.
y ETC2: this scenario assumes some challenges associ-ated with India’s high renewables pathway, and hence a slower growth of renewables than ETC2. Electricity demand growth is assumed to be somewhat stronger, based on a combination of more industry-intensive growth and slower progress on energy efficiency. The result is a somewhat higher demand for coal than in the ETC1 scenario.
Commissioned 2015-2017
Source: Authors, based on tariff orders from CERC and SERCs and results of competitive bidding
0
3
6
9
12
2018201620142010 2012
Rs./KWh
0
2
4
6
8
10
12 Rs./KWh
0
2
4
6
8
10
12
Without AD & Tax BenefitsWith AD & Tax Benefits
Cost of new coal Cost of new coal
Solar PV Onshore wind
Capacity Weighted Average
Competitive Bids in 2017 and 2018
CERC TariffNorms
Andhra Pradesh
MaharashtraTamiNadu
Figure 9. Renewables costs versus new coal
Scenario
NDC
2°
ECT
ECT2
Reference demandin Mtpa
2010
560
560
560
560
Coal use growth rate in %(compared to 2015)
2020
118%
111%
125%
129%
2030
154%
80%
132%
147%
2040
206%
35%
140%
177%
2050
206%
23%
145%
182%
Table 3. COALMOD-World assumptions on coal demand in India in the scenarios

Climate scenarios in the global markets
20 WHAT DOES “PEAK COAL” MEAN FOR INTERNATIONAL COAL EXPORTERS?
5. Climate scenarios in the global markets
5.1. The global pictureGiven the varying degrees of climate ambition and its re-alization in coal markets, we expect to find very large dif-ferences between the five scenarios in terms of global coal consumption and production and, hence, coal trade flows and investments in the coal chain. Figure 10 gives a first impression of the relation of the scenarios to each other and their evolution over time. We see that global coal use has increased substantially between 2010 and 2015. However, under all of the scenarios, including the NDC scenario, coal consumption will decrease in the future, albeit at very different rates depending on the scenario.It should be noted that, with the exception of the 2°C scenario, the other four scenarios are largely driven by non-climate factors. To the extent that climate policy is in the mix, it is via the reflection of NDC policies in the baseline NDC scenario. Thus, the purpose of these scenarios is not to suggest that climate policy cannot do better than to deliver the presented reductions in coal demand. Rather, it is to highlight the trend that would be established if NDC are implemented and other non-climate policy factors played out. In reality, how-ever, climate and energy policies will change and likely strengthen over time, due to feedback loops between technology developments, climate policy and non-cli-mate policy factors discussed in Section 2.
The ECT1 and ECT2 scenarios show the strong influence of China and India on the global numbers by reducing the total coal consumption compared to the NDC scenario. However, it can be seen that the two scenarios do not differ substantially. Although both scenarios assume a lower coal consumption in both China and India than in the NDC scenario, they differ in how this reduction is shared between the two countries. In ETC 1 the lower coal consumption in India is offset by higher coal con-sumption in China, and vice versa in the ETC2 scenario.Figure 10, therefore, also shows global consumption in a fictitious “ECT squared” scenario. This reflects a scenario in which factors in both China and India lead to lower end coal demand than in the NDC scenario in both coun-tries, due to non-climate policy factors. This scenario thus combines the lower consumption values for India from ECT1 and the lower consumption values for China from ECT2 with the global ECT1 scenario results. The “ECT squared” scenario then reaches a 6% lower total consumption in 2050 than the ECT1 and ECT2 scenarios.While the NDC scenario will only see a very modest decrease in the following decades to just below the 2010 number of approx. 5,000 Mtpa by 2050, the 2°C on the other end of the spectrum will see a marked fall to just one fifth of current coal demand in 2050. The ECT and ECT2 scenarios move closer to the NDC
Source: Coal Transitions project.
1000
2000
3000
4000
5000
6000
20502040203020202010
Mtpa
0
1000
2000
3000
4000
5000
6000
ECT-squaredECT2ECT1
2°C
NDC
Figure 10. Global coal consumption 2010-2050 in various scenarios in Mtpa

Climate scenarios in the global markets
WHAT DOES “PEAK COAL” MEAN FOR INTERNATIONAL COAL EXPORTERS? 21
scenario, albeit with a more pronounced decrease in the upcoming periods to reach approx. 4,200 Mtpa in 2050. The NDC and ECT scenario outcomes clearly show that the Nationally Determined Contributions that the countries are currently committed to—even with alternative assumptions on how the drivers of coal consumption will play out—are not sufficient to curb global coal consumption in line with the 2°C goal.The 2°C Scenario with stringent climate policy stands out of the rest of the scenarios because it sees a steep decrease of global coal use over time. This stark contrast is because all of the other 4 scenarios assume current climate policy settings are maintained. In practice, this may not be true, as the Paris Agreement calls for regular
NDC revisions every five years and, thus, revisions of the national policies required to implement them. It should therefore be borne in mind that other intermediate sce-narios are possible, and perhaps even likely to emerge on the path to 2050.Figure 11, Figure 12, Figure 13, and Figure 14 give more detail to the global consumption numbers as well as potential implications for imports by major import group in the ECT and 2°C scenarios. The results high-light the importance of the two major coal-consuming countries China and India. China remains—by far—the largest coal consuming country in all scenarios. It continues to satisfy most of its coal demand from its domestically available coal resources. India also con-
Source: Coal Transitions and Coalmod-World results.
Fig. 13ECT scenario
Fig. 14ECT2 scenario
Fig. 122°C scenario
205020452040203520302025202020152010
Mtpa
0
1000
2000
3000
4000
5000
6000
205020452040203520302025202020152010
Mtpa
0
1000
2000
3000
4000
5000
6000
205020452040203520302025202020152010
Mtpa
0
1000
2000
3000
4000
5000
6000
205020452040203520302025202020152010
Mtpa
0
1000
2000
3000
4000
5000
6000
India imports China imports International seaborne trade (except China & India imports)Domestic supply (except China & India)India domestic supply China domestic supply
Figures 11-12-13-14. Global coal consumption by source and destination 2010-2050 in the scenarios
NDC scenarioFig. 11

Climate scenarios in the global markets
22 WHAT DOES “PEAK COAL” MEAN FOR INTERNATIONAL COAL EXPORTERS?
tinues to be the second largest global consumer and to satisfy a large share of its demand from domestic production. However, India may see a considerable increase of its imports in the next decades, on par with its coal consumption growth. Other consumers—for example in the USA, East Asia and South Africa—also keep their important role in global coal use, with only a small reduction of their coal consumption over time in the moderate climate mitigation scenarios NDC and ECT2. Table 4 h ighlights the respective consumption levels of the 10 larger coal users under the five scenarios.There are radically different results for imports across the scenarios, especially for China and India. For China, imports vary between 0 and 24 % of its consumption across the five scenarios; with the former realizing in the low Chinese demand scenario ECT2. Similarly India’s exports vary significantly across the scenarios, from 0% (in some years in the 2°C scenario) to 32% (late peri-ods in ECT2 with high Indian consumption). This shows the high sensitivity of these countries’ import levels to assumptions about domestic demand.The numbers also suggest that, in all the scenarios, total imports will decline on aggregate after 202-2025-2035. This progress will be slowest in the NDC scenario where the peak in global trade is only reached in 2035. However, in the ECT1 scenario, China’s im-ports will peak in 2025 before declining to less than half of their current levels, similar to the Indian imports in this scenario. In the ECT2 scenario, Indian imports will continue to rise but would be more than offset by a more significant decline in Chinese imports after 2025. The 2°C scenario, meanwhile, would see a pro-gressive decline in imports across all importers post 2020, although China might choose to keep imports stable throughout the 2040s given the concentration of coal demand in its coastal regions with easy access to—low-cost—import coal.Seaborne trade continues to play a role in the higher coal consumption scenarios NDC and ECT in the me-dium-term. Indonesia is by far the largest exporter in the global market—at least until its coal reserves are depleted. Australia, USA and South Africa are the oth-er major exporters to the global markets in the next decades. However, there is a good chance that they will be competing for a shrinking global import pie, in particular towards 2040/2050 and in the 2°C scenario. The scenarios show that for major coal consumers and
producers, only Indonesia risks exhausting its domestic reserves in the next decades. Thus, while exporters from the US, Australia or South Africa could potentially cap-ture part of Indonesia’s market share after the 2030s, in the meantime, the market size could well have shrunk considerably.In the 2°C scenario, the consumption drop (to just 1,200 Mtpa) is accompanied by a strong decrease in inter-national seaborne coal trade (Figure 16). The decrease in trade is recorded despite the lower investments in production capacity for domestic demand. This indicates that the coal use in a 2°C world—despite the deploy-ment of CCS—will be low enough to make any net ex-pansion of production capacity a very risky investment. With the decreasing seaborne market, there will be few and shrinking opportunities to offload unused national production.Among the major exporters on the seaborne market, it is particular the USA that will take the role of a “marginal” supplier that will adjust its export vol-umes to the varying coal consumption trends in the importing countries. This role of the USA has already been observed in the past decades and is due to its higher supply costs (made up of production and transport costs together) to the major importers in Asia, compared to other exporters located in the Pacific basin. In other words, the US exporters are the most vulnerable to any climate policy efforts, followed by the Australian exporters that have only slightly lower supply costs and, therefore, also see their exports de-crease in all scenarios compared to the NDC scenario. The Adani shock in the ECT2 scenario with dedicated exports from the Australian Adani mine to India shows how long-term contracting can be a tool for exporting countries to secure future exports. On the contrary, South Africa and Indonesia hardly experience any loss of export markets in the ECT scenarios compared to the NDC scenario. South Africa only sees its exports drop in the 2°C scenario when climate policies lead to a generalized cut in world coal consumption. Indo-nesia can even shift some of its coal from domestic consumption to exports in the 2°C and cheaply supply regions that would otherwise have needed expensive investments to consume coal (e.g. coastal China).The above scenario analysis is of course based on stylised assumptions about how demand for coal may unfold in future. As such the results are already highly interesting. Nonetheless, it is also helpful to complement these re-

Climate scenarios in the global markets
WHAT DOES “PEAK COAL” MEAN FOR INTERNATIONAL COAL EXPORTERS? 23
sults with some more qualitative country-specific obser-vations. This is the purpose of the following subsection, which aims to identify a number of potential “wildcards” that could affect the above results.
5.2. ChinaChinese coal production and consumption are likely to have peaked around 2015. A small rise in Chinese coal consumption in 2017, reversing two years of declines, is arguably more cyclical than structural (cf. Section 2). This peak is due to a number of factors: the Chinese government has placed a more or less com-plete freeze on the building and commissioning of new power plants in order to reign in a growing problem of overcapacity (IDDRI, 2017). At the same time, there are increasing signs that Chinese economic growth is slowing and that its economic structure—which is currently extremely energy- and coal-intensive—is beginning a painful shift towards more human-cap-ital-intensive and higher value-added manufactures and services (Spencer et al., 2016).A key question for China is therefore whether its coal consumption will remain stable—as per our NDC scenar-io—or whether it might actually begin to decline already in the coming decade. Given its size as a consumer (and producer), even a small decline in demand could po-tentially have dramatic impacts on international steam coal consumption. At present, the Chinese authorities have already begun to curb coal consumption in local
heating networks and in industry by closing inefficient activities, in part due to local air pollution concerns. For instance, under a new 5-year heating plan, an estimated 63 million households would be shifted away from coal by 2021, replacing demand for approximately 140 Mt of coal per annum.10 However, the true potential to re-duce domestic consumption will depend on the speed at which alternative power and industry sector energy sources will be developed and their capacity utilization maximised (e.g., through grid improvement). Also im-portant will be the extent to which energy efficiency standards in the coal plant fleet are ramped up, either through by closing old plants or retrofitting, and through market design changes.Another key factor in the evolution of Chinese de-mand for imports will be the evolution and political economy of its domestic coal mining capacities. If the country succeeds in reducing demand, this will in turn put pressure on domestic production capaci-ties, which employ millions of people and which, like power production itself, provides important revenues for local governments. It is not impossible to imagine a scenario in which this puts political pressure on the government to find ways to limit imports in favour of domestic production. The minimum quality require-ments implemented in 2015 can be seen as a first step in this direction.
10 https: //www.reuter s.com/article/us-ch ina-energy-heating/ch ina-unveils-20 17-2021-winter-clean-heating-plan-media-idUSKBN1EB02P
Source: Coal Transitions and Coalmod-World results.
Venezuela
South Africa
Russia
Mongolia
USA
Colombia
Australia
Indonesia0
100
200
300
400
500
2050204520402035203020252020
Mtpa
0
100
200
300
400
500
ECT12°C
NDC
ECT12°C
NDC
ECT2
ECT12°C
NDC
ECT2
ECT12°C
NDC
ECT2
ECT12°C
NDC
ECT2
ECT12°C
NDC
ECT2
ECT12°C
NDC
Figure 15. Imports by China over time and by scenario

Climate scenarios in the global markets
24 WHAT DOES “PEAK COAL” MEAN FOR INTERNATIONAL COAL EXPORTERS?
However, in the decade 2010-2020, it must also be borne in mind that China is struggling with domestic transport bottlenecks. Thus, in all five scenarios, China has to invest in domestic transport infrastructure—in particular rail—to make use of the vast domestic coal re-serves. These investments are taking place currently and will develop in the next years. They are complemented by a trend to build coal power plants closer to the mine and transmit the power via electricity grids to regions with high electricity demand, instead of building plants close to highly populated areas with coastal import hubs (Paulus and Trüby, 2011).Figure 15 shows that Chinese imports are set to decline in all scenarios after 2030/2035. The decline is particularly pronounced in the ECT2 scenario, in line with decreasing consumption. Surprisingly, the decline of Chinese imports is slowest in the 2°C scenario where imports are providing up to a quarter of Chinese consumption (the share of im-ports being only 5-15% in the other scenarios). In the 2°C scenarios, imports are filling the gap of lower investments in domestic mine capacity (Figure 27), although in prac-tice, this may reflect the limitations of the model to cap-ture political economy effects within China—if domestic coal producers were hit hard by an ambitious reduction in demand, one could imagine a dynamic where domestic production is favoured over imports during a transition period. The Chinese market is served by a diverse set of exporters, with the bulk of supplies coming from Indonesia and Australia in the NDC and ECT1 scenarios. However, when demand is lower such as in the ECT2 scenario, these
are also the suppliers that are ousted first. Such suppliers are thus vulnerable in such scenarios.
5.3. IndiaSteam coal demand in India has accelerated rapidly over the past decade reaching roughly 760 Mt in 2016, there-by making India the second largest consumer after China (IEA, 2017). A rising consumption trend continues in the next decades in the NDC and ECT scenarios, but demand stabilises in 2030 under the ECT2 scenario and in the 2°C scenario. Under the NDC, the most aggressive coal consumption scenario, Indian steam coal demand may rise as high as 1,400 Mtpa by 2050. In the ECT1 and ECT2 scenarios, we can still observe an increase of steam coal demand up to 1,010 Mt (ECT1) and even 1,250 Mt for the ECT2 in 2050. Only the 2° scenario shows large reductions in steam coal demand down to a very low consumption of 175 Mt in 2050 (Figure 11), and even bringing imports down to zero after 2035 (Figure 16). However, under this scenario, the bulk of reduction in coal demand would occur after 2035-2040, due to the expected lifetime of recently built plants.The assumption of a tendency towards an increase in coal demand in India’s scenarios is highly driven by as-sumptions relating to current low per capita energy con-sumption, economic and industrial growth assumptions, and the possibility that higher access to energy through improved infrastructure will unlock pent-up demand. That said, the exact speed and ultimate need for a prac-
Source: Coal Transitions and Coalmod-World results.
Poland
Mozambique
Russia
Colombia
Australia
Venezuela
Indonesia
USA
South Africa0
100
200
300
400
500
2050204520402035203020252020
Mtpa
0
100
200
300
400
500
ECT2
ECT12°C
NDC
ECT2
ECT12°C
NDC
ECT2
ECT12°C
NDC
ECT2
ECT12°C
NDC
ECT2
ECT12°C
NDC
ECT2
ECT12°C
NDC
ECT2
ECT12°C
NDC
Figure 16. Imports by India over time and by scenario

Climate scenarios in the global markets
WHAT DOES “PEAK COAL” MEAN FOR INTERNATIONAL COAL EXPORTERS? 25
tical doubling of Indian coal consumption to meet these objectives remains highly uncertain. For one thing, it is far from clear that India will follow the same economic development pattern in terms of rapid industrialisation as experienced in China for instance (see section 2). For instance, Indian industrial development has also typi-cally lagged national and international expectations for a variety of complex reasons, and global industrial ca-pacity for certain commodities like steel has arguably lead rather than lagged global demand in recent years.Moreover, India continues to move forward relatively quickly with significant new investments in low carbon energy. For instance, its current NDC aims to increase the share of non-fossil fuel electricity capacity to 40% by 2030, and it is possible and in some views probable that this target would be exceeded.11 India is considered on track to meet and potentially exceed this goal12. In addition to fast growth in renewable energy, the Nuclear Power Corporation of India has recently signed a deal with EDF and the French government to build six new nuclear reactions, for a nameplate production totalling 10 GW of power.13 Furthermore the country has ambi-tious plans to develop natural gas.14 In short, there is therefore a question of whether demand will rise as fast as supply for energy in India, over the coming decade. If not, then coal—and especially coal imports—could potentially be part of the margin of adjustment.The existing government in India is increasingly appear-ing to be determined to push ahead with a pro-climate mitigation agenda for the country’s energy system. Giv-en favourable domestic conditions for renewables a key question is therefore the extent to which existing barri-ers to higher penetration rates can be removed, so as to enable energy access to be expanded through renewa-bles rather than coal. In principle, many of these barriers can be resolved as in other jurisdictions, if political will exists. Emerging battery storage solutions could also be a game changer potentially offering ways to shortcut infrastructure and other energy access constraints for small and medium scale consumers.
11 The National Electricity Plan adopted in 2018 forecasts a non-fossil fuel capacity of 47% in 2027, well in excess of the NDC target for 2030.
12 http://climateactiontracker.org/countries/india.html13 Transcription de la déclaration conjointe du Président de la République,
Emmanuel Macron et de Narendra Modi, Premier ministre de la République d’Inde à New Delhi. http://www.elysee.fr/conferences-de-presse/article/transcription-de-la-declaration-conjointe-du-president-de-la-republique-emmanuel-macron-et-de-narendra-modi-premier-ministre-de-la-republique-d-inde-a-new-delhi/
14 http://pib.nic.in/newsite/PrintRelease.aspx?relid=121645.
The balance of coal demand and supply in India is crucial for global coal markets because the country accounts for up to half of the global seaborne trade in the NDC and ECT2 scenarios, and still up to one third in the ECT1 sce-nario. This makes India the largest single importer of coal in all scenarios, apart from the 2°C scenario. This is the only scenario, where imports are very low and disappear completely from 2040 onwards. All other scenarios show a strong dependence on imports by India’s energy sector, with a share of 25-30% of the total Indian steam coal demand in the NDC and ECT(2) scenarios. Uncertainty over India’s balance of domestic coal supply and demand will therefore be a key source of risk for major exporters, in particular for Australia.On the production side, the Indian government has set a target to lift domestic coal production from roughly 650 Mtpa to 1 billion Mtpa by 2020. This target had to be extended due to the inefficient production style in state-owned Coal India Ltd. Nonetheless, such a large rise in production is part of a national strategy to reduce dependency on imports in the medium term (Reuters India, 2015). There are of course limiting fac-tors, e.g. the costs of investing in additional domestic production capacity are h igher than importing the coal, and new supercritical power plants require higher quality coal than typically produced in India (Carl, 2015). Indeed, the Indian government has announced in the Thirteenth Five Year Plan (which commenced in 2017) that all new coal-fired generation capacity will have to use supercritical technology (Government of India, 2015). These plans may rather favor import coal which is better suitable for the new generation of power plants (Commonwealth of Australia, 2015). Nonetheless, the majority of the current Indian coal-fired generation fleet has sub-critical design tailored for the h igh ash and low energy Indian coal and a scenario in which Indian coal demand grows only in line with our ECT1 or ECT 2 scenarios, while domestic production increases, could potentially take a large bite out of internationally import demand in the medium term.India is mainly supplied by South Africa and Indonesia, as long as Indonesian reserves allow for it (i.e., ca. un-til 2035/2040). The USA also account for a significant amount of coal supplies to India, in particular in later years. Being a high-cost supplier, Australia is not able to supply the Indian market in other scenarios than the Adani case (Figure 16).

Investment and production plans in key exporting countries
26 WHAT DOES “PEAK COAL” MEAN FOR INTERNATIONAL COAL EXPORTERS?
6. Investment and production plans in key exporting countries
6.1. Implications for investments going forwardIn the previous sections, we have shown that global coal markets may evolve quite differently depending on the assumptions on climate policy ambition and design. At this moment, in 2018, it is hard to say which scenario is more realistic—hard for us, and hard for coal market actors as well. The 2015 Paris Agreement has for the time being led to moderately ambitious national climate action plans (our NDC scenario). It remains to be seen if the mechanism of revision and further strengthening of the national action plans will deliver very strong or only modest revisions in 2020 and in 2025. However, evidence from China, India and the EU suggests that NDCs being implemented by major economies (bar the USA under Trump) may continue on an ambitious trend.Hence, suppliers, exporters, railway operators but also consumers (e.g. coal power plant operators) have to take their decisions on investments in new capacities against the backdrop of considerable uncertainty on future coal demand. This creates uncertainty not only for coal mar-ket companies but also for their employees and other stakeholders. In the following, we want to explore the
effects of this uncertainty a little deeper by looking at the difference in investment expenditures between the scenarios. If capital investment into capacities is carried out today without these capacities being used in the future, the capital assets become stranded—another risk to the income of market participants.Indeed, already the global overview shows that there is a broad range of investment expenditures between the scenarios. Without surprise, the highest increase of capacities is realized in the highest demand scenario of our five scenarios, the NDC scenario. Figure 15 shows the three investment categories production capacity (mines), inland transport capacity (mostly railways), and export capacity (export harbour capacity) over the entire time horizon of the analysis (until 2050). Most investments are carried out until the 2020s, though. Transport infrastructure (railway, harbours) is then as-sumed to available until 2050 without depreciation.F17
Investment in production capacities closely follows the demand development in the scenarios. There is invest-ment in mines in all future scenarios—even in the 2°C scenario with a strong fall of coal demand—because all mines are depleted over time and need to be (partially) replaced in order to keep production. Hence, despite total coal consumption 2010-2050 being lower by 35% in the 2°C scenario than in the NDC scenario, investment expenditures in coal mines are only 20% lower.Many coal-producing regions have bottlenecks in their inland transportation system, which is why these capaci-ties are expanded first in an optimal system such as it is represented in the COALMOD-World model. However, there is considerably less need for additional rail capacity when consumption and production are lower which is reflected in the strong decrease of these investment expenditures. The lower investment expenditures in coal handling capacities of export harbours reflect the small-er role of international seaborne trade in all scenarios compared to the NDC scenario.The risk of asset stranding from the realization of lower coal scenarios than NDC is the largest for suppliers to the India and China because of the enormous size of their Source: COALMOD-World results.
Transport capacity
Investment in
Production capacity
Export capacityESSECT2ECT12°NDC
Million USD
0
100000
200000
300000
400000
500000
ESSECT2ECT12°CNDC
Figure 17. Global investments until 2050 in the coal value chain in various scenarios
(production, inland transport and export capacities)

Investment and production plans in key exporting countries
WHAT DOES “PEAK COAL” MEAN FOR INTERNATIONAL COAL EXPORTERS? 27
consumption and imports (more than half of total sea-borne trade in 2015). Suppliers to India will primarily be South Africa, Indonesia, and the USA. Suppliers to China are more diverse, with Indonesia and Australia taking the lead. Although not all exporters are directly concerned by the high riskiness of Indian and Chinese imports, there are at the same time risks for the other exporters indirectly. The risks to these exporters would be from either com-petition for their existing markets, or, because if existing markets were in decline, it would not necessarily be easy to find other outlets for surplus supply.Climate policies and coal use reduction will affect large producer and exporter countries similarly, albeit to a different extent (Figure 16). On the one hand, their future perspectives are affected by the importance of individual importing countries in their export portfolios (see be-low). On the other hand, their relative costs compared to other suppliers in the same market determine whether they are more or less affected by coal use reduction in that market. In other words, in the logic of a merit order curve of suppliers, the most expensive supplier—in terms of aggregate costs of production, transport, as well as in-vestments—is the one that has to reduce its exports first and most when consumption is reduced, in the extreme case to be fully evicted from that market. This dynamic is well-captured in the COALMOD-World model’s opti-mization approach. In the following, we want to discuss which perspective the main exporting countries—South Africa, Australia, Indonesia, and the USA—have in the different scenarios.
6.2. South AfricaFor South Africa, India will be the exclusive customer in all moderate climate mitigation scenarios. Only in the 2°C scenario, when India quickly reduces its con-sumption and imports, would South Africa turn to other markets such as China and South-East Asia. In the 2°C scenario, South Africa is also the only exporter being able to supply India from 2025 onwards. Hence, the exact realization of the Indian demand is of crucial importance for South Africa. It is the difference between continuing to export with the (limited) production and transport infrastructure currently in place—or putting into oper-ation in a costly and politically unstable environment a completely new production basin and all related infra-structure. The latter would be necessary if a high-coal NDC scenario eventuates, the first would be the option of choice if low-coal scenarios realize.South African coal exports are virtually not diversified and go exclusively to India (except in the 2°C scenario). In the less ambitious climate scenarios, South African imports increase beyond the current levels of approx. 75 Mtpa, to up to 150 Mtpa. This reflects the relative optimism of international observers (and data sources) such as the IEA on South African’s capacity to further develop its produc-tion and export capacity. Domestic expectations—includ-ing those by coal companies active in the country—have turned less optimistic in the last years due to high cost pressure, political instability and corruption.If South African exports are to increase to the levels of the NDC and ECT scenarios, the development of a new
Source: COALMOD-World results.
Rest of World
Indonesia
South Africa
Australia
Russia
Columbia
USA0
50
100
150
200
ECT2ECT12°ECT2ECT12°ECT2ECT12°ECT2ECT12°ECT2ECT12°ECT2ECT12°ECT2ECT12°ECT2ECT12°
2050204520402035203020252015 2020
Mtpa
-1000
-800
-600
-400
-200
0
200
-1000
-800
-600
-400
-200
0
ECT2ECT12°ECT2ECT12°ECT2ECT12°ECT2ECT12°ECT2ECT12°ECT2ECT12°ECT2ECT12°ECT2ECT12°
ECT2
ECT12°C
ECT2
ECT12°C
ECT2
ECT12°C
ECT2
ECT12°C
ECT2
ECT12°C
ECT2
ECT12°C
ECT2
ECT12°C
ECT2
ECT12°C
Figure 18. Change in exports over time by scenario and exporter compared to NDC

Investment and production plans in key exporting countries
28 WHAT DOES “PEAK COAL” MEAN FOR INTERNATIONAL COAL EXPORTERS?
coal mining region—the Waterberg basin in the North-east on the border to Mozambique—will be necessary, including new transport and export facilities to ship the additional volumes (also see Figure 30 in the Appendix). Traditionally, coal has been mined in South Africa’s Cen-tral Basin and exports have been shipped via a single coal harbour, the Richards Bay Coal Terminal, which is linked to the Central Basin by rail. While the Richards Bay terminal has a shipping capacity of ca. 90 Mtpa, the railway link hardly exceeds 75 Mtpa. These infrastructure constraints have persisted also during high-demand pe-riods and are perceived as problematic by the industry (Burton and Winkler, 2014). Likewise, development of the Waterberg basin has been very sluggish—there is currently only one mine producing—and its further ex-pansion has been beset by financial and infrastructure constraints in rail and water. Altogether, these factors lead to local forecasts that are projecting South African production levels to be driven by the decreasing resource availability and higher mining costs in the Central Basin (e.g. 2011 South African Coal Road Map to 2050).We expect South Africa to continue its conversion to a Pacific market supplier, which started in the past dec-ade, with no return to the “old world” situation when South Africa was a “dedicated producer” for European markets. European countries have become pillars of rel-atively ambitious climate policy with coal consumption steadily declining. Hence, South Africa will become highly dependent on India’s demand. However, if India were to effectively introduce a quality standard with a
minimum calorific value demanded by new highly ef-ficient (ultra-supercritical) power plants, South African coal would be struck by this measure because availability of South African coal with higher quality is gradually declining and future reserves have lower calorific values (energy content).Only in the 2°C scenario do South Africa’s exports stay low and are strongly diversified (Figure 19), due to the enormous decrease of Indian coal demand (Section 5.2.2). This scenario is more in line with the national expectations in the country that are based on the difficult political, financial and geological environ-ment. While India is not the dominant importer of South African coal in this ambitious climate scenario, other markets may be willing to import some of the volumes that are freed up, in particular China and Southeast Asia (Thailand, Malaysia). In any case, there is
6.3. AustraliaAustralia is an important coal producer and exporter in the Pacific basin that has more than doubled its to-tal coal consumption in the last 20 years. Coal min-ing is concentrated in the two States of Queensland New South Wales. Australia is not only an important supplier of steam coal for electricity generation—our focus in this study—but also of coking coal for steel production. Almost half of the coal production is cok-ing coal (44% in volumes, not in energy content) and virtually all of it is exported (about 190 Mt in 2016; IEA,
Source: COALMOD-World results.
Japan
Malaysia
India
Philippines
Taiwan
Thailand
China0
30
60
90
120
150
2050204520402035203020252020
Mtpa
0
50
100
150
200
250
ECT2
ECT12°C
NDC
ECT2
ECT12°C
NDC
ECT2
ECT12°C
NDC
ECT2
ECT12°C
NDC
ECT2
ECT12°C
NDC
ECT2
ECT12°C
NDC
ECT2
ECT12°C
NDC
Figure 19. Australian exports over time and by scenario

Investment and production plans in key exporting countries
WHAT DOES “PEAK COAL” MEAN FOR INTERNATIONAL COAL EXPORTERS? 29
2017a). About 20% of Australian steam coal is used in power plants domestically (ca. 45 Mt), in addition to local lignite (about 65 Mt). The outlook is for domestic steam coal consumption to decline over the coming decades, potentially to very low levels as existing coal power plants reach the end of their economic lifetime that could accelerate through climate policy (Jotzo and Mazouz, 2018). New coal plants would not be able to compete with renewable power.Australian steam coal is produced at relatively high costs compared to other suppliers in the Pacific basin (Holz et al., 2016), mostly due to higher labour costs and a large resource sector competing for staff and material (Lucarelli, 2015a). Australia will not export to India in our scenarios where lower cost suppliers are competing for markets, in particular South Africa and Indonesia.Given its role as a high cost, marginal suppliers in India and other Asian markets, Australia is strongly affected by any climate policy efforts that lead to coal use re-duction in the importing countries. Figure 17 shows that all climate scenarios (except the Adani shock, discussed below) lead to a reduction of coal exports compared to the NDC baseline and this reduction increases over time. NDC exports are roughly constant over time, in the range of 125-150 Mtpa.15 These results contrast starkly with planned new mines and mine expansions in Australia. As of the end 2017, 42 new steam coal mines or mine expansions were in the Australian project pipeline.16 If completed, these projects (excluding the possible but now seemingly unlikely Adani Carmichael mine) would increase Australian production capacity by 350 Mtpa.
6.4. IndonesiaIndonesia is a low cost supplier and benefits from its proximity to the markets in China, and East and South-East Asia. Indonesia currently dominates the Pacific market, but it has a rather low coal quality and may also be subject to a stringent reserve restriction. More-over, the country is struggling with its role as major ex-
15 Th is is somewhat lower than current Australian s team coal exports that are up to 200 Mtpa (2016–17, https://industry.gov.au/Office-of-the-Chief-Economist/Publications/ResourcesandEnergyQuarterlyMarch2018/index.html One possible reason for higher exports could be that the model does not capture all differences in quality (e.g. in terms of sulfur content) between coal from different sources and that Australian coal is of higher quality in that respect.
16 https://www.industry.gov.au/Office-of-the-Chief-Economist/Publications/ResourcesandEnergyQuarterlyMarch2018/documents/December-2017-Major-Projects-data.xlsx
porter because the domestic market is also addressing an increasing demand to the domestic coal producers, supported by government efforts to keep Indonesian coal in the country (Lucarelli, 2015b). As exports will be considerably different between scenarios, there is a lot of uncertainty for the domestic market on how much coal will be left for consumption in the country. Unless government restrictions on exports become tighter, the higher willingness to pay in export markets will be served in priority before the domestic market.Depending on the climate policy efforts in the import-ing countries—that generally have a higher willingness to pay than the domestic Indonesian demand—exports leave more or less coal for domestic demand. The share of exports of total Indonesian production will be between 20% currently and up to 100% towards 2045/2050 in the NDC and ECT2 scenario. Interestingly, the 2°C would leave the smallest share (and quantities) for domestic consumption in Indonesia (20% and less throughout 2050). This is because, for the little quantities need-ed in the 2°C scenario, it is cheaper for importers to purchase the low-cost Indonesian coal rather than to build up and maintain new domestic production and transport capacities. This is particularly true for China which suffers from large bottlenecks in the inland coal transport to the coastal regions. However, China is the main market for Indonesian exports in all scenarios. Indonesia only exports a limited amount to India and completely stops exporting there after 2040, due to its own limited reserves.Towards 2050, the limit on Indonesian coal reserves will effectively bind the country’s production poten-tial. The reserve constraint plays out differently over time between the scenarios, as the Indonesian produc-ers maximize their sales in the high price periods until 2050. In the 2°C scenario and the ECT1 scenario, pro-duction is smoothed out over time with still 150 Mtpa production in 2050. On the contrary in the NDC and the ECT2 scenarios, production is larger in the medi-um run (2030/2035) and then has to decrease more strongly to approx. 110 Mtpa in 2050. In all scenarios, Indonesian production peaks in the early 2020s, as do the investments in production capacities. Later on, the reserve limit already affects production and investment plans. In other words, for the Indonesian production and exports to be sustained at very high levels even longer, it would require a large exploration effort to find new coal reserves that are yet unknown.

Investment and production plans in key exporting countries
30 WHAT DOES “PEAK COAL” MEAN FOR INTERNATIONAL COAL EXPORTERS?
6.5. USAThe USA are currently seeing a major political push for coal use and extraction in the country. However, this comes after several years of unfavourable conditions for coal power and coal mining. Most importantly, cheap domestic natural gas supplies from shale gas, regional environmental and CO2 emissions regulations, as well as federal political efforts such as the Obama admin-istration’s Clean Power Plan have considerably reduced the role of coal compared to just 10 years ago. Figure 25 shows the decrease of steam coal consumption from almost 900 Mtpa in 2010 to less than 700 Mtpa in 2015, a drop of almost 25%The US coal mining industry has long tried to “bypass” the declining domestic market by increased exports. However, coal exports from the West coast have never been allowed—and are unlikely to be so in the future—and this explicitly for environmental reasons. Several coal export harbour projects have been proposed in Califor-nia, Oregon and Washington State but none has passed the (environmental) licensing procedures. Bypassing via Canada’s British Columbia ports is currently only possi-ble for very small volumes (ca. 5 Mtpa) because of very limited freight rail capacities.The fact that West coast exports are effectively prohibit-ed is remarkable because the coal basin that is closest to the US West coast is the Powder River Basin (PRB) where coal can be mined at extremely low costs compared to other mining basins worldwide (and even more so com-pared to other US coal mining regions such as Appalachia
and Illinois). In addition to advantageous geological con-ditions, Powder River Basin producers benefit from rela-tively generous regulations on royalties. Nevertheless, US coal producers can access a number of other ports on the US Gulf and the Atlantic coast and, thereby, also reach Asian markets. However, these longer routes—notably via the Panama Canal—have higher transport costs than from the West coast, so that supply costs of US coal to the Asian markets are slightly higher than from other, regional suppliers. Hence, the US can only compete on the margin with lost cost suppliers such as Indonesia and South Africa. The US therefore take the role of the mar-ginal supplier in the world’s largest markets in Asia. Any climate policy and resulting coal consumption reduction in the region will in the first place affect US exports.
Source: COALMOD-World results.
Korea
Canada
Mexico
Chile
Brazil
EU
China
Taiwan
Japan
India0
50
100
150
200
250
300
350
400
2050204520402035203020252020
Mtpa
0
100
200
300
400
500
ECT2
ECT12°C
NDC
ECT2
ECT12°C
NDC
ECT2
ECT12°C
NDC
ECT2
ECT12°C
NDC
ECT2
ECT12°C
NDC
ECT2
ECT12°C
NDC
ECT2
ECT12°C
NDC
Figure 20. Exports by the USA over time and by scenario
Conclusions and policy discussion
WHAT DOES “PEAK COAL” MEAN FOR INTERNATIONAL COAL EXPORTERS? 31
7. Conclusions and policy discussion
This paper has examined various scenarios for coal de-mand, and their consequences in terms of production, prices and exports at the global level and for major coal producers and exports. The motivation of this analysis was the large degree of uncertainty that surrounds the future global steam coal market, an uncertainty that is obscured when only looking at one or two very contrast-ing scenarios for demand (e.g. an NDC or 2°C scenario). These scenario “extremes” tell us about the upper and lower bounds of possible outcomes, but not about the intermediate outcomes, which are arguably more prob-able—at least in the medium term, as climate policy ratchets up.Moreover, the specific drivers of different scenarios may differ even in scenarios that give similar aggregate num-bers for global coal demand. In this regard, this paper investigated three distinct drivers of transition in the coal sector:
yGlobal climate policy efforts;
y Technology developments, especially related to the relative costs of substitutions to coal (such as renew-able energy);
yOther non-climate policy factors, such as local air quality regulations, macroeconomic and industrial development pathways.
This analysis thus allowed us to examine a broader range of risk factors to the global steam coal market than is usually presented in the dichotomy between “strong cli-mate mitigation scenarios” and “current policy scenari-os”. It also allowed us to be more country-specific in our conclusions, in terms of different countries’ exposure to risk factors in major coal importing countries.This analysis leads us to a number of conclusions.Even without more stringent climate policy, the balance of risks and opportunities to the global coal market ap-pears significantly on the downside. The prospect of a peak followed by steady decline of global demand during the 2020s is indeed highlighted in 4 of the 5 scenarios explored, and can be considered likely. Factors such as the decreasing energy intensity of “late mover” develop-ing countries’ growth pathways, local air pollution and technological advances reflected in the quickly increas-ing cost competitiveness of renewables can plausibly drive a significant decline in global coal demand rela-
tive to the NDC Scenario. The realisation of these risks does not require potentially implausible global regimes of stringent carbon prices, etc., but rather the continu-ation of economic, technological and policy trends that already exist. This would be sufficient to lead to signifi-cant disruption in global steam coal markets.Investors, businesses and policy-makers need to devel-op a more nuanced view on the drivers and inflection points of transition in the global coal steam market. In fact, if risk is defined as impact multiplied by probability, perhaps the largest risk stems not from animmediate strengthening of of climate policy to be immediately in line with 2° C, but rather the accumulation of differ-ent endogenous trends such as technology innovation, growing concern on local air pollution, water quality, land impacts, and their feedback on iterative strength-ening of climate policy.Such a scenario of “endogenous transition” would still be far from what is required to mitigate climate change to less than 2°C, but this is enough to make a major dif-ference to exporters’ perspectives. The most ambitious scenario for endogenous transition still adds up to only about a 3rd of the coal demand reduction seen in the 2°C scenario. However, given the relatively low level of imports compared to domestic poduction in the domi-nant importing countries, China and India, this is more than enough to fundamentally shrink regional markets for coal, with knock on effects for producers.The location and timing of the coal transition matters a lot to which exporters are impacted most. For example, South Africa is particularly exposed to coal transition in India, which could be driven by a number of different factors, in particular the cost competitiveness of renew-ables vis-à-vis coal and the capacity of the Indian elec-tricity grid to absorb large shares of variable renewables. On the other hand, Australia is more exposed to China, where the risk factors are somewhat different, relating notably to the macroecnomic and governance transition that would be required to wean China off its economic development model dependent on investments in in-frastructure, real-estate and manufacturing capacity. Finally, high-cost suppliers like the United States are the first to feel the impacts of any transition away from the levels of coal consumption seen in the NDC scenario.
Conclusions and policy discussion
32 WHAT DOES “PEAK COAL” MEAN FOR INTERNATIONAL COAL EXPORTERS?
In thermal coal exporting economies, the coal global trade is often deeply embedded in domestic energy, regional and fiscal policy. Export revenues and related taxes are often important to, inter alia, subsidise domes-tic (coal-based) power prices, pay for local infrastruc-ture, employ lower skilled workers in specific regions, and contribute to balancing budgets through general tax revenues. Conversely, governments are wont to provide various supports to the sector in return for expectations of longer-term economic benefits. However, the sce-narios explored in this report suggest that it is time for governments to begin to prepare and implement credible transition policies. The transition may well arrive sooner and more disruptively than currently anticipated.Policymakers in coal exporting and importing countries should be engaging in dialogue on the medium and long-term future of the coal sector. There is a tendency for policymakers in major coal producing economies to sometimes struggle, from a purely domestic vantage point, to grasp the full scale of the risks posed by ex-ternal factors. Conversely, major consumers may well stand to be impacted by policy developments in supplier countries as they react to a declining global market pie. A first step for policy makers to anticipate and manage these uncertainties is through a focused dialogue on the future of the sector in their respective countries.

References
WHAT DOES “PEAK COAL” MEAN FOR INTERNATIONAL COAL EXPORTERS? 33
2References z Enerdata, n.d. (accessed: 07/06/018) Global Energy and CO2 Data, Enerdata, Paris. https://www.enerdata.fr/research/donnees-energie-mondiales-taux-emission-co2.html
z Financial Times (02/05/2018): China fake data mask economic rebound, FT.com, London. https://www.ft.com/content/a9889330-f51c-11e7-88f7-5465a6ce1a00
z Jesse Burton and Harald Winkler (2014). South Africa’s planned coal infrastructure expansion: drivers, dynamics and impacts on greenhouse gas emissions. Energy Research Centre, University of Cape Town, Cape Town.
z Jeremy Carl (2015). The Causes and Implications of India’s Coal Production Shortfall, in: Thurber, M.C. & Morse, R.K. (eds). “The Global Coal Market: Supplying the Major Fuel for Emerging Economies” Cambridge: Cambridge University Press (pp.123-163).
z Commonwealth of Australia (2015). Coal in India. Available online at http://www.industry.gov.au/Office-of-the-Chief-Economist/Publications/Pages/Coal-in-India.aspx.
z Government of India (2015). India’s Intended Nationally Determined Contribution: Working Towards Climate Justice. Available online at http://www4.unfccc.int/submissions/INDC/Published%20Documents/India/1/INDIA%20INDC%20TO%20UNFCCC.pdf.
z Michael Grubb, Fu Sha, Thomas Spencer, Nick Hughes, Zhongxiang Zhang, Paolo Agnolucci (2015). A review of Chinese CO2 emission projections to 2030: the role of economic structure and policy, Climate Policy, Volume 15, 2015, pp. S7-S39.
z Clemens Haftendorn and Franziska Holz (2010). Modeling and Analysis of the International Steam Coal Trade. The Energy Journal, Vol. 31 (4), pp. 201-225.
z Clemens Haftendorn, Franziska Holz, and Christian von Hirschhausen (2012). The End of Cheap Coal? A Techno-economic Analysis Until 2030 using the COALMOD-World Model. Fuel, Vol. 102, pp. 305-325.
z Franziska Holz, Clemens Haftendorn, Roman Mendelevitch, and Christian von Hirschhausen (2015). The COALMOD-World Model: Coal Markets Through 2030. In: M. C. Thurber and R. K. Morse (Eds.) “The Global Coal Market: Supplying the Major Fuel for Emerging Economies”, Cambridge University Press, 2015, pp. 411-472.
z Franziska Holz, Clemens Haftendorn, Roman Mendelevitch, Christian von Hirschhausen (2016). A Model of the International Steam Coal Market (COALMOD-World). DIW Data Documentation 85, DIW Berlin, Berlin.
z IDDRI (2017). T. Spencer, N. Berghmans, O. Sartor: Coal transitions in China’s power sector: A plant-level assessment of stranded assets and retirement pathways, IDDRI Research Paper No 12/17.
z IEA (2015). World Energy Outlook 2015. International Energy Agency (OECD), Paris/France.
z IEA (2016). World Energy Outlook 2016. International Energy Agency (OECD), Paris/France.
z IEA (2017a). Coal Information 2017. International Energy Agency (OECD), Paris.
z IEA (2017b). Tracking Clean Energy Progress 2017 Energy Technology Perspectives 2017. Excerpt Informing Energy Sector Transformations, IEA, Paris.
z Bart Lucarelli (2015a). Australia’s black coal industry: past achievements and future challenges. In: M. C. Thurber and R. K. Morse (Eds.) “The Global Coal Market: Supplying the Major Fuel for Emerging Economies”, Cambridge University Press, 2015, pp. 204-293.
z Bart Lucarelli (2015b). Government as creator and destroyer: Indonesia’s rapid rise and possible decline as steam coal supplier to Asia. In: M. C. Thurber and R. K. Morse (Eds.) “The Global Coal Market: Supplying the Major Fuel for Emerging Economies”, Cambridge University Press, 2015, pp. 294-374.
z South African Coal Road Map (SACRM) (2013). The South African Coal Roadmap.
z McKinsey (2015). Greening the future: New technologies that could transform how industry uses energy, Greening the Future Series, McKinsey & Company, 2015. Available online at https://www.mckinsey.com/~/media/mckinsey/business%20functions/operations/our%20insights/technologies%20that%20could%20transform%20how%20industries%20use%20energy/greening_the_future.ashx.
z MIT (2015). Energy & Climate Outlook. MIT Joint Program on the Science and Policy of Global Change, Cambridge (Mass./USA).
z Moritz Paulus and Johannes Trüby (2011). Coal lumps vs. electrons: How do Chinese bulk energy transport decisions affect the global steam coal market? Energy Economics, vol. 33, issue 6, pp., 2011, 1127-1137.
z Reuters India. n.d. “Goyal: May Stop Thermal Coal Imports in 2-3 Years.” Available online at http://in.reuters.com/article/2014/11/12/india-coal-imports-idINKCN0IW0FJ20141112.
z Republique Française (12/03/2018). Transcription de la déclaration conjointe du Président de la République, Emmanuel Macron et de Narendra Modi, Premier Ministre de la République d’Inde à New Delhi.
z Rodrik, D. (2015). Premature Deindustrialization. NBER Working Paper No. 20935, February 2015.
z Thurber, Mark C. & Richard K. Morse (eds): “The Global Coal Market: Supplying the Major Fuel for Emerging Economies”. Cambridge: Cambridge University Press (2015).
z Xunpeng Shi, Betrand Rioux, and Philip Galkin (2018). Unintended consequences of China’s coal capacity cut policy, Energy Policy, Volume 113, February 2018, pp. 478-486.
z Yang, X. F. Teng, X. Wang, Q. Zhanga (2017). System Optimization and Co-benefit Analysis of China’s Deep De-carbonization Effort towards its INDC Target, Energy Procedia, Volume 105, May 2017, Pages 3314-3319.

Appendix
34 WHAT DOES “PEAK COAL” MEAN FOR INTERNATIONAL COAL EXPORTERS?
3Appendix
Rank (1)
12345678910Global total
Rank (2)
12345678910Global total
Rank (3)
12345678910Global total
Rank (4)
12345678910Global total
CountryChinaIndiaUSASouth AfricaJapanIndonesiaRussiaKoreaTaiwanKazakhstan
CountryChinaUSAIndiaIndonesiaSouth AfricaRussiaAustraliaColumbiaKazakhstanPoland
CountryChinaIndiaJapanKoreaTaiwanRussiaMalaysiaUkraineTurkeyThailand
CountryUSAIndonesiaAustraliaRussiaColumbiaSouth AfricaUkraineKazakhstanMongoliaPoland
NDC scenario113,747
43,03421,024
6,3844,0653,8363,7612,6462,5162,282
215,244
NDC scenario100,264
30,99730,67413,00011,364
7,8237,0435,0403,4811,903
215,244
NDC scenario13,53312,361
4,0652,6462,5161,1981,1321,0611,061
77845,171
NDC scenario9,9729,1645,4295,2605,0404,9801,4531,1981,170
61345,171
2°C scenario86,30220,52210,942
4,7722,3522,1112,0601,5781,5031,270
141,273
2°C scenario70,89113,56517,80012,770
8,4314,7704,4442,5912,0551,104
141,273
2°C scenario15,484
2,7222,3521,5781,503
785643403573465
29,944
2°C scenario2,623
10,6603,4353,4942,5913,659
728785
1,17081
29,944
ECT1 scenario107,526
35,94020,117
6,1384,0413,8353,7602,6472,5212,282
202,557
ECT1 scenario95,11628,21827,28313,00011,025
7,2696,5714,6593,4612,447
202,557
ECT1 scenario12,460
8,6574,0412,6472,5211,1791,1421,0831,061
77341,027
ECT1 scenario8,1019,1654,9604,6884,6594,8871,3261,1791,170
041,027
ECT2 scenario102,590
40,63920,074
6,1364,0343,8253,7522,6402,5032,279
202,199
ECT2 scenario94,16127,81728,67913,00011,025
7,1346,5384,4743,4432,447
202,199
ECT2 scenario8,864
11,9604,0342,6402,5031,1651,1311,0701,058
77640,657
ECT2 scenario7,7439,1754,9294,5464,4744,8881,2891,1651,170
040,657
1 (by consumption in NDC scenario) 2 (by production in NDC scenario) 3 (by imports in NDC scenario) 4 (by exports in NDC scenario)
Table 4. Cumulative coal consumption in Mt in the period 2010-2050 in the scenarios in the top ten coal consuming countries
Table 5. Largest producers and their cumulative production volume 2010-2050 in Mt
Table 6. Cumulative coal imports in the period 2010-2050 in the scenarios in the top ten coal importing countries (in Mt)
Table 7. Cumulative coal exports in the period 2010-2050 in the scenarios in the top coal exporting countries (in Mt)

Appendix
WHAT DOES “PEAK COAL” MEAN FOR INTERNATIONAL COAL EXPORTERS? 35
Source: COALMOD-World results.
ECT1
2°C
ECT2
NDC2050204520402035203020252010 20202015 2050204520402035203020252010 20202015
Mtpa
0
500
1000
1500
2000
2500
3000
Production Consumption
Figure 21. COALMOD-World results: coal production and consumption in China 2010-2050 in various scenarios
Source: COALMOD-World results.
ECT1
2°C
ECT2
NDC2050204520402035203020252010 20202015 2050204520402035203020252010 20202015
Production Consumption
Mtpa
0
250
500
750
1000
1250
1500
Figure 22. COALMOD-World results: coal production and consumption in India 2010-2050 in various scenarios
Source: COALMOD-World results.
ECT1
2°C
ECT2
NDC2050204520402035203020252010 20202015 2050204520402035203020252010 20202015
Production Consumption
Mtpa
0
200
400
600
800
1000
Figure 23. COALMOD-World results: coal production and consumption in the USA 2010-2050 in various scenarios
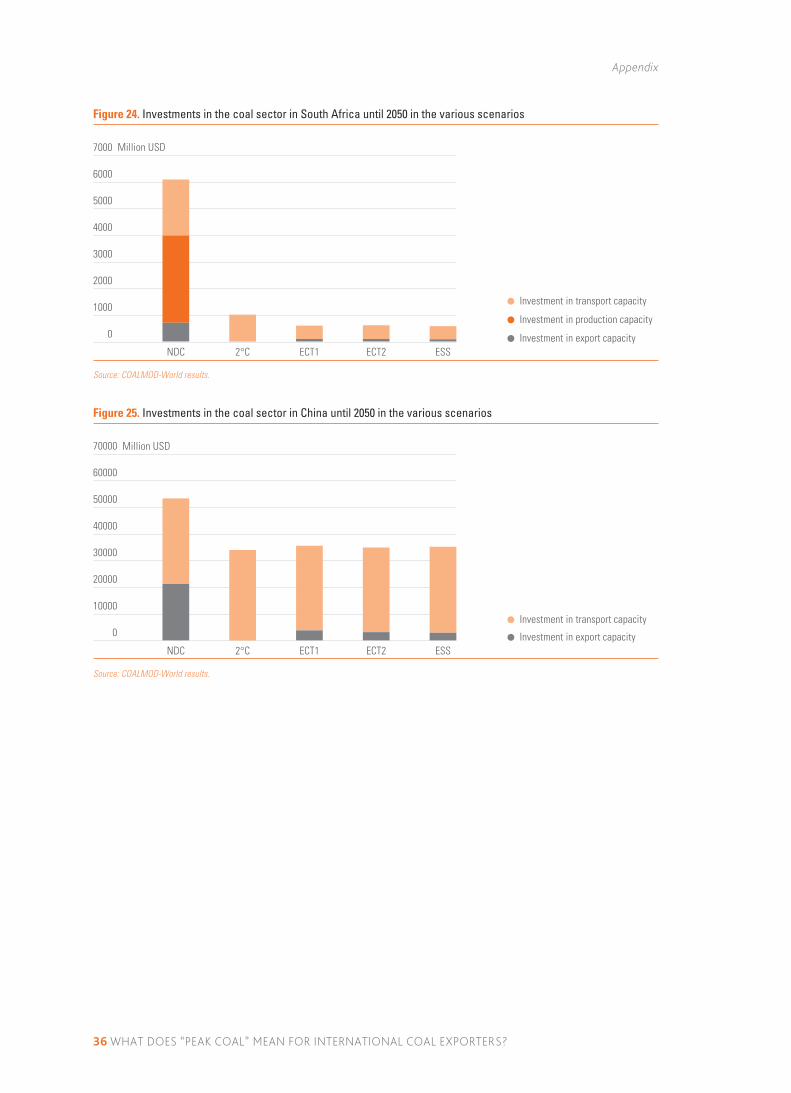
Appendix
36 WHAT DOES “PEAK COAL” MEAN FOR INTERNATIONAL COAL EXPORTERS?
Source: COALMOD-World results.
Investment in transport capacity
Investment in production capacity
Investment in export capacity
Million USD
0
1000
2000
3000
4000
5000
6000
7000
ESSECT2ECT12°CNDC
Figure 24. Investments in the coal sector in South Africa until 2050 in the various scenarios
Source: COALMOD-World results.
Investment in transport capacity
Investment in export capacity
Million USD
0
10000
20000
30000
40000
50000
60000
70000
ESSECT2ECT12°CNDC
Figure 25. Investments in the coal sector in China until 2050 in the various scenarios


COAL TRANSITIONS: RESEARCH AND DIALOGUE ON THE FUTURE OF COAL
COAL TRANSITIONS is a large-scale research project leaded by Climate Strate-gies and The Institute for Sustainable Development and International Relations (IDDRI) and funded by the KR Foundation.
The project’s main objective is to conduct research and policy dialogue on the issue of managing the transition within the coal sector in major coal using economies, as is required if climate change is to be successfully limited to 2°C.
THIS PROJECT BRINGS TOGETHER RESEARCHERS FROM AROUND THE GLOBE, INCLUDING AUSTRALIA, SOUTH AFRICA, GERMANY, POLAND, INDIA AND CHINA.
www.coaltransitions.org