Embed Size (px)
Citation preview
8/3/2019 What does a Warm December tell us about the Rest of the Winter?
http://slidepdf.com/reader/full/what-does-a-warm-december-tell-us-about-the-rest-of-the-winter 1/4
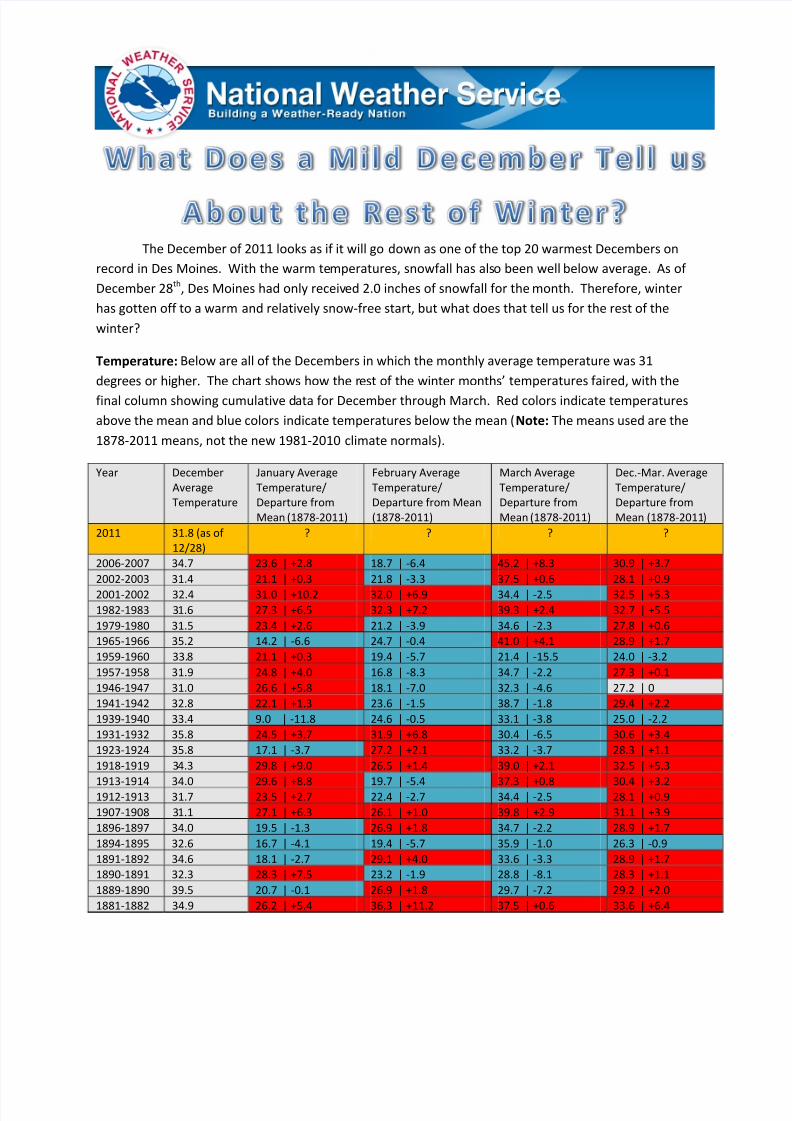
The December of 2011 looks as if it will go down as one of the top 20 warmest Decembers on
record in Des Moines. With the warm temperatures, snowfall has also been well below average. As of
December 28th, Des Moines had only received 2.0 inches of snowfall for the month. Therefore, winter
has gotten off to a warm and relatively snow-free start, but what does that tell us for the rest of the
winter?
Temperature: Below are all of the Decembers in which the monthly average temperature was 31
degrees or higher. The chart shows how the rest of the winter months’ temperatures faired, with the
final column showing cumulative data for December through March. Red colors indicate temperatures
above the mean and blue colors indicate temperatures below the mean (Note: The means used are the
1878-2011 means, not the new 1981-2010 climate normals).
Year December
Average
Temperature
January Average
Temperature/
Departure from
Mean (1878-2011)
February Average
Temperature/
Departure from Mean
(1878-2011)
March Average
Temperature/
Departure from
Mean (1878-2011)
Dec.-Mar. Average
Temperature/
Departure from
Mean (1878-2011)
2011 31.8 (as of
12/28)
? ? ? ?
2006-2007 34.7 23.6 | +2.8 18.7 | -6.4 45.2 | +8.3 30.9 | +3.7
2002-2003 31.4 21.1 | +0.3 21.8 | -3.3 37.5 | +0.6 28.1 | +0.9
2001-2002 32.4 31.0 | +10.2 32.0 | +6.9 34.4 | -2.5 32.5 | +5.3
1982-1983 31.6 27.3 | +6.5 32.3 | +7.2 39.3 | +2.4 32.7 | +5.5
1979-1980 31.5 23.4 | +2.6 21.2 | -3.9 34.6 | -2.3 27.8 | +0.6
1965-1966 35.2 14.2 | -6.6 24.7 | -0.4 41.0 | +4.1 28.9 | +1.7
1959-1960 33.8 21.1 | +0.3 19.4 | -5.7 21.4 | -15.5 24.0 | -3.2
1957-1958 31.9 24.8 | +4.0 16.8 | -8.3 34.7 | -2.2 27.3 | +0.1
1946-1947 31.0 26.6 | +5.8 18.1 | -7.0 32.3 | -4.6 27.2 | 0
1941-1942 32.8 22.1 | +1.3 23.6 | -1.5 38.7 | -1.8 29.4 | +2.2
1939-1940 33.4 9.0 | -11.8 24.6 | -0.5 33.1 | -3.8 25.0 | -2.2
1931-1932 35.8 24.5 | +3.7 31.9 | +6.8 30.4 | -6.5 30.6 | +3.4
1923-1924 35.8 17.1 | -3.7 27.2 | +2.1 33.2 | -3.7 28.3 | +1.1
1918-1919 34.3 29.8 | +9.0 26.5 | +1.4 39.0 | +2.1 32.5 | +5.3
1913-1914 34.0 29.6 | +8.8 19.7 | -5.4 37.3 | +0.8 30.4 | +3.21912-1913 31.7 23.5 | +2.7 22.4 | -2.7 34.4 | -2.5 28.1 | +0.9
1907-1908 31.1 27.1 | +6.3 26.1 | +1.0 39.8 | +2.9 31.1 | +3.9
1896-1897 34.0 19.5 | -1.3 26.9 | +1.8 34.7 | -2.2 28.9 | +1.7
1894-1895 32.6 16.7 | -4.1 19.4 | -5.7 35.9 | -1.0 26.3 | -0.9
1891-1892 34.6 18.1 | -2.7 29.1 | +4.0 33.6 | -3.3 28.9 | +1.7
1890-1891 32.3 28.3 | +7.5 23.2 | -1.9 28.8 | -8.1 28.3 | +1.1
1889-1890 39.5 20.7 | -0.1 26.9 | +1.8 29.7 | -7.2 29.2 | +2.0
1881-1882 34.9 26.2 | +5.4 36.3 | +11.2 37.5 | +0.6 33.6 | +6.4
8/3/2019 What does a Warm December tell us about the Rest of the Winter?
http://slidepdf.com/reader/full/what-does-a-warm-december-tell-us-about-the-rest-of-the-winter 2/4
The first thing that becomes apparent from the above chart is that a warm December does not
necessarily mean the rest of the winter will be warm. It seems there is some correlation between warm
Decembers transitioning to warm Januarys, but this is obviously due to their close temporal proximity,
and the chance that the same general weather pattern in December is affecting at least the first part of
January. Moving into February and March, there is much less of a correlation, with 13 of 24 Februarys
and 15 of 24 Marchs having had temperatures that were below normal. The winter season as a whole
ended with temperatures above normal in 20 of the 24 years. Since December started off so warm in
each of these years, the only way the seasonal temperatures could drop below average was to have
temperatures well below normal in the remaining winter months (ex: 1959-1960, 1939-1940, 1894-
1895).
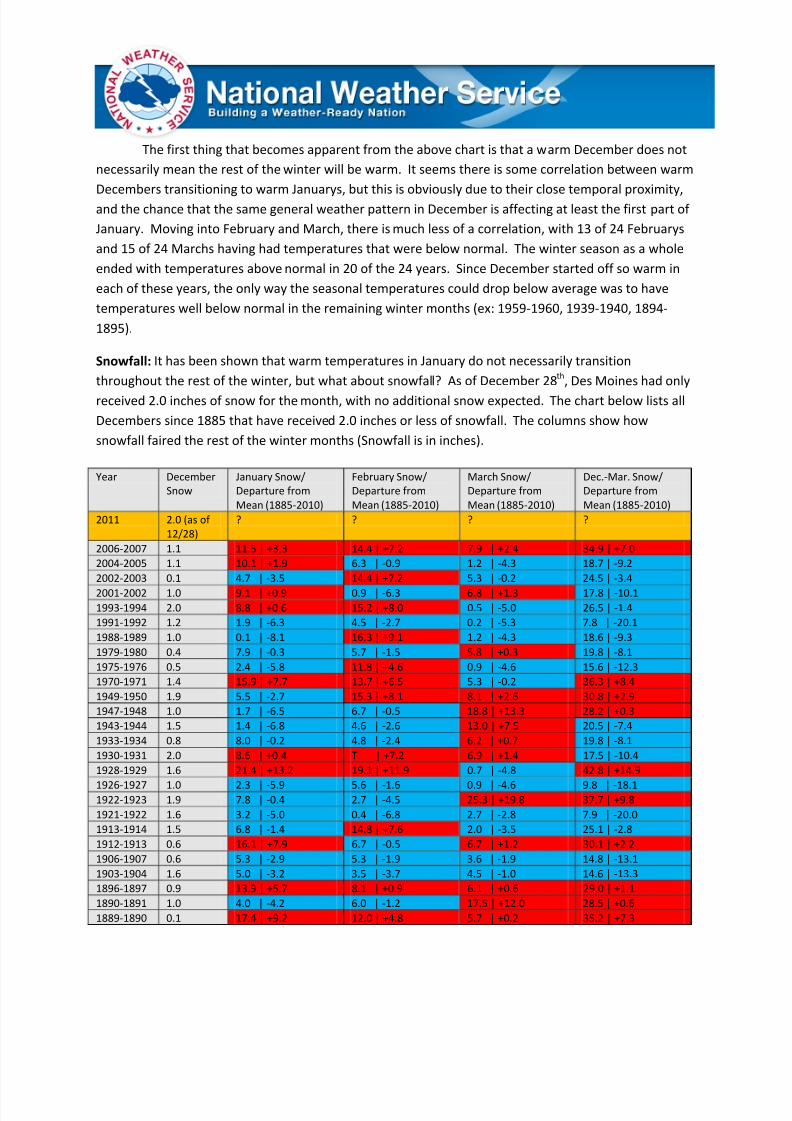
Snowfall: It has been shown that warm temperatures in January do not necessarily transition
throughout the rest of the winter, but what about snowfall? As of December 28th
, Des Moines had only
received 2.0 inches of snow for the month, with no additional snow expected. The chart below lists all
Decembers since 1885 that have received 2.0 inches or less of snowfall. The columns show how
snowfall faired the rest of the winter months (Snowfall is in inches).
Year December
Snow
January Snow/
Departure from
Mean (1885-2010)
February Snow/
Departure from
Mean (1885-2010)
March Snow/
Departure from
Mean (1885-2010)
Dec.-Mar. Snow/
Departure from
Mean (1885-2010)
2011 2.0 (as of
12/28)
? ? ? ?
2006-2007 1.1 11.5 | +3.3 14.4 | +7.2 7.9 | +2.4 34.9 | +7.0
2004-2005 1.1 10.1 | +1.9 6.3 | -0.9 1.2 | -4.3 18.7 | -9.2
2002-2003 0.1 4.7 | -3.5 14.4 | +7.2 5.3 | -0.2 24.5 | -3.4
2001-2002 1.0 9.1 | +0.9 0.9 | -6.3 6.8 | +1.3 17.8 | -10.1
1993-1994 2.0 8.8 | +0.6 15.2 | +8.0 0.5 | -5.0 26.5 | -1.4
1991-1992 1.2 1.9 | -6.3 4.5 | -2.7 0.2 | -5.3 7.8 | -20.1
1988-1989 1.0 0.1 | -8.1 16.3 | +9.1 1.2 | -4.3 18.6 | -9.3
1979-1980 0.4 7.9 | -0.3 5.7 | -1.5 5.8 | +0.3 19.8 | -8.1
1975-1976 0.5 2.4 | -5.8 11.8 | +4.6 0.9 | -4.6 15.6 | -12.3
1970-1971 1.4 15.9 | +7.7 13.7 | +6.5 5.3 | -0.2 36.3 | +8.4
1949-1950 1.9 5.5 | -2.7 15.3 | +8.1 8.1 | +2.6 30.8 | +2.9
1947-1948 1.0 1.7 | -6.5 6.7 | -0.5 18.8 | +13.3 28.2 | +0.3
1943-1944 1.5 1.4 | -6.8 4.6 | -2.6 13.0 | +7.5 20.5 | -7.4
1933-1934 0.8 8.0 | -0.2 4.8 | -2.4 6.2 | +0.7 19.8 | -8.1
1930-1931 2.0 8.6 | +0.4 T | +7.2 6.9 | +1.4 17.5 | -10.4
1928-1929 1.6 21.4 | +13.2 19.1 | +11.9 0.7 | -4.8 42.8 | +14.9
1926-1927 1.0 2.3 | -5.9 5.6 | -1.6 0.9 | -4.6 9.8 | -18.11922-1923 1.9 7.8 | -0.4 2.7 | -4.5 25.3 | +19.8 37.7 | +9.8
1921-1922 1.6 3.2 | -5.0 0.4 | -6.8 2.7 | -2.8 7.9 | -20.0
1913-1914 1.5 6.8 | -1.4 14.8 | +7.6 2.0 | -3.5 25.1 | -2.8
1912-1913 0.6 16.1 | +7.9 6.7 | -0.5 6.7 | +1.2 30.1 | +2.2
1906-1907 0.6 5.3 | -2.9 5.3 | -1.9 3.6 | -1.9 14.8 | -13.1
1903-1904 1.6 5.0 | -3.2 3.5 | -3.7 4.5 | -1.0 14.6 | -13.3
1896-1897 0.9 13.9 | +5.7 8.1 | +0.9 6.1 | +0.6 29.0 | +1.1
1890-1891 1.0 4.0 | -4.2 6.0 | -1.2 17.5 | +12.0 28.5 | +0.6
1889-1890 0.1 17.4 | +9.2 12.0 | +4.8 5.7 | +0.2 35.2 | +7.3

8/3/2019 What does a Warm December tell us about the Rest of the Winter?
http://slidepdf.com/reader/full/what-does-a-warm-december-tell-us-about-the-rest-of-the-winter 3/4
As was the case with temperatures, there is very little correlation between December snowfall
and snowfall the rest of the winter. Looking at the data, 16 of the 26 years saw the below average
snowfall continue into January. Only 14 of the 26 and 13 of the 26 came in below average in February
and March, respectively. Despite a very dry start (2 inches or less in December), 10 of the 26 years still
came in with above average snowfall for the winter season. Therefore, it seems as if December offers us
little, if any forecasting power for the remainder of the winter. Some people think that winter tends to
make up for a slow start, hammering central Iowa more in February and March. While this is obviously
not always the case, there have been quite a few examples where February and March have really
brought a healthy dose of snow (Feb 2003, Feb 1994, Feb 1950, Feb 1929, Mar 1948, Mar 1923, Mar
1891).
El Nino/La Nina Correspondence
Many recent studies have shown that sea surface temperature anomalies in the tropical PacificOcean have a distinct impact on the global weather pattern. The El Nino/La Nina Southern Oscillation
(ENSO) is an index that is used to quantify these temperature anomalies and classify whether the
pattern is in a neutral, El Nino (warm), or La Nina (cold) phase. Currently, we are in a La Nina phase
which is expected to last through the remainder of the winter season. Although this index does quite
well in predicting global circulations, it can be tough to correlate to the weather at one specific location
such as central Iowa (Note: ENSO data only goes back to 1950).
Temperature: The following chart shows the years where December average temperature was greater
than or equal to 31.0 degrees. The ENSO phase is noted.
Not surprisingly, there seems to be little correlation to warm Decembers and any ENSO phase. 4
of the 8 years actually occurred in a neutral ENSO phase, showing there is no strong signal between the
ENSO index and December temperature.
Snowfall: The same chart was created for snowfall. The winters that contain Decembers where Des
Moines received 2.0 or less of snowfall are listed. The ENSO phase is noted.
Winter ENSO Phase Winter ENSO Phase
2006-2007 Neutral 1979-1980 El Nino
2002-2003 Neutral 1965-1966 La Nina
2001-2002 La Nina 1959-1960 Neutral
1982-1983 Neutral 1957-1958 La Nina
Winter ENSO Phase Winter ENSO Phase
2006-2007 Neutral 1991-1992 Neutral
2004-2005 Neutral 1988-1989 El Nino
2002-2003 Neutral 1979-1980 Neutral
2001-2002 La Nina 1975-1976 La Nina

8/3/2019 What does a Warm December tell us about the Rest of the Winter?
http://slidepdf.com/reader/full/what-does-a-warm-december-tell-us-about-the-rest-of-the-winter 4/4
As with temperature, there is little correlation between light December snowfall and ENSO
phase. 5 of the 8 years occurred in a neutral phase, with 2 of the other 3 occurring in La Nina years.
It's important to remember that our skill in predicting seasonal temperatures is very limited and
many factors that cannot be anticipated beyond a week or two often play major roles in the
predominant weather patterns. The charts above simply show what has happened in the past, and as
shown above, have little predictability on what will happen the rest of the winter. For a forecast for the
remainder of this winter, refer to the latest 30 and 90 day outlooks from the Climate Prediction Center.