Embed Size (px)
Citation preview


What do you do when you have
a problem that needs solving? • What are some problems we have in life?
Any of these sound familiar?
• Where are My Shoes?
• What should I have for lunch?
• What class do I have next?
• Did I do my homework for that class?
• What is the cure for cancer?
• Which deodorant works the longest?
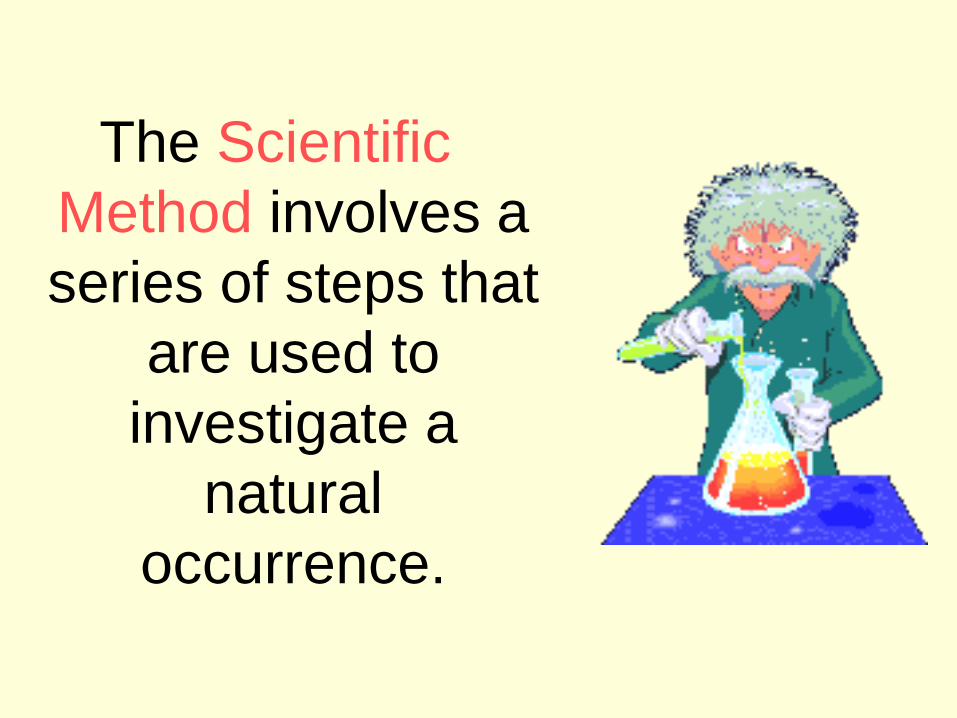
The Scientific
Method involves a
series of steps that
are used to
investigate a
natural
occurrence.

We shall take a
closer look at
these steps and
the terminology
you will need to
understand before
you start a
science project.
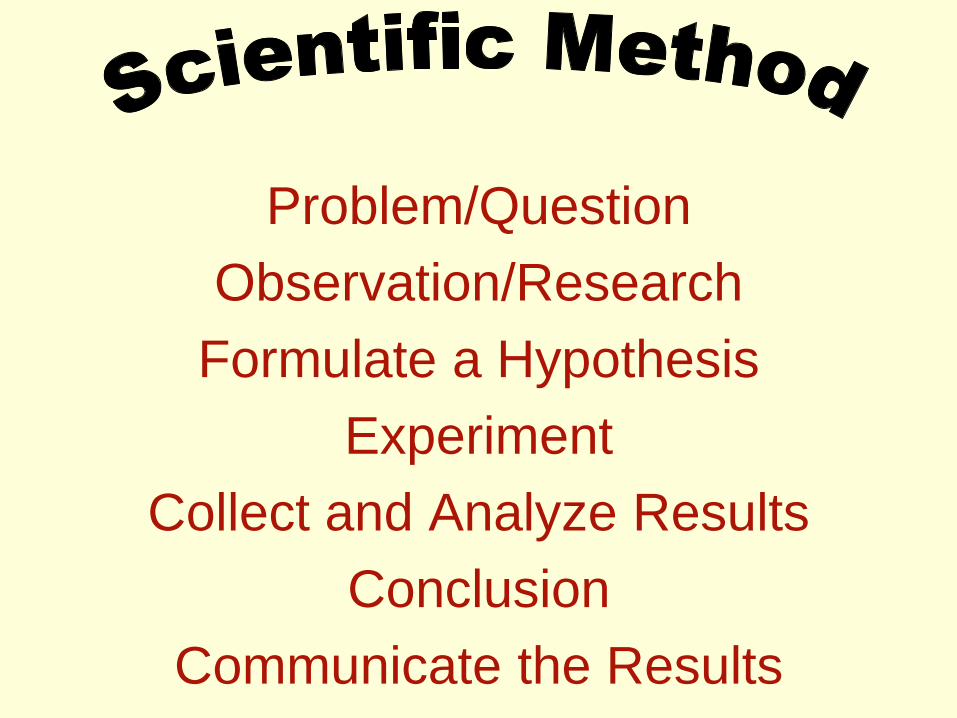
Problem/Question
Observation/Research
Formulate a Hypothesis
Experiment
Collect and Analyze Results
Conclusion
Communicate the Results

Steps of the
Scientific Method
1. Problem/Question: Develop a
question or problem that can
be solved through
experimentation.
Steps of the
Scientific Method
2. Observation/Research: Make
observations and research
your topic of interest.

Do you remember the
next step?

Steps of the
Scientific Method
3. Formulate a Hypothesis:
Predict a possible answer to
the problem or question.
Example: If soil temperatures
rise, then plant growth will
increase.
Steps of the
Scientific Method
4. Experiment: Develop and
follow a procedure.
Include a detailed materials list.
The outcome must be
measurable (quantifiable).
Steps of the
Scientific Method
5. Collect and Analyze Results:
Modify the procedure if
needed.
Confirm the results by retesting.
Include tables, graphs, and
photographs.

Steps of the
Scientific Method
6. Conclusion: Include a statement that accepts or
rejects the hypothesis.
Make recommendations for further study and possible
improvements to the procedure.

Steps of the
Scientific Method
7. Communicate the Results: Be
prepared to present the project
to an audience.
Expect questions from the
audience.

Think you can name all
seven steps?
Problem/Question Observation/Research Formulate a Hypothesis Experiment Collect and Analyze Results Conclusion Communicate the Results
Let’s put our knowledge of the
Scientific Method to a realistic
example that includes some of the
terms you’ll be needing to use and
understand.
Problem/Question
John watches his
grandmother bake
bread. He ask his
grandmother what
makes the bread rise.
She explains that yeast
releases a gas as it
feeds on sugar.
Problem/Question
John wonders if the
amount of sugar used
in the recipe will affect
the size of the bread
loaf?
Observation/Research
John researches the
areas of baking and
fermentation and tries
to come up with a way
to test his question.
He keeps all of his
information on this
topic in a journal.
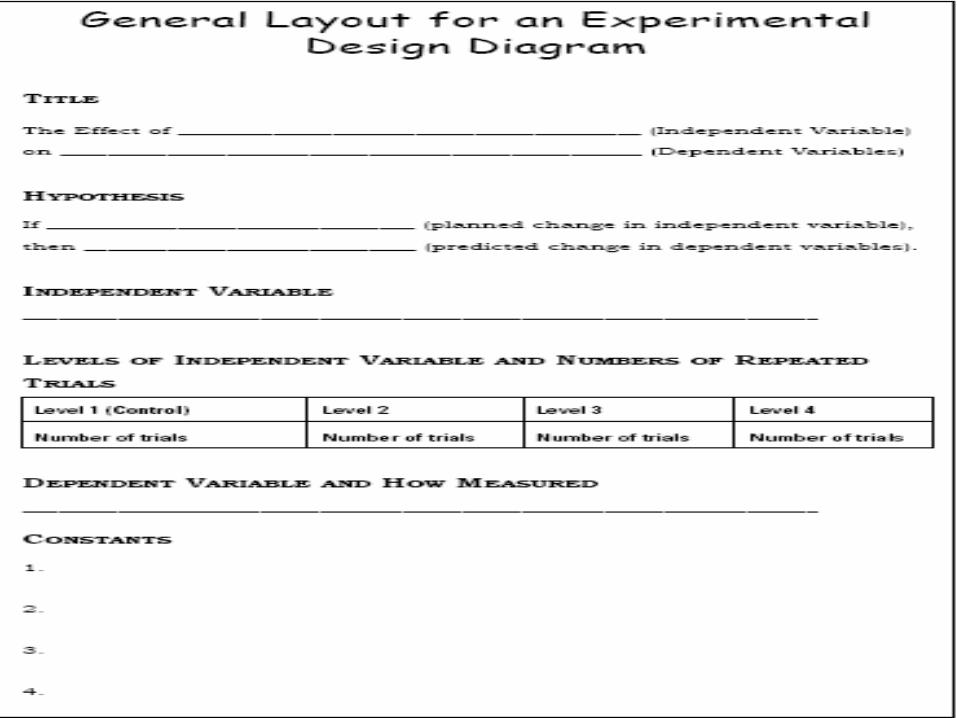
John talks with his
teacher and she gives
him a Experimental
Design Diagram to
help him set up his
investigation.
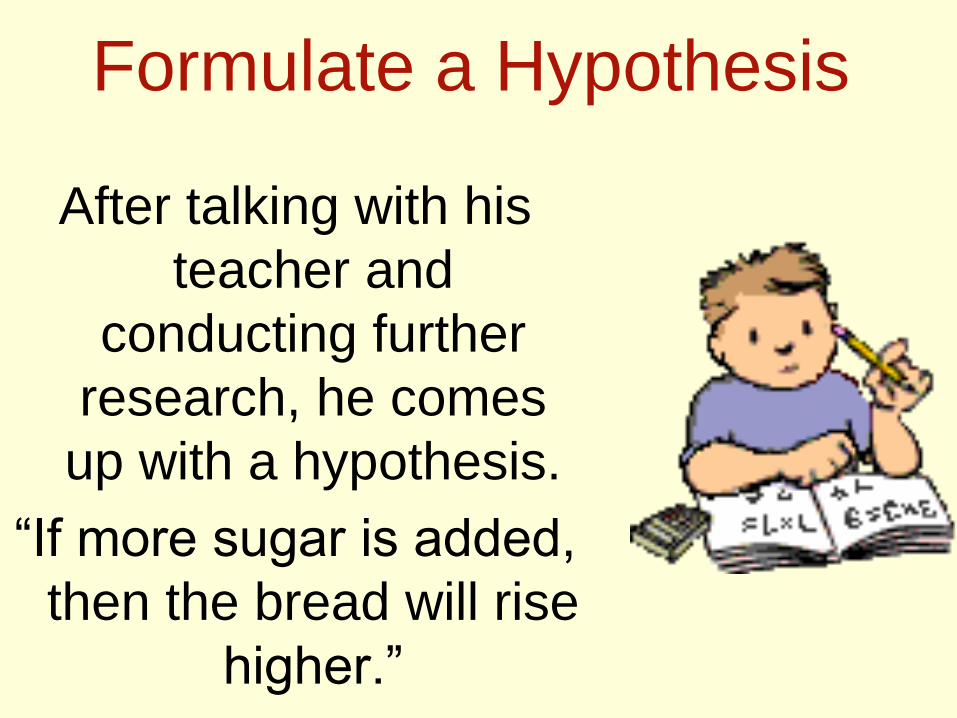
Formulate a Hypothesis
After talking with his
teacher and
conducting further
research, he comes
up with a hypothesis.
“If more sugar is added,
then the bread will rise
higher.”

Hypothesis
The hypothesis is an educated
guess about the relationship
between the independent and
dependent variables.
Note: These variables will be
defined in the next few slides.

Elements of a good Hypothesis
• What you will do
• What you think will happen

Partner work • Write a good hypothesis for the following
scenarios
– You want to know if your dog will like Purina Dog Chow
more than Filbert’s Dog Mush.
– You have seen that bread rises as it bakes and you
want to know which ingredient makes it rise, yeast, salt,
or sugar.
– You are wondering how far forward you can tip on your
science chair before it slides out from under you.
– You want to know if the type of gas (premium unleaded
or unleaded) will affect how fast your new car can go.
– You want to know what conditions will make cheese
mold slower.

Do you know the difference
between the independent
and dependent variables?

Independent Variable
The independent, or manipulated variable, is a
factor that’s intentionally varied by the experimenter.
John is going to use 25g., 50g., 100g., 250g., 500g. of sugar in
his experiment.
Dependent Variable
The dependent, or responding variable, is the factor that may change as a result of changes
made in the independent variable.
In this case, it would be the size of the loaf of bread.
Rocket Variables
• What are some variables that may affect
how far our water bottle rockets will fly?
• What are the independent variables
• What are the dependent variables
• Science word review
Experiment
His teacher helps him
come up with a
procedure and list of
needed materials.
She discusses with
John how to
determine the control
group.
Control Group
In a scientific experiment, the
control is the group that serves
as the standard of comparison.
The control group may be a “no
treatment" or an “experimenter
selected” group.
Control Group
The control group is exposed to
the same conditions as the
experimental group, except for
the variable being tested.
All experiments should have a
control group.
Control Group
Because his grandmother
always used 50g. of sugar in
her recipe, John is going to use
that amount in his control
group.
Experiment
John writes out his procedure for his
experiment along with a materials list in his
journal. He has both of these checked by his teacher where she
checks for any safety concerns.
Trials
Trials refer to replicate
groups that are exposed
to the same conditions
in an experiment.
John is going to test each
sugar variable 3 times.

Collect and Analyze Results
John comes up with a table he can use to record his data.
John gets all his materials together and carries out his
experiment.

Size of Baked Bread (LxWxH) cm3
Amt. of
Sugar (g.) 1 2 3 Average
Size (cm3)
25 768 744 761 758
50 1296 1188 1296 1260
100 1188 1080 1080 1116
250 672 576 588 612
500 432 504 360 432
Size of Bread Loaf (cm3)
Trials
Control group

Collect and Analyze Results
John examines his
data and notices that
his control worked
the best in this
experiment, but not
significantly better
than 100g. of sugar.

Conclusion
John rejects his
hypothesis, but
decides to re-test
using sugar
amounts between
50g. and 100g.

Experiment
Once again, John
gathers his materials
and carries out his
experiment.
Here are the results.
Can you tell which group
did the best?

Size of Baked Bread (LxWxH) cm3
Amt. of
Sugar (g.) 1 2 3 Average
Size (cm3)
50 1296 1440 1296 1344
60 1404 1296 1440 1380
70 1638 1638 1560 1612
80 1404 1296 1296 1332
90 1080 1200 972 1084
Size of Bread Loaf (cm3)
Trials
Control group
Conclusion
John finds that 70g.
of sugar produces
the largest loaf.
His hypothesis is
accepted.
Communicate the Results
John tells his
grandmother about
his findings and
prepares to present
his project in
Science class.