Embed Size (px)
Citation preview

Atmos. Chem. Phys., 14, 5735–5747, 2014www.atmos-chem-phys.net/14/5735/2014/doi:10.5194/acp-14-5735-2014© Author(s) 2014. CC Attribution 3.0 License.
What controls the recent changes in African mineral dust aerosolacross the Atlantic?D. A. Ridley1, C. L. Heald1,2, and J. M. Prospero3
1Department of Civil & Environmental Engineering, Massachusetts Institute of Technology, Cambridge, MA, USA2Department of Earth, Atmospheric and Planetary Sciences, Massachusetts Institute of Technology, Cambridge, MA, USA3Rosenstiel School of Marine and Atmospheric Science, University of Miami, Miami, FL, USA
Correspondence to:D. A. Ridley ([email protected])
Received: 10 January 2014 – Published in Atmos. Chem. Phys. Discuss.: 10 February 2014Revised: 23 April 2014 – Accepted: 24 April 2014 – Published: 10 June 2014
Abstract. Dust from Africa strongly perturbs the radiativebalance over the Atlantic, with emissions that are highlyvariable from year to year. We show that the aerosol opti-cal depth (AOD) of dust over the mid-Atlantic observed bythe AVHRR satellite has decreased by approximately 10 %per decade from 1982 to 2008. This downward trend per-sists through both winter and summer close to source andis also observed in dust surface concentration measurementsdownwind in Barbados during summer. The GEOS-Chemmodel, driven with MERRA re-analysis meteorology and us-ing a new dust source activation scheme, reproduces the ob-served trend and is used to quantify the factors contribut-ing to this trend and the observed variability from 1982 to2008. We find that changes in dustiness over the east mid-Atlantic are almost entirely mediated by a reduction in sur-face winds over dust source regions in Africa and are not di-rectly linked with changes in land use or vegetation cover.The global mean all-sky direct radiative effect (DRE) ofAfrican dust is−0.18 Wm−2 at top of atmosphere, account-ing for 46 % of the global dust total, with a regional DRE of−7.4± 1.5 Wm−2 at the surface of the mid-Atlantic, vary-ing by over 6.0 Wm−2 from year to year, with a trend of+1.3 Wm−2 per decade. These large interannual changesand the downward trend highlight the importance of climatefeedbacks on natural aerosol abundance. Our analysis of theCMIP5 models suggests that the decreases in the indirect an-thropogenic aerosol forcing over the North Atlantic in re-cent decades may be responsible for the observed climateresponse in African dust, indicating a potential amplificationof anthropogenic aerosol radiative impacts in the Atlantic vianatural mineral dust aerosol.
1 Introduction
Mineral dust aerosol is ubiquitous in the atmosphere and ar-guably the greatest source of particulate matter. Africa isresponsible for approximately half of the global emissions(Huneeus et al., 2011) resulting in transport of several hun-dred teragrams (Tg) of dust across the Atlantic towards theAmericas throughout the year (Ginoux et al., 2004; Kaufmanet al., 2005a; Ridley et al., 2012). This has consequences forair quality downwind (Prospero, 1999; Viana et al., 2002) aswell as the radiative balance over the Atlantic, via scatter-ing and absorption of solar radiation (and to a lesser extentterrestrial radiation), affecting cloud formation (Kaufman etal., 2005b; Koren et al., 2010; Twohy et al., 2009) and trop-ical cyclone formation (Dunion and Velden, 2004; Evan etal., 2006). African dust emissions vary greatly from year toyear (Ben-Ami et al., 2012; Chiapello, 2005; Ginoux et al.,2004), implying considerable variation in the these impactson climate and air quality.
Global dust emissions vary dramatically on millennialtimescales. Sediment core measurements show that dust de-position over the Atlantic is a factor of 5 higher in the past2000 years than during the African Humid Period (11700–5000 years ago) and that emissions during glacial periods aregenerally 2–4 times greater than interglacial periods, likelyowing to stronger winds (McGee et al., 2010, 2013). Morerecently, Mulitza et al. (2010) determined that dust emis-sions from Africa were negatively correlated with tropicalWest African precipitation from 1000 BC until the end ofthe 17th century but a sharp increase in dust deposition isobserved with the advent of commercial agriculture in the1800s, indicating the potential for anthropogenic changes to
Published by Copernicus Publications on behalf of the European Geosciences Union.

5736 D. A. Ridley et al.: What controls the recent changes in African mineral dust aerosol across the Atlantic?
influence dust emission. Considerable population growth inAfrica over recent decades, by a factor of 3 since 1950 (Pros-pero and Lamb, 2003), has led to an increase in agriculturalactivity and urbanization, with speculation that these human-induced land use and vegetation changes may also contributeto recent trends in West African dust (Chiapello, 2005; Evanet al., 2011). Since the 1950s, dust emissions from Africahave increased (Evan and Mukhopadhyay, 2010; Mbourouet al., 1997; Prospero et al., 2002), peaking in the 1980s atthe same time as the extreme droughts experienced in theSahel region. During this period a robust correlation was ob-served between dust transported to Barbados in the summerand Sudano–Sahel Precipitation Index of the previous year(Prospero and Lamb, 2003). In the past three decades, ob-servations from satellite and surface measurements indicatea breakdown in this relationship (Mahowald et al., 2009),and a decrease in dustiness (Chin et al., 2014; Evan andMukhopadhyay, 2010; Hsu et al., 2012; Shao et al., 2013;Zhao et al., 2008) coinciding with a greening of the Sahelregion (Olsson et al., 2005). A vegetation-related increase insurface roughness may also have contributed to the stillingof winds (and corresponding reduction in dust) over much ofthe Northern Hemisphere (Vautard et al., 2010; Bichet et al.,2012), including the Sahel region (Cowie et al., 2013).
Modeling studies generally agree that changes in precip-itation over the Sahel, leading to the drought and subse-quent greening, can be explained by changes in the inter-hemispheric temperature gradient across the Atlantic (Chi-ang and Friedman, 2012; Hwang et al., 2013; Rotstayn andLohmann, 2002; Zhang and Delworth, 2006) that influencesthe location of the inter-tropical convergence zone (ITCZ).Changes in dust emissions and transport over the Atlanticare associated with the location of the ITCZ (Doherty et al.,2012; Fontaine et al., 2011), which may provide a feedbackby modulating the radiative balance over the Atlantic (Evanet al., 2011). However, whether the observed changes in dustare a direct consequence of the large-scale changes associ-ated with the ITCZ location or a consequence of the greeningof the Sahel, either via a reduction in available dust sourcesor a stilling of the surface winds, is still unclear.
Dust outflow from Africa is somewhat correlated with theNorth Atlantic Oscillation (NAO) based on comparison withobservations (Chiapello, 2005; Moulin et al., 1997, p.199;Nakamae and Shiotani, 2013) with the strongest relationshipnorth of 15◦ N (Chiapello and Moulin, 2002). The NAO in-dex, defined by the difference in normalized sea level pres-sure between the Icelandic low and Azores high (Hurrell,1995), is extremely noisy and our understanding of whatcauses the fluctuations is limited (Stephenson et al., 2000).While the NAO index represents changes in circulation thataffect dust transport, primarily via the Azores high ratherthan Icelandic low (Riemer et al., 2006), the correlation withobservations of dust close to source regions is weak (Naka-mae and Shiotani, 2013). Therefore, we choose to focus pri-marily on the physical processes the drive dust emission and
export (e.g., wind strength and precipitation) rather than theclimate indices that may represent them.
In this paper we use surface and satellite dust observationsalong with a 27 year model simulation to quantify the drivingfactors behind the variability and trends in dust loading overthe Atlantic, the importance of vegetation changes for dustemission, and whether the underlying causes are natural oranthropogenic in origin. The magnitude of modeled and ob-served variability and trends in Atlantic dust AOD and directradiative effect (DRE) are assessed and the causes quanti-fied using the model. Finally, we discuss a potential driver ofchanges in surface winds using three reanalysis data sets and15 CMIP5 model simulations.
2 Model description and evaluation
2.1 Baseline model description
The GEOS-Chem model (version v9-01-01;http://www.geos-chem.org/) incorporates a global three-dimensionalsimulation of coupled oxidant–aerosol chemistry, run at aresolution of 2◦ × 2.5◦ latitude and longitude, and 47 ver-tical levels in this study. The model is driven by assimi-lated MERRA meteorology for 1982–2008 from the God-dard Earth Observing System of the NASA Global Modelingand Assimilation Office (GMAO), which includes assimi-lated meteorological fields at 1-hourly and 3-hourly temporalresolution. The aerosol types simulated include mineral dust(Fairlie et al., 2007; Zender et al., 2003), sea salt (Alexanderet al., 2005), sulfate–nitrate–ammonium aerosols (Park et al.,2004), and carbonaceous aerosols (Henze et al., 2008; Liaoet al., 2007; Park et al., 2003). Aerosol optical depth (AOD)is calculated online assuming log-normal size distributionsof externally mixed aerosols and is a function of the localrelative humidity to account for hygroscopic growth (Mar-tin et al., 2003). Aerosol optical properties employed hereare based on the Global Aerosol Data Set (GADS) (Kopke etal., 1997) with modifications to the size distribution based onfield observations (Drury et al., 2010; Jaeglé et al., 2011; Ri-dley et al., 2012) and to the refractive index of dust (Sinyuket al., 2003).
For all long-term simulations in this study the standardmodel is modified to include dust aerosol only. Emission, drydeposition and wet scavenging of dust are all simulated as inthe standard model (Fairlie et al., 2007). Dust emission inGEOS-Chem is based upon the DEAD dust scheme (Zenderet al., 2003), making use of the GOCART source function(Ginoux et al., 2001) as proposed by Fairlie et al. (2007),based on evaluation of dust concentrations over the US. Min-eral dust mass is transported in four different sized bins (0.1–1.0, 1.0–1.8, 1.8–3.0 and 3.0–6.0 µm), the smallest of whichis partitioned into four bins (0.10–0.18, 0.18–0.30, 0.30–0.65and 0.65–1.00 µm) when deriving optical properties, owing
Atmos. Chem. Phys., 14, 5735–5747, 2014 www.atmos-chem-phys.net/14/5735/2014/

D. A. Ridley et al.: What controls the recent changes in African mineral dust aerosol across the Atlantic? 5737
to the strong size dependence of extinction for sub-micronaerosol (Ridley et al., 2012).
The GEOS-Chem model has been coupled with RRTMG,a rapid radiative transfer model (Mlawer et al., 1997), toquantify the DRE of aerosol species online (Heald et al.,2013). In this version of the model, we calculate the short-wave (SW) and long-wave (LW) radiative effects for dustbased on fluxes at 30 wavelengths under both clear-sky andall-sky conditions.
2.2 Dust emission scheme updates
Two significant changes have been made to the dust schemerelative to the standard GEOS-Chem implementation de-scribed thus far. First, we account for sub-grid variabilityin surface winds and, second, we alter the dust source func-tion to depend on geomorphology and include dynamic veg-etation cover. We represent the sub-grid winds as a Weibullprobability density function based on statistics derived fromthe native resolution of the assimilated meteorology windfields (0.5◦ × 0.67◦). We previously showed that accountingfor the sub-grid wind distribution reduces the resolution de-pendence of dust emissions in the model by better represent-ing situations when the mean wind speed is approaching thethreshold for dust activation (Ridley et al., 2013).
To investigate the role of vegetation changes in modulat-ing dust emissions, we must simulate dust emission fromsemi-arid regions. Compared to more recent dust source re-gion studies (Ginoux et al., 2012; Koven and Fung, 2008;Schepanski et al., 2007), the original GOCART dust sourcederived from TOMS aerosol index is likely to underesti-mate emissions from regions that are not permanent deserts.Satellite-derived dust source data sets often disagree as a re-sult of cloud cover and temporal sampling, particularly in re-gions where emissions show distinct diurnal patterns, suchas West Africa (Schepanski et al., 2012). For this reasonwe implement the geomorphic dust source map of Kovenet al. (2008), derived from surface roughness and level-ness properties, and let vegetation cover attenuate the sourcestrength. We follow (Kim et al., 2013) in deriving the bare-ness fraction from AVHRR Normalized Difference Vegeta-tion Index (NDVI) for each year (values < 0.15 are consid-ered bare and a potential dust source) to modulate dust emis-sions from 1982 to 2008. The updated dust scheme performsat least as well as the original dust scheme when assessedrelative to MODIS and AERONET observations over Africaand the mid-Atlantic (see Supplement). The relatively smallchange in agreement even with substantial changes in sourceregions suggests that the wind fields dominate the agreementwith observations, both in terms of the surface wind strengthleading to emissions and the large-scale transport across thecontinent. Achieving a higher-fidelity dust simulation there-fore appears to rely more on an improvement of the windfields than the characterization of the surface properties.
2.3 Regional direct radiative effect (DRE)
Using the updated GEOS-Chem model coupled withRRTMG, we quantify the change in radiative flux at thesurface resulting from the changes in dust aerosol over the27 year period (for all-sky conditions). Figure 1 shows the av-erage seasonal DRE of dust over Africa and the Atlantic forthe entire 27 year period, both at surface and TOA. We definethe radiative effect as an increase in down-welling flux andtherefore a negative value constitutes a cooling of the Earth.Globally, the all-sky radiative effect from African dust is−0.18 Wm−2 at TOA, accounting for 46 % of the total globaldust DRE. Across the mid-Atlantic (5–20◦ N, 10–50◦ W), themean annual radiative effect of dust is−3.2± 0.7 Wm−2 atTOA and −7.4± 1.5 Wm−2 at the surface, including LWcontributions of+0.4± 0.1 Wm−2 and +3.1± 0.7 Wm−2,respectively. This region covers less than 5 % of the Earth’ssurface but accounts for almost 20 % of the global dust radia-tive effect at TOA and at the surface. The difference betweenthe TOA and surface radiative effects indicates the heating ofthe atmosphere owing to dust. When the dust outflow is overthe Sahara (primarily during summer) the airborne dust canbe darker than the surface beneath, decreasing the amount ofoutgoing radiation and producing a warming effect at TOA.
While direct comparison with previous estimates is diffi-cult owing to different time periods, conditions and modelassumptions, we find the spatial distribution and magnitudeof the DRE is broadly consistent with previous modelingstudies (Evan and Mukhopadhyay, 2010; Miller et al., 2004;Yoshioka et al., 2007) and observations (Haywood et al.,2003; Highwood, 2003; Hsu et al., 2000). Aerosol size, shaperefractive index, altitude, and surface albedo all contribute tothe uncertainty in the radiative effect and lead to considerablediversity between models and observations. Several studieshave attempted to quantify the key factors leading to uncer-tainty in radiative effect and radiative forcing (e.g., Balkanskiet al., 2007; Evan et al., 2009; Miller et al., 2004; Myhre etal., 2013; Stier et al., 2013) but this is certainly an area re-quiring further research to better constrain model estimates.
3 Observations
The primary long-term observations used in this study is adust AOD (DAOD) data set over the mid-Atlantic for theperiod 1982–2008, derived from satellite observations byEvan and Mukhopadhyay (2010). Satellite retrievals of AODfrom the AVHRR PATMOS-x data set, an extended andrecalibrated retrieval using the moderate resolution imag-ing spectro-radiometer (MODIS) observations (Zhao et al.,2008), are converted to DAOD using MODIS AOD andfine mode fraction products and with NCEP-NCAR reanal-ysis surface winds, following Kaufman et al. (2005a). The1◦
× 1◦ DAOD product is only available over the ocean, be-tween 0–30◦ N and 65–10◦ W, therefore we select three 7.5◦
www.atmos-chem-phys.net/14/5735/2014/ Atmos. Chem. Phys., 14, 5735–5747, 2014

5738 D. A. Ridley et al.: What controls the recent changes in African mineral dust aerosol across the Atlantic?
Figure 1. Spatial maps of the average direct radiative effect of dust (DRE) at the surface and TOA are shown for both winter (left) andsummer (right) seasons. The average is based on model output over the period 1982–2008. The inset shows the seasonal average DRE overthe region 0–30◦ N, 50◦ W–15◦ E. The thin black line indicates the trend over the simulation period.
Figure 2. The areas of interest for this study. The large black rect-angle encloses the region covered by the satellite-derived monthlydust AOD data set and the blue rectangles (labelled with roman nu-merals) are the regions within which model and satellite DAOD arecompared. These are referred to as (I) coastal Africa, (II) Caribbean,(III) South America and (IV) North Atlantic. Numbered circles in-dicate the location of AERONET sites used and the star shows thelocation of the surface concentration measurements in Barbados.
by 10◦ regions representing outflow towards North Amer-ica, the Caribbean, and South America in which to comparemodel and observations (see Fig. 2). We also consider a 10◦
by 17.5◦ region off the coast of Africa to assess outflow closeto source; initially this region was divided into two, northand south of Cape Verde; however, the results are largely thesame when considering the region as a whole.
Trade-wind aerosol has been measured almost continu-ally at the Ragged Point site on the east coast of Barba-dos since 1965 (Prospero and Lamb, 2003). During condi-
tions when the on shore wind exceeds 1 ms−1 (∼ 95 % of thetime), (Savoie et al., 1989) air is drawn through a filter upona 20m tower, the soluble material is removed and the remain-ing mineral residue (representing the dust aerosol) weighedafter ashing. We use monthly average dust concentrations forthe period 1982–2008 to evaluate long-range dust transportfrom Africa.
Rather than the standard Boreal seasonal classification(DJF and JJA), we follow the work of Ben-Ami et al.(2012) who show that African dust seasonality can be bro-ken down into three seasons: December to March, April tomid-October, and October through November. Throughoutthis study we compare the modeled and observed DAOD andsurface concentrations either annually or for two seasons,referred to as winter (DJFM) and summer (AMJJAS). TheOctober–November period is characterized by low dust emis-sion and is not shown separately, but included in the annualaverages.
4 Dust transport and trends
4.1 Trends and variability in dustiness and the radiativeeffect
To assess how the dust loading over the mid-Atlantic haschanged since the 1980s and whether the model captures theobserved variability, we consider the DAOD derived fromsatellite data in regions close to source and further down-wind. Figure 3 shows the seasonally averaged DAOD for themodel and derived from satellite observations in each of the
Atmos. Chem. Phys., 14, 5735–5747, 2014 www.atmos-chem-phys.net/14/5735/2014/

D. A. Ridley et al.: What controls the recent changes in African mineral dust aerosol across the Atlantic? 5739
outflow regions indicated in Fig. 2 from 1982 to 2008. TheDAOD is displayed as an anomaly from the climatologicalaverage for the winter and summer seasons.
Close to source, the model captures 50–80 % of the vari-ance in the observations in the winter months (monthly cor-relations between 0.69 and 0.90). The seasonal correlationwith the observations is fair during summer (r = 0.64) withthe model struggling to represent the variability and magni-tude of emissions between June and August; likely a conse-quence of underestimated AOD at the Bodélé Depression andacross the Sahel during summer (see Supplement Fig. S2).Downwind, correlations between model and observationsrange between 0.46 and 0.65 (excluding the North Amer-ica region during winter when very little dust is present).The poorer agreement downwind indicates that model trans-port and removal contribute to the discrepancy with observa-tions. The variability in the model DAOD is generally lessthan observed, owing to lower model DAOD; however, thenormalized variability (normalizing using the climatologicalmean DAOD) is comparable between model and observa-tions. Previous studies have shown that the model removesdust aerosol too rapidly relative to the observations via bothwet and dry deposition (Generoso et al., 2008; Ridley et al.,2012) and this is likely to be contributing to the reduced vari-ability in DAOD at these downwind regions. Overall we seethe best agreement for seasons with the highest dust loading,that is, winter at the South America region and summer inthe Caribbean and North Atlantic regions.
Significant decreasing trends in observed DAOD (> 95 %confidence) are apparent for all seasons and locations, exceptwinter in the North America and Caribbean regions whennortherly transport of dust is limited and highly variable, re-spectively. There are striking similarities between the trendsin observed and modeled DAOD, with the model showingsignificant trends at the same locations and during the sameseasons. Annually, observed and modeled DAOD decreasesbetween−0.035 (12 %) and−0.032 (17 %) per decade closeto source and−0.021 (12 %) to -0.016 (28 %) per decadedownwind, respectively. Previous studies show similar de-creases of total AOD per decade in the mid-Atlantic basedon the AVHRR PATMOS-x data set (Mishchenko and Ge-ogdzhayev, 2007; Zhao et al., 2008) and SeaWIFs observa-tions from 1997 to 2010 (Hsu et al., 2012). This suggeststhat the trends in total AOD over the mid-Atlantic are drivenalmost entirely by the changes in dust aerosol.
There is significant interannual variability in dust con-centration during the spring months (March–May), a periodresponsible for transport of dust to South America basedon both satellite and in situ measurements (Kaufman et al.,2005a; Prospero et al., 1981, 2014). Isolating the spring sea-son we find significant trends in DAOD of−0.02 per decadefor both observations and model in the South America re-gion (r = 0.70) indicating that the decreasing dust trends arepresent and captured by the model in this season as well asthe broader seasons considered in this study.
Figure 3. Seasonal DAOD anomalies derived from AVHRRPATMOS-x (black) and from the model (red) are displayed for fourregions (roman numerals relate to the locations shown in Fig. 2).Trend lines are plotted as solid lines and the trend and one stan-dard deviation uncertainty shown in each panel for the observations(OBS) and the model (MOD). The correlation (R) between modeland observations is shown in brackets.
Figure 4 shows the anomaly in monthly dust concentra-tion measured at Barbados alongside the modeled surfaceconcentration anomaly. We find that seasonal correlation be-tween the dust surface concentration measured at Barbadosand simulated concentrations show similar agreement as theDAOD comparisons, withr = 0.69 andr = 0.44 during win-ter and summer, respectively. Surface concentration of dustmeasured at Barbados has been decreasing during the sum-mer (−3.5± 1.3 µgm−3 per decade); this trend is reproducedby the model (−5.2± 1.1 µgm−3 per decade). No trend ispresent in either observations or model during the winter,consistent with the Caribbean regional DAOD (Fig. 3).
The consistency and geographical extent of the downwardtrends in both the modeled and observed dust suggest thatthe model simulates the process driving these trends in dustthroughout this multi-decadal period.
The inset charts within Fig. 1 show the modeled time se-ries of seasonal DRE for the region 0–30◦ N, 50◦ W–15◦ E,
www.atmos-chem-phys.net/14/5735/2014/ Atmos. Chem. Phys., 14, 5735–5747, 2014

5740 D. A. Ridley et al.: What controls the recent changes in African mineral dust aerosol across the Atlantic?
Figure 4. Seasonally averaged surface concentrations anomaliesfrom Barbados observations (black) and from the model (red) areshown for winter and summer. Trend lines are plotted as solid linesand the slope with one standard deviation indicated for each sea-son. The correlation (R) between the observations and model datais shown on each panel.
encompassing the mid-Atlantic and West Africa. We noteconsiderable variability in the radiative effect from year toyear, primarily in winter when emissions are more sporadicin the model, confirmed by observations (Ben-Ami et al.,2012). The regional surface cooling varies by up to 8 Wm−2
in winter and 6 Wm−2 in summer, and a more modest 4 and1.5 Wm−2 at TOA in winter and summer, respectively. Annu-ally, warming trends of+1.27 and+0.37 Wm−2 per decadeare observed at the surface and TOA, respectively, over theregion including both the ocean and land from 1982 to 2008.The seasonal trends are similar in magnitude, with signifi-cant trends in both winter and summer (95 % confidence).Similar trends in DRE exist over both ocean and land at thesurface (+1.23 and+1.32 Wm−2 per decade, respectively)but at TOA there are marked differences between the trendsover ocean and land (+0.60 and+0.00 Wm−2 per decade),as a result of surface albedo and the high concentration oflarge dust particles (increasing the LW warming effect). Theregional trend constitutes an increase in DRE over the pastthree decades that is comparable in magnitude to the re-gional increase in CO2 forcing since 1750 (Stocker et al.,2013). This illustrates the strong radiative perturbation po-tential of dust: climatic changes that are affecting the emis-sion of African dust are likely to have significant impactsupon the radiative balance over the Atlantic that are not ac-counted for in the traditional radiative forcing metric.
4.2 Attribution of variability and trends in dustiness
To attribute the driving forces behind the interannual vari-ability in African dust near source and downwind, four27 year simulations are performed with interannual variabil-ity removed from surface winds, transport, precipitation, orvegetation. This method also removes any interannual trendin that variable. The interannual variability of 10 m surfacewinds are removed by using the 1988 10 m winds for everyyear, 1988 being an “average” year in terms of dust emissions(NB this only affects the 10 m winds used for calculation ofdust emission flux, not for other processes in the model). This
Figure 5. Attribution of the interannual variability in dust is shownfor the four regions in Fig. 2. The approximate fraction of thevariability owing to 10 m surface winds (blue), transport (orange)and precipitation (gray) is displayed for winter (left) and summer(right).
process is repeated by holding vegetation constant at 1988values or by fixing precipitation and 3-D winds (other than10 m surface winds) to 1988 values for the 27 year period.Here we are investigating only the direct impact of vegeta-tion cover reducing available surface for dust emission anddo not take into account secondary effects such as stillingof winds from surface roughness changes, discussed furtherbelow.
The variability caused by each of the three factors isinferred by assessing the reduction in the variance of theDAOD in each region relative to the original model. Thismethod does not account for confounding factors result-ing from the variables being dependent (i.e., the large-scalewinds and 10 m wind strength will be well correlated) but re-sults are found to be robust (within±5 %) when removing
Atmos. Chem. Phys., 14, 5735–5747, 2014 www.atmos-chem-phys.net/14/5735/2014/

D. A. Ridley et al.: What controls the recent changes in African mineral dust aerosol across the Atlantic? 5741
the interannual variability using data from 2004 instead of1988. Figure 5 shows the apportionment of variability inDAOD to the three factors tested for summer and winter. Inthe coastal Africa and South America regions the 10 m sur-face wind accounts for at least two-thirds of the variabilityin both seasons. In North America and the Caribbean surfacewinds account for one-third to half of the variability in theDAOD, interannual variability in large-scale transport beingmore important during the winter. Precipitation accounts foronly a small fraction of the variability in DAOD in all regionsduring the winter, but becomes more important downwindduring the summer. Within the model, precipitation primar-ily affects the variability in dust loading over the Atlantic viawet scavenging rather than by increasing soil wetness andsuppressing emission. Removing the interannual variabilityof vegetation has a negligible impact on the variability inDAOD suggesting that the changes in dust source region re-sulting from vegetation cover changes are unimportant forthe observed variability in dust since the 1980s.
The same four simulations described above are used to as-sess the cause of trends in DAOD. Figure 6 shows the re-sulting annual DAOD anomaly in each region for each sim-ulation. In the coastal Africa region, it is clear that remov-ing interannual variability in 10 m winds almost entirely re-moves the trend in DAOD. Further downwind the interannualvariability in other meteorology contributes between 30 and50 % of the trend; however, the surface wind at source re-mains the dominant driver. This indicates that, in the model,the trend in dustiness results from a stilling of surface windsover source regions and combines with changes in transportand/or an increase in removal downwind, more so in the morenortherly outflow regions. We find that the direct effect ofvegetation changes on dust emission in the model has a neg-ligible impact on the trend in dustiness over the Atlantic. Inall locations except North America the trend with no inter-annual variability in 10 m surface winds is significantly dif-ferent to the baseline run (> 95 % confidence), whereas thetrend with no interannual variability in vegetation is indis-tinguishable from the baseline. Although surface winds havebeen inferred as the likely cause of the observed reduction inAtlantic dust loading (Chin et al., 2014), this is the first timethat the link has been quantified.
While we do find a positive correlation between the NAOindex and the DAOD in the outflow regions during winter, wefind no significant trend in the NAO index between 1982 and2008, therefore the question remains as to what is driving thestilling of winds over Africa. We have shown that changes invegetation are unlikely to directly influence dust emission viachanges in source regions but they may still indirectly affectthe emissions via stilling of the winds. If vegetation changesare driving the decrease in winds responsible for the changein dustiness over the Atlantic then any increase in vegetationcover is expected to be coincident with the decrease in winds(Bichet et al., 2012).
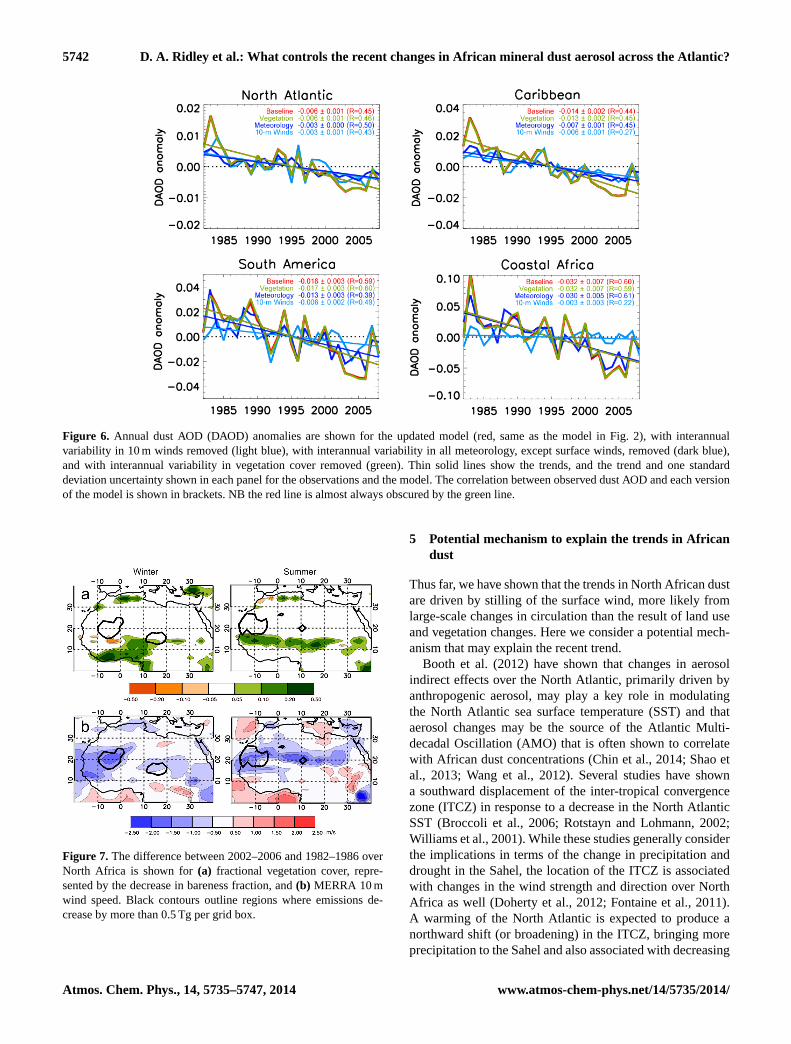
Figure 7a shows the change in the bareness fraction (a re-duction in bareness fraction indicating a “greening”) derivedfrom AVHRR between 1982–1986 and 2002–2006 for sum-mer and winter. Figure 7b shows the change in surface windsapparent in the MERRA reanalysis and the regions in whichdust emissions decrease by more than 0.5 Tg per grid box.For both seasons we see that there is a limited amount ofoverlap between the location in which vegetation increasesand the surface winds (and therefore emissions) decrease.This is not necessarily in disagreement with the conclusionsof Cowie et al. (2013); there the focus is on local Sahelianemissions only. Events when dust is transported from else-where are excluded and account for between 50 and 90 % ofall dust events at the Sahel weather stations (S. Cowie, per-sonal communication, 2013). The reanalysis winds are un-likely to capture the full extent of wind stilling from surfaceroughness changes and therefore may be missing trends inwinds and dust emission in the Sahel. However, the modelstill captures the decreasing trends in dust over the Atlantic,suggesting that emissions from regions other than the Sahelare controlling the trends in Atlantic DAOD. The lack ofspatial correspondence between the greening and the windstilling indicate that vegetation is not driving the change inmodel surface winds though perhaps both are the result of alarger-scale climatic change. Indeed, shifts in dustiness overthe past 20 000 years also suggest that large changes in dustemission in the past are primarily driven by changes in large-scale winds, rather than vegetation and precipitation changes(McGee et al., 2010).
4.3 Reliability of surface wind trends in reanalyses
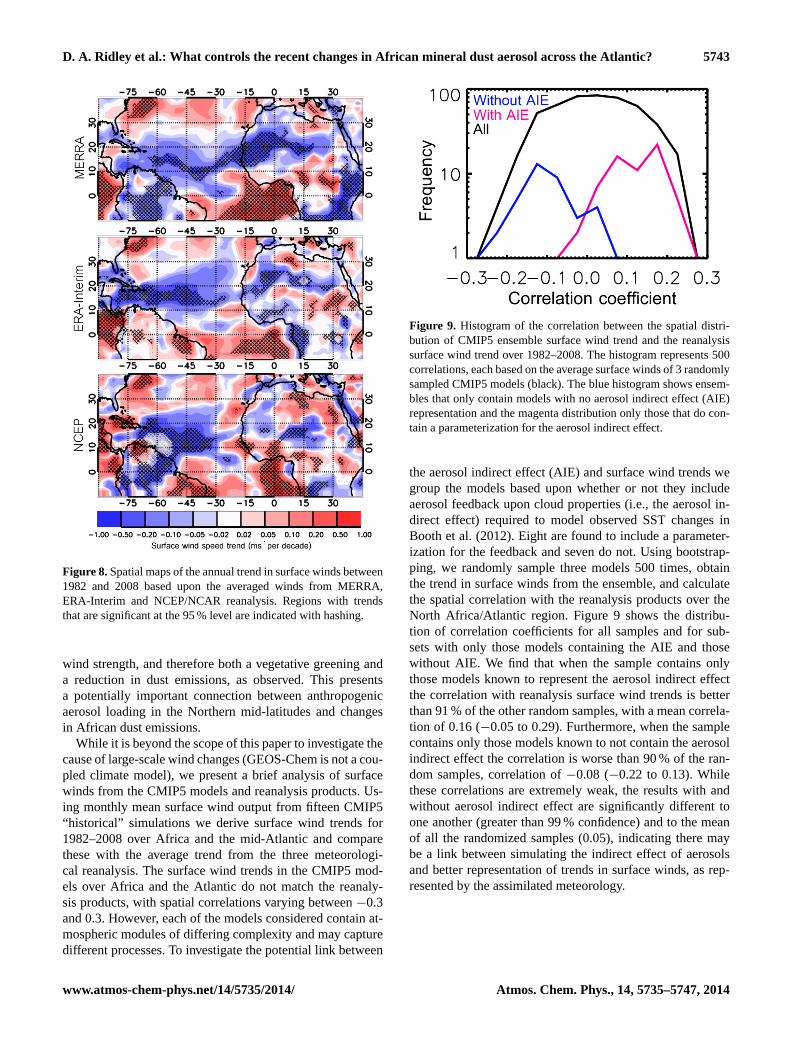
To assess the reliability of the MERRA surface winds inthis relatively observation-poor region, we compare annualMERRA reanalysis wind trends between 1982 and 2008 withthose from the NCEP and ERA-Interim reanalysis products.Figure 8 shows the annual trend in winds for the three re-analyses over the region of interest with trends that are sig-nificant at the 95 % confidence level indicated. The broadtrends across the Atlantic are consistent between the reanal-yses, primarily a significant stilling between 10–20◦ N anda strengthening of the wind in the Gulf of Guinea and southof the equator. Across North Africa, all three reanalyses showsignificant stilling in regions associated with dust production.The trends in MERRA are generally stronger than observedin the two other reanalysis products; however, it has beenshown that NCEP and ERA-Interim reanalysis wind trendsare weaker than trends in surface observations (Cowie et al.,2013; Vautard et al., 2010) and therefore the stronger trend inMERRA is expected to agree better with the surface observa-tions. There is some disagreement in the latitude and strengthof the stilling over the dust source regions but the consistencyin the significant stilling trends between reanalysis productsbolsters confidence in the MERRA surface wind trends.
www.atmos-chem-phys.net/14/5735/2014/ Atmos. Chem. Phys., 14, 5735–5747, 2014
5742 D. A. Ridley et al.: What controls the recent changes in African mineral dust aerosol across the Atlantic?
Figure 6. Annual dust AOD (DAOD) anomalies are shown for the updated model (red, same as the model in Fig. 2), with interannualvariability in 10 m winds removed (light blue), with interannual variability in all meteorology, except surface winds, removed (dark blue),and with interannual variability in vegetation cover removed (green). Thin solid lines show the trends, and the trend and one standarddeviation uncertainty shown in each panel for the observations and the model. The correlation between observed dust AOD and each versionof the model is shown in brackets. NB the red line is almost always obscured by the green line.
Figure 7. The difference between 2002–2006 and 1982–1986 overNorth Africa is shown for(a) fractional vegetation cover, repre-sented by the decrease in bareness fraction, and(b) MERRA 10 mwind speed. Black contours outline regions where emissions de-crease by more than 0.5 Tg per grid box.
5 Potential mechanism to explain the trends in Africandust
Thus far, we have shown that the trends in North African dustare driven by stilling of the surface wind, more likely fromlarge-scale changes in circulation than the result of land useand vegetation changes. Here we consider a potential mech-anism that may explain the recent trend.
Booth et al. (2012) have shown that changes in aerosolindirect effects over the North Atlantic, primarily driven byanthropogenic aerosol, may play a key role in modulatingthe North Atlantic sea surface temperature (SST) and thataerosol changes may be the source of the Atlantic Multi-decadal Oscillation (AMO) that is often shown to correlatewith African dust concentrations (Chin et al., 2014; Shao etal., 2013; Wang et al., 2012). Several studies have showna southward displacement of the inter-tropical convergencezone (ITCZ) in response to a decrease in the North AtlanticSST (Broccoli et al., 2006; Rotstayn and Lohmann, 2002;Williams et al., 2001). While these studies generally considerthe implications in terms of the change in precipitation anddrought in the Sahel, the location of the ITCZ is associatedwith changes in the wind strength and direction over NorthAfrica as well (Doherty et al., 2012; Fontaine et al., 2011).A warming of the North Atlantic is expected to produce anorthward shift (or broadening) in the ITCZ, bringing moreprecipitation to the Sahel and also associated with decreasing
Atmos. Chem. Phys., 14, 5735–5747, 2014 www.atmos-chem-phys.net/14/5735/2014/
D. A. Ridley et al.: What controls the recent changes in African mineral dust aerosol across the Atlantic? 5743
Figure 8.Spatial maps of the annual trend in surface winds between1982 and 2008 based upon the averaged winds from MERRA,ERA-Interim and NCEP/NCAR reanalysis. Regions with trendsthat are significant at the 95 % level are indicated with hashing.
wind strength, and therefore both a vegetative greening anda reduction in dust emissions, as observed. This presentsa potentially important connection between anthropogenicaerosol loading in the Northern mid-latitudes and changesin African dust emissions.
While it is beyond the scope of this paper to investigate thecause of large-scale wind changes (GEOS-Chem is not a cou-pled climate model), we present a brief analysis of surfacewinds from the CMIP5 models and reanalysis products. Us-ing monthly mean surface wind output from fifteen CMIP5“historical” simulations we derive surface wind trends for1982–2008 over Africa and the mid-Atlantic and comparethese with the average trend from the three meteorologi-cal reanalysis. The surface wind trends in the CMIP5 mod-els over Africa and the Atlantic do not match the reanaly-sis products, with spatial correlations varying between−0.3and 0.3. However, each of the models considered contain at-mospheric modules of differing complexity and may capturedifferent processes. To investigate the potential link between
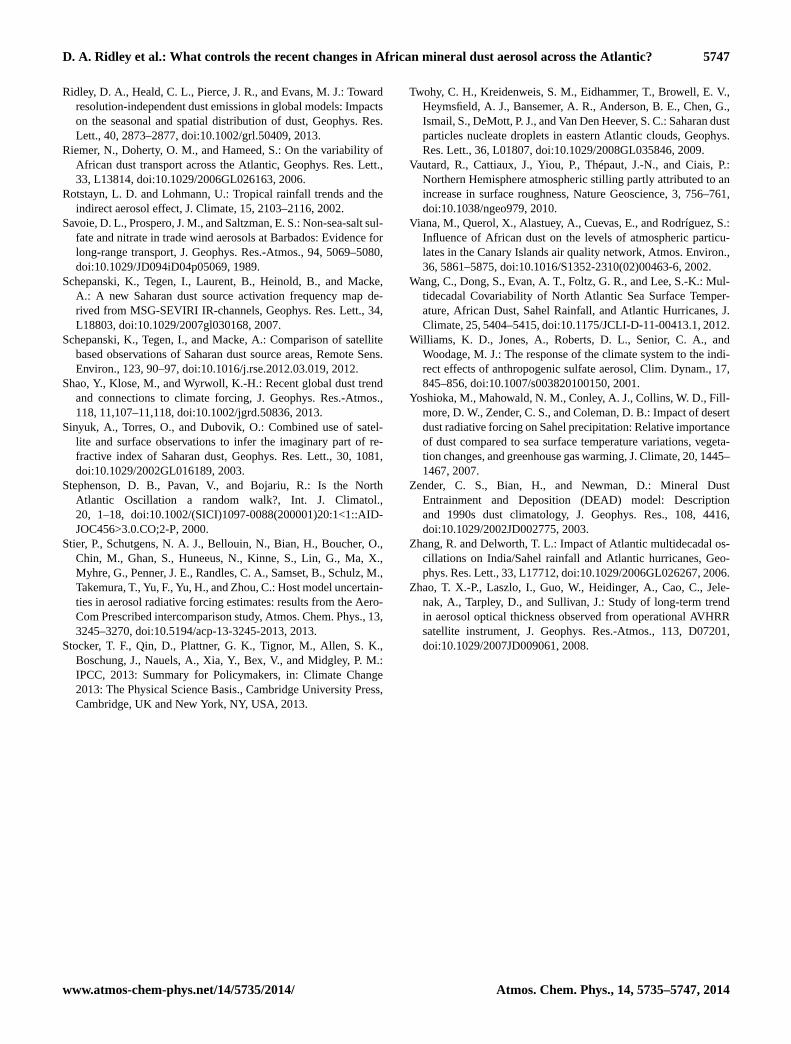
Figure 9. Histogram of the correlation between the spatial distri-bution of CMIP5 ensemble surface wind trend and the reanalysissurface wind trend over 1982–2008. The histogram represents 500correlations, each based on the average surface winds of 3 randomlysampled CMIP5 models (black). The blue histogram shows ensem-bles that only contain models with no aerosol indirect effect (AIE)representation and the magenta distribution only those that do con-tain a parameterization for the aerosol indirect effect.
the aerosol indirect effect (AIE) and surface wind trends wegroup the models based upon whether or not they includeaerosol feedback upon cloud properties (i.e., the aerosol in-direct effect) required to model observed SST changes inBooth et al. (2012). Eight are found to include a parameter-ization for the feedback and seven do not. Using bootstrap-ping, we randomly sample three models 500 times, obtainthe trend in surface winds from the ensemble, and calculatethe spatial correlation with the reanalysis products over theNorth Africa/Atlantic region. Figure 9 shows the distribu-tion of correlation coefficients for all samples and for sub-sets with only those models containing the AIE and thosewithout AIE. We find that when the sample contains onlythose models known to represent the aerosol indirect effectthe correlation with reanalysis surface wind trends is betterthan 91 % of the other random samples, with a mean correla-tion of 0.16 (−0.05 to 0.29). Furthermore, when the samplecontains only those models known to not contain the aerosolindirect effect the correlation is worse than 90 % of the ran-dom samples, correlation of−0.08 (−0.22 to 0.13). Whilethese correlations are extremely weak, the results with andwithout aerosol indirect effect are significantly different toone another (greater than 99 % confidence) and to the meanof all the randomized samples (0.05), indicating there maybe a link between simulating the indirect effect of aerosolsand better representation of trends in surface winds, as rep-resented by the assimilated meteorology.
www.atmos-chem-phys.net/14/5735/2014/ Atmos. Chem. Phys., 14, 5735–5747, 2014

5744 D. A. Ridley et al.: What controls the recent changes in African mineral dust aerosol across the Atlantic?
6 Summary and conclusions
This research and previous studies have found that satelliteobservations across the Atlantic show a significant down-ward trend in DAOD since the 1980s, persisting throughboth summer and winter seasons. We also observe decreas-ing trends in surface dust concentrations at Barbados duringsummer. The GEOS-Chem model captures the broad trendsin dustiness over the Atlantic and we estimate that they leadto an annually averaged warming of+1.23 Wm−2 per decadeover the surface of the mid-Atlantic since 1982. We findthat the trends are driven primarily by a reduction in sur-face winds in regions that are unlikely to be associated withvegetation cover changes. This suggests that the change inAfrican dust emissions since the 1980s cannot be directly at-tributed to vegetation changes (including anthropogenic landuse changes in the Sahel region); therefore, a vegetation feed-back on dust emission via surface roughness may be valid ona local scale but appears less important for dust sources re-sponsible for the trends in dustiness over the Atlantic.
Along with isolating the cause of the trends, the driversof interannual variability in dustiness over the Atlantic havebeen investigated. We find that the interannual variability isprimarily controlled by changes in surface winds over Africa,accounting for 60–80 % of the interannual variability in dustAOD off the coast of Africa. Further downwind, transportand (to a lesser extent) precipitation contribute 30–60 % and0–15 % to the variability in dust AOD, respectively, depend-ing upon season. Using the model we find that the variabilityin dust leads to substantial interannual changes in surface in-solation of over 6.0 Wm−2, averaged over the mid-Atlantic.These are likely to have a significant impact on heating ofthe ocean mixed layer therefore and tropical storm gene-sis (Evan et al., 2009), highlighting the importance of well-characterized variability in dust emissions in climate models.
Finally, we propose a potential connection between an-thropogenic aerosol loading over the North Atlantic and thetrends in dustiness in the mid-Atlantic. The link between theaerosol direct and indirect effects over the North Atlanticand changes in the SST and ITCZ are well established. Wetake this one step further and suggest that the wind still-ing over Africa, reducing dustiness over the Atlantic in re-cent decades, may be a further consequence of these interac-tions. The CMIP5 models do not capture the wind trend overAfrica, preventing conclusive evidence of this mechanism.However, the CMIP5 models that include aerosol indirect ef-fects show significantly better agreement with surface windtrends in reanalysis meteorology than those without indirectaerosol effects, offering evidence that the aerosol indirect ef-fect may be critical to the prediction of surface winds trendsover Africa. This is a potentially important anthropogenicaerosol driver upon “natural” dust aerosol via climate, ca-pable of amplifying the climate sensitivity to anthropogenicaerosol in the Atlantic, which is not captured by the aerosolradiative forcing metric.
The Supplement related to this article is available onlineat doi:10.5194/acp-14-5735-2014-supplement.
Acknowledgements.The authors would like to thank the principalinvestigators and their staff for establishing and maintaining theAERONET sites used, C. Koven for the dust source function,A. Evan for the satellite-derived dust AOD product, J. Marshamand S. Cowie for providing data on the dust source classification,Kerstin Schepanski for supplying dust activation data derivedfrom SEVIRI, and O. Doherty for discussions and data relatingto the ITCZ. This work was funded by the MIT Charles E. ReedFaculty Initiative Fund and the National Science Foundation(AGS-1238109). The Barbados research is funded with grantsto J. M. Prospero from the National Science Foundation AGS-0962256 and NASA NNX12AP45G.
Edited by: Y. Balkanski
References
Alexander, B., Park, R. J., Jacob, D. J., Li, Q. B., Yan-tosca, R. M., Savarino, J., Lee, C. C. W., and Thiemens,M. H.: Sulfate formation in sea-salt aerosols: Constraintsfrom oxygen isotopes, J. Geophys. Res.-Atmos., 110, D10307,doi:10.1029/2004JD005659, 2005.
Ben-Ami, Y., Koren, I., Altaratz, O., Kostinski, A., and Lehahn,Y.: Discernible rhythm in the spatio/temporal distributionsof transatlantic dust, Atmos. Chem. Phys., 12, 2253–2262,doi:10.5194/acp-12-2253-2012, 2012.
Balkanski, Y., Schulz, M., Claquin, T., and Guibert, S.: Reevalua-tion of Mineral aerosol radiative forcings suggests a better agree-ment with satellite and AERONET data, Atmos. Chem. Phys., 7,81–95, doi:10.5194/acp-7-81-2007, 2007.
Bichet, A., Wild, M., Folini, D., and Schär, C.: Causes for decadalvariations of wind speed over land: Sensitivity studies with aglobal climate model: Decadal variations of land wind speed,Geophys. Res. Lett., 39, L11701, doi:10.1029/2012GL051685,2012.
Booth, B. B. B., Dunstone, N. J., Halloran, P. R., Andrews, T., andBellouin, N.: Aerosols implicated as a prime driver of twentieth-century North Atlantic climate variability, Nature, 484, 228–232,doi:10.1038/nature10946, 2012.
Broccoli, A. J., Dahl, K. A., and Stouffer, R. J.: Response of theITCZ to Northern Hemisphere cooling, Geophys. Res. Lett., 33,L01702, doi:10.1029/2005GL024546, 2006.
Chiang, J. C. H. and Friedman, A. R.: Extratropical Cooling, Inter-hemispheric Thermal Gradients, and Tropical Climate Change,Annu. Rev. Earth Pl. Sc., 40, 383–412, doi:10.1146/annurev-earth-042711-105545, 2012.
Chiapello, I.: Understanding the long-term variability of Africandust transport across the Atlantic as recorded in both Barba-dos surface concentrations and large-scale Total Ozone MappingSpectrometer (TOMS) optical thickness, J. Geophys. Res., 110,D18S10, doi:10.1029/2004JD005132, 2005.
Chiapello, I. and Moulin, C.: TOMS and METEOSAT satelliterecords of the variability of Saharan dust transport over the At-
Atmos. Chem. Phys., 14, 5735–5747, 2014 www.atmos-chem-phys.net/14/5735/2014/

D. A. Ridley et al.: What controls the recent changes in African mineral dust aerosol across the Atlantic? 5745
lantic during the last two decades (1979–1997), Geophys. Res.Lett., 29, 17-1–17-4, doi:10.1029/2001GL013767, 2002.
Chin, M., Diehl, T., Tan, Q., Prospero, J. M., Kahn, R. A., Remer, L.A., Yu, H., Sayer, A. M., Bian, H., Geogdzhayev, I. V., Holben, B.N., Howell, S. G., Huebert, B. J., Hsu, N. C., Kim, D., Kucsera, T.L., Levy, R. C., Mishchenko, M. I., Pan, X., Quinn, P. K., Schus-ter, G. L., Streets, D. G., Strode, S. A., Torres, O., and Zhao,X.-P.: Multi-decadal aerosol variations from 1980 to 2009: a per-spective from observations and a global model, Atmos. Chem.Phys., 14, 3657–3690, doi:10.5194/acp-14-3657-2014, 2014.
Cowie, S. M., Knippertz, P., and Marsham, J. H.: Are vegetation-related roughness changes the cause of the recent decrease in dustemission from the Sahel?, Geophys. Res. Lett., 40, 1868–1872,doi:10.1002/grl.50273, 2013.
Doherty, O. M., Riemer, N., and Hameed, S.: Control of Saharanmineral dust transport to Barbados in winter by the Intertrop-ical Convergence Zone over West Africa: Winter dust in Bar-bados and the ITCZ, J. Geophys. Res.-Atmos., 117, D19117,doi:10.1029/2012JD017767, 2012.
Drury, E., Jacob, D. J., Spurr, R. J., Wang, J., Shinozuka, Y., Ander-son, B. E., Clarke, A. D., Dibb, J., McNaughton, C., and Weber,R.: Synthesis of satellite (MODIS), aircraft (ICARTT), and sur-face (IMPROVE, EPA-AQS, AERONET) aerosol observationsover eastern North America to improve MODIS aerosol retrievalsand constrain surface aerosol concentrations and sources, J. Geo-phys. Res., 115, D14204, doi:10.1029/2007JD009573, 2010.
Dunion, J. P. and Velden, C. S.: The Impact of the Saharan Air Layeron Atlantic Tropical Cyclone Activity, B. Am. Meteorol. Soc.,85, 353–365, doi:10.1175/BAMS-85-3-353, 2004.
Evan, A. T. and Mukhopadhyay, S.: African Dust over the North-ern Tropical Atlantic: 1955–2008, J. Appl. Meteorol. Clim., 49,2213–2229, doi:10.1175/2010JAMC2485.1, 2010.
Evan, A. T., Dunion, J., Foley, J. A., Heidinger, A. K., and Velden,C. S.: New evidence for a relationship between Atlantic tropicalcyclone activity and African dust outbreaks, Geophys. Res. Lett.,33, L19813, doi:10.1029/2006GL026408, 2006.
Evan, A. T., Vimont, D. J., Heidinger, A. K., Kossin, J. P., andBennartz, R.: The Role of Aerosols in the Evolution of Tropi-cal North Atlantic Ocean Temperature Anomalies, Science, 324,778–781, doi:10.1126/science.1167404, 2009.
Evan, A. T., Foltz, G. R., Zhang, D., and Vimont, D. J.: Influence ofAfrican dust on ocean–atmosphere variability in the tropical At-lantic, Nature Geoscience, 4, 762–765, doi:10.1038/ngeo1276,2011.
Fairlie, T. D., Jacob, D. J., and Park, R. J.: The impact of transpacifictransport of mineral dust in the United States, Atmos. Environ.,41, 1251–1266, doi:10.1016/j.atmosenv.2006.09.048, 2007.
Fontaine, B., Roucou, P., Gaetani, M., and Marteau, R.: Recentchanges in precipitation, ITCZ convection and northern tropicalcirculation over North Africa (1979–2007), Int. J. Climatol., 31,633–648, doi:10.1002/joc.2108, 2011.
Generoso, S., Bey, I., Labonne, M., and Bréon, F.-M.: Aerosol ver-tical distribution in dust outflow over the Atlantic: Comparisonsbetween GEOS-Chem and Cloud-Aerosol Lidar and InfraredPathfinder Satellite Observation (CALIPSO), J. Geophys. Res.,113, D24209, doi:10.1029/2008JD010154, 2008.
Ginoux, P., Chin, M., Tegen, I., Prospero, J. M., Holben, B.,Dubovik, O., and Lin, S. J.: Sources and distributions of dust
aerosols simulated with the GOCART model, J. Geophys. Res.-Atmos., 106, 20255–20273, 2001.
Ginoux, P., Prospero, J. M., Torres, O., and Chin, M.: Long-termsimulation of global dust distribution with the GOCART model:correlation with North Atlantic Oscillation, Environ. Modell.Softw., 19, 113–128, 2004.
Ginoux, P., Prospero, J. M., Gill, T. E., Hsu, N. C., andZhao, M.: Global-scale attribution of anthropogenic and nat-ural dust sources and their emission rates based on MODISDeep Blue aerosol products, Rev. Geophys., 50, RG3005,doi:10.1029/2012RG000388, 2012.
Haywood, J., Francis, P., Dubovik, O., Glew, M., and Holben, B.:Comparison of aerosol size distributions, radiative properties,and optical depths determined by aircraft observations and Sunphotometers during SAFARI 2000, J. Geophys. Res., 108, 8471,doi:10.1029/2002JD002250, 2003.
Heald, C. L., Ridley, D. A., Kroll, J. H., Barrett, S. R. H., Cady-Pereira, K. E., Alvarado, M. J., and Holmes, C. D.: Beyond di-rect radiative forcing: the case for characterizing the direct radia-tive effect of aerosols, Atmos. Chem. Phys. Discuss., 13, 32925–32961, doi:10.5194/acpd-13-32925-2013, 2013.
Henze, D. K., Seinfeld, J. H., Ng, N. L., Kroll, J. H., Fu, T.-M.,Jacob, D. J., and Heald, C. L.: Global modeling of secondaryorganic aerosol formation from aromatic hydrocarbons: high-vs. low-yield pathways, Atmos. Chem. Phys., 8, 2405–2420,doi:10.5194/acp-8-2405-2008, 2008.
Highwood, E. J.: Radiative properties and direct effect of Saharandust measured by the C-130 aircraft during Saharan Dust Exper-iment (SHADE): 2. Terrestrial spectrum, J. Geophys. Res., 108,8578, doi:10.1029/2002JD002552, 2003.
Hsu, N. C., Herman, J. R., and Weaver, C.: Determinationof radiative forcing of Saharan dust using combined TOMSand ERBE data, J. Geophys. Res.-Atmos., 105, 20649–20661,doi:10.1029/2000JD900150, 2000.
Hsu, N. C., Gautam, R., Sayer, A. M., Bettenhausen, C., Li, C.,Jeong, M. J., Tsay, S.-C., and Holben, B. N.: Global and regionaltrends of aerosol optical depth over land and ocean using SeaW-iFS measurements from 1997 to 2010, Atmos. Chem. Phys., 12,8037–8053, doi:10.5194/acp-12-8037-2012, 2012.
Huneeus, N., Schulz, M., Balkanski, Y., Griesfeller, J., Prospero,J., Kinne, S., Bauer, S., Boucher, O., Chin, M., Dentener, F.,Diehl, T., Easter, R., Fillmore, D., Ghan, S., Ginoux, P., Grini,A., Horowitz, L., Koch, D., Krol, M. C., Landing, W., Liu, X.,Mahowald, N., Miller, R., Morcrette, J.-J., Myhre, G., Penner,J., Perlwitz, J., Stier, P., Takemura, T., and Zender, C. S.: Globaldust model intercomparison in AeroCom phase I, Atmos. Chem.Phys., 11, 7781–7816, doi:10.5194/acp-11-7781-2011, 2011.
Hurrell, J. W.: Decadal Trends in the North Atlantic Oscillation: Re-gional Temperatures and Precipitation, Science, 269, 676–679,doi:10.1126/science.269.5224.676, 1995.
Hwang, Y.-T., Frierson, D. M. W., and Kang, S. M.: Anthropogenicsulfate aerosol and the southward shift of tropical precipitationin the late 20th century, Geophys. Res. Lett., 40, 2845–2850,doi:10.1002/grl.50502, 2013.
Jaeglé, L., Quinn, P. K., Bates, T. S., Alexander, B., and Lin, J.-T.:Global distribution of sea salt aerosols: new constraints from insitu and remote sensing observations, Atmos. Chem. Phys., 11,3137–3157, doi:10.5194/acp-11-3137-2011, 2011.
www.atmos-chem-phys.net/14/5735/2014/ Atmos. Chem. Phys., 14, 5735–5747, 2014

5746 D. A. Ridley et al.: What controls the recent changes in African mineral dust aerosol across the Atlantic?
Kaufman, Y. J., Koren, I., Remer, L. A., Tanre, D., Ginoux, P., andFan, S.: Dust transport and deposition observed from the Terra-Moderate Resolution Imaging Spectroradiometer ( MODIS)spacecraft over the Atlantic ocean, J. Geophys. Res.-Atmos.,110, D10S12, doi:10.1029/2003JD004436, 2005a.
Kaufman, Y., Koren, I., Remer, L. A., Rosenfeld, D., and Rudich,Y.: The effect of smoke, dust, and pollution aerosol on shallowcloud development over the Atlantic Ocean, P. Natl. Acad. Sci.USA, 102, 11207–11212, 2005b.
Kim, D., Chin, M., Bian, H., Tan, Q., Brown, M. E., Zheng, T.,You, R., Diehl, T., Ginoux, P., and Kucsera, T.: The effect ofthe dynamic surface bareness on dust source function, emis-sion, and distribution, J. Geophys. Res.-Atmos., 118, 871–886,doi:10.1029/2012JD017907, 2013.
Koepke, P., Hess, M., Schult, I., and Shettle, E.: Global AerosolData Set, Report 243, Max Planck Institute for Meteorology,Hamburg, ISSN 0937-1060, 1997.
Koren, I., Feingold, G., and Remer, L. A.: The invigoration of deepconvective clouds over the Atlantic: aerosol effect, meteorol-ogy or retrieval artifact?, Atmos. Chem. Phys., 10, 8855–8872,doi:10.5194/acp-10-8855-2010, 2010.
Koven, C. D. and Fung, I.: Identifying global dust source areas us-ing high-resolution land surface form, J. Geophys. Res.-Atmos.,113, D22204, doi:10.1029/2008jd010195, 2008.
Liao, H., Henze, D. K., Seinfeld, J. H., Wu, S. L., and Mickley, L. J.:Biogenic secondary organic aerosol over the United States: Com-parison of climatological simulations with observations, J. Geo-phys. Res.-Atmos., 112, D06201, doi:10.1029/2006JD007813,2007.
Mahowald, N. M., Engelstaedter, S., Luo, C., Sealy, A., Artaxo, P.,Benitez-Nelson, C., Bonnet, S., Chen, Y., Chuang, P. Y., Cohen,D. D., and others: Atmospheric Iron Deposition: Global Distri-bution, Variability, and Human Perturbations, Annu. Rev. Mater.Sci., 1, 245–278, 2009.
Martin, R. V., Jacob, D. J., Yantosca, R. M., Chin, M., and Ginoux,P.: Global and regional decreases in tropospheric oxidants fromphotochemical effects of aerosols, J. Geophys. Res.-Atmos., 108,4097, doi:10.1029/2002JD002622, 2003.
Mbourou, G. N., Bertrand, J. J., and Nicholson, S. E.: The diurnaland seasonal cycles of wind-borne dust over Africa north of theequator, J. Appl. Meteorol., 36, 868–882, 1997.
McGee, D., Broecker, W. S., and Winckler, G.: Gustiness: Thedriver of glacial dustiness?, Quaternary Sci. Rev., 29, 2340–2350, doi:10.1016/j.quascirev.2010.06.009, 2010.
McGee, D., deMenocal, P. B., Winckler, G., Stuut, J. B. W.,and Bradtmiller, L. I.: The magnitude, timing and abrupt-ness of changes in North African dust deposition over thelast 20,000 yr, Earth Planet. Sc. Lett., 371–372, 163–176,doi:10.1016/j.epsl.2013.03.054, 2013.
Miller, R. L., Tegen, I., and Perlwitz, J.: Surface radiative forcingby soil dust aerosols and the hydrologic cycle, J. Geophys. Res.,109, D04S03, doi:10.1029/2003JD004085, 2004.
Mishchenko, M. I. and Geogdzhayev, I. V.: Satellite remote sensingreveals regional tropospheric aerosol trends, Opt. Express, 15,7423–7438, 2007.
Mlawer, E. J., Taubman, S. J., Brown, P. D., Iacono, M. J., andClough, S. A.: Radiative transfer for inhomogeneous atmo-spheres: RRTM, a validated correlated-k model for the longwave,
J. Geophys. Res., 102, 16663–16682, doi:10.1029/97JD00237,1997.
Moulin, C., Lambert, C. E., Dulac, F., and Dayan, U.: Control ofatmospheric export of dust from North Africa by the North At-lantic oscillation, Nature, 387, 691–694, 1997.
Mulitza, S., Heslop, D., Pittauerova, D., Fischer, H. W., Meyer, I.,Stuut, J.-B., Zabel, M., Mollenhauer, G., Collins, J. A., Kuhnert,H., and Schulz, M.: Increase in African dust flux at the onset ofcommercial agriculture in the Sahel region, Nature, 466, 226–228, doi:10.1038/nature09213, 2010.
Myhre, G., Samset, B. H., Schulz, M., Balkanski, Y., Bauer, S.,Berntsen, T. K., Bian, H., Bellouin, N., Chin, M., Diehl, T.,Easter, R. C., Feichter, J., Ghan, S. J., Hauglustaine, D., Iversen,T., Kinne, S., Kirkevåg, A., Lamarque, J.-F., Lin, G., Liu, X.,Lund, M. T., Luo, G., Ma, X., van Noije, T., Penner, J. E., Rasch,P. J., Ruiz, A., Seland, Ø., Skeie, R. B., Stier, P., Takemura, T.,Tsigaridis, K., Wang, P., Wang, Z., Xu, L., Yu, H., Yu, F., Yoon,J.-H., Zhang, K., Zhang, H., and Zhou, C.: Radiative forcing ofthe direct aerosol effect from AeroCom Phase II simulations,Atmos. Chem. Phys., 13, 1853–1877, doi:10.5194/acp-13-1853-2013, 2013.
Nakamae, K. and Shiotani, M.: Interannual variability in Saharandust over the North Atlantic Ocean and its relation to meteoro-logical fields during northern winter, Atmos. Res., 122, 336–346,doi:10.1016/j.atmosres.2012.09.012, 2013.
Olsson, L., Eklundh, L., and Ardö, J.: A recent greening of theSahel–trends, patterns and potential causes, J. Arid Environ., 63,556–566, doi:10.1016/j.jaridenv.2005.03.008, 2005.
Park, R. J., Jacob, D. J., Chin, M., and Martin, R. V.: Sourcesof carbonaceous aerosols over the United States and implica-tions for natural visibility, J. Geophys. Res.-Atmos., 108, 4355,doi:10.1029/2002JD003190, 2003.
Park, R. J., Jacob, D. J., Field, B. D., Yantosca, R. M., andChin, M.: Natural and transboundary pollution influences onsulfate-nitrate-ammonium aerosols in the United States: Im-plications for policy, J. Geophys. Res.-Atmos., 109, D15204,doi:10.1029/2003JD004473, 2004.
Prospero, J. M.: Long-term measurements of the transport ofAfrican mineral dust to the southeastern United States: Impli-cations for regional air quality, J. Geophys. Res.-Atmos., 104,15917–15927, 1999.
Prospero, J. M., Glaccum, R. A., and Nees, R. T.: AtmosphericTransport of Soil Dust from Africa to South-America, Nature,289, 570–572, 1981.
Prospero, J. M., Ginoux, P., Torres, O., Nicholson, S. E., and Gill,T. E.: Environmental characterization of global sources of at-mospheric soil dust identified with the Nimbus 7 Total OzoneMapping Spectrometer (TOMS) absorbing aerosol product, Rev.Geophys., 40, 1002, doi:10.1029/2000rg000095, 2002.
Prospero, J. M. and Lamb, P. J.: African droughts and dust transportto the Caribbean: Climate change implications, Science, 302,1024–1027, 2003.
Prospero, J. M., Collard, F. X., Molinié, J., and Jeannot, A.: Char-acterizing the annual cycle of African dust transport to theCaribbean Basin and South America and its impact on air qualityand the environment, Global Biogeochem. Cy., submitted, 2014.
Ridley, D. A., Heald, C. L., and Ford, B.: North African dust exportand deposition: A satellite and model perspective, J. Geophys.Res., 117, D02202, doi:10.1029/2011JD016794, 2012.
Atmos. Chem. Phys., 14, 5735–5747, 2014 www.atmos-chem-phys.net/14/5735/2014/
D. A. Ridley et al.: What controls the recent changes in African mineral dust aerosol across the Atlantic? 5747
Ridley, D. A., Heald, C. L., Pierce, J. R., and Evans, M. J.: Towardresolution-independent dust emissions in global models: Impactson the seasonal and spatial distribution of dust, Geophys. Res.Lett., 40, 2873–2877, doi:10.1002/grl.50409, 2013.
Riemer, N., Doherty, O. M., and Hameed, S.: On the variability ofAfrican dust transport across the Atlantic, Geophys. Res. Lett.,33, L13814, doi:10.1029/2006GL026163, 2006.
Rotstayn, L. D. and Lohmann, U.: Tropical rainfall trends and theindirect aerosol effect, J. Climate, 15, 2103–2116, 2002.
Savoie, D. L., Prospero, J. M., and Saltzman, E. S.: Non-sea-salt sul-fate and nitrate in trade wind aerosols at Barbados: Evidence forlong-range transport, J. Geophys. Res.-Atmos., 94, 5069–5080,doi:10.1029/JD094iD04p05069, 1989.
Schepanski, K., Tegen, I., Laurent, B., Heinold, B., and Macke,A.: A new Saharan dust source activation frequency map de-rived from MSG-SEVIRI IR-channels, Geophys. Res. Lett., 34,L18803, doi:10.1029/2007gl030168, 2007.
Schepanski, K., Tegen, I., and Macke, A.: Comparison of satellitebased observations of Saharan dust source areas, Remote Sens.Environ., 123, 90–97, doi:10.1016/j.rse.2012.03.019, 2012.
Shao, Y., Klose, M., and Wyrwoll, K.-H.: Recent global dust trendand connections to climate forcing, J. Geophys. Res.-Atmos.,118, 11,107–11,118, doi:10.1002/jgrd.50836, 2013.
Sinyuk, A., Torres, O., and Dubovik, O.: Combined use of satel-lite and surface observations to infer the imaginary part of re-fractive index of Saharan dust, Geophys. Res. Lett., 30, 1081,doi:10.1029/2002GL016189, 2003.
Stephenson, D. B., Pavan, V., and Bojariu, R.: Is the NorthAtlantic Oscillation a random walk?, Int. J. Climatol.,20, 1–18, doi:10.1002/(SICI)1097-0088(200001)20:1<1::AID-JOC456>3.0.CO;2-P, 2000.
Stier, P., Schutgens, N. A. J., Bellouin, N., Bian, H., Boucher, O.,Chin, M., Ghan, S., Huneeus, N., Kinne, S., Lin, G., Ma, X.,Myhre, G., Penner, J. E., Randles, C. A., Samset, B., Schulz, M.,Takemura, T., Yu, F., Yu, H., and Zhou, C.: Host model uncertain-ties in aerosol radiative forcing estimates: results from the Aero-Com Prescribed intercomparison study, Atmos. Chem. Phys., 13,3245–3270, doi:10.5194/acp-13-3245-2013, 2013.
Stocker, T. F., Qin, D., Plattner, G. K., Tignor, M., Allen, S. K.,Boschung, J., Nauels, A., Xia, Y., Bex, V., and Midgley, P. M.:IPCC, 2013: Summary for Policymakers, in: Climate Change2013: The Physical Science Basis., Cambridge University Press,Cambridge, UK and New York, NY, USA, 2013.
Twohy, C. H., Kreidenweis, S. M., Eidhammer, T., Browell, E. V.,Heymsfield, A. J., Bansemer, A. R., Anderson, B. E., Chen, G.,Ismail, S., DeMott, P. J., and Van Den Heever, S. C.: Saharan dustparticles nucleate droplets in eastern Atlantic clouds, Geophys.Res. Lett., 36, L01807, doi:10.1029/2008GL035846, 2009.
Vautard, R., Cattiaux, J., Yiou, P., Thépaut, J.-N., and Ciais, P.:Northern Hemisphere atmospheric stilling partly attributed to anincrease in surface roughness, Nature Geoscience, 3, 756–761,doi:10.1038/ngeo979, 2010.
Viana, M., Querol, X., Alastuey, A., Cuevas, E., and Rodríguez, S.:Influence of African dust on the levels of atmospheric particu-lates in the Canary Islands air quality network, Atmos. Environ.,36, 5861–5875, doi:10.1016/S1352-2310(02)00463-6, 2002.
Wang, C., Dong, S., Evan, A. T., Foltz, G. R., and Lee, S.-K.: Mul-tidecadal Covariability of North Atlantic Sea Surface Temper-ature, African Dust, Sahel Rainfall, and Atlantic Hurricanes, J.Climate, 25, 5404–5415, doi:10.1175/JCLI-D-11-00413.1, 2012.
Williams, K. D., Jones, A., Roberts, D. L., Senior, C. A., andWoodage, M. J.: The response of the climate system to the indi-rect effects of anthropogenic sulfate aerosol, Clim. Dynam., 17,845–856, doi:10.1007/s003820100150, 2001.
Yoshioka, M., Mahowald, N. M., Conley, A. J., Collins, W. D., Fill-more, D. W., Zender, C. S., and Coleman, D. B.: Impact of desertdust radiative forcing on Sahel precipitation: Relative importanceof dust compared to sea surface temperature variations, vegeta-tion changes, and greenhouse gas warming, J. Climate, 20, 1445–1467, 2007.
Zender, C. S., Bian, H., and Newman, D.: Mineral DustEntrainment and Deposition (DEAD) model: Descriptionand 1990s dust climatology, J. Geophys. Res., 108, 4416,doi:10.1029/2002JD002775, 2003.
Zhang, R. and Delworth, T. L.: Impact of Atlantic multidecadal os-cillations on India/Sahel rainfall and Atlantic hurricanes, Geo-phys. Res. Lett., 33, L17712, doi:10.1029/2006GL026267, 2006.
Zhao, T. X.-P., Laszlo, I., Guo, W., Heidinger, A., Cao, C., Jele-nak, A., Tarpley, D., and Sullivan, J.: Study of long-term trendin aerosol optical thickness observed from operational AVHRRsatellite instrument, J. Geophys. Res.-Atmos., 113, D07201,doi:10.1029/2007JD009061, 2008.
www.atmos-chem-phys.net/14/5735/2014/ Atmos. Chem. Phys., 14, 5735–5747, 2014