Embed Size (px)
Citation preview

Atmos. Chem. Phys., 11, 1879–1893, 2011www.atmos-chem-phys.net/11/1879/2011/doi:10.5194/acp-11-1879-2011© Author(s) 2011. CC Attribution 3.0 License.
AtmosphericChemistry
and Physics
Radiative impact of mineral dust on monsoon precipitationvariability over West Africa
C. Zhao, X. Liu, L. Ruby Leung, and S. Hagos
Atmospheric Science and Global Change Division, Pacific Northwest National Laboratory, Richland, WA, USA
Received: 4 November 2010 – Published in Atmos. Chem. Phys. Discuss.: 10 November 2010Revised: 17 February 2011 – Accepted: 22 February 2011 – Published: 1 March 2011
Abstract. The radiative forcing of dust and its impacton precipitation over the West Africa monsoon (WAM)region is simulated using a coupled meteorology andaerosol/chemistry model (WRF-Chem). During the mon-soon season, dust is a dominant contributor to aerosoloptical depth (AOD) over West Africa. In the controlsimulation, on 24-h domain average, dust has a cool-ing effect (−6.11 W m−2) at the surface, a warming effect(6.94 W m−2) in the atmosphere, and a relatively small TOAforcing (0.83 W m−2). Dust modifies the surface energy bud-get and atmospheric diabatic heating. As a result, atmo-spheric stability is increased in the daytime and reduced inthe nighttime, leading to a reduction of late afternoon pre-cipitation by up to 0.14 mm/h (25%) and an increase of noc-turnal and early morning precipitation by up to 0.04 mm/h(45%) over the WAM region. Dust-induced reduction ofdiurnal precipitation variation improves the simulated diur-nal cycle of precipitation when compared to measurements.However, daily precipitation is only changed by a relativelysmall amount (−0.17 mm/day or−4%). The dust-inducedchange of WAM precipitation is not sensitive to interannualmonsoon variability. On the other hand, sensitivity simula-tions with weaker to stronger absorbing dust (in order to rep-resent the uncertainty in dust solar absorptivity) show that,at the lower atmosphere, dust longwave warming effect inthe nighttime surpasses its shortwave cooling effect in thedaytime; this leads to a less stable atmosphere associatedwith more convective precipitation in the nighttime. As aresult, the dust-induced change of daily WAM precipitationvaries from a significant reduction of−0.52 mm/day (−12%,weaker absorbing dust) to a small increase of 0.03 mm/day(1%, stronger absorbing dust). This variation originates fromthe competition between dust impact on daytime and night-
Correspondence to:C. Zhao([email protected])
time precipitation, which depends on dust shortwave absorp-tion. Dust reduces the diurnal variation of precipitation re-gardless of its absorptivity, but more reduction is associatedwith stronger absorbing dust.
1 Introduction
The West African Monsoon (WAM) system is a major cli-mate system and an important component of the regionalhydrological cycle on which the livelihood of a large andgrowing population over Sahel depends [Sultan et al., 2005].The WAM regulates the seasonal cycle of dry and wet sea-sons in response to annual cycle in solar forcing. The Saharadesert over West Africa is the largest source of mineral dustaerosol in the world (e.g., Woodward, 2001; Prospero et al.,2003). The Saharan dust emitted during the WAM seasoncan significantly affect the WAM development and precipita-tion, because it interacts with both shortwave (SW) and long-wave (LW) radiation, and modifies the radiative and physicalproperties of clouds (e.g., Miller et al., 2004; Yoshioka et al.,2007; Konare et al., 2008; Lau et al., 2009; Kim et al., 2010).
Recognizing that dust may significantly modify climate atthe regional scale (e.g., Miller et al., 2004; Yoshioka et al.,2007; Konare et al., 2008; Solmon et al., 2008; Lau et al.,2009; Kim et al., 2010), many efforts have begun in recentyears to study the Saharan dust effect on WAM precipita-tion. Most of these studies used general circulation models(GCMs) and have provided important understanding of thefundamental processes associated with dust effect on precip-itation during the WAM season. Miller et al. (2004) foundthat precipitation may be enhanced locally over the Sahel inresponse to the radiative forcing of dust, while Yoshioka etal. (2007) showed that rainfall is reduced over the Sahel dueto weakly absorbing dust. Yoshioka et al. (2007) estimatedthat∼30% of the observed precipitation reduction in the Sa-hel from the 1950s to 1980s may be attributed to dust. Lau
Published by Copernicus Publications on behalf of the European Geosciences Union.

1880 C. Zhao et al.: Radiative impact of mineral dust on monsoon precipitation variability
et al. (2009) and Kim et al. (2010) showed that dust radia-tive effect may strengthen the WAM, which is manifested ina northward shift of the West Africa precipitation over land.Kim et al. (2010) also found that dust may affect not onlythe total amount but also diurnal cycle of WAM precipita-tion. Solmon et al. (2008), using a regional climate model,showed that the WAM precipitation response to dust radia-tive forcing is highly sensitive to the absorption properties ofdust.
Although all previous studies mentioned above are con-sistent with enhanced precipitation due to dust-induced at-mospheric heating and reduced precipitation due to dust-induced surface cooling, they differ in concluding whetherthe presence of dust is more likely to increase or decreaseprecipitation over the Sahelian region. The main reason forthe contrasting conclusions lies in the difficulty in estimat-ing the radiative effect of mineral dust. Dust radiative forc-ing occurs in both the LW and SW spectral bands and at thesurface and within the atmosphere, which can trigger differ-ent warming/cooling effects that lead to opposite climatic re-sponses. The difficulty also comes from large uncertainty inthe absorbing properties of dust (Balkanski et al., 2007; Mc-Connell et al., 2010). A full understanding of how variousforcings of dust jointly alter the surface energy budget andatmospheric dynamics as well as both the total amount anddiurnal cycle of precipitation remains challenging.
Previous studies of dust radiative impact on WAM precip-itation were mostly performed using prescribed dust aerosolin GCMs. Because of the coarse horizontal resolution (typi-cally 2◦
×2.5◦), WAM precipitation and its diurnal variationare not well simulated (e.g., Lau et al., 2009; Kim et al.,2010). Therefore, dust effects on the regional hydrologi-cal cycle in the WAM region could be misrepresented dueto biases in the simulated precipitation. This study uses aregional model (Weather Research and Forecasting (WRF)model (Skamarock et al., 2008)) with relatively high hori-zontal resolution of 36×36 km2 and online dust calculation(Zhao et al., 2010) to understand the response of WAM pre-cipitation to Saharan dust. The WRF model has been usedin many regional air quality and climate studies (e.g., Fastet al., 2006 and 2009; Leung et al., 2006; Wang and Liu,2009; Qian et al., 2009; Zhang et al., 2009) including someover Africa (e.g., Vigaud et al., 2009; Zhao et al., 2010). Inthis study, we use a version of WRF (WRF-Chem) that sim-ulates trace gases and particulates simultaneously with themeteorological fields (Grell et al., 2005). Zhao et al. (2010)investigated the sensitivity of the WRF-Chem simulated dustradiative forcings to dust emission and aerosol schemes andevaluated the model results using data from the African Mon-soon Multidisciplinary Analysis (AMMA) campaign, whichis a major international campaign in 2006 to improve un-derstanding of climate, monsoon, and hydrological cycle ofWest Africa and the impacts from aerosols (Redelsperger etal., 2006).
Following a similar modeling approach as Zhao etal. (2010), the objective of this study is to further understandthe various radiative forcings of Saharan dust and how theyjointly affect the surface energy budget, atmospheric diabaticheating, and hydrological cycle at a regional scale. Buildingon our recent study (Zhao et al., 2010), this work (1) ex-amines both SW and LW radiative forcings of Saharan dustduring the wet monsoon season over West Africa, and (2)investigates the potential dust effects on precipitation duringthe WAM season. The paper is organized as follows. Sec-tions 2 and 3 detail the WRF-Chem model and the measure-ments used in this study. The SW and LW radiative forcingsof Saharan dust and their impact on the WAM precipitationare analyzed in Sect. 4. The paper concludes in Sect. 5.
2 Model description
WRF-Chem, a version of WRF (Skamarock et al., 2008),simulates trace gases and particulates simultaneously withthe meteorological fields (Grell et al., 2005). Early versionsof WRF-Chem include the RADM2 (Regional Acid Depo-sition Model 2) photochemical mechanism (Stockwell et al.,1990) and the MADE/SORGAM (Modal Aerosol DynamicsModel for Europe (MADE) and Secondary Organic AerosolModel (SORGAM)) aerosol model (Ackermann et al., 1998;Schell et al., 2001). The CBM-Z (Carbon Bond Mecha-nism) photochemical mechanism (Zaveri and Peters, 1999)and MOSAIC (Model for Simulating Aerosol Interactionsand Chemistry) aerosol model (Zaveri et al., 2008) were laterimplemented by Fast et al. (2006) into WRF-Chem, togetherwith more complex treatments of aerosol radiative proper-ties and photolysis rates. MADE/SORGAM in WRF-Chemuses the modal approach with three modes (Aitken, accumu-lation, and coarse modes, assuming a log-normal distributionwithin each mode) to represent the aerosol size distribution,while MOSAIC uses a sectional approach where aerosol sizedistribution is divided into discrete size bins defined by theirlower and upper dry particle diameters. Generally, a modalapproach is less accurate because of its assumption of log-normal size distribution and limited number of modes, but itis less computationally demanding than a sectional approachthat uses more bins. Each size mode (or bin) is assumed in-ternally mixed so that all particles within a size mode (or bin)are assumed to have the same chemical composition. In bothMADE/SORGAM and MOSAIC, aerosols are composed ofsulfate, nitrate, ammonium, organic matters (OM), black car-bon (BC), water, sea salt and mineral dust. Aerosol opticalproperties such as extinction, single-scattering albedo, andasymmetry factor for scattering are computed as a functionof wavelength and three-dimensional position. Each chemi-cal constituent of the aerosol is associated with a complex re-fraction index calculated by volume averaging for each sizebin (or mode), and Mie theory is used to compute the ex-tinction efficiency (Qe) and the scattering efficiency (Qs). To
Atmos. Chem. Phys., 11, 1879–1893, 2011 www.atmos-chem-phys.net/11/1879/2011/

C. Zhao et al.: Radiative impact of mineral dust on monsoon precipitation variability 1881
efficiently compute Qe and Qs, WRF-Chem uses a method-ology described by Ghan et al. (2001) that performs the fullMie calculations once first to obtain a table of seven sets ofChebyshev expansion coefficients, and later the full Mie cal-culations are skipped and Qe and Qs are calculated using bi-linear interpolation over the Chebyshev coefficients storedin the table. A detailed description of the computation ofaerosol optical properties in WRF-Chem can be found in Fastet al. (2006) and Barnard et al. (2010).
The WRF-Chem model was used by Zhao et al. (2010)to investigate the sensitivities in simulating the size dis-tributions and optical properties of Saharan dust to emit-ted dust size distributions and aerosol treatments during thedry season (from January to February) of 2006. In thisstudy, the model domain covers West Africa (36.15◦ W–40.15◦ E, 9.2◦ S–37.0◦ N) using 200×150 grid points at36 km horizontal resolution centering at Niamey (Niger)(2.0◦ E, 13.6◦ N), and 35 vertical layers with model top pres-sure at 10 hPa. The simulation is conducted from 15 April2006 to 30 September 2006. Only the results from 1 May2006 to 30 September 2006 (referred as the simulation pe-riod hereafter) are used in the analysis to minimize the im-pact from the chemical initial conditions, and the simu-lated results from 170×120 interior points (28.9◦ W–32.9◦ E,5.0◦ S–32.1◦ N) are used to minimize the influence from thelateral boundary conditions. We use the same model con-figuration as Zhao et al. (2010), except that the rapid radia-tive transfer model (RRTMG) (Mlawer et al., 1997; Iaconoet al., 2000) for both SW and LW radiation is updated to in-clude aerosol direct radiative effect. The MADE/SORGAMaerosol module with the GOCART dust emission scheme isused in this study as described in Zhao et al. (2010). Zhaoet al. (2010) found∼10% difference in the dust SW radia-tive forcing between the modal and sectional approaches inWRF-Chem over West Africa during the dry season. In ourcontrol simulation, we use the same SW refractive index(1.53+0.003i) of dust as Zhao et al. (2010). Modeling sen-sitivity of dust radiative impact on precipitation to dust SWabsorptivity will be discussed in section 4.2. The Lin cloudmicrophysics scheme is used as described by Gustafson etal. (2007) to account for cloud chemistry, aerosol wet deposi-tion, and aerosol indirect radiative effect. The Grell convec-tive scheme is used to allow the feedback from the param-eterized convective cloud to the radiation schemes. In theavailable version (v3.1.1) of WRF-Chem during this study,the Lin cloud microphysics and Grell convective schemesare the only parameterizations that are coupled with the fullaerosol processes (including cloud chemistry and wet depo-sition) and cloud radiative feedback (WRF-Chem user guidefrom http://ruc.noaa.gov/wrf/WG11/Usersguide.pdf).
Large-scale meteorological fields are assimilated with lat-eral boundary and initial conditions from the NCEP/NCARGlobal reanalysis data, which also provide the prescribedsea surface temperature (SST) for the simulations. Chem-ical lateral boundary conditions are from the default pro-
files in WRF-Chem, which are based on the averages ofmid-latitude aircraft profiles from several field studies overthe eastern Pacific Ocean (McKeen et al., 2002). Anthro-pogenic emissions are obtained from the Reanalysis of theTROpospheric (RETRO) chemical composition inventories(http://retro.enes.org/index.shtml). Biomass burning emis-sions are obtained from the Global Fire Emissions Database,Version 2 (GFEDv2.1) with 8-day temporal resolution (Ran-derson et al., 2005) and vertically distributed following theinjection heights suggested by Dentener et al. (2006) forthe Aerosol InterComparison project (AeroCom), because ofinsufficient information to perform plume rise calculationsover West Africa.
3 Observations
3.1 AERONET surface observation network
The Aerosol Robotic Network (AERONET) (Holben et al.,1998) with ∼100 identical globally distributed sun- andsky-scanning ground-based automated radiometers providesmeasurements of aerosol optical properties throughout theworld (Dubovik and King, 2000; Dubovik et al., 2002).In this study, AERONET measured aerosol optical depth(AOD) at 675 nm and 440 nm from six sites over West Africaare used to derive the AOD at 550 nm (using the Angstromexponent) for comparison with model results. These six sitesare Banizoumbou (13◦ N, 2◦ E) and IER Cinzana (13◦ N,5◦ W) over the Sahel region, Djougou (9◦ N, 1◦ E) and Ilorin(8◦ N, 4◦ E) over the southern biomass burning region, Dakar(14◦ N, 16◦ W) at the coast, and Capo Verde (16◦ N, 22◦ W)on a near-coast island. All of the retrievals of AOD arequality level 2, and the uncertainty of AOD measurementsis about±0.01 (Holben et al., 2001).
3.2 MODIS
The Moderate Resolution Imaging Spectroradiometer(MODIS) instruments on board the NASA Terra and Aquaplatforms are uniquely designed with wide spectral range,high spatial resolution, and near daily global coverage to ob-serve and monitor the Earth changes including troposphericaerosols (Kaufman et al., 1997). The standard MODISaerosol product does not retrieve aerosol information overbright surfaces (e.g., Sahara desert) due to a strong surfacespectral contribution in the visible range (Kaufman et al.,1997). However, recently, a new algorithm, called the “DeepBlue algorithm” (Hsu et al., 2006), has been integrated withthe existing MODIS algorithm to retrieve AOD even overbright surfaces. Therefore, in this study, the retrieved “deepblue” AOD from MODIS (Collection 5) (only available overland and from the MODIS on Aqua so far) (Levy et al., 2007;Remer et al., 2005) is used over land, while the standardretrieved AOD is used over the ocean. The MODIS on boardthe Aqua platform passes over the equator at∼13:30 LT
www.atmos-chem-phys.net/11/1879/2011/ Atmos. Chem. Phys., 11, 1879–1893, 2011
1882 C. Zhao et al.: Radiative impact of mineral dust on monsoon precipitation variability
40
1
2
3
4
Figure 1 Averaged AOD at 550 nm over West Africa from the retrievals of MODIS on 5
Aqua and MISR on Terra, the measurements of six AERONET sites, and the 6
corresponding WRF-Chem simulated AOD of total aerosols and dust-only. The MODIS 7
retrievals are a combination of the standard (over ocean) and “Deep Blue” (over land) 8
products. AERONET measurements and model results are sampled between 10am-14pm. 9
The blank areas in the plots are due to missing data. The six filled circles represent the 10
averaged AOD at the six AERONET sites. The region in the black box is defined as the 11
West Africa Monsoon (WAM) region. 12
13
14
15
16
17
18
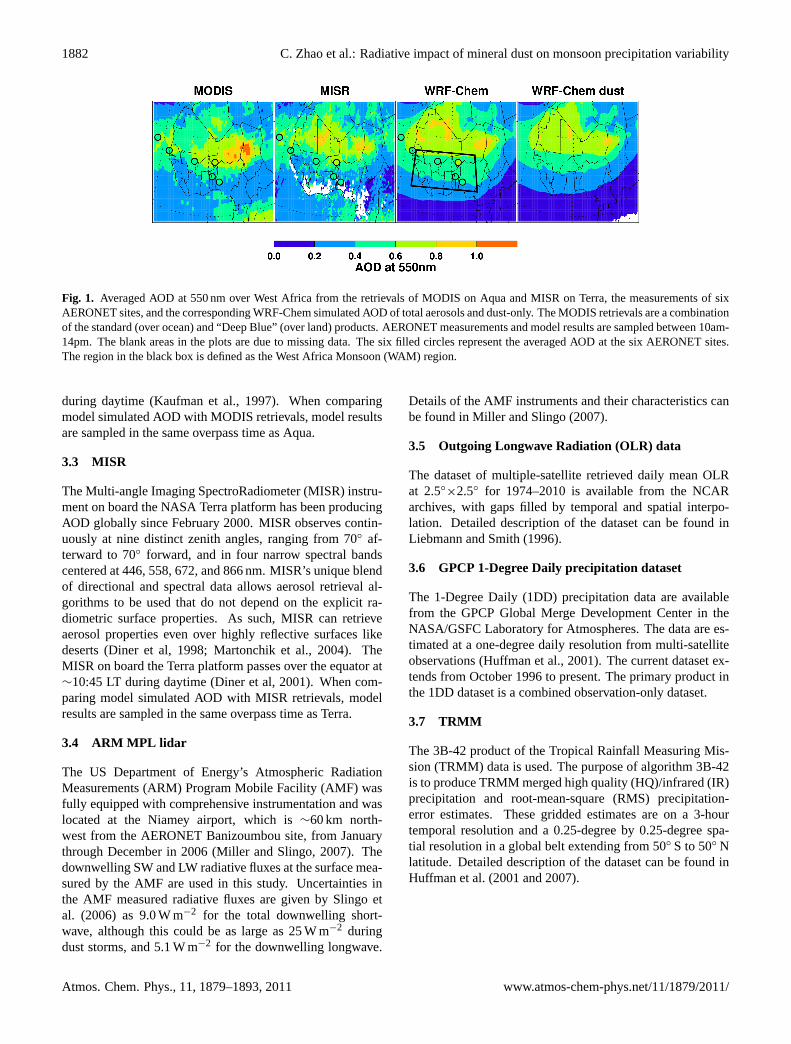
Fig. 1. Averaged AOD at 550 nm over West Africa from the retrievals of MODIS on Aqua and MISR on Terra, the measurements of sixAERONET sites, and the corresponding WRF-Chem simulated AOD of total aerosols and dust-only. The MODIS retrievals are a combinationof the standard (over ocean) and “Deep Blue” (over land) products. AERONET measurements and model results are sampled between 10am-14pm. The blank areas in the plots are due to missing data. The six filled circles represent the averaged AOD at the six AERONET sites.The region in the black box is defined as the West Africa Monsoon (WAM) region.
during daytime (Kaufman et al., 1997). When comparingmodel simulated AOD with MODIS retrievals, model resultsare sampled in the same overpass time as Aqua.
3.3 MISR
The Multi-angle Imaging SpectroRadiometer (MISR) instru-ment on board the NASA Terra platform has been producingAOD globally since February 2000. MISR observes contin-uously at nine distinct zenith angles, ranging from 70◦ af-terward to 70◦ forward, and in four narrow spectral bandscentered at 446, 558, 672, and 866 nm. MISR’s unique blendof directional and spectral data allows aerosol retrieval al-gorithms to be used that do not depend on the explicit ra-diometric surface properties. As such, MISR can retrieveaerosol properties even over highly reflective surfaces likedeserts (Diner et al, 1998; Martonchik et al., 2004). TheMISR on board the Terra platform passes over the equator at∼10:45 LT during daytime (Diner et al, 2001). When com-paring model simulated AOD with MISR retrievals, modelresults are sampled in the same overpass time as Terra.
3.4 ARM MPL lidar
The US Department of Energy’s Atmospheric RadiationMeasurements (ARM) Program Mobile Facility (AMF) wasfully equipped with comprehensive instrumentation and waslocated at the Niamey airport, which is∼60 km north-west from the AERONET Banizoumbou site, from Januarythrough December in 2006 (Miller and Slingo, 2007). Thedownwelling SW and LW radiative fluxes at the surface mea-sured by the AMF are used in this study. Uncertainties inthe AMF measured radiative fluxes are given by Slingo etal. (2006) as 9.0 W m−2 for the total downwelling short-wave, although this could be as large as 25 W m−2 duringdust storms, and 5.1 W m−2 for the downwelling longwave.
Details of the AMF instruments and their characteristics canbe found in Miller and Slingo (2007).
3.5 Outgoing Longwave Radiation (OLR) data
The dataset of multiple-satellite retrieved daily mean OLRat 2.5◦×2.5◦ for 1974–2010 is available from the NCARarchives, with gaps filled by temporal and spatial interpo-lation. Detailed description of the dataset can be found inLiebmann and Smith (1996).
3.6 GPCP 1-Degree Daily precipitation dataset
The 1-Degree Daily (1DD) precipitation data are availablefrom the GPCP Global Merge Development Center in theNASA/GSFC Laboratory for Atmospheres. The data are es-timated at a one-degree daily resolution from multi-satelliteobservations (Huffman et al., 2001). The current dataset ex-tends from October 1996 to present. The primary product inthe 1DD dataset is a combined observation-only dataset.
3.7 TRMM
The 3B-42 product of the Tropical Rainfall Measuring Mis-sion (TRMM) data is used. The purpose of algorithm 3B-42is to produce TRMM merged high quality (HQ)/infrared (IR)precipitation and root-mean-square (RMS) precipitation-error estimates. These gridded estimates are on a 3-hourtemporal resolution and a 0.25-degree by 0.25-degree spa-tial resolution in a global belt extending from 50◦ S to 50◦ Nlatitude. Detailed description of the dataset can be found inHuffman et al. (2001 and 2007).
Atmos. Chem. Phys., 11, 1879–1893, 2011 www.atmos-chem-phys.net/11/1879/2011/
C. Zhao et al.: Radiative impact of mineral dust on monsoon precipitation variability 1883
41
1
2
3
Figure 2 Averaged all-sky SW and LW radiative forcing of dust over West Africa from 4
WRF-Chem simulations. ‘TOA (+down)’ represents the dust radiative forcing at the top 5
of atmosphere and positive refers to downward direction; ‘ATM (+warm)’ represents the 6
dust radiative forcing in the atmosphere and positive refers to warming effect; ‘BOT 7
(+down)’ represents the dust radiative forcing at the surface and positive refers to 8
downward direction. ‘Net’ represents the sum of dust SW and LW radiative forcing. 9
10
11
12
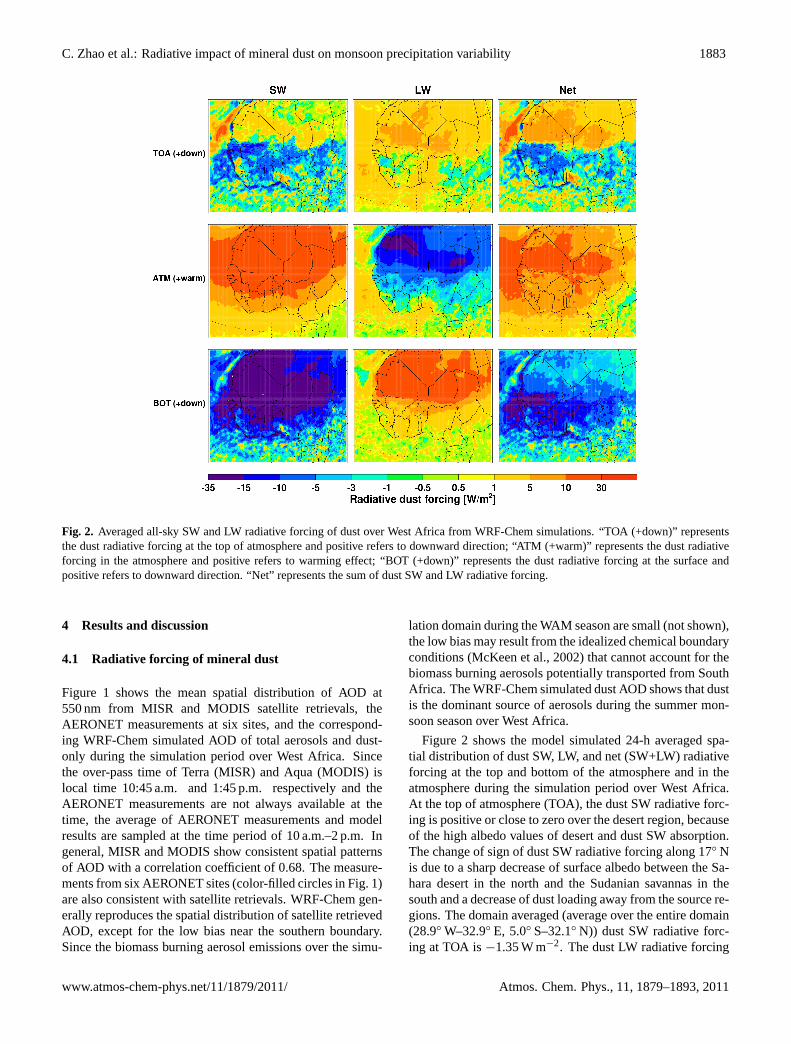
Fig. 2. Averaged all-sky SW and LW radiative forcing of dust over West Africa from WRF-Chem simulations. “TOA (+down)” representsthe dust radiative forcing at the top of atmosphere and positive refers to downward direction; “ATM (+warm)” represents the dust radiativeforcing in the atmosphere and positive refers to warming effect; “BOT (+down)” represents the dust radiative forcing at the surface andpositive refers to downward direction. “Net” represents the sum of dust SW and LW radiative forcing.
4 Results and discussion
4.1 Radiative forcing of mineral dust
Figure 1 shows the mean spatial distribution of AOD at550 nm from MISR and MODIS satellite retrievals, theAERONET measurements at six sites, and the correspond-ing WRF-Chem simulated AOD of total aerosols and dust-only during the simulation period over West Africa. Sincethe over-pass time of Terra (MISR) and Aqua (MODIS) islocal time 10:45 a.m. and 1:45 p.m. respectively and theAERONET measurements are not always available at thetime, the average of AERONET measurements and modelresults are sampled at the time period of 10 a.m.–2 p.m. Ingeneral, MISR and MODIS show consistent spatial patternsof AOD with a correlation coefficient of 0.68. The measure-ments from six AERONET sites (color-filled circles in Fig. 1)are also consistent with satellite retrievals. WRF-Chem gen-erally reproduces the spatial distribution of satellite retrievedAOD, except for the low bias near the southern boundary.Since the biomass burning aerosol emissions over the simu-
lation domain during the WAM season are small (not shown),the low bias may result from the idealized chemical boundaryconditions (McKeen et al., 2002) that cannot account for thebiomass burning aerosols potentially transported from SouthAfrica. The WRF-Chem simulated dust AOD shows that dustis the dominant source of aerosols during the summer mon-soon season over West Africa.
Figure 2 shows the model simulated 24-h averaged spa-tial distribution of dust SW, LW, and net (SW+LW) radiativeforcing at the top and bottom of the atmosphere and in theatmosphere during the simulation period over West Africa.At the top of atmosphere (TOA), the dust SW radiative forc-ing is positive or close to zero over the desert region, becauseof the high albedo values of desert and dust SW absorption.The change of sign of dust SW radiative forcing along 17◦ Nis due to a sharp decrease of surface albedo between the Sa-hara desert in the north and the Sudanian savannas in thesouth and a decrease of dust loading away from the source re-gions. The domain averaged (average over the entire domain(28.9◦ W–32.9◦ E, 5.0◦ S–32.1◦ N)) dust SW radiative forc-ing at TOA is−1.35 W m−2. The dust LW radiative forcing
www.atmos-chem-phys.net/11/1879/2011/ Atmos. Chem. Phys., 11, 1879–1893, 2011

1884 C. Zhao et al.: Radiative impact of mineral dust on monsoon precipitation variability
Table 1. WRF-Chem simulated 24-h all-sky radiative forcing ofSaharan dust over West Africa (28.9◦ W–32.9◦ E, 5.0◦ S–32.1◦ N)during the simulation period. The unit of values is W m−2. “TOA”represents “top of atmosphere”; “ATM” represents “atmosphere”;“BOT” represents “surface”. Positive means downward for TOAand BOT, positive for absorption/heating in ATM.
SW LW NET
TOA −1.35 2.18 0.83ATM 11.01 −4.07 6.94BOT −12.37 6.25 −6.11
at TOA is mostly positive over the domain with an averageof 2.18 W m−2, resulting from dust LW absorption. Over-all, the simulated dust net (SW+LW) radiative forcing (do-main average of 0.83 W m−2) at TOA is consistent with theresult reported by Balkanski et al. (2007). In the atmosphere,dust aerosol absorbs SW and warms the atmosphere. DustLW effect cools the atmosphere by increasing atmosphericoutgoing LW radiation. The dust LW forcing is higher overthe desert because of hotter desert surface and stronger in-teraction between LW and coarse mode dust particles thatare spatially confined to the desert due to their shorter life-times and distance being carried. In the atmosphere, dustproduces a net (LW+SW) warming effect with a domain av-erage of 6.94 W m−2. At the surface, dust has a cooling effect(domain average of−12.37 W m−2) by reducing the down-ward SW radiation and a warming effect (domain averageof 6.25 W m−2) by trapping the LW radiation emitted fromsurface. The net (LW+SW) dust radiative forcing at the sur-face is -6.11 W m−2. The simulated dust radiative forcingsaveraged over the domain are summarized in Table 1. Over-all, the net (LW+SW) radiative effect of dust is atmosphericwarming, surface cooling, and relatively small net TOA forc-ing over West Africa.
The model simulated surface SW radiative fluxes are com-pared to the AMF retrievals. Diurnal cycle of upward anddownward SW radiative fluxes at the surface at Niamey air-port averaged during the simulation period from the AMFretrievals and WRF-Chem simulations with and without dustaerosols are shown in Fig. 3. The AMF retrievals shownoontime maximum SW radiative fluxes with daily aver-ages of 49 W m−2 and 240 W m−2 for upward and downwardfluxes respectively. The simulation with dust well capturesthe upward SW fluxes with a daily average of 50 W m−2.Compared to the simulation without dust, dust reduces thedaily averaged upward SW fluxes by about 5 W m−2 and im-proves the simulation. For downward SW fluxes, the sim-ulation without dust significantly overestimates the valueswith a daily average of 270 W m−2, while the simulation withdust well captures the AMF retrievals with a daily averageof 244 W m−2. Dust reduces the downward SW fluxes by∼25 W m−2 on daily average and up to∼100 W m−2 nearnoontime, and significantly improves the model simulations.
42
1
2
3
4
5
Figure 3 Averaged diurnal cycle of upward and downward SW radiative fluxes at 6
Niamey airport from the AMF retrievals and WRF-Chem simulations with and without 7
dust aerosols. 8
9
10
11
12
13
14
15
16
17
Fig. 3. Averaged diurnal cycle of upward and downward SW ra-diative fluxes at Niamey airport from the AMF retrievals and WRF-Chem simulations with and without dust aerosols.
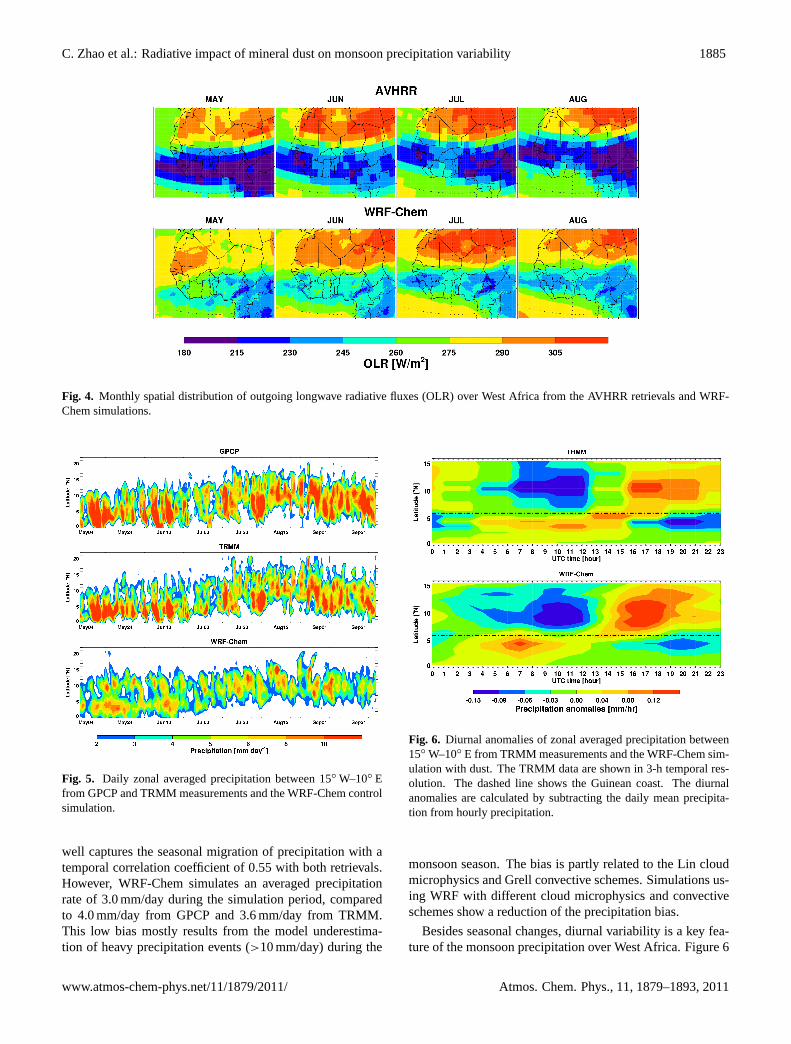
Model simulated outgoing LW radiation (OLR) is com-pared using AVHRR retrievals. Figure 4 shows the monthlyspatial distribution of OLR over West Africa during the sim-ulation period from AVHRR retrievals and the WRF-Chemsimulation. The AVHRR retrievals show higher OLR overthe Sahara desert compared to the South and the ocean be-cause of the hotter desert surface. Seasonally, OLR overthe Sahara desert increases from May to July as the sur-face temperature increases. The model generally capturesboth the spatial patterns and monthly variation of retrievedOLR over West Africa, particularly over the Sahara. How-ever, the model generally overestimates the OLR in the South(south to∼20◦ N). The bias is likely due to underestima-tion of cloud in the simulation. Sensitivity simulations us-ing WRF with different cloud microphysics and convectiveschemes show that the OLR bias can be significantly re-duced in the South (by up to∼30 W m−2 compared to theOLR of 200∼250 W m−2), suggesting that part of the biascomes from the Lin cloud microphysics and Grell convec-tive schemes used in the control simulation. Dust reducesOLR by up to∼10 W m−2 over the desert region (Fig. 2).Since the effect is relatively small compared to the OLR of∼300 W m−2 over most part of the desert (Fig. 4), only re-sults from the simulation with dust are shown in this figure.
4.2 Radiative impact of dust on precipitation
4.2.1 Dust impact on precipitation
Before investigating dust impact on precipitation, the WRF-Chem simulated precipitation is evaluated using GPCP andTRMM measurements. Figure 5 shows the daily zonal av-eraged precipitation between 15◦ W–10◦ E from GPCP andTRMM measurements and the WRF-Chem simulation dur-ing the simulation period. The Guinean coast is around6◦ N. Both GPCP and TRMM measurements show that themonsoon precipitation migrates from the southernmost re-gion in May to the northernmost region in August, and re-treats back to the south in September. WRF-Chem generally
Atmos. Chem. Phys., 11, 1879–1893, 2011 www.atmos-chem-phys.net/11/1879/2011/
C. Zhao et al.: Radiative impact of mineral dust on monsoon precipitation variability 1885
43
1
2
3
4
5
Figure 4 Monthly spatial distribution of outgoing longwave radiative fluxes (OLR) over 6
West Africa from the AVHRR retrievals and WRF-Chem simulations. 7
8
9
10
11
12
13
14
15
16
Fig. 4. Monthly spatial distribution of outgoing longwave radiative fluxes (OLR) over West Africa from the AVHRR retrievals and WRF-Chem simulations.
Fig. 5. Daily zonal averaged precipitation between 15◦ W–10◦ Efrom GPCP and TRMM measurements and the WRF-Chem controlsimulation.
well captures the seasonal migration of precipitation with atemporal correlation coefficient of 0.55 with both retrievals.However, WRF-Chem simulates an averaged precipitationrate of 3.0 mm/day during the simulation period, comparedto 4.0 mm/day from GPCP and 3.6 mm/day from TRMM.This low bias mostly results from the model underestima-tion of heavy precipitation events (>10 mm/day) during the 45
1
2
3
4
5
Figure 6 Diurnal anomalies of zonal averaged precipitation between 15oW-10oE from 6
TRMM measurements and the WRF-Chem simulation with dust. The TRMM data are 7
shown in 3-hour temporal resolution. The dashed line shows the Guinean coast. The 8
diurnal anomalies are calculated by subtracting the daily mean precipitation from hourly 9
precipitation. 10
11
12
13
Fig. 6. Diurnal anomalies of zonal averaged precipitation between15◦ W–10◦ E from TRMM measurements and the WRF-Chem sim-ulation with dust. The TRMM data are shown in 3-h temporal res-olution. The dashed line shows the Guinean coast. The diurnalanomalies are calculated by subtracting the daily mean precipita-tion from hourly precipitation.
monsoon season. The bias is partly related to the Lin cloudmicrophysics and Grell convective schemes. Simulations us-ing WRF with different cloud microphysics and convectiveschemes show a reduction of the precipitation bias.
Besides seasonal changes, diurnal variability is a key fea-ture of the monsoon precipitation over West Africa. Figure 6
www.atmos-chem-phys.net/11/1879/2011/ Atmos. Chem. Phys., 11, 1879–1893, 2011

1886 C. Zhao et al.: Radiative impact of mineral dust on monsoon precipitation variability
46
1
2
3
Figure 7 Dust impact on the diurnal cycle of zonal averaged precipitation between 15oW-4
10oE from WRF-Chem in three cases with different dust absorption properties. The 5
dashed line shows the Guinean coast. The dust impact is calculated by subtracting the 6
precipitation from the simulation without dust from that with dust. ‘ni’ represents the 7
imaginary part of the refractive index of dust. 8
9
10
Fig. 7. Dust impact on the diurnal cycle of zonal averaged pre-cipitation between 15◦ W–10◦ E from WRF-Chem in three caseswith different dust absorption properties. The dashed line showsthe Guinean coast. The dust impact is calculated by subtracting theprecipitation from the simulation without dust from that with dust.“ni ” represents the imaginary part of the refractive index of dust.
shows the diurnal anomalies of zonal averaged precipitationbetween 15◦ W–10◦ E from the TRMM measurements andWRF-Chem control simulation. The TRMM data are avail-able in 3-hour temporal resolution. The dashed line showsthe Guinean coast. The diurnal anomalies are calculated bysubtracting the daily mean precipitation from the 3-hourlyor hourly precipitation. The TRMM measurements showlarger diurnal variation of precipitation over land than overthe ocean (south of the dashed line), because surface heatingthat drives convection has much smaller diurnal change overthe ocean due to its high heat capacity. Over land, solar heat-ing of the surface can increase convective activity, leading tolate afternoon precipitation (peak around∼5 p.m.). Over theocean, the surface does not cool as much as the land due tothe high heat capacity of the oceanic mixed-layer. As theatmosphere cools during nighttime, the atmosphere is de-stabilized by the warmer ocean surface. As a result, oceanicprecipitation often peaks between midnight and early morn-ing (Kim et al., 2010). The model generally captures the am-
47
1
2
3
4
5
Figure 8 Dust impact on the diurnal cycle of surface energy budget averaged over the 6
WAM region (6oN-17oN and 15oW-10oE) from WRF-Chem in three cases with different 7
dust absorption properties.‘ni’ represents the imaginary part of the refractive index of 8
dust. ‘LH’ is latent heat; ‘LW’ is LW radiation; ‘SH’ is sensible heat; ‘SW’ is SW 9
radiation; and ‘Net’ is the sum of the total energy fluxes (i.e., LH+LW+SH+SW). 10
Positive refers to more energy fluxes into the surface or less energy fluxes out of the 11
surface. 12
13
14
15
16
17
18
Fig. 8. Dust impact on the diurnal cycle of surface energy bud-get averaged over the WAM region (6◦ N–17◦ N and 15◦ W–10◦ E)from WRF-Chem in three cases with different dust absorptionproperties.“ni ” represents the imaginary part of the refractive indexof dust. ‘LH’ is latent heat; “LW” is LW radiation; “SH” is sensibleheat; “SW” is SW radiation; and “Net” is the sum of the total en-ergy fluxes (i.e., LH+LW+SH+SW). Positive refers to more energyfluxes into the surface or less energy fluxes out of the surface.
plitude and phase of TRMM diurnal precipitation over bothland and ocean.
Figure 7 shows the dust impact on diurnal cycle of zonalaveraged precipitation between 15◦ W–10◦ E from the WRF-Chem simulations in three cases with different absorptivitiesof dust during the simulation period. The dashed line showsthe Guinean coast. The dust impact is calculated by subtract-ing the precipitation from the simulation without dust fromthat of the simulation with dust. In the control simulation(the imaginary part (ni) of dust SW refractive index is set to0.003, i.e.,ni = 0.003), dust reduces the late afternoon pre-cipitation by up to 0.14 mm/h (25%) but increases nocturnaland early morning precipitation by up to 0.04 mm/h (45%)over land. The dust-induced reduction of diurnal precipita-tion amplitude with an average of−0.06 mm/h (−24%) overthe WAM region (6◦ N–17◦ N and 15◦ W–10◦ E, shown inFig. 1) is 99% statistically significant based on the Student’st-test. Compared to the TRMM measurements (Fig. 6), thecontrol simulation, which includes dust-induced reduction ofdiurnal amplitude, improves the simulation of diurnal cycleof precipitation over land. The dust impact on precipita-tion over the ocean is relatively small, because sea surfacetemperature is prescribed in this study. Even if sea surfacetemperature is simulated, dust effect is expected to be smallwithin short-term because of its lower concentration over theocean and the high heat capacity of the ocean. In the controlsimulation, dust reduces daily precipitation over the WAMregion by 0.17 mm/day (∼4%), which is relatively small be-cause the late afternoon decrease and nocturnal and earlymorning increase of precipitation nearly offset each other.
To further investigate the dust impact on diurnal precipi-tation over the WAM region, the surface energy budget andatmospheric diabatic heating are analyzed. Figure 8 showsthe dust impact on diurnal cycle of surface energy budgetaveraged over the WAM region from the WRF-Chem sim-ulations in three cases with different SW absorptivities ofdust. In the control simulation, dust reduces SW fluxes and
Atmos. Chem. Phys., 11, 1879–1893, 2011 www.atmos-chem-phys.net/11/1879/2011/
C. Zhao et al.: Radiative impact of mineral dust on monsoon precipitation variability 1887
48
1
2
3
Figure 9 Dust impact on the atmospheric diabatic heating profiles at 00 UTC and 12 4
UTC averaged over the WAM region (6oN-17oN and 15oW-10oE) from WRF-Chem 5
simulations in three cases with different dust absorption properties: std (ni=0.003), case1 6
(ni=0.0004), and case2 (ni=0.006), where ‘ni’ represents the imaginary part of the 7
refractive index of dust. 8
9
10
11
12
13
14
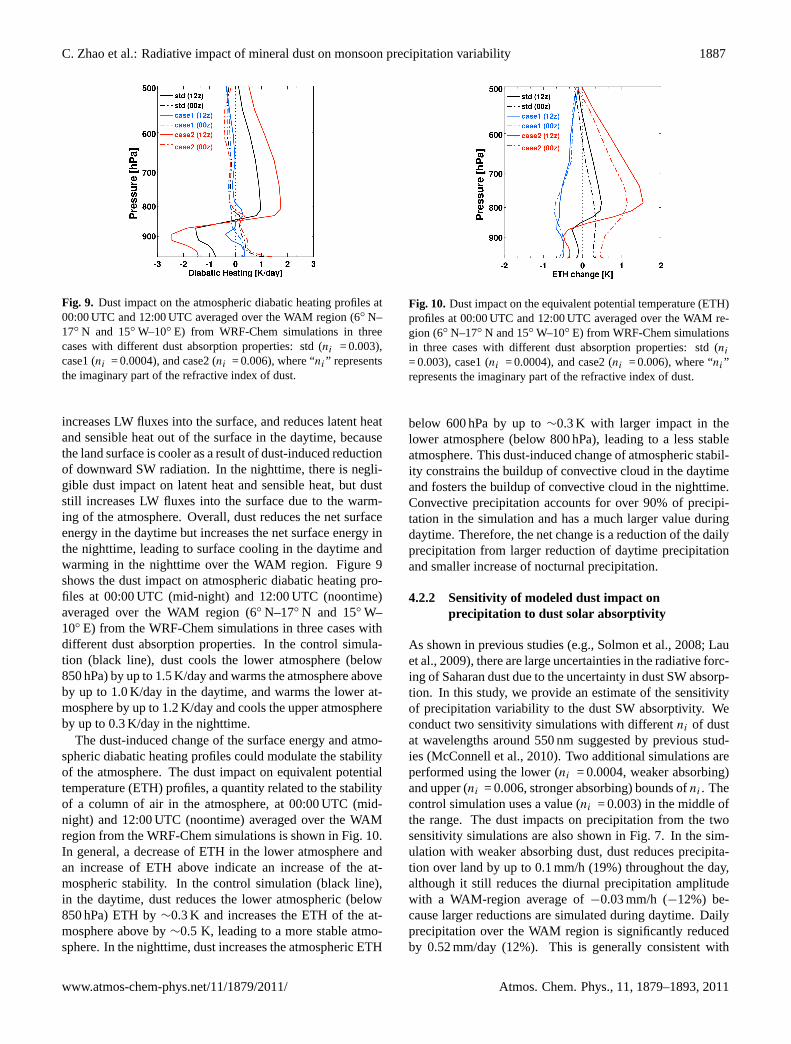
Fig. 9. Dust impact on the atmospheric diabatic heating profiles at00:00 UTC and 12:00 UTC averaged over the WAM region (6◦ N–17◦ N and 15◦ W–10◦ E) from WRF-Chem simulations in threecases with different dust absorption properties: std (ni = 0.003),case1 (ni = 0.0004), and case2 (ni = 0.006), where “ni ” representsthe imaginary part of the refractive index of dust.
increases LW fluxes into the surface, and reduces latent heatand sensible heat out of the surface in the daytime, becausethe land surface is cooler as a result of dust-induced reductionof downward SW radiation. In the nighttime, there is negli-gible dust impact on latent heat and sensible heat, but duststill increases LW fluxes into the surface due to the warm-ing of the atmosphere. Overall, dust reduces the net surfaceenergy in the daytime but increases the net surface energy inthe nighttime, leading to surface cooling in the daytime andwarming in the nighttime over the WAM region. Figure 9shows the dust impact on atmospheric diabatic heating pro-files at 00:00 UTC (mid-night) and 12:00 UTC (noontime)averaged over the WAM region (6◦ N–17◦ N and 15◦ W–10◦ E) from the WRF-Chem simulations in three cases withdifferent dust absorption properties. In the control simula-tion (black line), dust cools the lower atmosphere (below850 hPa) by up to 1.5 K/day and warms the atmosphere aboveby up to 1.0 K/day in the daytime, and warms the lower at-mosphere by up to 1.2 K/day and cools the upper atmosphereby up to 0.3 K/day in the nighttime.
The dust-induced change of the surface energy and atmo-spheric diabatic heating profiles could modulate the stabilityof the atmosphere. The dust impact on equivalent potentialtemperature (ETH) profiles, a quantity related to the stabilityof a column of air in the atmosphere, at 00:00 UTC (mid-night) and 12:00 UTC (noontime) averaged over the WAMregion from the WRF-Chem simulations is shown in Fig. 10.In general, a decrease of ETH in the lower atmosphere andan increase of ETH above indicate an increase of the at-mospheric stability. In the control simulation (black line),in the daytime, dust reduces the lower atmospheric (below850 hPa) ETH by∼0.3 K and increases the ETH of the at-mosphere above by∼0.5 K, leading to a more stable atmo-sphere. In the nighttime, dust increases the atmospheric ETH
49
1
2
3
Figure 10 Dust impact on the equivalent potential temperature (ETH) profiles at 00 UTC 4
and 12 UTC averaged over the WAM region (6oN-17oN and 15oW-10oE) from WRF-5
Chem simulations in three cases with different dust absorption properties: std (ni=0.003), 6
case1 (ni=0.0004), and case2 (ni=0.006), where ‘ni’ represents the imaginary part of the 7
refractive index of dust. 8
9
10
11
12
13
14
15
Fig. 10.Dust impact on the equivalent potential temperature (ETH)profiles at 00:00 UTC and 12:00 UTC averaged over the WAM re-gion (6◦ N–17◦ N and 15◦ W–10◦ E) from WRF-Chem simulationsin three cases with different dust absorption properties: std (ni
= 0.003), case1 (ni = 0.0004), and case2 (ni = 0.006), where “ni ”represents the imaginary part of the refractive index of dust.
below 600 hPa by up to∼0.3 K with larger impact in thelower atmosphere (below 800 hPa), leading to a less stableatmosphere. This dust-induced change of atmospheric stabil-ity constrains the buildup of convective cloud in the daytimeand fosters the buildup of convective cloud in the nighttime.Convective precipitation accounts for over 90% of precipi-tation in the simulation and has a much larger value duringdaytime. Therefore, the net change is a reduction of the dailyprecipitation from larger reduction of daytime precipitationand smaller increase of nocturnal precipitation.
4.2.2 Sensitivity of modeled dust impact onprecipitation to dust solar absorptivity
As shown in previous studies (e.g., Solmon et al., 2008; Lauet al., 2009), there are large uncertainties in the radiative forc-ing of Saharan dust due to the uncertainty in dust SW absorp-tion. In this study, we provide an estimate of the sensitivityof precipitation variability to the dust SW absorptivity. Weconduct two sensitivity simulations with differentni of dustat wavelengths around 550 nm suggested by previous stud-ies (McConnell et al., 2010). Two additional simulations areperformed using the lower (ni = 0.0004, weaker absorbing)and upper (ni = 0.006, stronger absorbing) bounds ofni . Thecontrol simulation uses a value (ni = 0.003) in the middle ofthe range. The dust impacts on precipitation from the twosensitivity simulations are also shown in Fig. 7. In the sim-ulation with weaker absorbing dust, dust reduces precipita-tion over land by up to 0.1 mm/h (19%) throughout the day,although it still reduces the diurnal precipitation amplitudewith a WAM-region average of−0.03 mm/h (−12%) be-cause larger reductions are simulated during daytime. Dailyprecipitation over the WAM region is significantly reducedby 0.52 mm/day (12%). This is generally consistent with
www.atmos-chem-phys.net/11/1879/2011/ Atmos. Chem. Phys., 11, 1879–1893, 2011

1888 C. Zhao et al.: Radiative impact of mineral dust on monsoon precipitation variability
Table 2. WRF-Chem simulated mean dust effect on the daily precipitation and diurnal amplitude of precipitation over the WAM region (6◦ N–17◦ N and 15◦ W–10◦ E) during the wet monsoon season (May–September). The column “Mean (w/o dust)” shows the daily precipitationand diurnal amplitude of precipitation from WRF-Chem simulation without dust. “ni ” represents the imaginary part of SW refractive indexof dust.
2006 2005Mean (w/o dust) Dust effect Mean (w/o dust) Dust effect
ni = 0.003 ni = 0.0004 ni = 0.006 ni = 0.003Daily Precipitation (mm/day) 4.4 −0.17 (−4%) −0.52 (−12%) 0.03 (1%) 4.0 −0.12 (−3%)Diurnal Amplitude (mm/h) 0.25 −0.06 (−24%) −0.03 (−12%) −0.12 (−48%) 0.22 −0.05 (−23%)
Yoshioka et al. (2007), who found that the∼30% of Sahelrainfall reduction is due to weakly absorbing dust. The dustimpact on the surface energy budget in the simulation withweaker absorbing dust is smaller than that in the control sim-ulation, particularly for the increase of LW fluxes into thesurface (Fig. 8). The dust impact on the atmospheric dia-batic heating profile is relatively small (less than 0.3 K/daycompared to 1.5 K/day in the control simulation) (Fig. 9).Therefore, the dust warming effect (through SW radiationabsorption) cannot offset its cooling effect (through SW ra-diation extinction) at the lower atmosphere. As a result, dustreduces the atmospheric ETH below 500 hPa by up to∼0.6 Kwith larger impact in the lower atmosphere (below 800 hPa)(Fig. 10), leading to more stable atmosphere and hence lessconvective precipitation throughout the day.
In the simulation with stronger absorbing dust, comparedto the result from the control simulation, dust reduces morelate-afternoon precipitation by up to 0.2 mm/h (38%) whileincreases more nocturnal and early morning precipitation byup to 0.11 mm/h (150%), resulting in the largest reduction ofdiurnal precipitation amplitude with a WAM-region averageof −0.12 mm/h (−48%) among the three cases (Fig. 7). Thedaily precipitation over the WAM region is increased by avery small amount of∼0.03 mm/day (∼1%). The dust im-pact on the surface energy budget is larger than that in thecontrol simulation (Fig. 8). The dust cools the lower atmo-sphere (below 850 hPa) by up to 2.5 K/day and warms theatmosphere above by up to 2.0 K/day in the daytime, andwarms the lower atmosphere by up to 1.4 K/day and coolsthe upper atmosphere by up to 0.5 K/day in the nighttime(Fig. 9). As a result, dust reduces the lower atmospheric (be-low 850 hPa) ETH by∼0.5 K and increases the ETH of theatmosphere above by∼1.5 K in the daytime, and increasesthe atmospheric ETH below 500 hPa by up to∼1.0 K withlarger impact in the lower atmosphere (below 700 hPa) inthe nighttime (Fig. 10). This dust-induced changes of sur-face energy and atmospheric diabatic heating profiles lead toeven more stable atmosphere associated with less convectiveprecipitation in the daytime and less stable atmosphere as-sociated with more convective precipitation in the night andearly morning. The mean dust effects on the daily precipita-tion and diurnal amplitude of precipitation over the WAM re-
gion during the wet monsoon season (May-September) fromthe three simulations with different dust SW absorptivitiesare summarized in Table 2.
4.2.3 Sensitivity of modeled dust impact onprecipitation to interannual monsoon variability
The dust effects discussed above are calculated from the sim-ulations in the year of 2006, which is a relatively strongmonsoon year. To examine possible dependence of our re-sults on monsoon variability, a simulation (ni = 0.003) hasalso been conducted for the weakest monsoon year 2005in the last decade (2000–2009) based on GPCP observa-tions (not shown). The averaged daily WAM precipitation(4.0 mm/day) in 2005 is∼10% less than that (4.4 mm/day)in 2006. The simulations in 2005 show that dust reducesthe late-afternoon precipitation by up to 0.10 mm/h (21%),but increases nocturnal and early morning precipitation byup to 0.03 mm/h (35%) over the WAM region, resulting ina reduction of diurnal precipitation amplitude with an av-erage of−0.05 mm/h (−23%). There is a relatively smalldust-induced change (−0.12 mm/day or−3%) of daily WAMprecipitation. The results are also summarized in Table 2.Comparing the difference between the control simulationsfor 2005 and 2006 with the difference among the three 2006simulations with different dust SW absorptivities, the sim-ulated dust impact on WAM precipitation is more sensitiveto dust SW absorptivity than interannual monsoon variabil-ity, suggesting that more efforts in the future may focus onreducing the uncertainty in dust optical properties.
4.3 Radiative impact of dust on atmospheric circulation
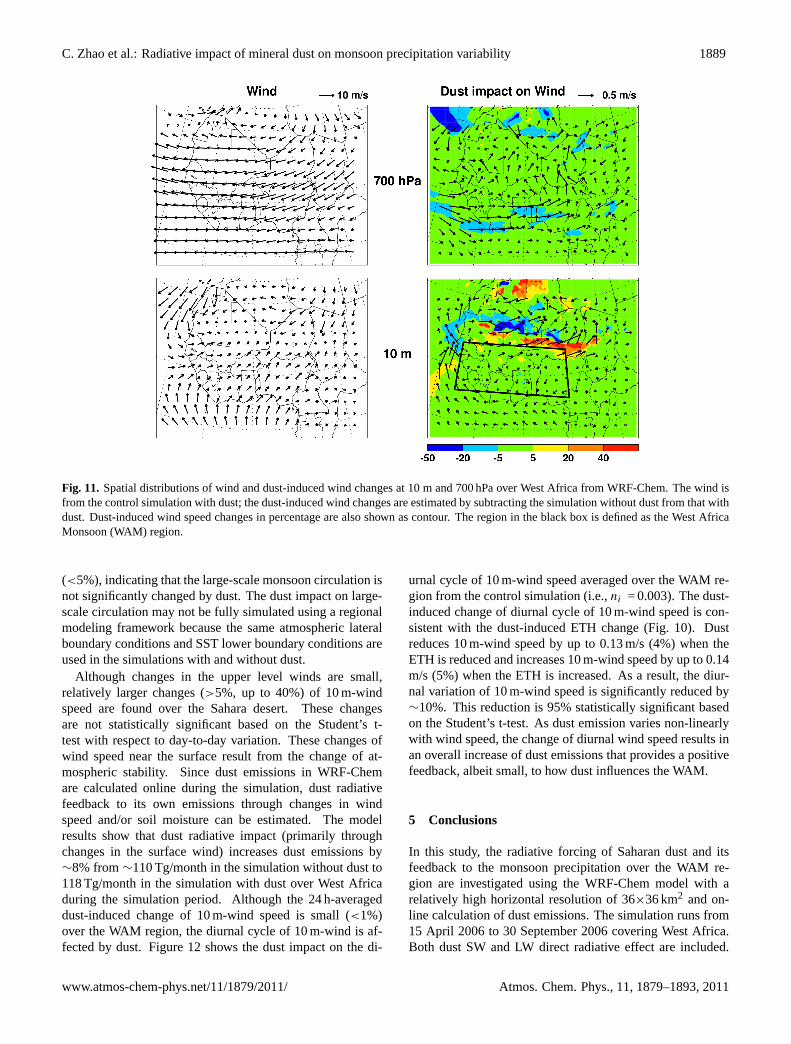
The radiative impact of dust on atmospheric diabatic heat-ing and stability could also modulate the atmospheric windcirculation (e.g., Lau et al., 2009). Figure 11 shows the spa-tial distributions of wind and dust-induced wind changes at10 m and 700 hPa over West Africa during the simulationperiod from WRF-Chem. In the figure, dust-induced windspeed changes in percentage are also shown. The modelsuccessfully simulates the monsoon circulation and the west-erly jet in the lower atmosphere off the West African coast.The dust-induced change of wind speed at 700 hPa is small
Atmos. Chem. Phys., 11, 1879–1893, 2011 www.atmos-chem-phys.net/11/1879/2011/
C. Zhao et al.: Radiative impact of mineral dust on monsoon precipitation variability 1889
50
1
2
3
Figure 11 Spatial distributions of wind and dust-induced wind changes at 10 m and 700 4
hPa over West Africa from WRF-Chem. The wind is from the control simulation with 5
dust; the dust-induced wind changes are estimated by subtracting the simulation without 6
dust from that with dust. Dust-induced wind speed changes in percentage are also shown 7
as contour. The region in the black box is defined as the West Africa Monsoon (WAM) 8
region. 9
10
11
12
13
Fig. 11. Spatial distributions of wind and dust-induced wind changes at 10 m and 700 hPa over West Africa from WRF-Chem. The wind isfrom the control simulation with dust; the dust-induced wind changes are estimated by subtracting the simulation without dust from that withdust. Dust-induced wind speed changes in percentage are also shown as contour. The region in the black box is defined as the West AfricaMonsoon (WAM) region.
(<5%), indicating that the large-scale monsoon circulation isnot significantly changed by dust. The dust impact on large-scale circulation may not be fully simulated using a regionalmodeling framework because the same atmospheric lateralboundary conditions and SST lower boundary conditions areused in the simulations with and without dust.
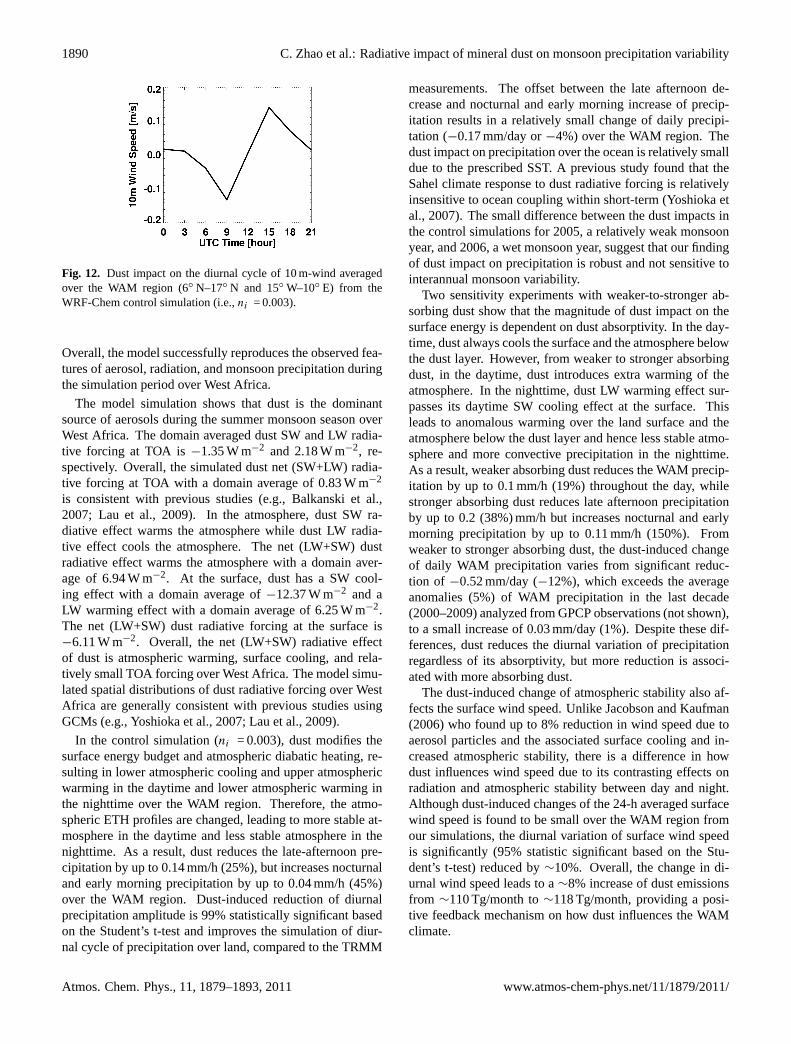
Although changes in the upper level winds are small,relatively larger changes (>5%, up to 40%) of 10 m-windspeed are found over the Sahara desert. These changesare not statistically significant based on the Student’s t-test with respect to day-to-day variation. These changes ofwind speed near the surface result from the change of at-mospheric stability. Since dust emissions in WRF-Chemare calculated online during the simulation, dust radiativefeedback to its own emissions through changes in windspeed and/or soil moisture can be estimated. The modelresults show that dust radiative impact (primarily throughchanges in the surface wind) increases dust emissions by∼8% from∼110 Tg/month in the simulation without dust to118 Tg/month in the simulation with dust over West Africaduring the simulation period. Although the 24 h-averageddust-induced change of 10 m-wind speed is small (<1%)over the WAM region, the diurnal cycle of 10 m-wind is af-fected by dust. Figure 12 shows the dust impact on the di-
urnal cycle of 10 m-wind speed averaged over the WAM re-gion from the control simulation (i.e.,ni = 0.003). The dust-induced change of diurnal cycle of 10 m-wind speed is con-sistent with the dust-induced ETH change (Fig. 10). Dustreduces 10 m-wind speed by up to 0.13 m/s (4%) when theETH is reduced and increases 10 m-wind speed by up to 0.14m/s (5%) when the ETH is increased. As a result, the diur-nal variation of 10 m-wind speed is significantly reduced by∼10%. This reduction is 95% statistically significant basedon the Student’s t-test. As dust emission varies non-linearlywith wind speed, the change of diurnal wind speed results inan overall increase of dust emissions that provides a positivefeedback, albeit small, to how dust influences the WAM.
5 Conclusions
In this study, the radiative forcing of Saharan dust and itsfeedback to the monsoon precipitation over the WAM re-gion are investigated using the WRF-Chem model with arelatively high horizontal resolution of 36×36 km2 and on-line calculation of dust emissions. The simulation runs from15 April 2006 to 30 September 2006 covering West Africa.Both dust SW and LW direct radiative effect are included.
www.atmos-chem-phys.net/11/1879/2011/ Atmos. Chem. Phys., 11, 1879–1893, 2011
1890 C. Zhao et al.: Radiative impact of mineral dust on monsoon precipitation variability
51
1
2
3
4
Figure 12 Dust impact on the diurnal cycle of 10m-wind averaged over the WAM region 5
(6oN-17oN and 15oW-10oE) from the WRF-Chem control simulation (i.e., ni=0.003). 6
7
Fig. 12. Dust impact on the diurnal cycle of 10 m-wind averagedover the WAM region (6◦ N–17◦ N and 15◦ W–10◦ E) from theWRF-Chem control simulation (i.e.,ni = 0.003).
Overall, the model successfully reproduces the observed fea-tures of aerosol, radiation, and monsoon precipitation duringthe simulation period over West Africa.
The model simulation shows that dust is the dominantsource of aerosols during the summer monsoon season overWest Africa. The domain averaged dust SW and LW radia-tive forcing at TOA is−1.35 W m−2 and 2.18 W m−2, re-spectively. Overall, the simulated dust net (SW+LW) radia-tive forcing at TOA with a domain average of 0.83 W m−2
is consistent with previous studies (e.g., Balkanski et al.,2007; Lau et al., 2009). In the atmosphere, dust SW ra-diative effect warms the atmosphere while dust LW radia-tive effect cools the atmosphere. The net (LW+SW) dustradiative effect warms the atmosphere with a domain aver-age of 6.94 W m−2. At the surface, dust has a SW cool-ing effect with a domain average of−12.37 W m−2 and aLW warming effect with a domain average of 6.25 W m−2.The net (LW+SW) dust radiative forcing at the surface is−6.11 W m−2. Overall, the net (LW+SW) radiative effectof dust is atmospheric warming, surface cooling, and rela-tively small TOA forcing over West Africa. The model simu-lated spatial distributions of dust radiative forcing over WestAfrica are generally consistent with previous studies usingGCMs (e.g., Yoshioka et al., 2007; Lau et al., 2009).
In the control simulation (ni = 0.003), dust modifies thesurface energy budget and atmospheric diabatic heating, re-sulting in lower atmospheric cooling and upper atmosphericwarming in the daytime and lower atmospheric warming inthe nighttime over the WAM region. Therefore, the atmo-spheric ETH profiles are changed, leading to more stable at-mosphere in the daytime and less stable atmosphere in thenighttime. As a result, dust reduces the late-afternoon pre-cipitation by up to 0.14 mm/h (25%), but increases nocturnaland early morning precipitation by up to 0.04 mm/h (45%)over the WAM region. Dust-induced reduction of diurnalprecipitation amplitude is 99% statistically significant basedon the Student’s t-test and improves the simulation of diur-nal cycle of precipitation over land, compared to the TRMM
measurements. The offset between the late afternoon de-crease and nocturnal and early morning increase of precip-itation results in a relatively small change of daily precipi-tation (−0.17 mm/day or−4%) over the WAM region. Thedust impact on precipitation over the ocean is relatively smalldue to the prescribed SST. A previous study found that theSahel climate response to dust radiative forcing is relativelyinsensitive to ocean coupling within short-term (Yoshioka etal., 2007). The small difference between the dust impacts inthe control simulations for 2005, a relatively weak monsoonyear, and 2006, a wet monsoon year, suggest that our findingof dust impact on precipitation is robust and not sensitive tointerannual monsoon variability.
Two sensitivity experiments with weaker-to-stronger ab-sorbing dust show that the magnitude of dust impact on thesurface energy is dependent on dust absorptivity. In the day-time, dust always cools the surface and the atmosphere belowthe dust layer. However, from weaker to stronger absorbingdust, in the daytime, dust introduces extra warming of theatmosphere. In the nighttime, dust LW warming effect sur-passes its daytime SW cooling effect at the surface. Thisleads to anomalous warming over the land surface and theatmosphere below the dust layer and hence less stable atmo-sphere and more convective precipitation in the nighttime.As a result, weaker absorbing dust reduces the WAM precip-itation by up to 0.1 mm/h (19%) throughout the day, whilestronger absorbing dust reduces late afternoon precipitationby up to 0.2 (38%) mm/h but increases nocturnal and earlymorning precipitation by up to 0.11 mm/h (150%). Fromweaker to stronger absorbing dust, the dust-induced changeof daily WAM precipitation varies from significant reduc-tion of −0.52 mm/day (−12%), which exceeds the averageanomalies (5%) of WAM precipitation in the last decade(2000–2009) analyzed from GPCP observations (not shown),to a small increase of 0.03 mm/day (1%). Despite these dif-ferences, dust reduces the diurnal variation of precipitationregardless of its absorptivity, but more reduction is associ-ated with more absorbing dust.
The dust-induced change of atmospheric stability also af-fects the surface wind speed. Unlike Jacobson and Kaufman(2006) who found up to 8% reduction in wind speed due toaerosol particles and the associated surface cooling and in-creased atmospheric stability, there is a difference in howdust influences wind speed due to its contrasting effects onradiation and atmospheric stability between day and night.Although dust-induced changes of the 24-h averaged surfacewind speed is found to be small over the WAM region fromour simulations, the diurnal variation of surface wind speedis significantly (95% statistic significant based on the Stu-dent’s t-test) reduced by∼10%. Overall, the change in di-urnal wind speed leads to a∼8% increase of dust emissionsfrom ∼110 Tg/month to∼118 Tg/month, providing a posi-tive feedback mechanism on how dust influences the WAMclimate.
Atmos. Chem. Phys., 11, 1879–1893, 2011 www.atmos-chem-phys.net/11/1879/2011/
C. Zhao et al.: Radiative impact of mineral dust on monsoon precipitation variability 1891
This study underscores the importance of including dustradiative effects in simulating the monsoon precipitation overthe WAM region. Both dust SW and LW radiative effectsare critical to assess the dust impact on precipitation, par-ticularly for the diurnal cycle of precipitation, but dust LWradiative effect was not always included in previous stud-ies (e.g., Konare et al., 2008). Although Kim et al. (2010)has demonstrated the significance of dust impact on diurnalcycle of precipitation, they used an atmospheric general cir-culation model with relatively coarse horizontal resolution(2◦
×2.5◦) and inaccurate simulation of the diurnal cycle ofprecipitation. Using a regional model, WRF-Chem, with rel-atively high horizontal resolution (36×36 km2) that yieldsa better simulation of the monsoon precipitation, this studyprovides stronger evidence that dust affects the diurnal cy-cle of WAM precipitation. Our study further highlights thedelicate balance between daytime and nighttime response ofatmospheric stability and precipitation to dust, its sensitivityto solar absorptivity of dust, and how these factors influencethe overall dust-induced change of WAM precipitation. Morelaboratory and field studies are needed to improve the charac-terization of dust SW absorption properties. In addition, dustSW absorption properties used in different modeling stud-ies should be documented clearly for proper model-to-modelcomparisons.
Finally, several caveats should be noted in this study. First,dust can induce changes in diabatic heating in the atmosphereand surface. Depending on the strength and spatial distribu-tion (both vertical and horizontal) of the changes, the mon-soon circulation may change and influence the WAM pre-cipitation. These effects cannot be fully simulated using aregional modeling framework because the same atmosphericlateral boundary conditions and SST lower boundary con-ditions are used in the simulations with and without dust.To fully investigate the potential effects of dust on monsooncirculation, a GCM should be used or lateral boundary con-ditions simulated by a GCM with and without dust shouldbe used in the regional experiments. Second, although dusteffect on stratiform cloud microphysics (i.e., indirect effectof dust) is included in our simulations, it is not a focus ofour analysis, since convective precipitation dominates dur-ing the WAM season (generating over 90% of precipitationin the simulations). Dust effects on convective cloud andprecipitation are not represented in the convective parame-terization. In addition, dust aerosols can only be activatedto cloud condensation nuclei (CCN) in the Lin microphysicsscheme in this study, but dust can also be activated as icenuclei (IN) to influence clouds and precipitation (e.g., De-Mott et al., 2003, 2010). We intend to address these issues infuture studies of dust effects to further elucidate the relativeimpacts of dust direct and indirect effects on monsoon pre-cipitation. Last, the dust impact on the diabatic heating andhence the atmospheric stability is evident, however, the dust-induced changes of diurnal amplitude, diurnal phase (negli-gible in this study), and total amount of WAM precipitation
may be sensitive to the cloud microphysics and convectiveschemes, which is beyond the scope of this study.
Acknowledgements.This study is supported by the Departmentof Energy Earth System Modeling Program Investigations onthe Magnitude and Probabilities of Abrupt Climate TransitionS(IMPACTS) project. This research used computing resourcesfrom the National Energy Research Scientific Computing Center,which is supported by the Office of Science of the US Departmentof Energy under Contract No. DE-AC02-05CH11231. PacificNorthwest National Laboratory is operated for the US DOE byBattelle Memorial Institute under contract DE-AC06-76RLO3301830.
Edited by: N. Riemer
References
Ackermann, I. J., Hass, H., Memmesheimer, M., Ebel, A.,Binkowski, F. S., and Shankar, U.: Modal aerosol dynamicsmodel for Europe: Development and first applications, Atmos.Environ., 32, 2981–2999, 1998.
Balkanski, Y., Schulz, M., Claquin, T., and Guibert, S.: Reevalua-tion of mineral aerosol radiative forcings suggests a better agree-ment with satellite and AERONET data, Atmos. Chem. Phys., 7,81–95,doi:10.5194/acp-7-81-2007, 2007.
Barndard, J. C., Fast, J. D., Paredes-Miranda, G., Arnott, W. P.,and Laskin, A.: Technical Note: Evaluation of the WRF-Chem“Aerosol Chemical to Aerosol Optical Properties” Module usingdata from the MILAGRO campaign, Atmos. Chem. Phys., 10,7325–7340,doi:10.5194/acp-10-7325-2010, 2010.
DeMott, P. J., Sassen, K., Poellot, M. R., Baumgardner, D., Rogers,D. C., Brooks, S. D., Prenni, A. J., and Kreidenweis, S. M.:African dust aerosols as atmospheric ice nuclei, Geophys. Res.Lett., 30, 1732, 4 pp.,doi:10.1029/2003GL017410, 2003.
DeMott, P. J., Prenni, A., Liu, X., Kreidenweis, S. M., Petters,M. D., Twohy, C. H., Richardson, M. S., Eidhammer, T., andRogers, D. C.: Predicting global atmospheric ice nuclei distribu-tions and their impacts on climate, Proc. Natl. Acad. Sci. USA,107, 11217–11222,doi:10.1073/pnas.0910818107, 2010.
Dentener, F., Kinne, S., Bond, T., Boucher, O., Cofala, J., Generoso,S., Ginoux, P., Gong, S., Hoelzemann, J. J., Ito, A., Marelli, L.,Penner, J. E., Putaud, J.-P., Textor, C., Schulz, M., van der Werf,G. R., and Wilson, J.: Emissions of primary aerosol and pre-cursor gases in the years 2000 and 1750 prescribed data-sets forAeroCom, Atmos. Chem. Phys., 6, 4321–4344,doi:10.5194/acp-6-4321-2006, 2006.
Diner, D. J., Beckert, J., Reilly, T., Bruegge, C., Conel, J., Kahn, R.,Martonchik, J., Ackerman, T., Davies, R., Gerstl, S., Gordon, H.R., Muller, J. P., Myneni, R. B., Sellers, P. J., Pinty, B., and Ver-straete, M.: Multi-angle Imaging SpectroRadiometer (MISR) in-strument description and experiment overview, IEEE T., Geosci.Remote, 36, 1072–1087, 1998.
Diner, D. J., Abdou, W. A., Bruegge, C. J., Conel, J. E., Crean, K.A., Gaitley, B. J., Helmlinger, M. C., Kahn, R. A., Martonchik, J.V., and Pilorz, S. H.: MISR aerosol optical depth retrievals oversouthern Africa during the SAFARI-2000 dry season campaign,Geophys. Res. Lett., 28, 3127–3130, 2001.
www.atmos-chem-phys.net/11/1879/2011/ Atmos. Chem. Phys., 11, 1879–1893, 2011

1892 C. Zhao et al.: Radiative impact of mineral dust on monsoon precipitation variability
Dubovik, O. and King, M. D.: A ?exible inversion algorithm forretrieval of aerosol optical properties from sun and sky radiancemeasurements, J. Geophys. Res., 105, 20673–20696, 2000.
Dubovik, O., Holben, B., Eck, T. F., Smirnov, A., et al.: Vari-ability of absorption and optical properties of key aerosol typesobserved in worldwide locations, J. Atmos. Sci., 59, 590–608,2002.
Fast, J. D, Gustafson Jr., W. I., Easter, R. C., Zaveri, R. A., Barnard,J. C., Chapman, E. G., and. Grell, G. A.: Evolution of ozone,particulates, and aerosol direct forcing in an urban area using anew fully-coupled meteorology, chemistry, and aerosol model, J.Geophys. Res., 111, D21305,doi:10.1029/2005JD006721, 2006.
Fast, J., Aiken, A. C., Allan, J., Alexander, L., Campos, T., Cana-garatna, M. R., Chapman, E., DeCarlo, P. F., de Foy, B., Gaffney,J., de Gouw, J., Doran, J. C., Emmons, L., Hodzic, A., Hern-don, S. C., Huey, G., Jayne, J. T., Jimenez, J. L., Kleinman,L., Kuster, W., Marley, N., Russell, L., Ochoa, C., Onasch, T.B., Pekour, M., Song, C., Ulbrich, I. M., Warneke, C., Welsh-Bon, D., Wiedinmyer, C., Worsnop, D. R., Yu, X.-Y., and Zaveri,R.: Evaluating simulated primary anthropogenic and biomassburning organic aerosols during MILAGRO: implications for as-sessing treatments of secondary organic aerosols, Atmos. Chem.Phys., 9, 6191–6215,doi:10.5194/acp-9-6191-2009, 2009.
Ghan, S., Laulainen, N., Easter, R., Wagener, R., Nemesure, S.,Chapman, E., Zhang, Y., and Leung, R.: Evaluation of aerosol di-rect radiative forcing in MIRAGE, J. Geophys. Res., 106, 5295–5316, 2001.
Ginoux, P., Chin, M., Tegen, I., Prospero, J. M., Holben, B.,Dubovik, O., and Lin, S.: Sources and distributions of dustaerosols simulated with the GOCART model, J. Geophys. Res.,106, 20225–20273, 2001.
Grell, G. A., Peckham, S. E., Schmitz, R., and McKeen, S. A., Frost,G., Skamarock, W. C., and Eder, B.: Fully coupled “online”chemistry within the WRF model, Atmos. Environ., 39, 6957–6976, 2005.
Gustafson, W. I., Chapman, E. G., Ghan, S. J., Easter, R. C.,and Fast, J. D.: Impact on modeled cloud characteristicsdue to simplified treatment of uniform cloud condensation nu-clei during NEAQS 2004, Geophys. Res. Lett., 34, L19809,doi:10.1029/2007GL0300321, 2007.
Holben, B. N., Eck, T. F., Slutsker, I., Tanr’ e, D., Buis, J. P.,Stezer, A., Vermote, E., Reagan, Y., Kaufman, U. J., Nakajima,T., Lavenu, F., Jankowiak, I., and Smirnov, A.: AERONET-Afederated instrument network and data archive for aerosol char-acterization, Rem. Sens. Environ., 66, 1–16, 1998.
Holben, B. N., Tanre, D., Smirnov, A., ECK T. F., Slutsker,I., Abuhassan, N., Newcomb, W. W. Schafer, J. S., Chatenet,B., Lavenu, F., Kaufman, Y. J., Vande Castle, J., Setzer, A.,Markham, B., Clark, D., Frouin, R., Halthore, R., A. KarneliO’Neill, N. T., Pietras, C., Pinker, R. T., Voss, K., and Zibordi,G.: An emerging ground-based aerosol climatology: Aerosoloptical depth from AERONET, J. Geophys. Res., 106, 12067–12097, 2001.
Hsu, N. C., Tsay, S., King, M., and Herman, J. R.:Deep blue retrievals of Asian Aerosol Properties duringACE-Asia, IEEE Tran. Geos. Remote Sen., 44, 3180,doi:10.1109/TGRS.2006.879540, 2006.
Huffman, G. J., Adler, R. F., Morrissey, M., Bolvin, D. T., Curtis, S.,Joyce, R., McGavock, B., and Susskind, J.: Global Precipitation
at One-Degree Daily Resolution from Multi-Satellite Observa-tions, J. Hydrometeor., 2(1), 36–50, 2001.
Huffman, G. J., Adler, R. F., Bolvin, D. T., Gu, G., Nelkin, E.J., Bowman, K. P., Hong, Y., Stocker, E. F., and Wolff, D.B.: The TRMM Multi-satellite Precipitation Analysis: Quasi-Global, Multi-Year, Combined-Sensor Precipitation Estimates atFine Scale. J. Hydrometeor., 8(1), 38–55, 2007.
Iacono, M. J., Mlawer, E. J., Clough, S. A., and Morcrette, J.-J.:Impact of an improved longwave radiation model, RRTM. onthe energy budget and thermodynamic properties of the NCARcommunity climate mode, CCM3. J. Geophys. Res., 105, 14873–14890, 2000.
Jacobson, M. Z. and Y. J. Kaufman: Wind reductionby aerosol particles, Geophys. Res. Lett., 33, L24814,doi:10.1029/2006GL027838, 2006.
Kaufman, Y. J., Tanre, D., Remer, L. A., Vermote, E. F., Chu, A.,and Holben, B. N.: Operational remote sensing of troposphericaerosol over land from EOS moderate resolution imaging spec-troradiometer, J. Geophys. Res., 102, 17051–17067, 1997.
Kim, K.-M., Lau, W. K.-M., Sud, Y. C., and Walker, G. K.: In-fluence of aerosol-radiative forcings on the diurnal and sea-sonal cycles of rainfall over West Africa and Eastern At-lantic Ocean using GCM simulations. Clim. Dyn., 35, 115–126,doi:10.1007/s00382-010-0750-1, 2010.
Konare, A., Zakey, A. S., Solmon, F., Giorgi, F., Rauscher, S., Ibrah,S., and Bi, X.: A regional climate modeling study of the effect ofdesert dust on the West African monsoon. J. Geophys. Res., 113,D12206,doi:10.1029/2007JD009322, 2008.
Lau, K. M., Kim, K. M., Sud, Y. C., and Walker, G. K.: A GCMstudy of the response of the atmospheric water cycle of WestAfrica and the Atlantic to Saharan dust radiative forcing, Ann.Geophys., 27, 4023–4037, 2009,http://www.ann-geophys.net/27/4023/2009/.
Leung, L. R., Kuo, Y. H., and Tribbia, J.: Research Needs and Di-rections of Regional Climate Modeling Using WRF and CCSM,Bull. Am. Meteorol. Soc., 87(12), 1747–1751, 2006.
Levy, R. C., Remer, L. A., Tanre, D., Kaufman, Y. J., Ichoku,C., Holben, B. N., Livingston, J. M., Russell, P. B., andMaring, H.: Evaluation of the Moderate-Resolution Imag-ing Spectroradiometer (MODIS) retrievals of dust aerosol overthe ocean during PRIDE, J. Geophys. Res., 108, D198594,doi:10.1029/2002JD002460, 2003.
Liebmann B. and Smith, C. A.: Description of a Complete (Inter-polated) Outgoing Longwave Radiation Dataset, Bull. Am. Me-teorol. Soc., 77, 1275–1277, 1996.
Martonchik, J. V., Diner, D. J., Kahn, R., and Gaitley,B.: Comparison of MISR and AERONET aerosol opticaldepths over desert sites, Geophys. Res. Lett., 31, L16102,doi:10.1029/2004GL019807, 2004.
McConnell, C. L., Formenti, P., Highwood, E. J., and Harrison,M. A. J.: Using aircraft measurements to determine the re-fractive index of Saharan dust during the DODO experiments,Atmos. Chem. Phys., 10, 3081–3098,doi:10.5194/acp-8-3081-2010, 2010.
McKeen, S. A., Wotawa, G., Parrish, D. D., Holloway, J. S.,Buhr, M. P., Hubler, G., Fehsenfeld, F. C., and Meagher,J. F.: Ozone production from Canadian wildfires duringJune and July of 1995, J. Geophys. Res., 107(D14), 4192,doi:10.1029/2001JD000697, 2002.
Atmos. Chem. Phys., 11, 1879–1893, 2011 www.atmos-chem-phys.net/11/1879/2011/

C. Zhao et al.: Radiative impact of mineral dust on monsoon precipitation variability 1893
Miller, R. L., Tegen, I., and Perlwitz, J.: Surface radiative forcingby soil dust aerosols and the hydrologic cycle, J. Geophys. Res.,109, D04203,doi:10.1029/2003JD004085, 2004.
Miller, M. A. and A. Slingo: The ARM Mobile Facility and itsfirst international deployment: Measuring radiative flux diver-gence in West Africa, Bull. Am. Meteorol. Soc., 88, 1229–1244,doi:10.1175/BAMS-88-8-1229, 2007.
Mlawer, E. J., Taubman, S. J., P. D. Brown, M. J. Iacono and S. A.Clough: RRTM, a validated correlated-k model for the longwave,J. Geophys. Res., 102, 16663–16682, 1997.
Nickovic, S., Kallos, G., Papadopoulos, A., and Kakaliagou, O.: Amodel for prediction of desert dust cycle in the atmosphere, J.Geophys. Res., 106, 18113–18129, 2001.
Prospero, J. M. and Lamb, P. J.: African droughts and dust transportto the Caribbean: Climate change implications, Science, 302,1024–1027, 2003.
Qian, Y, Gustafson, W. I. Jr., Leung, L. Y., and Ghan, S.: Effects ofsoot-induced snow albedo change on snowpack and hydrologicalcycle in western United States based on Weather Research andForecasting chemistry and regional climate simulations, J. Geo-phys. Res., 114, D03108,doi:10.1029/2008JD011039, 2009.
Randerson, J. T., Van der Werf G. R., Giglio, L., Collatz, G. J.,and Kasibhatla., P. S.: Global Fire Emissions Database, Version2 (GFEDv2.1). available online at:http://daac.ornl.gov/fromOak Ridge National Laboratory Distributed Active Archive Cen-ter, Oak Ridge, Tennesse, USA,doi:10.3334/ORNLDAAC/849,2005.
Redelsperger, J. L., Thorncroft, C. D., Diedhiou, A., Lebel, T.,Parker, D. J., and Polcher, J.: African Monsoon MultidisciplinaryAnalysis: An international research project and field campaign,A. Am. Meteorol. Soc., 87, 1739–1746,doi:10.1175/BAMS-87-12-1739, 2006.
Remer, L. A., Kaufman, Y. J., Tanre, D., Mattoo, S., Chu, D. A.,Martins, J. V., Li, R., Ichoku, C., Levy, R. C., Kleidman, R. G.,Eck, T. F., Vermote, E., and Holben, B. N.: The MODIS aerosolalgorithm, products and validation, J. Atmos. Sci., 62, 947–973,2005.
Schell, B., Ackermann, I. J., Hass, H., Binkowski, F. S., and Ebel,A.: Modeling the formation of secondary organic aerosol withina comprehensive air quality modeling system, J. Geophys. Res.,106, 28275–28293, 2001.
Skamarock, W. C., Klemp, J. B., Dudhia, J., Gill, D. O., Barker,D. M., Duda, M. G., Huang, X., Wang, W., and Powers, J. G.:A description of the advanced research WRF version 3, NCARTech. Note, NCAR/TN-475+STR,, Natl. Cent. for Atmos. Res.,Boulder, CO, USA, 8 pp. available online at:http://www.mmm.ucar.edu/wrf/users/docs/arwv3.pdf, 2008.
Slingo, A., Ackerman, T. P., Allan, R. P., Kassianov, E. I., Mc-Farlane, S. A., Robinson, G. J., Barnard, J. C., Miller, M.A., Harries, J. E., Russell, J. E., and Dewitte, S.: Observa-tions of the impact of a major Saharan dust storm on the at-mospheric radiation balance, Geophys. Res. Lett., 33, L24817,doi:10.1029/2006GL027869, 2006.
Solmon, F., Mallet, M., Elguindi, N., Giorgi, F., Zakey, A.,and Konare, A.: Dust aerosol impact on regional pre-cipitation over western Africa, mechanisms and sensitivityto absorption properties, Geophys. Res. Lett., 35, L24705,doi:10.1029/2008GL035900, 2008.
Stockwell, W. R., Middleton, P., Chang, J. S., and Tang, X.:The second generation regional acid deposition model chemicalmechanism for regional air quality modeling, J. Geophys. Res.,95, 16343–16367, 1990.
Sultan, B., Baron, C., Dingkuhn, M., Sarr, B., and Jani-cot, S.: Agricultural impacts of large-scale variability of theWest African monsoon, J. Agr. For. Meteorol., 128, 93–110,doi:10.1016/j.agrformet.2004.08.005, 2005.
Vigaud, N., Roucou, P., Fontaine, B., Sijikumar, S., and Tyteca,S.: WRF/ARPEGE-CLIMAT simulated climate trends over WestAfrica, Clim. Dynam.,doi:10.1007/s00382-009-0707-4, 2009.
Wang, W. and Liu, X.: Evaluating deep updraft formula-tion in NCAR CAM3 with high resolution WRF simulationsduring ARM TWP-ICE, Geophys. Res. Lett., 36, L04701,doi:10.1029/2008GL036692, 2009.
Woodward, S.: Modeling the atmospheric life-cycle and radiativeimpact of mineral dust in the Hadley Centre climate model, J.Geophys. Res., 106, 18155–18166, 2001.
Yoshioka, M., Mahowald, N., Conley, A. J., Collins, W. D., Fill-more, D. W., Zender, C. S., and Coleman, D. B.: Impact of desertdust radiative forcing on Sahel precipitation: relative importanceof dust compared to sea surface temperature variations, vegeta-tion changes and greenhouse gas warming, J. Climate, 16, 1445–1467,doi:10.1175/JCLI4056.1, 2007.
Zaveri, R. A. and Peters, L. K.: A new lumped structure photochem-ical mechanism for large-scale applications, J. Geophys. Res.,104, 30387–30415, 1999.
Zaveri, R. A., Easter, R. C., Fast, J. D., and Peters, L. K.: Modelfor simulating aerosol interactions and chemistry (MOSAIC), J.Geophys. Res., 113, D13204,doi:10.1029/2007JD008792, 2008.
Zhang, Y., Duliere, V., Mote, P. W., Salathe Jr., E. P. : Eval-uation of WRF and HadRM Mesoscale Climate Simulationsover the U.S. Pacific Northwest, J. Climate, 22, 5511–5526,doi:10.1175/2009JCLI2875.1, 2009.
Zhao, C., Liu, X., Leung, L. R., Johnson, B., McFarlane, S. A.,Gustafson Jr., W. I., Fast, J. D., and Easter, R.: The spatialdistribution of mineral dust and its shortwave radiative forcingover North Africa: modeling sensitivities to dust emissions andaerosol size treatments, Atmos. Chem. Phys., 10, 8821–8838,doi:10.5194/acp-10-8821-2010, 2010.
www.atmos-chem-phys.net/11/1879/2011/ Atmos. Chem. Phys., 11, 1879–1893, 2011


![SST-precipitation relationship over the tropical monsoon region, … · 2013. 12. 10. · changing climate [Fig.6] SST-precipitation relationship over the tropical monsoon region,](https://img.pdfslide.us/doc/110x75/5fe7e6f1bbe97b2138439388/sst-precipitation-relationship-over-the-tropical-monsoon-region-2013-12-10.jpg)


![Changes in global monsoon precipitation over the past 56 years · lation. Studying how monsoon rains have changed may provide insight for understanding future changes. [3] Although](https://img.pdfslide.us/doc/110x75/5f4a494c3e417441c847254a/changes-in-global-monsoon-precipitation-over-the-past-56-lation-studying-how-monsoon.jpg)


![Radiative and precipitation controls on root zone …tomo-kumagai.eco.coocan.jp/grl1401.pdfreservoir[Katul et al.,2007].Inthisderivation,surfacerunoffwasneglectedsinceoccurrenceofmeasured](https://img.pdfslide.us/doc/110x75/5cdcaf5088c99399368cdfe1/radiative-and-precipitation-controls-on-root-zone-tomo-katul-et-al2007inthisderivationsurfacerunowasneglectedsinceoccurrenceofmeasured.jpg)