Embed Size (px)
Citation preview

KEY FINDINGS
• The SNEA has promoted a paradigm shift in conservation policy toward not only addressing the effects (direct drivers) of thedeterioration of ecosystems and its biodiversity but also characterizing the causes (indirect drivers) or sociopolitical factorsthat lead to undesirable changes in the "natural capital" of Spain and, ultimately, call into question the future of our humanwellbeing.
• The economic development model followed by Spain in the last 50 years has been shown to be socially and ecologicallyunsustainable. The transition from a production economy system to an acquisition economy has significant impacts onecosystems (Spain uses approximately four times more energy and materials per unit of GDP today than were used in 1960).
• Spain is not self-sufficient in the supply of some provisioning services, currently depending on ecosystems in other countriesfor approximately 30% of these services .
• The Spanish economic model has generated a major impact on the demographic patterns of Spain, favoring urban versusrural areas and the coast versus the interior. The abandonment of rural areas promoted by this model has led to aging andmasculinization of the population, which has a direct impact on the conservation of traditionally managed ecosystems.
• Paradoxically, in the context of the current economic crisis, we have been witnessing variations in the drivers of change,which clearly show that the current economic crisis has had some positive effects on the natural capital of Spain. Thissituation presents novel opportunities for building a new social and economic system that accepts the finite nature of theplanet and its progress based on respect for the biophysical limits of ecosystems.
On a national scale, most of the completed assessments have
focused on explaining the relationship between the state of
ecosystem services and the direct causes (i.e., pressures) of their
degradation. In many cases, other components, such as indirect
drivers of change, have been empirically excluded from such
analyses because their relationships with ecosystem services are
not obvious, and time series data at the scale of assessment are
often absent.
Indirect drivers operate as a result of decisions made by different
stakeholders (e.g., individuals and local groups, industry, private
companies, governments, NGOs) at various levels (local, regional,
national, global). New environmental policies should address all of
these factors as the only effective way to halt the alarming rate of
biodiversity losses and ecosystem degradation. In addition to the
five indirect drivers proposed by the MA (demographic, economic,
socio-political, science and technology, and cultural), the SNEA also
included gender issues, considering that to sustain the current
socioeconomic system, it is essential to recognize that a large
number of jobs, especially in rural areas, are generally performed by
women, which has not been acknowledged.
Although important political efforts have been made to respond
to direct effects (pressures), in most cases, there have been no clear
efforts to address indirect drivers because they would require greater
institutional changes. The main policies aimed at conserving
biodiversity in Spain have mostly been focused on creating
protected areas that promote conservation of the habitats of
threatened species as well as on legislation related to endangered
species (i.e., the National Catalogue of Threatened Species).
However, recent studies have concluded that the components of
biodiversity that ensure the delivery of ecosystem services are
functional diversity and the species diversity of taxonomic groups of
microorganisms, vegetation and invertebrates. The main strategies
for biodiversity conservation do not include the conservation of
these key components that ensure the capacity to deliver ecosystem
services. To resolve this issue, land-use planning decisions should
be made to support previous efforts and guide indirect drivers of
change, such as economic, demographic, cultural and sociopolitical
factors.
Losses of biodiversity and the deterioration of the flows of
certain ecosystem services are a result of numerous drivers acting
synergistically (CDB, 2010). This pattern has been recognized
worldwide based on various publications demonstrating our failure
to meet the 2010 biodiversity targets (Rands et al. 2010). We
represent this undesirable situation (Figure 4.1) as a feedback loop
WHAT ARE THE UNDERLYING CAUSES OF ECOSYSTEM DEGRADATION?
The need to focus on managing the real causes (indirect drivers) and to not only minimize theirimpact (direct drivers)
4
42 Synthesis of key findings
CAP 4.qxd:Maquetación 1 11/04/14 16:36 Página 42

involving a loss of biodiversity, trade-offs among ecosystem services
demanded by urban or rural groups, a decoupling effect between
material and non-material dimensions of human wellbeing, a rapidly
growing trend of responses in recent years and a growing linear trend
of pressures and drivers.
To learn more from these complex relationships and to
scientifically address the nature-society interface, an individual
analysis of the six indirect drivers considered in the SNEA was
initially conducted. Subsequently, the complex interactions
established between these drivers were analyzed. Factor analysis
yielded scatter plots showing all of the study years (Figure 4.2). The
horizontal axis (Factor 1) represents the urban vs. rural
socioeconomic transformation. The vertical axis (Factor 2) is
explained by transformation at the social level of human wellbeing in
43What are the underlying causes of natural capital degradation?
Figure 4.1 Integrative results from conceptual framework in the SNEA. It represents trend evolution of aggregate indices and relationship among the DPSIRcomponents. It was identified a constant linear loss of biodiversity as well as the services it provides (mainly regulating the cultural services associated with ruralareas), while pressures (direct drivers) and causes (indirect drivers) maintain a linear growing trend. The arrow between conservation and the indirect drivers (inlight green) indicates that there are no clear institutional strategies to address the indirect drivers. (Inspired in Butchart et al., 2010).
CAP 4.qxd:Maquetación 1 11/04/14 16:36 Página 43

Spanish society. The first two factors accounted for 68% of the
variability in the data from the 41 indicators used.
Based on these results, four different time periods were
identified in Spain from a socioecological point of view since the
1960s, which can be summarized as follows:
1. From rural to urban (1960s): the abandonment of
traditional agricultural society.
During the 1960s, Spanish society exhibited a clear rural character
based on traditional agrarian production systems. This lifestyle
was linked to ecosystems, and regulating and cultural services
were of great importance in maintaining human wellbeing. The
household represented a system of self-production and
consumption, and its organization rested on a fundamental
complementarity between male-female work. This represents a
key decade in relation to the dramatic changes that occur in the
following decades in the productive structure of the Spanish
economy, mainly as a result of the failure of traditional agrarian
society in favor of the tourism industry, construction and
especially the service sector. During this decade, the myth of
unlimited economic growth of the GDP was introduced. Therefore,
the biophysical constraints on the intensification of provisioning
and cultural services were removed, obviating production
processes based on regulating ecosystem services.
2. Crossing the first threshold (1970-1980s): consolidation of
urban society and a new model of territorial organization in Spain.
Figure 4.2 demonstrates that there are two thresholds of
change, with the first corresponding to the period from the late
1980s-early 1990s. The 1970s were a time of great
abandonment of rural areas, and the final consolidation of
urban society occurred during the 1980s, resulting in a way of
life that was increasingly disconnected from ecosystems. The
growth rate and distribution of the population in an area are
44 Synthesis of key findings
Figure 4.2 Results of a multivariate scatterplot analysis of 40 biophysical, socioeconomic, cultural and sociopolitical indicators. The diagram shows how allof the study years (1961-2009) arranged in five periods explain the evolution of the nature-society interface in Spain from a socio-ecological perspective.
Social transform
ation: life style and environmental educa
tion
Economic transfromation: rural (60-80) and urban (90-00)
1. From rural to urban (1960s): the abandonmentof traditional agricultural society.
2. Crossing the first threshold(1970-1980s): consolidation ofurban society and a newmodel of territorialorganization in Spain.
3. The European integration process (1990s): From a production system to an acquisition economy
4. The great acceleration process(2000s): the fall of thedevelopment model due to itssocio-ecological unsustainability.
FINNANCIAL CRISISA window of opportunity fora new socioeconomic model
CAP 4.qxd:Maquetación 1 11/04/14 16:36 Página 44

two of the main factors driving the demand for ecosystem
services. In Spain, the concentration of the population in large
urban areas and coastal ecosystems is especially evident
(Figure 4.3). Over 80% of the Spanish population lives in
municipalities with more than 10,000 inhabitants. Long-term
projection of the Spanish population identifies a scenario
where natural growth is negative from 2020 onward, and the
population over the age of 64 will double in just 40 years,
accounting for over 30% of the total population.
Following the adoption of the 1978 Constitution, the so-
called State of Autonomies was introduced, corresponding to a
quasi-federal form of state, which established a new model of
territorial organization in Spain based on 17 regions (while
maintaining the divisions into provinces implemented in 1811).
This produced a decentralized administrative state, associated
with important changes in the management of ecosystems.
3. The European integration process (1990s): From a
production system to an acquisition economy
Spain's entry into the European Economic Community (EEC) in
1986 resulted in a significant opening of its economy and a
sharp increase of foreign investment. This led to emergence
from the crisis of the 1970s. The international integration of the
Spanish economy and its growth in European markets paved
the way for a service economy. This process finally consolidated
an acquisition economic model that is currently causing
alarming socio-ecological consequences.
For example, the Spanish economic model over the past five
decades has revealed our special dependence on the production
of ecosystem services. The economy has changed from a
production economy, primarily supported by the sustainable use of
renewable ecosystem services (services associated with supplies
obtained through net primary production), to an acquisition
economy, which is largely based on non-renewable resources
(fossil fuels, minerals) from ecosystems from both Spain and
around the world. Far from diminishing, this dependence has been
increasingly growing since the 1960s with a surprising result: the
Spanish economy used four times more energy and materials per
unit of GDP at 2010 that it used in 1960. That is, we are generating
more goods and services, but we are producing them in a more
inefficient way. Taken together, this situation leads to the
conclusion that losses of agricultural, mining and industrial
production, coupled with the increasing outsourcing of our
economy, make our model especially vulnerable to global crises,
such as the one we have been experiencing over the last five years.
Regarding economic changes, the gross domestic product (GDP)
between 1995 and 2008 at the provincial level shows a similar
trend to the demographic drivers, largely increasing, mainly in
coastal areas and in big cities, such as Madrid (Figure 4.4).
4. The great acceleration process (2000s): the fall of the
development model due to its socio-ecological unsustainability
and a window of opportunity
The second change threshold shown in Figure 4.2 occurred in the
45What are the underlying causes of natural capital degradation?
Figure 4.3 Demographic changes in the population between 1960 and2011, in which the increasing population in coastal areas and emptying ofthe interior provinces with the exception of big cities, such as Madrid,can be observed.
Figure 4.4 Change in the GDP of each province between 1995 and 2008(the percentage of increase or decrease in the value of GDP comparedto 1995 values).
CAP 4.qxd:Maquetación 1 11/04/14 16:37 Página 45
early 2000s, coinciding with the second housing bubble suffered
by the Spanish economy between 1996 and 2007, which had a
particular impact on the Mediterranean coast through the
process of intense coastal urbanization (see Box 3.1). This
"culture of the new rich" marked a fifteen-year economic boom
that was abruptly disrupted by the crisis, beginning in 2007.
Taken together, this state of affairs highlights the growing
unsustainability of the Spanish development model in the way that
goes beyond our territorial and biophysical limits. These processes
are manifested in a gradient that is explained on one side by the
rural abandonment process and on the other by significant land-use
changes (agricultural intensification and urbanization), associated
with a low or no capacity for ecological restoration. This undesirable
situation has serious consequences for the conservation of
ecosystems and its biodiversity and thus their flow of services.
Paradoxically, in the context of the current economic crisis,
the trends of the examined indices reveal that since 2007, we
have witnessed variations in the drivers of change, clearly
showing that the current economic crisis has had some positive
effects on the Spanish natural capital. This result reinforces the
idea that the underlying causes of biodiversity degradation are
the drivers because although the potential response options
have significantly declined in recent years, biodiversity and
some ecosystem services are recovering under this socio-
economic situation. This situation presents opportunities with
which new conservation strategies should be managed in
coordination with policies in other sectors at different
organizational scales and should consider the key components
of biodiversity that guarantee the delivery of ecosystem
services.
46 Synthesis of key findings
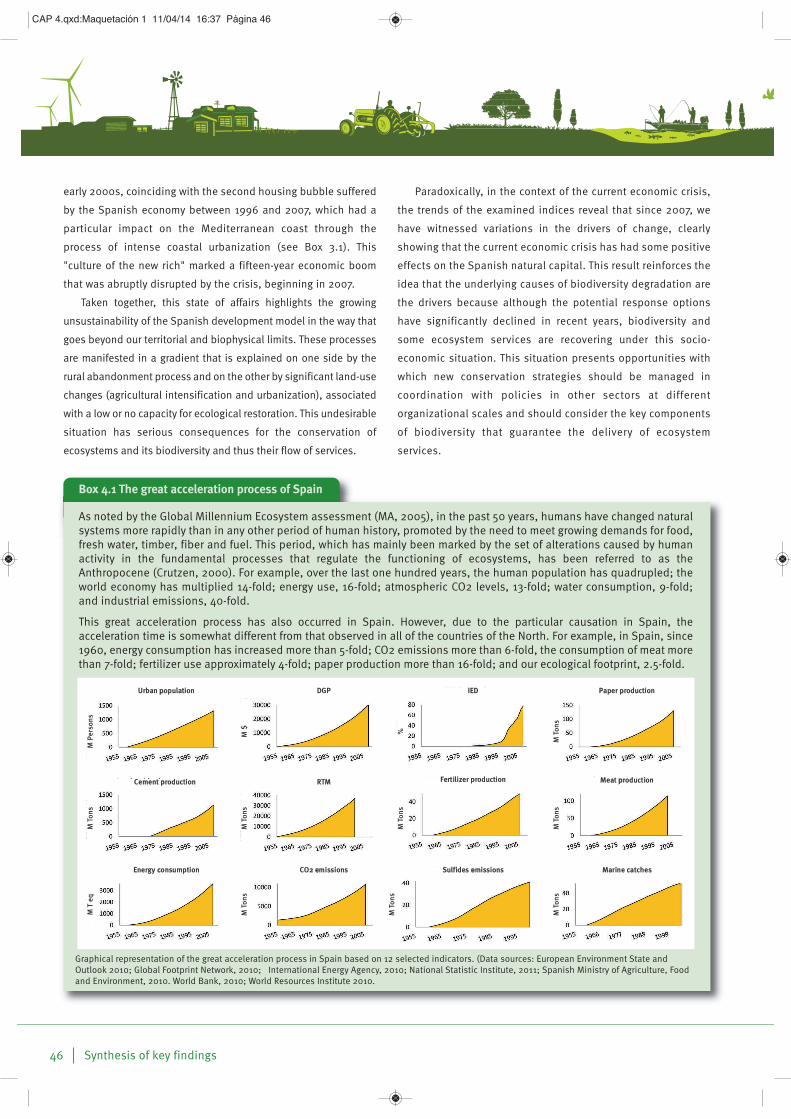
Box 4.1 The great acceleration process of Spain
As noted by the Global Millennium Ecosystem assessment (MA, 2005), in the past 50 years, humans have changed naturalsystems more rapidly than in any other period of human history, promoted by the need to meet growing demands for food,fresh water, timber, fiber and fuel. This period, which has mainly been marked by the set of alterations caused by humanactivity in the fundamental processes that regulate the functioning of ecosystems, has been referred to as theAnthropocene (Crutzen, 2000). For example, over the last one hundred years, the human population has quadrupled; theworld economy has multiplied 14-fold; energy use, 16-fold; atmospheric CO2 levels, 13-fold; water consumption, 9-fold;and industrial emissions, 40-fold.
This great acceleration process has also occurred in Spain. However, due to the particular causation in Spain, theacceleration time is somewhat different from that observed in all of the countries of the North. For example, in Spain, since1960, energy consumption has increased more than 5-fold; CO2 emissions more than 6-fold, the consumption of meat morethan 7-fold; fertilizer use approximately 4-fold; paper production more than 16-fold; and our ecological footprint, 2.5-fold.
Graphical representation of the great acceleration process in Spain based on 12 selected indicators. (Data sources: European Environment State andOutlook 2010; Global Footprint Network, 2010; International Energy Agency, 2010; National Statistic Institute, 2011; Spanish Ministry of Agriculture, Foodand Environment, 2010. World Bank, 2010; World Resources Institute 2010.
Urban population
M Persons
M $ %
M Tons
M Tons
M Tons
M Tons
M Tons
M T eq
M Tons
M Tons
M Tons
DGP IED Paper production
Energy consumption CO2 emissions Sulfides emissions Marine catches
Cement production RTM Fertilizer production Meat production
CAP 4.qxd:Maquetación 1 11/04/14 16:37 Página 46