Embed Size (px)
Citation preview

Human DevelopmentResearch Paper
2010/15What are the successful strategiesfor reducing malnutrition among
young children in East Africa?Ibrahim Kasirye

United Nations Development ProgrammeHuman Development ReportsResearch Paper
July 2010
Human DevelopmentResearch Paper
2010/15What are the successful strategiesfor reducing malnutrition among
young children in East Africa?Ibrahim Kasirye

United Nations Development Programme Human Development Reports
Research Paper 2010/15 July 2010
What are the successful strategies for reducing malnutrition among young children
in East Africa?
Ibrahim Kasirye
Author 1 is a PhD candidate at the University of Manchester and a Research Fellow at the Economic Policy Research Centre, Uganda. E-mail: [email protected].
Comments should be addressed by email to the author(s).

Abstract We analyzed the role that health programs played in improving the nutritional status of children aged five years and younger in East Africa during a period when health policies aiming to reduce malnutrition were implemented. We used several waves of Demographic and Health Surveys over the 1992–2006 period for Kenya, Rwanda, Tanzania, and Uganda. Our results show that malnutrition rates fell substantially over the sample period but that some countries then registered reversals. This finding suggests that the implementation of nutrition policies was not consistent. However, the country-level results show that different factors matter in different countries. For example, maternal health is most important in Uganda and Rwanda. Furthermore, different levels of education matter for different countries. For example, in Kenya, only the mother’s post-secondary education is significant, but in other countries, it is important to address generally low education levels to improve child nutritional health. Overall, due to resource constraints, addressing the nutritional health of young children in East Africa will continue to rely on low cost approaches, such as nationwide vaccinations and maternal education, and not on programs like conditional cash transfer schemes, which have proved successful in addressing under-nutrition in wealthy and middle-income countries.
Keywords: East Africa, Child Malnutrition. JEL classification: I12, I18, J13, O15, 057. The Human Development Research Paper (HDRP) Series is a medium for sharing recent research commissioned to inform the global Human Development Report, which is published annually, and further research in the field of human development. The HDRP Series is a quick-disseminating, informal publication whose titles could subsequently be revised for publication as articles in professional journals or chapters in books. The authors include leading academics and practitioners from around the world, as well as UNDP researchers. The findings, interpretations and conclusions are strictly those of the authors and do not necessarily represent the views of UNDP or United Nations Member States. Moreover, the data may not be consistent with that presented in Human Development Reports.

1
I. Introduction
The goal of reducing child malnutrition is far from being fulfilled in most developing
countries. Over the past 20 years, some developing countries have registered only
minimal changes for this critical aspect of child health. According to the 2009 United
Nations Children’s Fund (UNICEF) report on tracking child and maternal nutrition,
the proportion of stunting among children aged five years and below in the developing
world decreased from 40% to 29% between 1990 and 2008 (UNICEF, 2009).1 SSA is
one of the regions that made the least progress, having reduced its proportion of
stunted children only from 38% to 34% during the same period. 2
As a result,
policymakers and researchers are increasingly concerned about such poor indicators
of child health in an era of increased social spending. This concern is based on the
understanding that a poor level of child nutrition can have detrimental effects on long-
term human development. At the individual level, nutritional inadequacy has long-
lasting effects, especially on children’s cognitive development (Alderman et al. 2009)
and adulthood labor productivity; this effect is particularly significant for children
from poor households (Strauss, 1986; Behrman, 1993).
It is not surprising, then, that attempts to address child malnutrition have taken on an
important role in policy, particularly through the implementation of the Poverty
Reduction Strategy Papers (PRSPs). However, the types of policies that are
implemented have varied greatly, especially in SSA. For example, some countries
1 Stunted is defined as more than two standard deviations below the population standard for height for age. 2 The large decline in under nutrition in Asia was attributed to progress made in China where stunting rates reduced from 33% in 1990 to 11% by 2005 (UNICEF, 2009). In terms of policies, China increased the proportion of household consuming adequate amounts of iodized salts from 51% in 1990 to 95% by 2005. Related, china increased coverage of piped water and improved sanitation to 72% and 65% of the population respectively.

2
(e.g., Uganda and Ethiopia) have provided nutritional supplements for children at risk
of malnutrition, and others have relied on nutritional information campaigns and
broader access to maternal and child health care. Furthermore, countries that
implemented similar policies registered different impacts on child nutrition; although
some countries reduced malnutrition, the other countries failed. For example,
countries such as Eritrea, Ethiopia, Uganda, and Tanzania have significantly reduced
the levels of stunting in young children since the 1990s while Kenya and Niger
registered an increase in stunting rates during the same period (UNICEF, 2009). Thus,
it is important to understand the ways that different African nations have addressed
this crucial aspect of child health and the impact, if any, of the various policies and
programs that aimed to reduce the high rates of under-nutrition in Africa.
In this paper, we examine the programs and interventions that were implemented to
improve the nutritional status of children aged five years and below in East Africa.
There are important reasons for focusing on this age group. First, there is evidence
that under-nutrition in young children contributes more to a country’s overall disease
burden than under-nutrition in adolescents, for example. According to Glewwe and
Miguel (2008), in SSA, nutritional problems in children aged 0-4 years contribute
twice as much to the overall burden of disease than they do in children aged 5-14
years. Second, various nutritional studies based on cross-sectional data have showed
that, on average, young children in developing countries start to fall behind the
developed country standard at approximately three months old; they continue to fall
further behind until the age of around 24 months, when they stabilize but never fully
catch up (World Heath Organization, 1995; Martorell and Habicht, 1986).

3
Consequently, almost all of the damage of nutritional deficiency happens at a young
age.
Third, as earlier noted, nutritional status in young children is significantly related to
their subsequent cognitive development and labor productivity. For example,
Alderman et al., (2009) show that in Northwest Tanzania, malnourished children are
more likely to delay entry into school and perform worse at school than their
counterparts of normal nutrition status. Finally, most of the large-scale surveys that
are comparable across countries, such as the Demographic and Health Surveys (DHS),
only collect nutritional information for children below five years old. Given that we
use similar datasets in this study, we restrict our analysis to the nutritional status of
young children aged 0-59 months and do not include all children (i.e., under 18 years
of age).
For this study, we focused on four East African countries: Kenya, Rwanda, Tanzania,
and Uganda. We chose these specific countries not because of their geographical
proximity, but because they include a disproportionate share of SSA’s population of
malnourished children. According to UNICEF, 24 countries account for 80% the 195
million children, aged five years and below, who are globally classified as stunted
(UNICEF, 2009). Of these 24 countries, 10 are in SSA. Worse still, in 2008, the
combined population of undernourished children in the three East African countries of
Kenya, Tanzania, and Uganda was eight million, which represents 21% of the SSA
total. Although Rwanda is among the 24 countries globally with the largest population
of young children stunted, the country nevertheless has the highest stunting rate in
East Africa of 51% in 2008. Therefore, East Arica’s high prevalence of stunting in

4
combination with a large population of young children with inadequate nutrition is a
unique case to study the determinants of child nutritional status.
The overall objective of the study is to assess the progress that East African countries
made in improving children’s nutritional health during the 1990s and 2000s.
Specifically, the study examined the impact that access to health care services (e.g.,
vaccinations and maternal use of health facilities for childbirth) has on child
nutritional status and whether such health policies became more significant over time.
For the four countries, we used anthropometric indicators to classify young children
aged five years and below into three possible states of nutritional health: normal
nutritional status, malnourished or severely stunted and therefore at risk of
abnormality. We employed the order probit regression approach for 11 sets of DHS
surveys in East Africa from 1992 to 2006. This time span includes the periods before
and after the aforementioned health-related PRSPs policies were implemented. DHS
datasets are arguably particularly suited to our task because they collect information
on a child’s health status and his household and community characteristics. More
precisely, we have detailed information on children and mothers’ use of and access to
health care services.
In the following section, we describe some of the national programs that were
implemented in developed and developing countries to improve the nutritional health
of children. This section is followed by a review of the literature on the key
determinants of young children’s nutritional health in developing countries. Section 4
outlines the East African context and some of the policies in the PRSPs that target
child nutritional health. Section 5 describes the data and methods employed in the

5
analysis. We present the results obtained of the analysis in Section 6, and in Section 7
we provide the conclusions and implications of the study.
II. Background on policies targeting the nutritional health of young children.
Developed and developing countries have used both cash and in-kind transfer
programs to target child nutritional health. For example, the US pioneered cash
transfers that target the nutritional status of young children with the Aid to Families
with Dependent Children (AFDC) cash transfer program, which was operational from
1935 to 1990. This program provided grants to pregnant mothers from low-income
families as an indirect means of reducing low birth weights (Currie and Cole, 1993).
Nonetheless, most public programs that target nutritional health in the USA have been
in-kind rather than cash transfers. The most cited in-kind program is the Special
Supplementary Nutritional Program for Women, Infants, and Children (WIC), which
is a federally-funded and state-run program that provides food and nutritional advice
to pregnant women and to infants and children who are nutritionally-at-risk or from
low-income families. The program started in 1972, and, by 2007, it had enrolled 8
million households and cost US$4 billion per month (Currie, 2008). A number of
authors have shown that the WIC program has had a beneficial impact on child health.
For example, Devaney et al. (1992) showed that the program resulted in substantial
savings on child health expenses. Additionally, Bitler and Currie (2004) showed that
WIC infants are less likely to require treatment in an intensive care unit and that a
pregnant mother’s enrolment in the program reduces the probability of a low birth
weight by as much as 29%.

6
Other in-kind transfer programs in the USA include the Food Stamp Program, the
National School Lunch Program (NSLP) and National School Breakfast Program
(NSBP). The last two programs provide free or subsidized meals in public schools,
and, in the 2007 financial year, 27 million children were enrolled in the NSLP
program at an annual cost of US$6 billion (Currie, 2008). Given that under-nutrition
is not a serious problem in the USA, as in most advanced countries (i.e., compared to
obesity), most evaluations of the above nutritional programs focus on their impact on
quality of diet and obesity. For example, Bhattacharya et al. (2006) used the National
Health and Nutritional Examination Survey (NHANES) III data to show that children
participating in the NSBP significantly have a higher quality of diet, exhibit a higher
intake of specific food groups, especially minerals, and have a lower share of fats and
saturated fats in their total caloric intake.
Developing countries have also used a combination of cash and in-kind transfers to
target child nutritional health. Perhaps the most studied program in developing
countries is the Programa de Educacion, Salud y Alimentacion (PROGRESA-
Oportunidades), which was implemented in rural Mexico to target the nutritional
status of pre-school children and the school enrolment of children aged 6-17 years.
The program started in 1997 with 140,000 households, and, by 2006, at least 25% of
the Mexican population was enrolled in the program. The key components of this
large-scale program are cash transfers to households that are conditional on infants
attending health clinics and older children attending school; participation in the
platican (regular meetings at public health facilities to distribute information on child
health); nutritional supplements for pregnant women, children aged 4-24 months, and

7
older children (aged 2-5 years) who are at risk of malnutrition; and, finally, a
continuous monitoring of children’s growth. Most of PROGRESA- Oportunidades’s
impact has been registered in improved school enrolment, and only a few studies have
found improvements in child health. Behrman and Hoddinot (2005) are among the
few studies to show that PROGRESA’s nutritional supplements significantly reduced
the probability of stunting for children aged 12-36 months. Other studies showed that
children from families in the PROGRESA program had a lower experience of illness
and were also 25% less likely to be anemic (Gertler, 2004).
Most of the other large-scale, conditional cash transfer programs in developing
countries are concentrated in Latin America (e.g., the Red de Protecci n Social
Program in Nicaragua and Families in Action in Columbia). Some countries in SSA
operate much smaller, Social Action Fund (SAF) and Conditional Cash Transfer
(CCT) programs that generally target poverty reduction and school enrolment without
specifically addressing child or nutritional health (Kakwani et al., 2005; Schubert and
Slater, 2006). Cost is a key factor that determines the implementation and extent of
cash and in-kind transfer programs in advanced and developing countries. For
example, the NSBP in the US costs about US$49 per month for each of the seven
million children who receive this grant. On the other hand, the PROGESA program
costs US$1.8 billion annually. Given that many developing countries suffer from
generally higher levels of deprivation coupled with low tax revenues, most such
countries have to rely on external assistance to finance such large-scale programs to
target child nutritional health.

8
III. Literature Review
A number of studies have examined the determinants of child nutritional status in
SSA (e.g., Gewa, 2009; Zivin et al., 2009; Alderman 2007; Alderman et al., 2006;
Madise et al., 1999). For instance, Madise et al. (1999) used DHS surveys between
1990 and 1994 to examine the correlates of child nutrition status for Ghana, Malawi,
Nigeria, Tanzania, Zambia, and Zimbabwe. They found that, based on weight for age
z-scores (WAZ) in children under three years old, different factors have different
impacts across the six countries. For example, mothers’ attainment of secondary
education significantly boosts children’s nutritional health in Ghana, Nigeria, and
Tanzania. On the other hand, the presence of a flushing toilet in the house
significantly influences the WAZ for Ghana, Malawi, Nigeria, and Zambia. However,
for all six countries, the children who suffered from diarrhea two weeks before the
DHS surveys were significantly below the appropriate weights for their age groups.
There have also been attempts to examine the nature, extent, and determinants of child
nutritional status in East Africa. Examples of recent empirical studies include
Kabubo-Mariara et al., (2009), Lawson and Appleton (2007), Alderman (2007),
Ssewanyana (2003), and MacKinnon (1995). Most of the above studies found that
access to health facilities is a significant determinant of child nutrition. For example,
Kabubo-Mariara et al. (2009), using the 1998 and 2003 Demographic and Health
Survey data, showed that maternal education and the use of public health services are
key factors in child nutritional status in Kenya. For Uganda, Lawson and Appleton
(2007) show that incomes are key to the nutritional status of infants—especially
young boys. On the other hand, Alderman (2007) showed that community
9
development programs in Uganda (i.e., programs that provide vaccines, vitamin
supplements, and de-worming medicines to households) improved the nutritional
status of children under a year old. However, previous research in the sub-region has
been based mainly on national assessments and focused predominantly on selected
countries, notably Kenya and Uganda. Given the heterogeneity of East African
countries, especially in terms of child health policies (described in section four), it is
important to know whether the numerous programs articulated in the PRSPs have
been successful in reducing child under-nutrition.
Apart from the studies that used DHS surveys, there have been smaller surveys that
examined the impact of specific interventions on child nutritional status. Some of
these studies used randomized experiments. For example, Zivin et al. (2009) used the
Academic Model for Prevention and Treatment of HIV/AIDS (AMPATH) data to
examine the impact that providing adults with anti-retroviral (ARVs) therapy has on
child nutritional status. The researchers set up a rural HIV/AIDS clinic in Western
Kenya in 2001 and, in 2004/5, evaluated 775 households of the population that had
access to the clinic. The sample included households without an AMPATH patient,
households with AMPATH patients and receiving ARVs, and households with an
AMPATH patient receiving no ARVs. Zivin et al. (2009) found that the weight of
children aged 0-5 years significantly improved during the period that immediately
followed the initiation of ARVs. However, after more than two years of ARVs, the
nutritional status of children in HIV/AIDS-affected households did not significantly
differ from those in households that were not receiving ARVs.

10
Studies on Kenya have pointed to the importance of maternal education as a key
determinant of nutritional status among young children. For example, Deolalikar
(1996) showed that young children whose mothers have a secondary education are
significantly taller than comparable children whose mothers have no schooling. Other
studies on Kenya showed that a higher maternal education level may be linked to
childhood obesity. For example, Gewa (2009) showed that higher maternal education
is significantly associated with over-nutrition/obesity in children aged three to five
years. According to the authors, higher maternal education is associated with a higher
income and a corresponding access to “high status foods”, which are rich in sugars
and saturated fats.
Alderman et al. (2006) also used a small survey of about 900 households from North-
western Tanzania to examine the importance of income for child nutritional status.
Using four waves of the Kagera Health and Development Survey (KHDS), conducted
between 1991 and 1994, the authors found that household income growth is an
important determinant of weight for age for children five years and below. In addition,
they find that specific community factors, such as proximity to a motorable road,
maintenance of the community road, and the proportion of children who are
vaccinated, improve children’s nutritional status. However, Alderman et al. (2006)
found, based on simulations of these significant factors, that sustained income growth
alone cannot help Tanzania to meet its nutrition MDG target. Tanzania aims to halve
the proportion of malnourished children by 2015, and this result can only be achieved
by a sustained per capita income growth of about 3.0 per annum, universal community
access to motorable roads, 95% child vaccination rates and the education of the heads
of households.

11
IV. The East African context
The four countries in this study are part of the East African Community (EAC), a
regional grouping with a population of 127 million persons that had a Gross Domestic
Product (GDP) of US$70 billion in 2008 (IMF, 2009).3
In comparison to all of Africa,
the four countries account for 13% of the continent’s population, but only 5.5% of the
GDP. Among the four countries, Kenya is the most economically advanced, and it
accounts for 44% of the regional GDP even though its population share is only 29%.
Despite Kenya’s relative economic advantage, the country’s human development is
fairly similar to that of its regional neighbors. In the 2009 Human Development Index,
Kenya was ranked 147th out of 182 countries; Tanzania was ranked 151st, Uganda
157th, and Rwanda 167th (UNDP, 2009). Kenya’s relatively low human development
status may be partly explained by its high rate of income poverty and inequality
compared to that of its neighbors. Between 2000 and 2006, Rwanda had the highest
proportion of poverty in its population (60.3%), followed by Kenya (52%), and
Uganda and Tanzania had similar rates of head-count poverty of approximately 37%
of the population (UNDP, 2009).
Similarly, key health indicators vary widely in East Africa. Table one shows the
indicators for child nutritional status, child mortality, and HIV/AIDS prevalence rates
for the four countries compared to the rest of SSA. For children aged five years and
below, Rwanda has the highest rates of child malnutrition or stunting (45%), followed
by Uganda and Tanzania (at about 38%); Kenya exhibited the lowest levels of child
stunting, 30%, in 2003. Additionally, with the exception of Rwanda for stunting rates, 3 Burundi is the fifth country is this regional grouping but it is not considered in this study due to data limitations, which implies that its most recent level of under nutrition and population of children suffering from under nutrition are unknown.

12
other East African countries have stunting and wasting rates that are comparable to
the rest of SSA. These four countries only have rates that are much lower than the
SSA average for underweight status among children. On the other hand, for nutrition
health indicators for infants aged one year or less, Uganda exhibits some of the worst
indicators. For example, Uganda’s wasting rate of 9% is more than three times that of
Tanzania (2.2%). Similarly, the rate of underweight infants in Uganda exceeds that of
any other East African country. The table also shows that the stunting rates of infants
(aged 0-12 months) are much lower than the overall stunting rates for all young
children (aged 0-59 months) in the four countries.
There are also wide variations in other child health indicators across the four countries.
For instance, Uganda’s infant mortality rate (IMR) is similar to Kenya’s but much
higher than Tanzania’s. Indeed, Tanzania reduced IMR by 34% between 1999 and
2007/08 (TDHS, 2008), which puts it among the few African countries likely to meet
the MDG target of reducing child mortality rates by two-thirds. Table one also shows
that the HIV/AIDS prevalence rates in East Africa are about 6%, except in Rwanda,
which has a commendably low rate of HIV/AIDS prevalence compared to its
neighbors. Tanzania has made some recent progress by reducing the prevalence rate
from 7.0% in 2003/04 to 5.7% in 2007/08 (TACAIDS et al., 2008). Overall, the
HIV/AIDS prevalence rates in Eastern and Southern Africa are about three times the
corresponding rates for West and Central Africa.

13
The large variance in key health indicators may be partly attributed to the differences
in healthcare financing across the four countries. In Rwanda, citizens pay for public
health services, and the country has a thriving community-based social health
insurance scheme (“mutuelle de santé”) that covered at least 27% of the employed and
self-employed population in 2007 (IMF, 2008). Similarly, Tanzania operates a cost-
sharing system in government health facilities, although the country has an exemption
and waiver system for poor and vulnerable groups. Kenya also charges user fees at
public health facilities, although the country has a long-established National Health
Insurance Fund for employees. On the other hand, in 2001, Uganda abolished user
fees at all public health facilities and a number of studies show that this particular
change more than doubled health care utilization in the country (Deininger and
Mpuga, 2005; Ssewanyana et al., 2004). We cannot directly relate a country’s health
status to overall national spending on health or to citizens’ out-of-pocket expenditures
Health indicator Uganda Kenya Rwanda Tanzania AllDHS Round 2006 2003 2005 2004/05
Child nutrition status (0-59 months of age)Height for-age (stunting) 38.1 30.6 45.5 37.7 38.0 40.0 36.0
Weight-for-height (wasting) 6.1 4.8 3.9 3.0 9.0 7.0 10.0Weight-for-age (underweight) 15.9 19.1 22.5 21.8 28 28 28
Infants nutrition status (0-12 months of age) 4
Height for-age (stunting) 15.7 13.1 19.3 17.7Weight-for-height (wasting) 9.1 5.7 5.1 2.2
Weight-for-age (underweight) 17.8 10.6 14.5 13.1Child mortality
Infant mortality rate 76 77 86 58 89 80 97Under five mortality rate 137 115 152 91 148 123 169
2004/05 2003 2005 2007/08HIV/AIDS Prevalence (15-49 years) 6.4 6.7 3 5.7 5 7.8 2.6
Female 7.5 8.7 3.6 6.6Male 5 4.6 2.3 4.6
reported at the SSA and other regional levels.
Demographic and Health Survey 2003; and the Rwanda Demographic and Health Survey 2005.
3 No regional indicators for child nutrition are reported for infants aged 1 year or less. Also no gender disaggregated HIV/AIDS prevalence rates are
4 The nutrition status indicators for infants are based on the author's calculations from the respective DHS surveys.
2 The SSA regional indicators are from: the 2009 State of World Report by UNICEF (UNICEF, 2008).
Table 1: Selected health indicators in East Africa, 2003-2008East Africa Sub Saharan Africa (2007) 2,3
Survey 2004/05; Tanzania Demographic and Health Survey 2004/05; Tanzania HIV/AIDS and Malaria Sero-Behavioural Indicator Survey 2007/08; Kenya
Eastern and Southern Africa
West and Central Africa
Sources: The country indicators are from the published DHS reports, specifically, Uganda Demographic and Health Survey 2006; Uganda HIV/AIDS
HIV/AIDS Prevalence

14
for health. However, the Kenyan government attributes its poorer citizens’ limited use
of public health services to user fees (Government of Kenya, 2008).
Most of the policies in the sub-region that aim to improve child health in general and
nutritional status in particular have focused mainly on expanding vaccination
coverage, improving maternal health, and providing of safe drinking water. However,
some countries have implemented slightly different programs. For example, Rwanda
targeted neo-natal child health by focusing on improving maternal healthcare services
and recruiting more midwives for rural health facilities (IMF, 2008). Tanzania has
emphasized that expanding access to safe water is one of the key programs for
improving child health (United Republic of Tanzania, 2000). At the same time,
despite their geographical proximity, the four countries have wide socioeconomic and
geo-political differences. For example, Rwanda and Uganda have experienced
prolonged periods of civil conflict that could ultimately harm child nutritional health.
Uganda was one of the first developing countries to produce a PRSP in 1997. With
regard to child nutrition, the 1997 Uganda Poverty Eradication Action Plan (PEAP)
focused on providing mothers with food supplements and nutritional education
(Government of Uganda, 1997). Starting in 1998, Uganda implemented a World
Bank-funded community growth promotion project (the Nutrition and Early Child
Development Project) that covered 39 of the country’s 55 districts. This project
provided grants to the community that could be used to purchase dietary supplements
for malnourished children and to finance nutrition awareness campaigns to encourage
breast-feeding. The initial evaluations of the program pointed to improvements in
children’s nutritional status, but only during the first year of life as earlier noted. In

15
addition, since 2002, Uganda has implemented the child days initiative (Government
of Uganda, 2005). These are bi-annual nationwide immunization and de-worming
campaigns, which are held at non-medical facilities (e.g., primary schools).4
Despite
these relative successes, the overall national indicators of child nutritional status in
Uganda remained unchanged from 1995 to 2006 (UBoS and Macro International Inc.,
2007).
The East African countries have set different goals and strategies for improving
maternal health. The 2000 Kenyan PRSP set the target of increasing the proportion of
mothers who give birth in a health facility from 56% in 2000 to 70% by 2008 (IMF,
2005). Uganda also aimed to increase the proportion of childbirths supervised by
qualified health professionals from 38% to 50% between 1997 and 2004 by expanding
lower-level health facilities to include maternity units (Government of Uganda, 1999).
The state also provided birthing kits, called “mama bags”, to expecting mothers in the
poorest districts to encourage them to use health facilities during childbirth
(Government of Uganda, 2005).5
On the other hand, Rwanda increased the share of
midwives assigned to rural health facilities as part of the country’s strategy to draw
mothers to health facilities (IMF, 2008).
Other maternal health programs have focused on increasing women’s access to family
planning services. This initiative is based on the understanding that a smaller family
size improves the overall quality of childcare and, consequently, nutritional health.
4 During child days, children who have missed any vaccinations are provided with a catch up service while de-worming is undertaken for children from 1 to 14 years. 5 Mama bags are birthing kits with basic supplies to ensure safe and hygienic child delivery. They contain examination gloves, disposable scalpels, chux pads, disposable tower, gauze pads, bulb syringe, water proof sheet and lubricant gels. The 2007/08 Annual Uganda health performance reports an increase in the number of women giving birth in health facilities due to the free provision of these kits (Government of Uganda, 2008).

16
Indeed, most governments in East Africa provide free contraception to women who
request it, and recent trends point to an increasing use of family planning services. For
example, the use of modern family planning in Rwanda increased from 4% in 2000 to
10% by 2005; however, this rate remained below the pre-genocide level of 13%,
which was registered in 1992 (IMF, 2008). The East African governments have also
addressed child health through programs outside the health sector. For example, the
2000 PSRPs for Tanzania and Rwanda sought to increase the proportion of the rural
population that has access to safe drinking water from 48% in 2000 to 55% by 2005.
At the same time, Rwanda sought to reduce the proportion of the population without
latrines from 5% to 0% by 2012. On the other hand, Uganda was one of the first
developing countries to offer free primary education as a strategy to boost overall
educational attainment among women.
In summary, although these East African countries have implemented a number of
programs to address poor child nutritional health, the problem persists. In the next
section, we describe the methods that we used to analyze the determinants of child
nutritional health in East Africa.
V. Methods
A The Data
This paper used DHS data for Kenya, Rwanda, Tanzania, and Uganda. The DHS
surveys are part of a global program supported by the United States Agency for
International Development (USAID) and are conducted by Macro International Inc. in
17
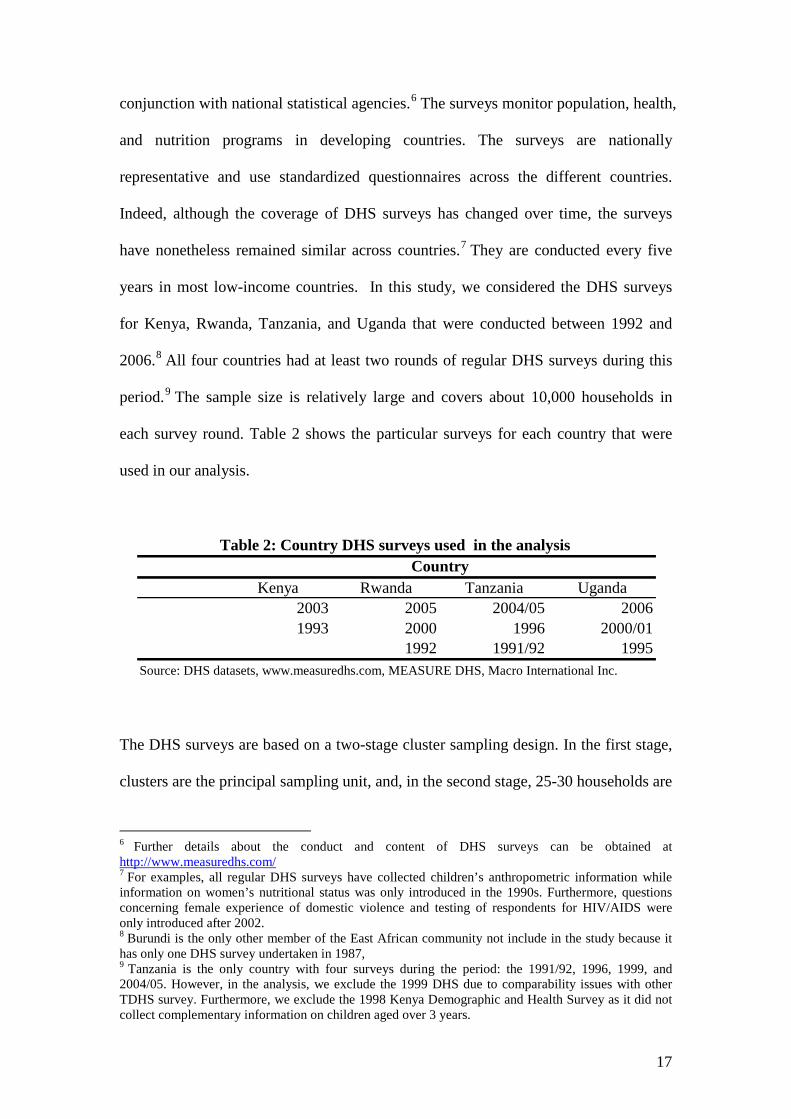
conjunction with national statistical agencies.6 The surveys monitor population, health,
and nutrition programs in developing countries. The surveys are nationally
representative and use standardized questionnaires across the different countries.
Indeed, although the coverage of DHS surveys has changed over time, the surveys
have nonetheless remained similar across countries.7 They are conducted every five
years in most low-income countries. In this study, we considered the DHS surveys
for Kenya, Rwanda, Tanzania, and Uganda that were conducted between 1992 and
2006.8 All four countries had at least two rounds of regular DHS surveys during this
period.9
The sample size is relatively large and covers about 10,000 households in
each survey round. Table 2 shows the particular surveys for each country that were
used in our analysis.
The DHS surveys are based on a two-stage cluster sampling design. In the first stage,
clusters are the principal sampling unit, and, in the second stage, 25-30 households are
6 Further details about the conduct and content of DHS surveys can be obtained at http://www.measuredhs.com/ 7 For examples, all regular DHS surveys have collected children’s anthropometric information while information on women’s nutritional status was only introduced in the 1990s. Furthermore, questions concerning female experience of domestic violence and testing of respondents for HIV/AIDS were only introduced after 2002. 8 Burundi is the only other member of the East African community not include in the study because it has only one DHS survey undertaken in 1987, 9 Tanzania is the only country with four surveys during the period: the 1991/92, 1996, 1999, and 2004/05. However, in the analysis, we exclude the 1999 DHS due to comparability issues with other TDHS survey. Furthermore, we exclude the 1998 Kenya Demographic and Health Survey as it did not collect complementary information on children aged over 3 years.
Kenya Rwanda Tanzania Uganda2003 2005 2004/05 20061993 2000 1996 2000/01
1992 1991/92 1995Source: DHS datasets, www.measuredhs.com, MEASURE DHS, Macro International Inc.
Table 2: Country DHS surveys used in the analysis Country

18
randomly selected from each cluster. Each DHS survey is composed of at least two
questionnaires: the household and individual questionnaires. The household
questionnaire covers the characteristics of the household (e.g., demographic
composition, assets held and access to public services). The individual questionnaire,
which mainly targets individuals in the reproductive age category (15-49 years),
collects information on birth histories and anthropometric indicators for women and
their children under the age of five. The individual questionnaire also covers women’s
background characteristics and contraceptive use and their husbands’ background
characteristics. In our estimations, we used household weights to account for the
survey design, especially clustering and stratification, when we calculated the means
of the samples used. As indicated by ORC Macro International—the agency that
supervises the collection of DHS surveys, the use of sampling weights is inappropriate
during regression estimations. 10
Therefore, we did not apply any weights to our
ordered probit estimations.
B Ordered probit estimation
In our estimations, we aimed to identify the key determinants of malnutrition over
time across the four East African countries. Furthermore, we investigated how these
various determinants have changed for malnourished and severely stunted children.
We distinguished between these two categories of nutritional status because, in all of
the countries considered, about 30% of children suffer from some form of
malnutrition. Consequently, the failure to distinguish between the different categories
of malnutrition would hide very useful information, especially regarding the progress 10 For details, see the following website http://www.measuredhs.com/help/Datasets/sampling_weights.htm

19
made to reduce extreme stunting. We employed the ordered-probit model to account
for differences in the severity of malnutrition because the measure of stunting is
ordinal. Furthermore, this approach does not assume that various states of stunting are
equally spaced, but ranks them from the best nutritional status to the worst. Previous
studies have employed a similar framework to examine malnutrition in an
environment with high levels of under-nourishment (e.g., Pal, 1999, in India).
Consequently, we categorize children as normal (i.e., having a height for age z-score
of greater than minus two), malnourished (i.e., having a z-score of greater than minus
three but less than minus two), or severely stunted (i.e., having a z-score of less than
minus three). The distributions for all of the children in the sample, based on the
above categorization, are presented in Table 3.
Malnourished At risk of abnormality RowHAZ>-2 -3<HAZ<-2 HAZ<-3 Total
Kenya (All) 68.2 20.1 11.6 1001993 66.8 20.6 12.5 1002003 69.6 19.7 10.8 100
Rwanda (All) 55.1 25.4 19.5 1001992 51.6 27.2 21.2 1002000 57.8 23.6 18.7 1002005 54.9 26.2 18.8 100
Tanzania (All) 59.3 25.3 15.4 1001991/92 57.0 26.0 17.0 100
1996 56.7 25.4 17.8 1002005 63.2 24.5 12.3 100
Uganda (All) 63.1 22.8 14.2 1001995 61.8 23.2 15.0 100
2000/01 61.7 23.5 14.8 1002006 68.7 20.2 11.1 100
Child Nutrition Status
Source: Author's calculations from the DHSs for Kenya, Rwanda, Tanzania, and Uganda
Table 3: Extent of child under nutrition in East Africa, for children aged 5 years or less (%)

20
Formally, the order probit model is based on a latent regression variable ( *iS ), which
is a linear function of observable characteristics ( X ) and boundary parameters (µ ).
This variable can be represented as follows:
(1) ii XS εβ += '*
where β represents regression coefficients, and iε is the error term. The latent
variable is related to child nutritional status, defined by the various categories of
stunting ( Jj ,...,0= ), as follows:
(2) 0=iS if 0* ≤iS (if a child has a normal nutritional status)
=1 if 10 * µ≤≤ iS (if a child is malnourished)
=2 if *1 iS≤µ (if a child is at risk for abnormality),
where 'µ are the threshold parameters to be estimated with the regression coefficients
)(β . Following Pal (1999), we obtained the following marginal effects:
(3) ββµφβµφδ
δ*)]()([
][Pr '1 kjkj
k
j XXX
cellob−−−= − ,
where φ is the standard normal function.
C. Dependent Variable
It is conventional for studies that examine the effects of child nutritional health to
consider nutritional status (as measured by anthropometric indicators) up to a child’s

21
fifth birthday, even though further anthropometric information may be available on
the child at an older age. For example, Currie and Thomas (1995) examined the
impact of Head Start, which is a US federally-funded matching grant that targets the
education and health of poor children. They used a panel sample of 6,283 young
women from the National Longitudinal Survey of Youth (1979-1990) to examine the
impact of Head Start on young children’s immunization and nutritional status. Despite
the authors’ access to the newest anthropometric information on the school-going
children, they nevertheless used the height for age z-scores that were closest to the
children’s fifth birthdays. This approach is used because, as mentioned in the
introduction, nutritional deficiencies are not easily reversed once a child is over five
years old. Nonetheless, studies in rich and middle-income countries have examined
the effects of programs on the nutritional health of older children. For example,
Daponte (2000) compared the impact of food pantries and food stamps in the US on
the anthropometric measures of children below the age of 12, and the Cebu
longitudinal health survey in the Philippines tracked the nutritional health of infants
into adulthood (Cebu Study Team, 1991).
Researchers studying developing countries also use anthropometric z-scores to
examine child nutritional health, rather than other indicators (e.g., based medical
examinations) for reasons of cost. In surveys like DHS, researchers measure the
height and weight of women and children aged 0-59 months. Due to resource
constraints, the collection of these anthropometric measures and other background
household information for a national survey can only be conducted once every five
years, and it is more than likely to be externally financed by a donor agency. In more
developed countries, physicians carry out the process of collecting health and
22
nutritional data. For example, during the National Health and Nutrition Examination
Survey (NHANES) in the US, physicians conducted medical examinations and
collected urine and blood samples for laboratory tests. For consistency, the same
teams of physician conducted the medical exam across different sampled areas. Each
round of this survey took 8-10 years to complete (Currie, 2008). For most developing
countries, it is not feasible to finance survey teams for more than a year.
Therefore, we adopted the standardized height for age (HAZ) z-scores for children
aged five years or less as the measure of nutritional status in this study. There is
extensive evidence to show that, for young children, the HAZ measure reflects any
sustained experience of inadequate nutrient intake and untreated illness, which can
result in stunted growth (Keller, 1983; Mosley and Chen 1984). The HAZ z-score is
defined as follows:
(3) r
rhhδ−
,
where h is the observed height of a child in a specific age and gender group, rh is the
median height of the reference population of children in the same gender and age
group, and rδ is the standard deviation of height for the reference population.
Extensive nutritional research has shown that children’s height is only remotely
related to genetic or racial differences (Martorell and Habicht, 1986; WHO, 1985).
Therefore, this study used the population of US children in 2000, as compiled by the
US National Center for Health Statistics, as its reference population (Kuczmarski, et
al., 2002). Following the WHO (1983) recommendations, a child was classified as

23
stunted if the z-scores were less than two standard deviations from the reference
population.
D Other variables
We defined a young child as a child aged 0-59 months. The DHS surveys only
collected nutritional information for this age group, and there are important reasons
for focusing on young children, which are highlighted in the introduction of this study.
We included a number of the children’s characteristics in our calculations. For
instance, our models take into account children’s demographic information, including
information on gender and age. We included the age of the child, which was squared
to capture any nonlinearity arising from age. Gender was included because previous
research showed that boys are more likely to be malnourished than girls (Ssewanyana,
2003). The other child-level indicators that we included are the child’s birth order and
whether the child is a twin. These two variables show the extent of competition
between children for household resources.
We considered a number of household variables. First, given that DHS surveys did
not solicit information on income, we used an asset index to stand in for household
wealth. Like previous studies that used DHS surveys (e.g., Filmer and Pritchett, 2000;
Sahn and Stifel, 2003; Ssewanyana and Younger, 2008), our study used factor
analysis to construct the asset index.11
11 The following household assets are included in the index: having transport means (either a motor cycle or car); having a radio, TV, and refrigerator; havening access to piped water; having a non latrine toilet; the floor material used for constructing the household; and the household’s head education in years.
DHS surveys also recorded household sources
of water, which allowed us to identify four variables that indicate whether a
24
household used piped water, a public standpipe, a borehole, and/or a protected well or
spring. Water sources are important given evidence in the sub region which showed
that more technologically advanced water systems e.g. bore holes do not always lead
to better household health due to congestion (Ssewanyana et al, 2006). The use of
open water sources was the reference category. Regarding toilet facilities, we
considered whether a household has access to a flush toilet (the most technologically
advanced toilet facility) or a traditional latrine. We also included a number of
variables related to the child’s mother, given the mother’s primary role as caregiver.
We considered the mother’s age at the time her child was born and her marital status.
Most importantly, we included the mother’s level of educational attainment.
A number of variables related to healthcare use in the DHS surveys are choice
variables, and therefore any attempt to include them in regression models would raise
endogeneity concerns. Thus, we created district averages based on the year a child
was born for all of the choice variables, which included whether a mother had at least
one tetanus vaccination during pregnancy, whether the mother had at least one pre-
natal visit during pregnancy, whether the mother had birthing assistance during
childbirth, and whether the child received any or all vaccinations.
Likewise, we avoided endogenous variables in our estimations by creating
cluster/community averages for the variables related to a mother’s use of modern
contraception and her knowledge of re-hydration therapies; these averages were
conditional on the mother in question having given birth in the past five years.
Previous studies using DHS data, such as Kabubo-Mariara et al. (2009), employed a
similar mechanism to deal with potential endogeneity issues. In total, we studied data

25
on over 52,000 children below the age of five from the four countries. Table 4
presents the means of the variables used for the combined sample and for the
individual countries.
As Table 4 shows, female children made up at least 50% of our sample. Similarly,
most of the children in our sample had a number of siblings; the average birth order in
our sample was 3.9, and the highest in Uganda was 4.1. We found a limited use of
flush toilets. This figure was highest in Kenya, where about 6% of the children
resided in households with flush toilets. A substantial proportion of the mothers in our
sample never had any education (28% for the entire sample), and Rwanda had the
largest proportion of illiterate mothers (35%). With regard to the household asset
index, we found that Kenyan children enjoy a higher welfare status compared to
children in the other three East African countries. In terms of access to health services,
most of the children resided in districts with relatively high coverage for any
vaccinations; however, the coverage rates for all recommended vaccinations were
much lower, especially in Uganda. Similarly, most mothers used prenatal care
(combined average 77%), but only a small proportion gave birth under the guidance
of qualified health personnel (35%). There is minimal variation in the means for
access to health services across the four countries, with the exception of the use of
modern contraception. About one-third of women in Kenya, compared to only 9% of
Rwandan women, have ever used modern contraception.

26
VI. Ordered probit results
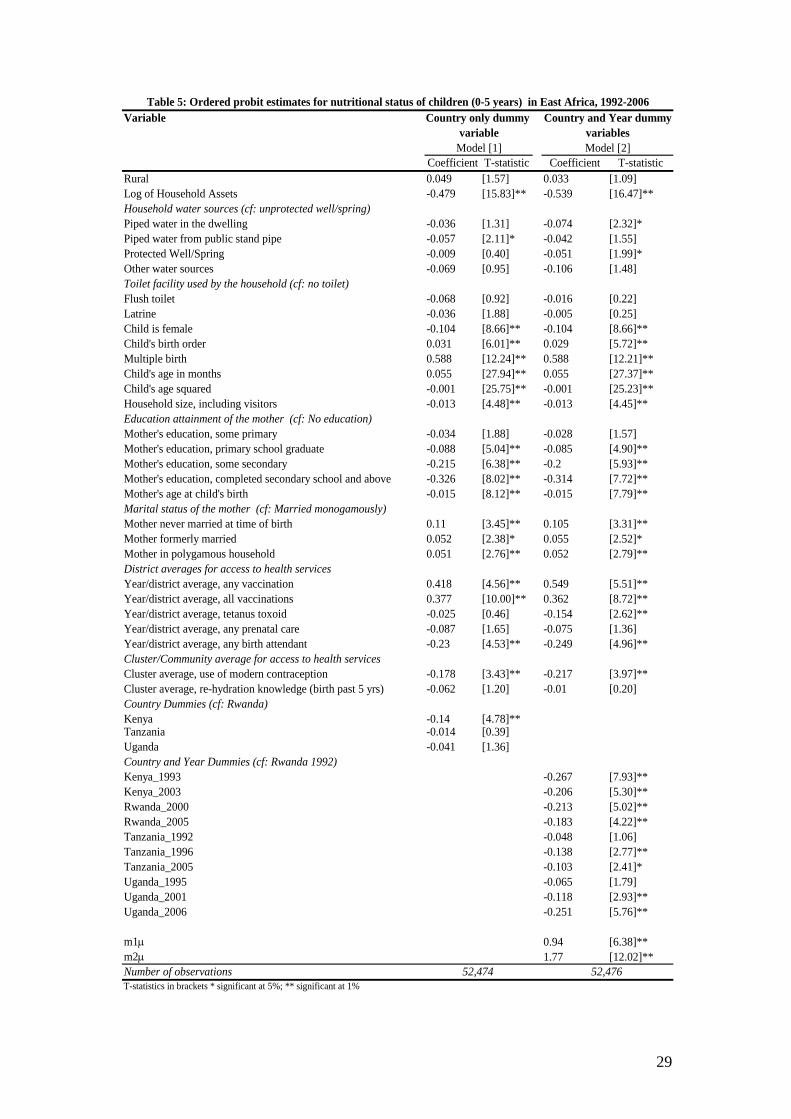
Table 5 shows the ordered probit estimates for the four countries combined. In Model
1, we only included the country dummy variables and used Rwanda as the excluded
option, but in Model two we included both the country and survey year dummy
variables. We used STATA’s svyoprobit command to make our estimations; we used
All countriescombined Kenya Rwanda Tanzania Uganda
Height for Age z-score (HAZ) -1.06 -1.34 -1.07 -1.70 -1.56Rural 0.86 0.86 0.88 0.81 0.90Log of Household Assets Index 0.32 0.41 0.26 0.33 0.33Source of household waterPiped water in the dwelling 0.14 0.20 0.10 0.21 0.03Piped water through a public stand pipe 0.09 0.05 0.20 0.06 0.04Protected Well/Spring 0.54 0.45 0.33 0.58 0.79Surface water 0.19 0.18 0.38 0.13 0.12Other Water sources 0.01 0.03 0.00 0.02 0.01Type of toilet facilityFlush toilet 0.02 0.06 0.01 0.01 0.01Latrine 0.75 0.74 0.67 0.83 0.76Other toilet facility 0.16 0.21 0.13 0.16 0.23Child's own characteristicsGender of the child is female 0.50 0.50 0.50 0.50 0.50Birth Order 3.93 3.79 4.02 3.80 4.14Child is a twin 0.02 0.02 0.02 0.03 0.02Age of the child in months 27 29 28 27 25Age of the child squared 1,030 1,110 1,096 1,030 896Education attainment of the motherMother's education, no schooling 0.28 0.16 0.35 0.29 0.27Mother's education, some primary 0.27 0.18 0.35 0.15 0.41Mother's education, primary school graduate 0.36 0.44 0.21 0.52 0.21Mother's education, primary school graduate 0.05 0.09 0.06 0.01 0.08Mother's education, completed secondary school and above 0.05 0.13 0.03 0.02 0.04Mother's age at child's birth 27 27 29 27 26Marital status of the motherMother never married at time of birth 0.04 0.06 0.03 0.05 0.03Mother formerly married 0.08 0.07 0.11 0.08 0.08Mother in polygamous household 0.17 0.14 0.09 0.20 0.25District averages for access to health servicesYear/district average, any vaccination 0.92 0.93 0.96 0.93 0.86Year/district average, all vaccinations 0.49 0.54 0.63 0.47 0.33Year/district average, tetanus toxoid 0.81 0.88 0.72 0.86 0.77Year/district average, any prenatal care 0.77 0.89 0.93 0.52 0.87Year/district average, any birth attendant 0.35 0.43 0.24 0.38 0.38Community/Cluster averagesCluster average, use of modern contraception 0.15 0.28 0.09 0.14 0.15Cluster average, rehydration knowledge (birth past 5 yrs) 0.87 0.76 0.87 0.94 0.84
Number of observations 52,486 9,324 13,608 17,905 11,648
Table 4: Means of the variables used in the analysis, by countryCountry

27
the cluster as the principal sampling unit (PSU) and applied household weights. Only
the statistically significant variables in our estimations are discussed below. In Model
1, the statistically significant variables include household asset holding, access to a
public standpipe, the child’s gender, the mother’s educational attainment, vaccination
coverage, and the mother’s access to health facilities for child birth. A positive
coefficient implies that the particular variable increases a child’s risk for severe
stunting (Category 2), and a negative coefficient suggests that the variable can
improve a child’s nutritional status. For instance, we found that the variables of
household wealth status, access to a public standpipe, mother’s education attainment,
and mother access to health facilities have a negative effect on a child’s risk for
abnormalities that result from malnutrition before the age of five. On the other hand,
we found that the number of a child’s siblings, increased age, and vaccination
coverage increase a child’s risk for abnormalities resulting from under-nutrition.
Table 5 shows that most of the indicators related to the children themselves are
significantly related to the severity of malnutrition. For instance, female children are
less likely to be either malnourished or severely malnourished than male children.
Additionally, the severity of malnutrition increases with age but at a decreasing rate;
this finding is indicated by the significance of the squared variable for a child’s age. A
child’s birth order is also significant; older siblings face a higher risk of malnutrition
than new born children. Finally, we found that children with multiple siblings
significantly suffer from malnutrition, which suggests that children in larger families,
in all four countries, face increased competition for scarce nutritional resources.
Furthermore, the mothers’ characteristics, especially educational attainment, are
important for reducing malnutrition. Column 1 of Table 5 shows that when a mother

28
has some primary-level education, the severity of the child’s malnutrition is
significantly reduced. It should also be noted that the size of the education variables
increases with higher maternal educational attainment. A mother’s attainment of a
secondary or higher level education significantly reduces the severity of her child’s
malnutrition compared to the severity of malnutrition for a child whose mother either
attained some secondary-level education or graduated from primary school.
29
Variable
Coefficient T-statistic Coefficient T-statisticRural 0.049 [1.57] 0.033 [1.09]Log of Household Assets -0.479 [15.83]** -0.539 [16.47]**Household water sources (cf: unprotected well/spring)Piped water in the dwelling -0.036 [1.31] -0.074 [2.32]*Piped water from public stand pipe -0.057 [2.11]* -0.042 [1.55]Protected Well/Spring -0.009 [0.40] -0.051 [1.99]*Other water sources -0.069 [0.95] -0.106 [1.48]Toilet facility used by the household (cf: no toilet)Flush toilet -0.068 [0.92] -0.016 [0.22]Latrine -0.036 [1.88] -0.005 [0.25]Child is female -0.104 [8.66]** -0.104 [8.66]**Child's birth order 0.031 [6.01]** 0.029 [5.72]**Multiple birth 0.588 [12.24]** 0.588 [12.21]**Child's age in months 0.055 [27.94]** 0.055 [27.37]**Child's age squared -0.001 [25.75]** -0.001 [25.23]**Household size, including visitors -0.013 [4.48]** -0.013 [4.45]**Education attainment of the mother (cf: No education)Mother's education, some primary -0.034 [1.88] -0.028 [1.57]Mother's education, primary school graduate -0.088 [5.04]** -0.085 [4.90]**Mother's education, some secondary -0.215 [6.38]** -0.2 [5.93]**Mother's education, completed secondary school and above -0.326 [8.02]** -0.314 [7.72]**Mother's age at child's birth -0.015 [8.12]** -0.015 [7.79]**Marital status of the mother (cf: Married monogamously)Mother never married at time of birth 0.11 [3.45]** 0.105 [3.31]**Mother formerly married 0.052 [2.38]* 0.055 [2.52]*Mother in polygamous household 0.051 [2.76]** 0.052 [2.79]**District averages for access to health services Year/district average, any vaccination 0.418 [4.56]** 0.549 [5.51]**Year/district average, all vaccinations 0.377 [10.00]** 0.362 [8.72]**Year/district average, tetanus toxoid -0.025 [0.46] -0.154 [2.62]**Year/district average, any prenatal care -0.087 [1.65] -0.075 [1.36]Year/district average, any birth attendant -0.23 [4.53]** -0.249 [4.96]**Cluster/Community average for access to health servicesCluster average, use of modern contraception -0.178 [3.43]** -0.217 [3.97]**Cluster average, re-hydration knowledge (birth past 5 yrs) -0.062 [1.20] -0.01 [0.20]Country Dummies (cf: Rwanda)Kenya -0.14 [4.78]**Tanzania -0.014 [0.39]Uganda -0.041 [1.36]Country and Year Dummies (cf: Rwanda 1992)Kenya_1993 -0.267 [7.93]**Kenya_2003 -0.206 [5.30]**Rwanda_2000 -0.213 [5.02]**Rwanda_2005 -0.183 [4.22]**Tanzania_1992 -0.048 [1.06]Tanzania_1996 -0.138 [2.77]**Tanzania_2005 -0.103 [2.41]*Uganda_1995 -0.065 [1.79]Uganda_2001 -0.118 [2.93]**Uganda_2006 -0.251 [5.76]**
m1µ 0.94 [6.38]**m2µ 1.77 [12.02]**Number of observations
Country only dummy Country and Year dummyTable 5: Ordered probit estimates for nutritional status of children (0-5 years) in East Africa, 1992-2006
variable variables
T-statistics in brackets * significant at 5%; ** significant at 1%
Model [1] Model [2]
52,474 52,476

30
As is the case for traditional probit models, our parameter coefficients for the ordered
probit did not provide any information on the magnitude of a given change. This
information is provided by marginal effects estimations, and Table 6 presents the
marginal effects for the cross-country models for selected policy variables. For
continuous variables (e.g., household wealth status), the marginal probit suggested
that, given a unit change in the explanatory variable with the other variables evaluated
at the mean, there would be either an increase or decrease in the probability that a
child would be placed in a particular category of malnutrition (i.e., normal, under-
nourished, or severely stunted). For binary variables, the marginal probits indicated a
decrease (or increase) in the probability that a given binary variable would take on a
value of one. The tables show the marginal values for the different categories of
malnutrition, and a child aged five years and below of normal nutritional status is used
as the base. In an earlier draft of this paper, we studied children aged 0-36 months; for
this restricted sample, neither the marginal values nor the levels of significance
differed much from the results reported here, for children aged 0-59 months.

31
We found that, among the variables for access to public goods, shown in Model 1,
only household access to piped water from a public stand pipe significantly affects the
risk of under-nutrition. In particular, the marginal value of -0.033 suggests that if a
child is resident in a household with access to a public stand pipe, his probability of
being malnourished is reduced by 3.3 percentage points. The availability of public
stand pipe also reduces the probability of a child being severely stunted by 5.7
percentage points. For maternal educational attainment, Model 1 shows that a higher
educational attainment reduces stunting by 1.7 to 17.2 percentage points, depending
on the education level.
Stunted Severely stunted Stunted Severely stunted Household water sources Piped water in the dwelling -0.027 -0.048 -0.044 -0.077Piped water from public stand pipe -0.033 -0.057 -0.024 -0.043Protected Well/Spring -0.010 -0.018 -0.028 -0.049Other water sources -0.038 -0.067 -0.059 -0.101Toilet facility used by the household Flush toilet -0.037 -0.066 -0.009 -0.016Latrine -0.019 -0.035 -0.003 -0.005Education attainment of the mother Mother's education, some primary -0.017 -0.031 -0.013 -0.024Mother's education, primary school graduate -0.049 0.085 -0.043 -0.076Mother's education, some secondary -0.109 -0.180 -0.096 -0.159Mother's education, completed secondary school and above -0.172 -0.268 -0.152 -0.241District averages for access to health services Year/district average, any vaccination 0.194 0.422 0.299 0.720Year/district average, all vaccinations 0.223 0.498 0.196 0.427Year/district average, tetanus toxoid -0.014 -0.025 -0.088 -0.147Year/district average, any prenatal care -0.045 -0.079 -0.052 -0.090Year/district average, any birth attendant -0.129 -0.209 -0.127 -0.206Cluster/Community average for access to health servicesCluster average, use of modern contraception -0.099 -0.164 -0.118 -0.192Cluster average, re-hydration knowledge (birth past 5 yrs) -0.029 -0.052 -0.005 -0.010Kenya -0.090 -0.151Tanzania -0.050Uganda -0.089Country and Year Dummies (cf: Rwanda 1992)Kenya_1993 -0.195 -0.298Kenya_2003 -0.163 -0.256Rwanda_2000 -0.163 -0.255Rwanda_2005 -0.146 -0.233Tanzania_1992 -0.026 -0.047Tanzania_1996 -0.126 -0.204Tanzania_2005 -0.103 -0.171Uganda_1995 -0.036 -0.063Uganda_2001 -0.112 -0.184Uganda_2006 -0.183 -0.282
Table 6: Marginal probabilities for selected policy variables
Notes: The marginal effects are estimated for only key policy variables and are obtained using equation 3. The coefficients in bold indicate that the estimated effect is statistically significant at the 5% level as detailed in Table 5
Nutrition category (Normal is the base) Nutrition category (Normal is the base)Country only dummies [Model 1] Country and year dummies [Model 2]

32
Regarding other key policy variables, Model 1 shows that children from districts
where a higher proportion of mothers give birth under the supervision of health
professionals are significantly less likely to be malnourished. Specifically, a more
widespread use of maternal health services in a district reduces the risk of stunting by
12.9 percentage points and reduces the risk of severe stunting by 20.9 percentage
points. This variable stands in for the availability and use of maternal health services
for childbirth. Therefore, the results suggest that children from areas where mothers
are more likely to use health facilities have significantly better nutritional status.
On the other hand, the results of the variable “any vaccination” coverage were
contrary to our expectations. In particular, we found that the children from areas with
higher rates of “any vaccination” coverage are significantly more stunted. As Table 4
indicates, most children have received some form of vaccination, but only a few have
completed all of the required vaccinations. For all of the countries combined, a child’s
completion all of the required vaccinations also significantly increases his risk of
malnutrition. We believe that this combined model may capture some country-specific
and year effects and that the completion of all vaccinations does not, in itself, increase
the severity of child malnutrition. Other community-level factors that significantly
reduce the severity of malnutrition include the proportion of women in a community
who use modern contraception. In terms of actual country indicators, Model 1 shows
that the probability of child being stunted drops by 9 percentage points if the child is
in Kenya, and the corresponding probability for severe stunting is 15.1 percentage
points.

33
In Model 2, we included both country and year dummy variables to examine the
trajectory of children’s nutritional status in the four countries since 1992. We selected
Rwandese children in 1992 as the base category. We found that, on average, the
probability of a child being stunted drops by 19.5 percentage points if the child was
resident in Kenya in 1993. On the other hand, the same residence compared to
Rwandese children in 1992 reduced the probability of a child being severely stunted
by 29.8 percentage points. The marginal values for Kenya also reveal that young
children in the country had better nutritional health in 1993 than they did in 2003. In
Rwanda, although the probability of children being severely stunted was lower in
2005 than in 1992, the probability of any severe category of under-nutrition was
higher in 2005 than in 2000. Since 2001, Uganda appears to have made consistent
progress in reducing malnutrition compared to the base category of. Given the
overwhelming significance of these year and cohort variables, we concluded that,
relative to Rwandese children in 1992, most children in East Africa have achieved
better nutritional health over time.
Although it is informative, the cross-country model can mask important trends and
their significance. For example, it is possible that maternal education matters in some
countries and not others depending on the national level of illiteracy. Consequently,
we estimated country-specific ordered probit models. Tables 7, 8, 9, and 10 show the
ordered probit estimates for Kenya, Rwanda, Tanzania, and Uganda, respectively. In
each country, we estimated a combined model and a separate survey year model. In
the discussion below, we focus on the policy variables of safe water and sanitation,
maternal education, vaccination, and maternal access to health services.

34
The tables show that the significant variables differ widely between the countries and
over time. First, some sanitation sources do significantly reduce the risk of various
forms of under-nutrition. In particular, the presence of an improved sanitation source
(latrine) reduces the probability of child stunting in Rwanda and, to limited extent, in
Kenya in 1993. On a related point, we found that water sources, with the exception of
Tanzania’s, do not consistently contribute to reducing the risk of under-nutrition. In
Tanzania (Table 9), the variables of piped water in a dwelling and access to a
protected well or spring significantly reduced the severity of malnutrition in 1992 and
2005, but not in 1996.
Second, whereas Table 5 shows that maternal education was important in the
combined model, a different picture emerges at the country level. For Kenya, only
some secondary education significantly reduced the probability of stunting and the
risk of severe stunting. Similarly, for Rwanda, maternal attainment of some secondary
education had an impact on stunting risk, but only in 1992 and 2000. For Tanzania,
maternal attainment of some primary education reduced the probability of a child
being either stunted or severely stunted up to 1996, but, from then on, only secondary
school attainment had an impact. No consistent picture emerged for Uganda because
maternal attainment of some secondary education was significant only in 1995, and
post-secondary schooling was significant in 2000. Other maternal characteristics that
differ across the countries include a mother’s age when she gives birth. This variable
is most consistent in Uganda, where, for the 1995-2006 period, children with older
mothers had a lower probability of being stunted or severely stunted. We obtained
similar results for maternal age for Kenya, Rwanda, and, to a limited extent, Tanzania.
The above results suggest that early childbirth significantly increases the risk of

35
under-nutrition among children; this variable is also closely associated with school
dropouts and, consequently, lower maternal educational attainment.
As noted above, the indicator for “any vaccination” coverage significantly increased
the severity of malnutrition in Tanzania and Uganda, but not in Rwanda. On the other
hand, in all four countries, districts with higher coverage rates for “all recommended
vaccinations” reported significantly reduced malnutrition. Indeed, it appears that
Tanzania and Uganda drove the significance of these variables, as recorded in Table 5.
Overall, the results suggest that receiving some vaccinations does not reduce the risk
of malnutrition; consequently, receiving only some vaccinations may be just as bad as
receiving none. This result suggests that vaccination programs aimed at reducing
malnutrition will be more effective if they target children who have not received the
recommended number of inoculations. The results regarding access to other health
services also vary across countries. For example, maternal receipt of tetanus toxoid
inoculations appears to have been important in the early 1990s. Furthermore, maternal
use of health facilities, for both prenatal care and childbirth, improved children’s
nutritional status in Uganda and Rwanda.
Finally, contrary to the picture that the cross-country estimations provided, most of
the country models do not show any significant year effects. For Kenya, the estimates
in Table 7 show that children were not significantly better off in 2003 compared to
1993. Similarly, although Rwanda’s results show a general improvement in nutritional
status in 2000 and 2005 compared to 1992, the particular results are nevertheless not
significant. The results suggest that Uganda only made improvements to child
nutritional status in 2005; however, these results have a weak significance at the level
36
of 10%. Indeed, it is only Tanzania that appears to have recorded a significant
reduction in malnutrition between 1992 and 2005. Consequently, the above within-
country trends suggest that these countries have only made minimal progress in
reducing the severity of national under-nutrition.
VII. Conclusions and implications
This study examined the determinants of child nutritional status in East Africa, a
region that accounts for a disproportionate share of the global and SSA population of
undernourished children aged five years and under. Using 11 nationally representative
surveys of 52,000 young children, we found that, compared to the worst-affected
children in 1992, children in most countries made some modest progress toward better
nutritional health. However, a number of countries have stalled or even reversed the
tide of reducing malnutrition, as happened in Kenya between 1993 and 2003.
Additionally, vaccinations reduce children’s susceptibility to illness and, consequently,
are important for nutritional health. This result suggests that efforts to reduce
malnutrition should place more emphasis on ensuring that all children receive the
recommended inoculations for their age groups. Most countries in East Africa have
implemented nation-wide vaccination days, called child days.
The large impact of mothers’ educational attainment on child nutritional health
suggests that post-primary education has an increasingly large payoff. Previously, in
keeping with the millennium development goals, education policy in East Africa
focused on universal primary education, and countries such as Uganda and Kenya
have managed to sustain primary school enrollments of over 90%. However, the

37
above results indicate that this initiative will have only a small impact on child
nutritional status and that universal secondary education would have a much larger
impact. However, guaranteeing post-secondary education does not seem feasible, at
least in the medium-term, given the costs and efforts these countries have undertaken
in the struggle to reduce primary school dropouts.
The results also highlight the importance of maternal access to and use of health
facilities for childbirth. As highlighted by previous authors, the nutrition status of
young children is heavily influenced by the health status of mothers during pregnancy
and while breast feeding (Horton et al., 2008; Behrman et al., 2004). However, it
remains puzzling that women in SSA actively use pre-natal clinics but fail to use
health facilities in childbirth. Nonetheless, the implementation of incentive programs
like those that Uganda has piloted (i.e., providing birthing kits to pregnant women)
appears to be increasing women’s confidence to use health facilities. However, most
of these initiatives are still driven by donor projects and are yet to be integrated fully
into national health ministries.
It is also important to consider whether low-income countries can implement national
programs that target nutritional health like those in the US and middle-income
countries in Latin America. Limited resources and capabilities make it inconceivable
for any of the four East African countries to implement large-scale programs for
nutritional health similar to the WIC program in the US or the PROGRESA-
Oportunidades program in rural Mexico. Apart from the recurrent costs of running
such interventions (e.g., the WIC program costs US$49 per participant per month12
12 Bitler and Currie (2004).
),

38
most low-income countries lack the personnel and infrastructure required to initiate
such programs on a national scale. For example, in Uganda, about 35% of the
approved health posts in public health facilities remain vacant (Government of
Uganda, 2008) and public health services are in some cases of low quality (Kappel et
al., 2005). Thus, any attempt to initiate an intervention like the WIC program in a
country like Uganda would face the problem of inadequate numbers of qualified
health personnel.
Also, previous cross country studies examining malnutrition point to the importance
of incomes if the MDG of halving under nutrition is to be attained (e.g. Alderman et
al., 2003). Without sustained growth in real household incomes—as has been the case
in most of East Africa, the alternative is to provide some form of cash transfer.
However, the large population of potential beneficiaries in low-income countries
makes nationwide cash transfer programs impracticable. For example, the WIC
program in the US required participating households to be below 180% of the US
federal poverty line. Bitler et al. (2003) reported that there were 8 million individuals,
or about 3% of the US population, enrolled in the WIC program in 2000. In East
Africa, children under 15 years old make up 50% of the total population; thus, a much
larger population would be eligible for a US-style program. Likewise, any
intervention that based participant eligibility on poverty status would also encounter a
large population of potential program recipients. As such, the few cash transfer
programs that have been implemented in some African countries remain limited to a
small scale due to the consideration of substantial costs.

39
Variable Combined1993 2003
Rural -0.051 0.141 -0.164[0.85] [1.65] [2.13]*
Log of Household Assets -0.543 -0.504 -0.571[6.66]** [3.94]** [5.09]**
Household water sources (cf: unprotected well/spring)Piped water in the dwelling -0.091 0.025 -0.136
[1.29] [0.12] [1.45]Piped water from public stand pipe -0.146 -0.184
[1.75]* [2.07]*Protected Well/Spring -0.079 -0.002 -0.118
[1.38] [0.01] [1.76]Other water sources -0.149 -0.05 -0.189
[1.37] [0.22] [1.39]Toilet facility used by the household (cf: no toilet)Flush toilet -0.116 -0.364 0.097
[0.99] [1.63] [0.69]Latrine -0.05 -0.171 0.087
[1.21] [3.03]** [1.36]Child is female -0.154 -0.143 -0.176
[5.02]** [3.03]** [4.73]**Child's birth order 0.04 0.041 0.047
[2.94]** [2.25]* [2.40]*Multiple birth 0.486 0.119 0.749
[3.60]** [0.63] [4.49]**Child's age in months 0.061 0.057 0.066
[13.44]** [7.45]** [11.16]**Child's age squared -0.001 -0.001 -0.001
[13.57]** [7.65]** [11.09]**Household size, including visitors 0.011 0.007 0.013
[1.81] [0.88] [1.46]Education attainment of the mother (cf: No education)Mother's education, some primary 0.093 0.132 0.006
[1.52] [1.83]* [0.06]Mother's education, primary school graduate -0.041 -0.022 -0.097
[0.78] [0.30] [1.27]Mother's education, some secondary -0.218 -0.24 -0.24
[2.91]** [2.42]* [2.05]*Mother's education, completed secondary school and above -0.267 -0.187 -0.367
[3.23]** [1.64] [3.17]**Mother's age at child's birth -0.02 -0.021 -0.02
[3.97]** [2.98]** [2.82]**Marital status of the mother (cf: Married monogamously)Mother never married at time of birth 0.049 0.09 0.018
[0.72] [0.96] [0.18]Mother formerly married 0.01 -0.056 0.074
[0.16] [0.67] [0.87]Mother in a polygamous Household 0.021 0.038 0.01
[0.42] [0.57] [0.14]District averages for access to health services Year/district average, any vaccination 0.817 0.085 1.106
[3.91]** [0.22] [4.84]**Year/district average, all vaccinations 0.211 0.372 0.146
[1.91] [1.90]* [1.08]Year/district average, tetanus toxoid -0.171 -0.61 -0.148
[1.05] [1.87] [0.75]Year/district average, any prenatal care 0.077 0.005 0.064
[0.42] [0.01] [0.29]Year/district average, any birth attendant -0.056 0.136 -0.261
[0.52] [0.85] [1.94]Cluster/Community average for access to health servicesCluster average, use of modern contraception -0.299 -0.375 -0.189
[3.13]** [2.85]** [1.43]Cluster average, rehydration knowledge (birth past 5 yrs) 0.141 0.216 0.104
[1.43] [1.50] [0.77]
Year dummies 0.077Year2003 [1.32]m1µ 1.303 0.155 1.36
[5.39] [0.99] [4.67]m2µ 2.08 1.28 2.14
[8.64] [2.47] [7.36]Number of Observations 9,416 4,876 4,540
Table 7: Ordered probit estimates for nutritional status in Kenya (children 0-5 years), 1993 & 2003Survey year
T-statistics in brackets * significant at 5%; ** significant at 1%

40
Combined1992 2000 2005
Rural 0.043 -0.266 0.022 0.077[0.83] [1.87]* [0.25] [1.04]
Log of Household Assets -0.511 -0.366 -0.555 -0.853[9.60]** [5.48]** [5.27]** [5.66]**
Household water sources (cf: unprotected well/spring)Piped water in the dwelling -0.05 -0.235 -0.159 -0.149
[0.76] [1.38] [1.26] [0.74]Piped water from public stand pipe -0.021 -0.45 -0.003 -0.043
[0.58] [1.71]* [0.06] [0.72]Protected Well/Spring 0.046 -0.177 0.084 0.051
[1.13] [1.03] [1.52] [0.80]Other water sources -0.186 0.175 -0.351 -0.113
[0.60] [1.00] [0.76] [0.28]Toilet facility used by the household (cf: no toilet)Flush toilet -0.377 -0.369 0.056
[1.78] [1.34] [0.19]Latrine -0.166 -0.158 -0.174
[2.13]* [1.72]* [1.34]Child is female -0.083 -0.092 -0.109 -0.035
[3.52]** [2.21]* [3.22]** [0.78]Child's birth order 0.039 0.021 0.056 0.042
[4.02]** [1.29] [3.55]** [2.34]*Multiple birth 0.641 0.915 0.702 0.386
[7.04]** [4.23]** [4.84]** [2.42]*Child's age in months 0.029 0.03 0.029 0.038
[7.13]** [3.80]** [4.97]** [4.16]**Child's age squared 0 0 0 -0.001
[5.64]** [2.76]** [3.78]** [4.02]**Household size, including visitors -0.025 -0.019 -0.044 -0.008
[3.39]** [1.49] [3.90]** [0.47]Education attainment of the mother (cf: No education)Mother's education, some primary -0.032 0.001 -0.025 -0.073
[1.23] [0.02] [0.56] [1.30]Mother's education, primary school graduate -0.06 -0.096 -0.035 -0.071
[1.85] [1.42] [0.66] [1.06]Mother's education, some secondary -0.192 -0.352 -0.216 0.028
[3.28]** [3.37]** [2.36]* [0.23]Mother's education, completed secondary school and above -0.057 -0.404 0.048 0.189
[0.63] [1.79]* [0.37] [1.11]Mother's age at child's birth -0.014 -0.007 -0.016 -0.02
[4.11]** [1.08] [3.07]** [3.46]**Marital status of the mother (cf: Married monogamously)Mother never married at time of birth 0.004 0.179 -0.002 -0.204
[0.05] [1.52] [0.02] [1.81]Mother formerly married -0.016 0.097 -0.08 -0.005
[0.43] [1.19] [1.55] [0.07]Mother in polygamous household 0.124 -0.023 0.166 0.245
[2.96]** [0.37] [2.45]* [2.91]**District averages for access to health services Year/district average, any vaccination 0.471 -0.633 0.827 2.024
[0.80] [0.67] [0.60] [2.27]*Year/district average, all vaccinations 0.911 1.042 0.899 0.758
[8.14]** [5.02]** [5.18]** [2.94]**Year/district average, tetanus toxoid -0.01 -2.128 0.277 -0.108
[0.06] [2.43]* [1.07] [0.39]Year/district average, any prenatal care -0.318 0.252 -0.115 -0.759
[1.00] [0.22] [0.28] [1.12]Year/district average, any birth attendant -0.189 -0.653 -0.344 0.169
[1.36] [2.20]* [1.30] [0.54]Cluster/Community average for access to health servicesCluster average, use of modern contraception -0.212 -0.31 0.066 -0.38
[1.48] [1.55] [0.20] [1.60]Cluster average, rehydration knowledge (birth past 5 yrs) -0.188 -0.237 -0.159 -0.195
[2.04]* [1.46] [1.14] [1.04]Year dummiesYear2000 0.017
[0.17]Year2005 0.053
[0.50]m1µ 0.484 -2.259 1.107 1.37
[0.85] [2.03]* [0.83] [1.36]m2µ 1.291 -1.419 1.849 2149
[2.27]* [1.45] [1.44] [2.18]Number of Observations 13,608 4,137 5,889 3,582
Table 8: Ordered probit estimates for nutritional status in Rwanda (children 0-5 years), 1992-2005Survey year
T-statistics in brackets * significant at 5%; ** significant at 1%

41
Combined1992 1996 2005
Rural 0.071 0.032 0.17 0.036[1.15] [0.29] [2.36]* [0.45]
Log of Household Assets -0.646 -0.597 -0.559 -0.715[10.29]** [6.11]** [3.92]** [7.41]**
Household water sources (cf: unprotected well/spring)Piped water in the dwelling -0.055 -0.504 0.826 -0.248
[1.08] [5.48]** [5.00]** [2.20]*Piped water from public stand pipe -0.063
[1.11]Protected Well/Spring -0.023 -0.412 0.796 -0.026
[0.52] [3.59]** [4.76]** [0.49]Other water sources -0.055 -0.433 0.23 -0.027
[0.46] [2.23]* [0.74] [0.16]Toilet facility used by the household (cf: no toilet)Flush toilet -0.121 -0.053 -0.1 -0.173
[0.69] [0.14] [0.31] [0.66]Latrine 0.061 0.093 0.018 0.047
[1.60] [1.48] [0.28] [0.88]Child is female -0.082 -0.114 -0.078 -0.057
[3.76]** [3.08]** [2.11]* [1.63]Child's birth order 0.012 0.02 0.006 0.009
[1.26] [1.31] [0.41] [0.62]Multiple birth 0.653 0.662 0.741 0.604
[9.36]** [5.93]** [4.66]** [5.22]**Child's age in months 0.06 0.051 0.06 0.06
[17.31]** [6.98]** [9.91]** [11.55]**Child's age squared -0.001 -0.001 -0.001 -0.001
[15.72]** [6.53]** [9.27]** [9.82]**Household size, including visitors -0.018 -0.01 -0.014 -0.027
[4.75]** [1.72]* [2.03]* [5.18]**Education attainment of the mother (cf: No education)Mother's education, some primary -0.034 0.006 -0.145 -0.001
[0.90] [0.10] [2.36]* [0.02]Mother's education, primary school graduate -0.083 -0.155 -0.105 -0.021
[2.84]** [2.75]** [2.09]* [0.39]Mother's education, some secondary -0.153 -0.264 -0.089 -0.118
[2.02]* [1.46] [0.69] [0.92]Mother's education, completed secondary school and above -0.335 -0.363 -0.542 -0.2
[3.37]** [1.88] [2.50]* [1.26]Mother's age at child's birth -0.009 -0.016 -0.006 -0.006
[2.58]* [2.66]** [1.16] [1.27]Marital status of the mother (cf: Married monogamously)Mother never married at time of birth 0.181 0.027 0.257 0.273
[3.11]** [0.28] [2.79]** [2.52]*Mother formerly married 0.103 0.015 0.143 0.16
[2.49]* [0.20] [2.10]* [2.50]*Mother in polygamous household 0.038 -0.025 0.049 0.053
[1.26] [0.47] [0.95] [1.01]District averages for access to health services Year/district average, any vaccination 0.66 0.62 0.668 0.766
[3.82]** [1.89]* [2.08]* [2.48]*Year/district average, all vaccinations 0.183 0.384 0.421 -0.135
[2.85]** [2.32]* [4.05]** [1.27]Year/district average, tetanus toxoid -0.157 -0.12 -0.852 -0.02
[1.63] [0.35] [3.49]** [0.19]Year/district average, any prenatal care -0.092 -0.455 -0.017 0.001
[1.40] [1.75]* [0.14] [0.01]Year/district average, any birth attendant -0.221 -0.068 -0.206 -0.246
[2.67]** [0.36] [1.61] [2.19]*Cluster/Community average for access to health servicesCluster average, use of modern contraception -0.148 -0.096 -0.048 -0.259
[1.37] [0.28] [0.27] [1.65]Cluster average, rehydration knowledge (birth past 5 yrs) 0.125 0.792 0.037 0.054
[1.08] [2.36]* [0.16] [0.40]Year1996 -0.102
[2.67]**Year2005 -0.098
[1.92]*m1µ 1.103 0.991 1.545 1.192
[4.11]** [2.12]* [4.06]** [3.11]**m2µ 1.896 1.848 2.369 2.106
[7.58]** [4.01]** [6.14]** [5.46]**Number of observations 17,905 6,043 5,098 6,764
Table 9: Ordered probit estimates for nutritional status Tanzania (children 0-5 years), 1992-2005Survey year
T-statistics in brackets * significant at 5%; ** significant at 1%

42
Combined1995 2000 2006
Rural 0.06 0.163 0.067 -0.072[1.05] [1.92]* [0.80] [0.50]
Log of Household Assets -0.482 -0.541 -0.419 -0.621[6.63]** [4.79]** [3.94]** [4.04]**
Household water sources (cf: unprotected well/spring)Piped water in the dwelling -0.049 -0.199 -0.06 0.393
[0.50] [1.07] [0.22] [1.67]Piped water from public stand pipe -0.012 -0.02 -0.045
[0.15] [0.18] [0.29]Protected Well/Spring -0.114 -0.253 -0.123 -0.036
[2.06]* [1.47] [1.88]* [0.38]Other water sources 0.061 0.212 -0.149 0.423
[0.40] [0.82] [0.84] [1.33]Toilet facility used by the household (cf: no toilet)Flush toilet 0.141 0.081 0.143 -0.249
[0.75] [0.37] [0.49] [0.71]Latrine 0.06 -0.014 0.139 0.035
[1.68] [0.22] [2.08]* [0.57]Child is female -0.121 -0.117 -0.115 -0.146
[5.17]** [2.89]** [3.40]** [2.82]**Child's birth order 0.053 0.044 0.06 0.073
[4.86]** [2.76]** [3.22]** [3.23]**Multiple birth 0.531 0.454 0.44 0.877
[4.76]** [2.53]* [3.02]** [3.36]**Child's age in months 0.06 0.097 0.051 0.05
[14.07]** [9.85]** [7.87]** [6.30]**Child's age squared -0.001 -0.002 -0.001 -0.001
[12.74]** [9.00]** [7.33]** [4.95]**Household size, including visitors -0.007 0.01 -0.024 -0.016
[1.21] [1.22] [2.50]* [1.26]Education attainment of the mother (cf: No education)Mother's education, some primary -0.046 -0.06 -0.074 0.055
[1.23] [1.09] [1.27] [0.65]Mother's education, primary school graduate -0.126 -0.11 -0.192 0.015
[2.97]** [1.45] [3.42]** [0.16]Mother's education, some secondary -0.065 -0.192 0.053 -0.068
[0.92] [1.77] [0.58] [0.43]Mother's education, completed secondary school and above -0.255 -0.101 -0.449 -0.193
[2.85]** [0.69] [3.29]** [0.92]Mother's age at child's birth -0.029 -0.028 -0.03 -0.033
[6.76]** [4.12]** [4.17]** [3.57]**Marital status of the mother (cf: Married monogamously)Mother never married at time of birth 0.09 0.126 -0.049 0.307
[1.01] [1.01] [0.32] [1.51]Mother formerly married 0.096 -0.005 0.178 0.138
[1.92] [0.06] [2.13]* [1.32]Mother in polygamous household 0.093 0.076 0.138 0.025
[2.57]* [1.31] [2.54]* [0.35]District averages for access to health services Year/district average, any vaccination 0.428 0.599 0.171 0.844
[2.54]* [2.06]* [0.71] [1.96]Year/district average, all vaccinations 0.216 0.075 0.292 -0.653
[1.91]* [0.35] [1.77]* [1.95]Year/district average, tetanus toxoid -0.093 -0.168 0.019 -0.321
[0.74] [0.59] [0.11] [1.54]Year/district average, any prenatal care -0.265 -0.103 -0.47 0.233
[1.55] [0.29] [1.86]* [0.98]Year/district average, any birth attendant -0.346 -0.415 -0.354 -0.137
[3.76]** [2.58]* [2.28]* [0.82]Cluster/Community average for access to health servicesCluster average, use of modern contraception -0.206 -0.099 -0.129 -0.492
[1.60] [0.35] [0.65] [2.43]*Cluster average, rehydration knowledge (birth past 5 yrs) -0.281 -0.04 -0.512 -0.397
[2.48]* [0.26] [1.77]* [1.89]*Year2000 0
[0.01]Year2006 -0.158
[2.16]*m1µ 0.053 0.707 -0.584 0.544
[0.26] [1.70] [-1.54] [1.26]m2µ 0.865 1.525 0.243 1.341
[4.20]** [3.65]** [0.64] [3.13]**Number of observations 11,648 4,497 4,908 2,243
Table 10: Ordered probit estimates for nutritional status in Uganda (children 0-5 years), 1995-2006Survey year
T-statistics in brackets * significant at 5%; ** significant at 1%
43
8.0 References
Alderman, H., H. Hoogeveen and M. Rossi. 2009. “Preschool Nutrition and Subsequent Schooling Attainment: Longitudinal Evidence from Tanzania” Economic Development and Cultural Change. Vol 57. No.2: 239-260.
Alderman, H. 2007. “Improving nutrition through community growth promotion: Longitudinal study of the nutrition and early child development Program in
Uganda” World Development Vol 35. No. 8: 1376-1389.
Alderman, H., H. Hoogenveen and M. Rossi. 2006. “Reducing Child Malnutrition in Tanzania: Combined effects of Income Growth and Program Intervention” Economics and Human Biology. Vol. 4. No.1:1-23.
Alderman, H., S.M. Appleton., L.J. Haddad et al. 2003. ”Reducing Child Malnutrition: How Far Does Income Growth Take Us? World Bank Economic Review Vol 17. No.1: 107-131 Behrman, J. R. 1993. “The economic rationale for investing in nutrition in
developing countries” World Development Vol 21. No. 11: 1749-1771. Behrman, J. R and J. Hoddinott.2005. “Programme Evaluation with Unobserved
Heterogeneity and Selective Implementation: The Mexican “PROGRESA” Impact on Child Nutrition” Oxford Bulletin of Economics and Statistics. Vol 67. No.4:547-569.
Behrman, J., H. Aldermam and J. Hoddinott. 2004. “Hunger and Malnutrition” In B. Lomborg (ed.) Global Crises, Global Solutions. Cambridge (UK): Cambridge University Press. Bhattacharya, J., J. Currie and S. Haider. 2006. “Breakfast Champions? The
Effect of the School Breakfast program on the nutrition of children and families” Journal of Human Resources Vol. 41. No.3:
Bitler, M and J. Currie. 2004. “Does WIC Work? The Effect of WIC on Pregnancy and Birth Outcomes,” Journal of Policy Analysis and Management, Vol 23. No.4: 73-91. Bitler, M., J. Currie and J. K. Scholz. 2003. “WIC Eligibility and Participation” Journal of Human Resources Vol. 38: 1139-1179. Cebu Study Team. 1991. “Underlying and proximate determinants of child health: The Cebu Longitudinal Health and Nutrition Study” American Journal of Epidemiology Vol. 133. No.2: 185-201. Central Bureau of Statistics (CBS) Kenya et al. 2004. Kenya Demographic and Health Survey 2003. Calverton, Maryland: CBS et al. Currie, J. 2008. “Nutrition and Public Policy in Advanced Economics,” in Larry Blume and Steven Durlauf (eds.) The New Palgrave Dictionary of Economics,
44
2nd Edition, (London: Macmillan). Currie, J and T. Duncan. 1995. “Does Head Start Make a Difference?” American Economic Review Vol. 85. No. 3: 341-364. Currie, J and N. Cole. 1993. "Welfare and Child Health: The Link Between AFDC Participation and Birth Weight," The American Economic Review, Vol 83 No.4: 971-985. Daponte, B. O. 2000. “Private versus Public Relief: Use of Food Pantries versus Food Stamps among poor households”. Journal of Nutrition Education. Vol 32. No.2: 72-83. Deininger, K and P. Mpuga. 2005. “Economic and Welfare Impact of the Abolition of Health User Fees: Evidence from Uganda” Journal of African Economies Vol 14. No. 1: 55-91 Deolalikar, A. B.1996. “Child nutrition status and growth in Kenya: socioeconomic determinants”. Journal of International Development Vol. 8. No.3: 375-393. Devaney, B., L. Bilheimer and J. Schore. 1992. “Medicaid Costs and Birth Outcomes: The Effects of Prenatal WIC Participation and the Use of Prenatal Care.” Journal of Policy Analysis and Management 11(4):573-92. Filmer, D and L. Pritchett. 2000. “Estimating Wealth Effects without Expenditure
Data-or Tears: An application of Educational Enrolment in States in India” Mimeo. The World Bank, Washington DC.
Gertler, P. 2004. “Do Conditional Cash Transfer Improve Child Health? Evidence from PROGRESA’s Control Randomized Experiment” The American Economic Review. Vol. 94. No.2: Papers and Proceeding of the one Hundred Sixteenth Annual Meeting of the American Economic Association San Diego, CA. January 3-5,2004 (May,2004): 336-341. Gewa C.A. 2009. “Childhood overweight and obesity among Kenyan pre-school children: association with maternal and early child nutritional factors”. Public Health Nutrition Journal. Nov 5:1-8. Government of Kenya. 2008. Reversing the Trends: The Second National Health Sector Strategic Plan of Kenya—Annual Operational Plan Report: July 2007- June 2008. Nairobi. Ministry of Public Health and Sanitation. Government of Uganda. 2008. Annual Health Sector Performance Report 2007-08.
Ministry of Health. Kampala _______. 2007a. The Uganda National Household Survey 2005/2006, Report on the
Socio-economic Survey. Uganda Bureau of Statistics, Kampala. _______. 2005a. Health Sector Strategic Plan II, 2005/6-2009/10. Ministry of Health.

45
_______. 2005b. Annual Health sector performance Report, 2004/5. Ministry of Health, Kampala.
_______. 2005c. 2002 Uganda Population and Housing Census. Uganda Bureau of
Statistics, Entebbe. _______.1999. Health Sector Strategic Plan I-1999-2003. Ministry of Health,
Kampala. _______.1997. Poverty Eradication Action Plan. Ministry of Finance Planning and
Economic Development, Kampala. Horton, S., H. Alderman and J. A. Rivera. 2008. “Hunger and Malnutrition” Copenhagen Consensus 2008 Challenge Paper. International Monetary Fund. 2009. World Economic Outlook Database, October
2009. _______. 2008. “Rwanda: Poverty Reduction Strategy Paper: Economic Development
and Poverty Reduction Strategy, 2008-2012”. IMF Country Report No. 08/90. ______. 2005. “Kenya: Poverty Reduction Strategy Paper” IMF Country Report No. 05/11. http://www.imf.org/external/pubs/ft/scr/2005/cr0511.pdf Institut National de la Statitique du Rwanda (INSR) and ORC Macro. 2006. Rwanda Demographic and Health Survey 2005. Calverton, Maryland. USA: INSR and ORC Macro. Kabubo-Mariara, J et al. 2009. “Determinants of Children’s Nutritional Status in
Kenya: Evidence from Demographics and Health Surveys” Journal of African Economies Vol 18. No. 3: 363-387.
Kakwani, N., F.V. Soares and H. H. Son. 2005. “Conditional Cash Transfers in African Countries” International Poverty Centre Working Paper No.9. Kappel, R., J. Lay and S. Steiner. 2005. “Uganda: No more Pro-Poor Growth?” Development Policy Review Vol. 23. No.1:27-53. Keller, W. 1983. “Choices of indicators of nutritional status. Evaluation of nutrition in third world communities” Nestle Foundation Publication Series (Bern: H. Huber) Vol 3: 101-113. Kuczmarski, R. J et al. 2002. 2000 CDC growth charts for the United States: methods and development. National Center for Health Statistics. Vital Health Stat 11(246). Lawson, D. and S. Appleton. 2007. “Child Health in Uganda-Policy Determinants and Measurements” European Journal of Development Research. Vol 2. No. 2: 191-204.

46
MacKinnon, J. 1995. “Health as an information Good: The Determinants of Child Nutrition and Mortality during political and Economic Recovery in Uganda” Centre of Study of African Economies Working Paper No. 95-9.
Madise, N. J., Z. Mathews and B. Margetts. 1999. “Heterogeneity of child nutrition
status between households: A comparison of six sub-Saharan African countries” Population Studies Vol 53. No.3: 331-343.
Martorell, R. and J. P. Habicht. 1986. “Growth in Early Childhood in Developing Countries,” in F. Falkner and J. Tanner (eds), Human Growth: A Comprehensive Treatise, Vol. 3, Plenum Press, New York. Ministry of Health (Uganda) and ORC Macro. 2006. Uganda HIV/AIDS Sero
Behavior Survey 2004-2005. Calverton, Maryland, USA: Ministry of Health and ORC Macro.
Mosley, W. H and L. C. Chen. 1984. “An analytic framework for the study of child survival in developing countries” Population and Development Review. Vol 10:25-45. Pal, S. 1999. “An Analysis of Childhood Malnutrition in Rural India: Role of Gender,
Incomes and Other Household Characteristics” World Development Vo. 27. No.7:1151-1171.
Sahn, D. E and D.C. Stifle. 2003. “Exploring Alternative Measures of Welfare in the
Absence of Expenditure Data” Review of Income and Wealth, Vol. 14. No. 4: 463-489.
Schubert, B and R. Slater. 2006. “Social Cash Transfers in Low Income African Countries: Conditional or Unconditional?” Development Policy Review Vol 5: 571-578.
Ssewanyana, S.N. 2003. “Food Security and Child Nutrition Status among Urban Poor Households in Uganda: Implications for Poverty Alleviation”. African
Economic Research Consortium, Research Paper 130.
Ssewanyana, S and S. Younger. 2008. “Infant Mortality in Uganda: Determinants, Trends and the Millennium Development Goals” Journal African Economies. Vol. 17, No. 1:34-61.
Ssewanyana.S, S.D. Younger, and I. Kasirye. 2006. “Strengthening the Understanding of the dynamics of Poverty in Northern Uganda” A research Report by the Economic Policy Research Centre submitted to the World Bank Uganda Country Office. Ssewanyana, S., J.O. Nabyonga., I. Kasirye et al. 2004. “Demand for Health Care Services in Uganda: Implications for Poverty Reduction” Economic Policy Research Centre (EPRC) Research Series No. 40. Strauss, J. 1986. “Does better nutrition raise farm productivity?’ Journal of Political
47
Economy, Vol. 94:297-320. Tanzania Council for AIDS (TACAIDS) et al. 2008. Tanzania HIV/AIDS and Malaria Indicator Survey 2007-08. Dar-es-salaam. Tanzania: TACAIDS et al. UBOS and Macro International Inc. 2007. Uganda Demographic and Health
Survey 2006 Calverton, Maryland: UBOS and Macro International Inc. United Nations. 2009. The Millennium Development Goals Report 2009. New York.
The United Nations.
UNICEF. 2009. Tracking Progress on Child and Maternal Nutrition: A survival and development priority. New York, UNICEF. _____. 2008. The State of the World’s Children 2009: Maternal and Newborn Health. New York, UNICEF. United Nations Development Program. 2009. Human Development Report 2009: Overcoming barriers: Human mobility and development. New York, UNDP. United Republic of Tanzania. 2000. “The poverty Reduction Strategy Paper”
Prepared by Tanzanian Authorities. http://www.imf.org/external/NP/prsp/2000/tza/02/
World Bank. 2009. World Development Indicators 2009. World Health Organisation. 1995. “An Evaluation of Infant Growth: The Use and Interpretation of Anthropometry in Infants,” Bulletin of the World Health Organization, 73, 165–74. ______. 1983. Measuring Change in Nutritional Status: Guidelines for Assessing the Nutritional Impact of Supplementary Feeding Programmes for Vulnerable
Groups, WHO, Geneva.
Zivin, J. G., H. Thirumurthy and M. Goldstein. 2009. “AIDS treatment and Intrahousehold resource allocation: Children’s nutrition and schooling in Kenya” Journal of Public Economics Vol. 93. No. 7-8:1008-1015.